To appear in Journal of Dynamic Systems, …a) Schematic diagram of the experimental apparatus (b)...
7
PROOF COPY [DS-17-1506] Analysis of Filtered Thermal-Fluid 1 Video Data From Downward Facing 2 Boiling Experiments * 3 Chi-Shih Jao 4 Department of Electrical Engineering, 5 Pennsylvania State University, 6 University Park, PA 16802 7 e-mail: [email protected] 8 Faith R. Beck 9 Department of Mechanical and Nuclear Engineering, 10 Pennsylvania State University, 11 University Park, PA 16802 12 e-mail: [email protected] 13 Nurali Virani 14 General Electric Global Research Center, 15 Niskayuna, NY 12309 16 e-mail: [email protected] 17 Fan-Bill Cheung 18 Fellow ASME 19 Department of Mechanical and 20 Nuclear Engineering, 21 Pennsylvania State University, 22 University Park, PA 16802 23 e-mail: [email protected] 24 Asok Ray 1 25 Fellow ASME 26 Department of Mechanical and 27 Nuclear Engineering, 28 Pennsylvania State University, 29 University Park, PA 16802 30 e-mail: [email protected] 31 32 During severe accidents in a nuclear power plant, in-vessel cool- 33 ing may be required to mitigate the risk of vessel failure in the 34 event of core meltdown and subsequent corium contamination. 35 This cooling technique, known as in-vessel retention (IVR), entails 36 flooding the reactor cavity with water. If the temperatures are 37 sufficiently high, IVR may cause downward facing boiling (DFB) 38 on the outer surface of the reactor pressure vessel (RPV), which 39 gives rise to two-phase thermal-hydraulic phenomena. The 40 regimes in DFB may range from film boiling to nucleate boiling, 41 where the efficiency of cooling varies immensely between these 42 two. In the DFB geometry under consideration (i.e., a hemispheri- 43 cal vessel), the collected signals/images are heavily contaminated 44 by unavoidable noise and spurious disturbances, which hinder the 45 extraction of pertinent information, such as film thickness and the 46 boiling cycle. This paper proposes a wavelet-based filtering of 47 sensor measurements for denoising of the nonstationary signals 48 with the future objective of estimating the thickness of vapor 49 films in real time, as needed for process monitoring and control. 50 The proposed concept has been validated with experimental data 51 recorded from a pool boiling apparatus for physics-based under- 52 standing of the associated phenomena. [DOI: 10.1115/1.4039470] Keywords: nuclear plant safety, video data, filtering 53 54 55 1 Introduction 56 Nuclear power plants are a source of safe and consistent energy 57 under well-controlled operating conditions. Nevertheless, radia- 58 tion protection is one of the biggest concerns in the design and 59 maintenance of nuclear power plants. This is realized through 60 multiple layers of protection (e.g., holding of fission gases by the 61 fuel pellets themselves and cladding around the fuel rods) for 62 safekeeping of the radioactive materials. All of these layers are 63 housed inside the reactor pressure vessel (RPV), which is retained 64 inside a containment building. During a severe accident, fuel pel- 65 lets rupture and the fuel rod cladding melts, which can cause the 66 meltdown of the reactor core, with molten corium relocating 67 downward into the bottom head of the RPV. In order to contain 68 the radioactive molten corium within the reactor, the reactor cav- 69 ity is flooded with coolant to submerge the entire RPV. This 70 method, also known as in-vessel retention (IVR) through external 71 reactor vessel cooling allows removal of the decay heat from the 72 molten corium through the vessel wall by downward facing boil- 73 ing (DFB) on the outer surface of the vessel. During such acci- 74 dents, it is crucial to maintain the integrity of the lower head of 75 the RPV to achieve IVR, thus mitigating the risk of containment 76 failure [1–3]. 77 Efficient heat transfer during DFB on the RPV in an accident 78 scenario is of critical importance, because the structural integrity 79 of the vessel depends on the ability to transfer heat to the coolant. 80 While there are different boiling regimes associated with down- 81 ward facing surfaces, the two most significant are film and nucle- 82 ate boiling. In film boiling, the heat transfer coefficient is much 83 smaller than that in nucleate boiling. As such, the vapor film acts 84 as an insulating surface from which heat transfer cannot take place 85 efficiently [4,5]. When the film is broken under nucleate boiling 86 after achieving the critical heat flux, thermal energy can be dissi- 87 pated much faster since liquid is able to make direct contact with 88 the heated surface. The regime change from film to nucleate boil- 89 ing is of much importance because, if left too long under film boil- 90 ing, the structural integrity of RPV may be compromised, 91 resulting in possible corium contamination. 92 A scaled version of the RPV-quenching experiment has been 93 performed on the subscale boundary layer boiling facility at Penn- 94 sylvania State University, as seen in Fig. 1(a). At this facility, the 95 act of drowning the downward-facing hemisphere in a pool of 96 water causes low-frequency vibration as the vessel rocks back and 97 forth atop a support structure, which is positioned above the cylin- 98 drical vessel. This rocking motion of the vessel contaminates the 99 acquired signals and the resulting low frequency vibration is 100 referred to as the “inherent artifact” (IA) signal in the remainder 101 of this paper. This externally imposed signal is not part of the 102 actual, physical process induced by DFB, and so it must be 103 removed. The original one-dimensional two-phase vapor film sig- 104 nals, extracted from the high-speed video images, are corrupted 105 by the IA signal, as discussed in detail in Sec. 2. Therefore, noise 106 filtering is essential for accurately extracting the signal. The data 107 collected from these experiments have been analyzed to under- 108 stand the physics involved in such nontraditional flow geometries. 109 For signal conditioning that includes denoising, the acquired 110 raw data are decomposed into three parts: (1) the vapor film sig- 111 nal, (2) the IA signal, (3) and any additive noise. A common prop- 112 erty of the vapor film and IA signals is that they are both 113 nonstationary; therefore, a Fourier transform (FT) or a windowed 114 Fourier transform (WFT) may not be appropriate for analyzing 115 these signals. This is so because FT merely generates average fre- 116 quency information, instead of time-dependent local frequency 117 characteristics, and WFT uses a fixed short-length window to find 118 the local frequency of a signal. For a WFT, the window size may 1 Corresponding author. Contributed by the Dynamic Systems Division of ASME for publication in the JOURNAL OF DYNAMIC SYSTEMS,MEASUREMENT, AND CONTROL. Manuscript received October 5, 2017; final manuscript received February 16, 2018; published online xx xx, xxxx. Assoc. Editor: Sergey Nersesov. J_ID: DS DOI: 10.1115/1.4039470 Date: 3-March-18 Stage: Page: 1 Total Pages: 8 ID: asme3b2server Time: 17:41 I Path: //chenas03.cadmus.com/Cenpro/ApplicationFiles/Journals/ASME/DS##/Vol00000/180042/Comp/APPFile/AS-DS##180042 Journal of Dynamic Systems, Measurement, and Control MONTH 2018, Vol. 00 / 000000-1 Copyright V C 2018 by ASME
Transcript of To appear in Journal of Dynamic Systems, …a) Schematic diagram of the experimental apparatus (b)...

PROOF COPY [DS-17-1506]
Analysis of Filtered Thermal-Fluid
1 Video Data From Downward Facing
2Boiling Experiments*
3 Chi-Shih Jao4 Department of Electrical Engineering,5 Pennsylvania State University,6 University Park, PA 168027 e-mail: [email protected]
8 Faith R. Beck9 Department of Mechanical and Nuclear Engineering,
10 Pennsylvania State University,11 University Park, PA 1680212 e-mail: [email protected]
13 Nurali Virani14 General Electric Global Research Center,15 Niskayuna, NY 1230916 e-mail: [email protected]
17 Fan-Bill Cheung18 Fellow ASME19 Department of Mechanical and20 Nuclear Engineering,21 Pennsylvania State University,22 University Park, PA 1680223 e-mail: [email protected]
24 Asok Ray1
25 Fellow ASME26 Department of Mechanical and27 Nuclear Engineering,28 Pennsylvania State University,29 University Park, PA 1680230 e-mail: [email protected]
32 During severe accidents in a nuclear power plant, in-vessel cool-33 ing may be required to mitigate the risk of vessel failure in the34 event of core meltdown and subsequent corium contamination.35 This cooling technique, known as in-vessel retention (IVR), entails36 flooding the reactor cavity with water. If the temperatures are37 sufficiently high, IVR may cause downward facing boiling (DFB)38 on the outer surface of the reactor pressure vessel (RPV), which39 gives rise to two-phase thermal-hydraulic phenomena. The40 regimes in DFB may range from film boiling to nucleate boiling,41 where the efficiency of cooling varies immensely between these42 two. In the DFB geometry under consideration (i.e., a hemispheri-43 cal vessel), the collected signals/images are heavily contaminated44 by unavoidable noise and spurious disturbances, which hinder the45 extraction of pertinent information, such as film thickness and the46 boiling cycle. This paper proposes a wavelet-based filtering of47 sensor measurements for denoising of the nonstationary signals48 with the future objective of estimating the thickness of vapor49 films in real time, as needed for process monitoring and control.50 The proposed concept has been validated with experimental data
51recorded from a pool boiling apparatus for physics-based under-52standing of the associated phenomena. [DOI: 10.1115/1.4039470]
Keywords: nuclear plant safety, video data, filtering5354
551 Introduction
56Nuclear power plants are a source of safe and consistent energy57under well-controlled operating conditions. Nevertheless, radia-58tion protection is one of the biggest concerns in the design and59maintenance of nuclear power plants. This is realized through60multiple layers of protection (e.g., holding of fission gases by the61fuel pellets themselves and cladding around the fuel rods) for62safekeeping of the radioactive materials. All of these layers are63housed inside the reactor pressure vessel (RPV), which is retained64inside a containment building. During a severe accident, fuel pel-65lets rupture and the fuel rod cladding melts, which can cause the66meltdown of the reactor core, with molten corium relocating67downward into the bottom head of the RPV. In order to contain68the radioactive molten corium within the reactor, the reactor cav-69ity is flooded with coolant to submerge the entire RPV. This70method, also known as in-vessel retention (IVR) through external71reactor vessel cooling allows removal of the decay heat from the72molten corium through the vessel wall by downward facing boil-73ing (DFB) on the outer surface of the vessel. During such acci-74dents, it is crucial to maintain the integrity of the lower head of75the RPV to achieve IVR, thus mitigating the risk of containment76failure [1–3].77Efficient heat transfer during DFB on the RPV in an accident78scenario is of critical importance, because the structural integrity79of the vessel depends on the ability to transfer heat to the coolant.80While there are different boiling regimes associated with down-81ward facing surfaces, the two most significant are film and nucle-82ate boiling. In film boiling, the heat transfer coefficient is much83smaller than that in nucleate boiling. As such, the vapor film acts84as an insulating surface from which heat transfer cannot take place85efficiently [4,5]. When the film is broken under nucleate boiling86after achieving the critical heat flux, thermal energy can be dissi-87pated much faster since liquid is able to make direct contact with88the heated surface. The regime change from film to nucleate boil-89ing is of much importance because, if left too long under film boil-90ing, the structural integrity of RPV may be compromised,91resulting in possible corium contamination.92A scaled version of the RPV-quenching experiment has been93performed on the subscale boundary layer boiling facility at Penn-94sylvania State University, as seen in Fig. 1(a). At this facility, the95act of drowning the downward-facing hemisphere in a pool of96water causes low-frequency vibration as the vessel rocks back and97forth atop a support structure, which is positioned above the cylin-98drical vessel. This rocking motion of the vessel contaminates the99acquired signals and the resulting low frequency vibration is
100referred to as the “inherent artifact” (IA) signal in the remainder101of this paper. This externally imposed signal is not part of the102actual, physical process induced by DFB, and so it must be103removed. The original one-dimensional two-phase vapor film sig-104nals, extracted from the high-speed video images, are corrupted105by the IA signal, as discussed in detail in Sec. 2. Therefore, noise106filtering is essential for accurately extracting the signal. The data107collected from these experiments have been analyzed to under-108stand the physics involved in such nontraditional flow geometries.109For signal conditioning that includes denoising, the acquired110raw data are decomposed into three parts: (1) the vapor film sig-111nal, (2) the IA signal, (3) and any additive noise. A common prop-112erty of the vapor film and IA signals is that they are both113nonstationary; therefore, a Fourier transform (FT) or a windowed114Fourier transform (WFT) may not be appropriate for analyzing115these signals. This is so because FT merely generates average fre-116quency information, instead of time-dependent local frequency117characteristics, and WFT uses a fixed short-length window to find118the local frequency of a signal. For a WFT, the window size may
1Corresponding author.Contributed by the Dynamic Systems Division of ASME for publication in the
JOURNAL OF DYNAMIC SYSTEMS, MEASUREMENT, AND CONTROL. Manuscript receivedOctober 5, 2017; final manuscript received February 16, 2018; published online xxxx, xxxx. Assoc. Editor: Sergey Nersesov.
J_ID: DS DOI: 10.1115/1.4039470 Date: 3-March-18 Stage: Page: 1 Total Pages: 8
ID: asme3b2server Time: 17:41 I Path: //chenas03.cadmus.com/Cenpro/ApplicationFiles/Journals/ASME/DS##/Vol00000/180042/Comp/APPFile/AS-DS##180042
Journal of Dynamic Systems, Measurement, and Control MONTH 2018, Vol. 00 / 000000-1Copyright VC 2018 by ASME
PROOF COPY [DS-17-1506]
119 not be flexible, and therefore WFT also has not been used to ana-120 lyze the vapor film and IA signals. Unlike FT and WFT, wavelet121 analysis transforms a signal from the time domain to a scaled122 domain with a scalable mother wavelet [6], permitting the signal123 to be decomposed into localized oscillating components. Hence,124 wavelet analysis is an ideal tool for analyzing the nonstationary125 two-phase vapor-film signals. In general, wavelet transforms have126 been widely used in the field of signal denoising because every127 empirical wavelet coefficient contributes noise of variance, but128 only very few wavelet coefficients contribute to the actual signal.129 Recently, researchers have started to apply wavelet analysis in130 the field of two-phase flow. For example, De Kerpel et al. [7] used131 wavelet variance values to generate feature spaces for two-phase132 flow regimes in a horizontal tube. Additionally, Euh et al. [8] used133 wavelet analysis for two-phase flow pattern identification by134 determining the void fraction from a multichannel impedance135 void meter in vertical-upward air–water flow. To the best of our136 knowledge, no one has used wavelet analysis for the purpose of137 filtering two-phase, thermal-hydraulic signals. From these per-138 spectives, the major contributions of this paper are as follows:
(1) identification of a critical parameter (i.e., the IA frequency)139 that largely determines the thermal-hydraulic dynamics140 during pool boiling;
(2) wavelet-based denoising of two-phase thermal-fluid signals141 generated by DFB;
(3) experimental Validation of the above items on a laboratory-142 scale apparatus.
143 This paper is organized into the following sections: Sec. 2144 addresses acquisition and preprocessing of experimental data;145 Sec. 3 discusses the experimental results; Sec. 4 summarizes and146 concludes the paper with recommendations for future research.
147 2 Data Acquisition and Preprocessing
148 This section addresses the preprocessing of high-speed video149 data acquired from an experimental apparatus to capture the150 underlying physics of pool boiling.
151 2.1 Description of the Experimental Apparatus. In the152 experimental part of this work, a downward-facing hemisphere153 has been heated and quenched in water and high-speed images are154 recorded at 650 frames per second (fps) and are processed to155 determine vapor formation. The vapor edge is then detected and
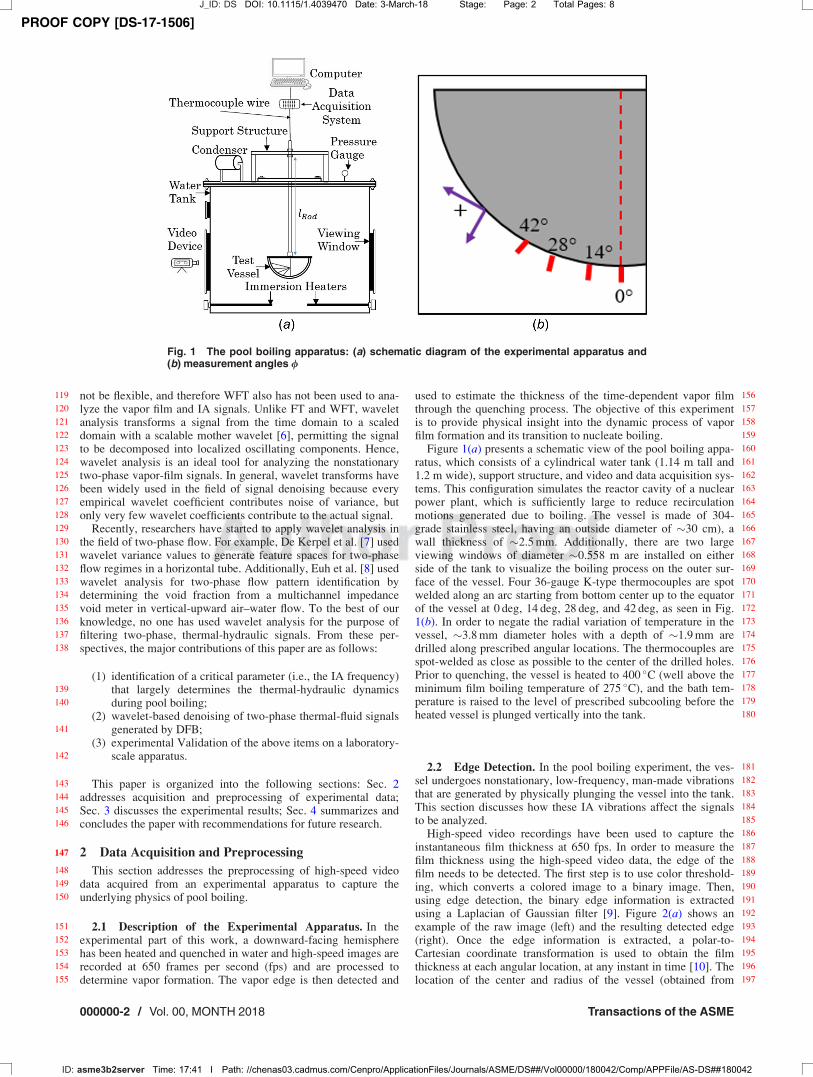
156used to estimate the thickness of the time-dependent vapor film157through the quenching process. The objective of this experiment158is to provide physical insight into the dynamic process of vapor159film formation and its transition to nucleate boiling.160Figure 1(a) presents a schematic view of the pool boiling appa-161ratus, which consists of a cylindrical water tank (1.14 m tall and1621.2 m wide), support structure, and video and data acquisition sys-163tems. This configuration simulates the reactor cavity of a nuclear164power plant, which is sufficiently large to reduce recirculation165motions generated due to boiling. The vessel is made of 304-166grade stainless steel, having an outside diameter of �30 cm), a167wall thickness of �2.5 mm. Additionally, there are two large168viewing windows of diameter �0.558 m are installed on either169side of the tank to visualize the boiling process on the outer sur-170face of the vessel. Four 36-gauge K-type thermocouples are spot171welded along an arc starting from bottom center up to the equator172of the vessel at 0 deg, 14 deg, 28 deg, and 42 deg, as seen in Fig.1731(b). In order to negate the radial variation of temperature in the174vessel, �3.8 mm diameter holes with a depth of �1.9 mm are175drilled along prescribed angular locations. The thermocouples are176spot-welded as close as possible to the center of the drilled holes.177Prior to quenching, the vessel is heated to 400 �C (well above the178minimum film boiling temperature of 275 �C), and the bath tem-179perature is raised to the level of prescribed subcooling before the180heated vessel is plunged vertically into the tank.
1812.2 Edge Detection. In the pool boiling experiment, the ves-182sel undergoes nonstationary, low-frequency, man-made vibrations183that are generated by physically plunging the vessel into the tank.184This section discusses how these IA vibrations affect the signals185to be analyzed.186High-speed video recordings have been used to capture the187instantaneous film thickness at 650 fps. In order to measure the188film thickness using the high-speed video data, the edge of the189film needs to be detected. The first step is to use color threshold-190ing, which converts a colored image to a binary image. Then,191using edge detection, the binary edge information is extracted192using a Laplacian of Gaussian filter [9]. Figure 2(a) shows an193example of the raw image (left) and the resulting detected edge194(right). Once the edge information is extracted, a polar-to-195Cartesian coordinate transformation is used to obtain the film196thickness at each angular location, at any instant in time [10]. The197location of the center and radius of the vessel (obtained from
Fig. 1 The pool boiling apparatus: (a) schematic diagram of the experimental apparatus and(b) measurement angles /
J_ID: DS DOI: 10.1115/1.4039470 Date: 3-March-18 Stage: Page: 2 Total Pages: 8
ID: asme3b2server Time: 17:41 I Path: //chenas03.cadmus.com/Cenpro/ApplicationFiles/Journals/ASME/DS##/Vol00000/180042/Comp/APPFile/AS-DS##180042
000000-2 / Vol. 00, MONTH 2018 Transactions of the ASME

PROOF COPY [DS-17-1506]
198 a vessel without any film) are used for the coordinate199 transformations.
200 2.3 Conversion of Two-Dimensional Image to One-201 Dimensional Signal. After the vapor film edge is detected, the202 film thickness is extracted from the image sequence. The resulting203 data are converted from cylindrical to Cartesian coordinates to204 compute the distance between the vapor film edge and the surface205 of the vessel at a particular angle; this distance is referred to as the206 vapor film thickness. For the analysis, the vessel is assumed to207 remain fixed at one particular location, and hence, the effects of208 IA are not yet removed. To precisely calculate the vapor film209 thickness at a given angle, several geometric parameters are intro-210 duced, as listed in the Nomenclature section.211 The radius R and the offset parameters, xoff and yoff, are meas-212 ured from a circle that is fit to a vessel image, devoid of vapor213 bubbles or film. The measurement angle /, having values of214 0 deg, 14 deg, 28 deg, and 42 deg, represents the desired angle of215 film thickness extraction. The position (xim, yim) is directly taken216 from the extracted vapor film edge. The parameter h is used for217 convenience to calculate the measurement angle / and has a218 90 deg angle difference with / (i.e., /¼ h� 90 deg). The parame-219 ters h and d are derived from Fig. 2(b) as described below.220 The expression for (Rþd) is
ðRþ dÞ ¼ ðRþ dÞcosðhÞi þ ðRþ dÞsinðhÞj (1)
221222 The vector starting from origin (1, 1) to the center of the vessel223 (xoff, yoff) is
ðxoff � 1Þi � ðyoff � 1Þj (2)
224225 and the vector from origin to (xim, yim) is
ðxim � 1Þi � ðyim � 1Þj (3)
226227 By vector addition, as shown in Fig. 2(b), the summation of Eqs.228 (2) and (3) yields
½ðRþ dÞcosðhÞi þ ðRþ dÞsinðhÞj� þ ½ðxoff � 1Þi � ðyoff � 1Þj�¼ ðxim � 1Þi � ðyim � 1Þj (4)
229230where Eq. (4) is decomposed into the i and j directions as
i : ðRþ dÞcosðhÞ þ ðxoff � 1Þ ¼ ðxim � 1Þ (5)
j : ðRþ dÞsinðhÞ þ ðyoff � 1Þ ¼ �ðyim � 1Þ (6)
231232A closed form of d is obtained from Eqs. (5) and (6) as
ððRþdÞcosðhÞÞ2þððRþdÞsinðhÞÞ2¼ðxim�xoffÞ2þðyim� yoffÞ2
(7)
d ¼ffiffiffiffiffiffiffiffiffiffiffiffiffiffiffiffiffiffiffiffiffiffiffiffiffiffiffiffiffiffiffiffiffiffiffiffiffiffiffiffiffiffiffiffiffiffiffiffiffiffiffiffiffiffiðxim � xoffÞ2 þ ðyim � yoffÞ2
q� R (8)
233234It is noted that, in the above equations, xim and yim may vary with235time, while the other geometric parameters remain constant; there-236fore, the parameter d is expressed as d(t).237An expression for h is obtained by using the information from238both i and j coordinates
sin hð Þ ¼ �yim þ yoff
Rþ dð Þ and cos hð Þ ¼ xim � xoff
Rþ dð Þ (9)
sin hð Þcos hð Þ
¼ �yim þ yoff
xim � xoff
(10)
239240A closed-form expression for h is as follows:
h ¼ tan�1�yim þ yoff
xim � xoff
(11)
241242Here, h is treated as a constant while extracting the signal at243a particular angle. In order to precisely determine d, the244parameter h is first calculated with respect to different values of245xim and yim.
Fig. 2 (a) Raw and detected edge images, (b) geometry of the vessel for vapor film extraction,and (c) schematic of IA vibration
J_ID: DS DOI: 10.1115/1.4039470 Date: 3-March-18 Stage: Page: 3 Total Pages: 8
ID: asme3b2server Time: 17:41 I Path: //chenas03.cadmus.com/Cenpro/ApplicationFiles/Journals/ASME/DS##/Vol00000/180042/Comp/APPFile/AS-DS##180042
Journal of Dynamic Systems, Measurement, and Control MONTH 2018, Vol. 00 / 000000-3

PROOF COPY [DS-17-1506]
246 Next, a point (xim, yim) is chosen on the detected edge in247 Fig. 2(b) such that Eq. (11) yields the desired h based on the mea-248 surement angle /. For example, to extract the signal at249 /¼ 14 deg, the desired h is set to be 14 degþ 90 deg¼ 104 deg.250 Then, the chosen pair (xim, yim) is used in Eq. (8) to calculate d.
251 2.4 Construction of the Inherent Artifact Signal. It appears252 from the recorded video data that the IA vibrations behave as253 pendulum-like oscillations, as displayed in Fig. 2(c). Therefore,254 the IA frequency would have a larger impact on the signals than255 those that are extracted at higher angles a. The IA vibrations sig-256 nificantly affect xoff and yoff, such that it is incorrect to assume257 that they are constants; hence, the values of xoff and yoff must vary258 with time in the presence of IA signals. These variations directly259 affect the computation of h and d. Contamination of d can be260 removed, in spite of the altered signal amplitude, by using signal261 processing tools (see Fig. 2(c)).
262 2.5 Wavelet Analysis of Thermal-Fluid Signals. The col-263 lected two-phase signal f is decomposed into three components as
f ¼ fIA þ fB þ fN (12)
264265 where fIA is the (nonstationary) IA signal, fB is the (nonstationary)266 vapor film signal, and fN is the additive noise.267 This paper uses multiresolution analysis (MRA) [6] to denoise268 the two-phase signal in the following steps:
(1) choice of an appropriate mother wavelet;(2) decomposition of the signal into different scale levels;(3) detection of wavelet coefficients from the scale levels that
269 have higher signal-to-noise-ratios;(4) reconstruction of the desired “denoised” signal from the
270 selected wavelet coefficients.
271 3 Experimental Results and Discussion
272 This section presents and discusses the results of analysis.273 While edge detection and signal extraction are described in Secs.274 2.1 and 2.2, respectively, the following paragraphs describe the275 two-phase signals and their analyses.276 Figure 3 displays typical profiles of two-phase thermal-277 hydraulic signals at /¼ 0 deg, 14 deg, 28 deg, and 42 deg, respec-278 tively, for the liquid bath temperature of 97 �C. These signals are279 extracted with constant values, xoff and yoff, of the offset coordi-280 nate positions. The data sets in Fig. 3 include the IA signal and an281 unknown additive noise. Two important observations from these282 signals are discussed below.283 First, from each plot in Fig. 3, the behavior of the signals before284 and after �9.2 s is quite different. The rationale is that, in the first285 �9.2 s, the temperature of the vessel is still well above the mini-286 mum film boiling temperature. As the temperature of the vessel287 wall decreases (due to quenching), the vapor film is in the process288 of transitioning from film to nucleate boiling. This transition289 causes a rise in the local film thickness, which is attributed to the290 quench progression on the downward facing hemisphere.291 Second, it is observed that in the first �9.2 s there is a low-292 frequency signal, the amplitude of which changes with the angular293 position /. This low-frequency signal is most clearly observable294 at /¼ 42 deg and is barely detectable at /¼ 0 deg. Since the IA295 signal results in pendulum-like oscillations, it would have a larger296 impact on the signals at higher angles, which leads to the conclu-297 sion that the low-frequency disturbances are caused primarily by298 this phenomenon. In fact, the IA frequency exists throughout the299 entire signal, but the vapor film becomes thicker at the critical300 time of� 9.2 s, and so the effects of this vibration are less noticea-301 ble in the signal at later times.
302 3.1 Identification of the Inherent Artifact Signal. Due to303 the nature of the IA frequency and the geometry of the vessel, the
304effects of this vibration are more noticeable at higher angles.305Therefore, wavelet coefficients are chosen so that they decrease in306intensity proportional to the angular location. It is seen in Fig. 3307that the IA signals are most dominant in the first �9.2 of the col-308lected signal at /¼ 42 deg. Then, the MRA with a wavelet basis309of db45 is used to analyze the first �9.2 s (�6000 frames) of the310collected signals. The results are shown in Fig. 4, where the scales311are dyadic, i.e., a sequence in powers of 2.312In Fig. 4, the wavelet coefficients corresponding to scales of313256 and 512 have larger intensities than other scales. The inten-314sities of these two scales monotonically decrease at lower angles315of /¼ 28 deg, 14 deg, and 0 deg in Fig. 4. It is concluded that the316coefficients of the db45 wavelet corresponding to the scales of317256 and 512 directly correlate with the IA signal.318The extracted IA signal has units of mm, but the IA vibration is319a pendulum-like oscillation. To find out how the IA vibration gen-320erates an angle a, an adaptive method is used as follows:
(1) Choice of an initial negative value for b.(2) Dynamical modeling of the offset coordinates xoff and yoff
321with respect to the IA signal as
Fig. 3 Profiles of vapor film thickness estimation at 97 �C bathtemperature. The thick “red” AQ8vertical lines indicate the timeepoch (i.e., 9.2 s) at which the signal behavior changessignificantly.
J_ID: DS DOI: 10.1115/1.4039470 Date: 3-March-18 Stage: Page: 4 Total Pages: 8
ID: asme3b2server Time: 17:41 I Path: //chenas03.cadmus.com/Cenpro/ApplicationFiles/Journals/ASME/DS##/Vol00000/180042/Comp/APPFile/AS-DS##180042
000000-4 / Vol. 00, MONTH 2018 Transactions of the ASME

PROOF COPY [DS-17-1506]
xoff ¼ xoff þ lRod sinðbfIAÞ (13)
yoff ¼ yoff þ lRodð1� cosðbfIAÞÞ (14)
322 and repeating the signal extraction process as described in Sec. 2.(3) Usage of MRA to decompose the latest collected two-phase
323 signals, and selection of wavelet coefficients corresponding324 to the scales that have higher intensities than other scales to325 construct an updated IA signal fIAupdated.
(4) Updating b based on the updated IA signal as
b updateðbþ l maxðfIAupdatedÞÞ (15)
326 where l is the step size (set to 0.001).(5) Repeating step (2) until intensity of IA signal is minimized.
327 Once the dominant portion of the IA signal is identified and b is328 determined, the dynamical angle a can be obtained via a¼ bfIA,329 and the offset coordinates xoff and yoff are dynamically updated330 with respect to the IA signal via Eqs. (13) and (14), respectively.331 After extracting the IA signal (see Sec. 2) with the new dynamic332 parameters, the resulting vapor film signals are significantly333 denoised. Then, the aforementioned process is repeated on the334 resulting signal by using MRA for the first �9.2 s and by
335extracting the wavelet coefficients that contribute to the low-336frequency vibration in the IA signal. Figure 5 provides a sche-337matic representation of the recursive filtering process. In the first338iteration, the wavelet coefficients are extracted from scales of 256339and 512, and it is found that maximum a¼�1.317 deg.340The intensity of inherent artifact signals is lower after imple-341mentation of the first iteration; however, in MRA analysis, low-342frequency signals are still more observable at larger values of /.343Therefore, another iteration is performed to extract wavelet344coefficients from the 1024 scale to find the maximum value of a
Fig. 4 Multiresolution analysis of signals in the first 6000 frames. The Wavelet basis db45 has been used for MRA: (a)/ 5 42 deg, (b) / 5 28 deg, (c) / 5 14 deg, and (d) / 5 0 deg.
Fig. 5 Schematic representation of the recursive filteringprocess
J_ID: DS DOI: 10.1115/1.4039470 Date: 3-March-18 Stage: Page: 5 Total Pages: 8
ID: asme3b2server Time: 17:41 I Path: //chenas03.cadmus.com/Cenpro/ApplicationFiles/Journals/ASME/DS##/Vol00000/180042/Comp/APPFile/AS-DS##180042
Journal of Dynamic Systems, Measurement, and Control MONTH 2018, Vol. 00 / 000000-5

PROOF COPY [DS-17-1506]
345 � –0.252 deg. The dominant IA signal is the sum of a (in the first346 iteration) and a (in the second iteration). Figure 6 shows the pro-347 file of a typical IA signal after executing two iterations of the348 recursive process. It is seen that the IA phenomenon can result in349 an pendulum motion with angles up to 1.157 deg to the left and350 1.425 deg to the right.
3784 Summary, Conclusions, and Future Work
379This paper has presented the filtering of two-phase thermal-380hydraulic signals by wavelet-based denoising. These signals are381extracted from an experimental apparatus, where the two-382dimensional images are first converted to a one-dimensional sig-383nal of vapor film thickness by making use of the geometrical prop-384erties and constraints of the problem. In these experiments, the385recorded video images are contaminated by nonstationary low-386frequency vibrations in the thermal-fluid environment, which are387deemed as the IA signals. These signals are identified recursively388by using MRA with wavelet basis of db45, which reconstructs the
Fig. 6 Profile of a typical IA signal
Fig. 7 Filtered signals of vapor film thickness. The thick redvertical lines indicate the time of thermocouple quench.
Fig. 8 Filtered signals (/ 5 28 deg) at different bath temperatures
Upon removal of the low frequency noise, the filtered signals 351
are found to be in close agreement with the physics of the experi- 352
ment and can be used to determine the accuracy of wavelet analy- 353
sis for this application. Figure 7 compares the variations in 354 temporal profiles of film thickness at different angular locations. It 355
is seen that the vapor thickness becomes larger at higher angular 356 locations due to the transition from film to nucleate boiling. The 357
vertical red lines in Fig. 7 indicate that, for angles / ¼ 42 deg and 358 28 deg, the respective thermocouples have been quenched (by 359
water splashing) at �12.37 s and �13.67 s, respectively, from a 360 higher angular location toward lower angular locations. 361
Figure 8 represents the profiles of film thickness d at / ¼ 28 deg 362
for different liquid bath subcoolings. The value of this local d at 363
28 deg is found to decrease with increasing liquid subcooling tem- 364 peratures. There are two heat transfer mechanisms at work when 365
the liquid bath is subcooled. First, a part of the heat from the ves- 366
sel wall is utilized to raise the liquid temperature, and the remain- 367
ing heat is used for evaporation. Second, as the vapor film 368 attempts to grow outward, it is condensed by the subcooled bulk 369
liquid [11]. These are the two major reasons that lead to a lower 370
film thickness with increased subcooling temperatures. Compar- 371
ing the effects of angular location on film thickness for a 95 �C 372
bath (i.e., 5 �C bath subcooling) in Fig. 8, it is seen that as the 373 angular location increases, so does the film thickness. Here too, 374
the inherent physics of the problem is used to confirm that the fil- 375
tered signals are in agreement with the thermal-hydraulic phenom- 376
ena in the experiment. 377
J_ID: DS DOI: 10.1115/1.4039470 Date: 3-March-18 Stage: Page: 6 Total Pages: 8
ID: asme3b2server Time: 17:41 I Path: //chenas03.cadmus.com/Cenpro/ApplicationFiles/Journals/ASME/DS##/Vol00000/180042/Comp/APPFile/AS-DS##180042
000000-6 / Vol. 00, MONTH 2018 Transactions of the ASME

PROOF COPY [DS-17-1506]
389 wavelet coefficients which largely contribute to the IA vibration390 at scales of 256, 512, and 1024. In the recursive process, the IA391 vibration is found to contain a dynamic angle of oscillation, with392 a maximum value of 1.157 deg to the left and 1.425 deg to the393 right. With this dynamic angle as a critical parameter, the signal394 contamination can be removed during the film edge extraction395 process, and the filtered two-phase thermal-hydraulic signals are396 reproduced. Finally, the now filtered signals have been verified397 for their trends based on the inherent physics of the experiment.398 While there are many theoretical and experimental applications399 of this new method for thermal-hydraulic signal filtering, the400 authors suggest the following topics to be addressed for future401 research:
(1) Extension of the proposed method for stability analysis of402 two-phase thermal-hydraulic systems.
(2) Robustness of the proposed method to unstructured (e.g.,403 modeling) and structured (e.g., parametric) uncertainties404 and exogenous disturbances.
(3) Applicability of the proposed method for online monitoring405 and control.
406 Acknowledgment
407 This work has been supported in part by the U.S. Air Force408 Office of Scientific Research (AFOSR) under Grant No. FA9550-409 15-1-0400 in dynamic data-driven application systems (DDDAS).410 Any opinions, findings, and conclusions or recommendations411 expressed in this publication are those of the authors and do not412 necessarily reflect the views of the sponsoring agencies.
Nomenclature413
i ¼ horizontal directionj ¼ negative vertical direction
414 lRod ¼ length of the iron rod (Fig. 2(c))415 R ¼ radius of the hemispherical vessel416 (xim, yim) ¼ the position of water surface at an angle h
417xoff ¼ horizontal distance: origin to vessel center418yoff ¼ vertical distance: origin to vessel center419a ¼ dynamic angle due to IA vibration (Fig. 2(c))420b ¼ variable used for identification of a421d ¼ bubble thickness422h ¼ dummy variable for calculation of /423/ ¼ measurement angle424(1, 1) ¼ origin of the image in pixels
References[1] Rouge, S., 1997, “Sultan Test Facility for Large-Scale Vessel Coolability in
425Natural Convection at Low Pressure,” Nucl. Eng. Des., 169(1–3), pp. 185–195.[2] Chu, T., Bainbridge, B., Simpson, R., and Bentz, J., 1997, “Ex-Vessel Boiling
426Experiments: Laboratory-and Reactor-Scale Testing of the Flooded Cavity427Concept for in-Vessel Core Retention—Part I: Observation of Quenching of428Downward-Facing Surfaces,” Nucl. Eng. Des., 169(1–3), pp. 77–88.
[3] Brusstar, M., Merte, H., Keller, R., and Kirby, B., 1997, “Effects of Heater Sur-429face Orientation on the Critical Heat Flux—I: An Experimental Evaluation of430Models for Subcooled Pool Boiling,” Int. J. Heat Mass Transfer, 40(17), pp.4314007–4019.
[4] Sohag, F., Beck, F., Mohanta, L., Cheung, F., Segall, A. E., Eden, T., and Pot-432ter, J., 2017, “Enhancement of Downward-Facing Saturated Boiling Heat433Transfer by the Cold Spray Technique,” Nucl. Eng. Technol., 49(1), pp.434113–122.
[5] Sohag, F., Beck, F., Mohanta, L., Cheung, F., Segall, A., Eden, T., and Potter,435J., 2017, “Effects of Subcooling on Downward Facing Boiling Heat Transfer436With Micro-Porous Coating Formed by Cold Spray Technique,” Int. J. Heat437Mass Transfer, 106, pp. 767–780.
[6] Mallat, S., 2009, A Wavelet Tour of Signal Processing, 3rd ed., Academic Press,438Amsterdam, The Netherlands.
[7] De Kerpel, K., De Schampheleire, S., De Keulenaer, T., and De Paepe, M.,
2015, “Two-Phase Flow Regime Assignment Based on Wavelet Features of a 439 Capacitance Signal,” Int. J. Heat Fluid Flow, 56, pp. 317–323. 440
[8] Euh, D. J., Song, C.-H., et al., 2010, “An Application of the Wavelet Analysis
Technique for the Objective Discrimination of Two-Phase Flow Patterns,” Int. 441 J. Multiphase Flow, 36(9), pp. 755–768.
442
[9] Marr, D., and Hildreth, E., 1980, “Theory of Edge Detection,” Proc. R. Soc.443London B: Biol. Sci., 207(1167), pp. 187–217.
[10] Beck, F., Virani, N., Mohanta, L., Sohag, F., Ray, A., and Cheung, F., 2017,444“An Image Processing Technique for the Study of Vapor Film Dynamics Dur-445ing Quenching of a Downward Facing Hemisphere,” 16th International Topical
Meeting on Nuclear Reactor Thermal Hydraulics (NURETH), �.446
[11] Mohanta, L., Cheung, F., and Bajorek, S., 2016, “Stability of Coaxial Jets447Confined in a Tube With Heat and Mass Transfer,” Physica A, 443, pp.448333–346.
J_ID: DS DOI: 10.1115/1.4039470 Date: 3-March-18 Stage: Page: 7 Total Pages: 8
ID: asme3b2server Time: 17:42 I Path: //chenas03.cadmus.com/Cenpro/ApplicationFiles/Journals/ASME/DS##/Vol00000/180042/Comp/APPFile/AS-DS##180042
Journal of Dynamic Systems, Measurement, and Control MONTH 2018, Vol. 00 / 000000-7