Tne Impact of Retail Payment Innovations on Cash … Impact of Retail Payment Innovations on Cash...
34
Working Paper/Document de travail 2012-14 The Impact of Retail Payment Innovations on Cash Usage by Ben S. C. Fung, Kim P. Huynh and Leonard Sabetti
Transcript of Tne Impact of Retail Payment Innovations on Cash … Impact of Retail Payment Innovations on Cash...
Working Paper/Document de travail 2012-14
The Impact of Retail Payment Innovations on Cash Usage
by Ben S. C. Fung, Kim P. Huynh and Leonard Sabetti
2
Bank of Canada Working Paper 2012-14
May 2012
The Impact of Retail Payment Innovations on Cash Usage
by
Ben S. C. Fung,1 Kim P. Huynh1 and Leonard Sabetti2
1Currency Department Bank of Canada
Ottawa, Ontario, Canada K1A 0G9 Corresponding author: [email protected]
2George Mason University Fairfax, VA 22030 [email protected]
Bank of Canada working papers are theoretical or empirical works-in-progress on subjects in economics and finance. The views expressed in this paper are those of the authors.
No responsibility for them should be attributed to the Bank of Canada.
ISSN 1701-9397 © 2012 Bank of Canada

ii
Acknowledgements
Comments and suggestions from Wilko Bolt, Evren Damar, Jean-Marie Dufour, Marie-Hélène Felt, Naoaki Minimihashi, Scott Schuh, Franz Seitz, Helmut Stix, Marcel Voia, Naoki Wakamori, Angelika Welte and participants of various conferences and workshops is greatly appreciated. We thank Tobias Irrcher for assisting us with the aggregate network and payment shares data.
iii
Abstract
Many predict that innovations in retail payment may render cash obsolete. We investigate this possibility in the context of recent payment innovations such as contactless-credit and stored-value cards. We apply causal inference methods on the 2009 Bank of Canada Method of Payment survey, a representative sample of adult Canadians’ shopping behaviour for retail consumption over a three-day period. We find that using contactless credit cards and stored-value cards lead to a reduction in average cash usage for transactions both in terms of value and volume. Sensitivity analysis is undertaken and our estimates are robust to hidden bias.
JEL classification: E41, C35, C83 Bank classification: Econometric and statistical methods; Financial services; Payment, clearing, and settlement services
Résumé
L’idée que les nouveautés dans le domaine des paiements de détail pourraient rendre l’argent comptant obsolescent est de plus en plus répandue. Nous étudions cette possibilité dans le contexte de récentes innovations comme la carte de crédit sans contact et la carte prépayée. À l’aide de méthodes d’inférence causale appliquées à l’enquête sur les modes de paiement menée par la Banque du Canada en 2009, nous étudions le comportement d’un échantillon représentatif d’adultes canadiens en matière de paiement de détail sur une période de trois jours. Nous montrons que le recours à la carte de crédit sans contact et à la carte prépayée se solde par une diminution de l’utilisation moyenne des espèces pour le règlement des transactions, à la fois en valeur et en volume. Une analyse de sensibilité confirme la robustesse de nos estimations à la présence éventuelle de biais cachés.
Classification JEL : E41, C35, C83 Classification de la Banque : Méthodes économétriques et statistiques; Services financiers; Services de paiement, de compensation et de règlement
1 Introduction
Prior to past innovations in retail payment instruments such as cheques, credit cards and debit
cards, the overwhelming majority of transactions were conducted with cash. Significant de-
clines in cash usage for retail payments have prompted some observers to point to the dismal
prospects for cash in light of future payment innovations. This paper investigates the impact of
recent retail payments innovations, such as stored-value and contactless-credit cards, on house-
hold cash usage. These payment innovations are often described and marketed as substitutes
for cash, promising fast, convenient and secure payment services at the point-of-sale.1 Un-
derstanding the possible substitution away from cash to electronic payments is important for
central banks, such as the Bank of Canada, as they are the sole issuers of cash.
To put things in context we provide a brief overview regarding the evolution of the pay-
ments landscape in Canada. Figure 1 shows that the notes in circulation as a ratio of GDP
peaked at about five percent in 1961 and declined to a trough of just below three percent in
1981, where it has remained fairly stable over the past 30 years. However, the trend by denom-
inations offers a different perspective. Bank notes of 20 dollars or less, which are considered
principally for retail transactions, have declined steadily since 1961 from roughly 3.5 to 1.2
percent. Meanwhile, bank notes of denominations of 50 dollars and above, often held for
store-of-value or precautionary purposes, have seen an increase from 1.4 to 2.5 percent over
this period. Over the last 40 years, there has been a considerable decline in the use of bank
notes for retail transactions. Part of the explanation of this decline is due to inflation. How-
ever, alternative explanations are due changing payment landscape. The study by Amromin
and Chakravorti (2009) finds that the decline in small value notes is consistent for many coun-
tries. They conduct a survey of cash usage in 13 countries (including Canada). They segment
bank notes into low, medium and high denominations and conduct panel data estimates. They
conclude that small value denominations are falling for transaction purposes, while larger de-
nominations are increasing to serve as a store of value function.
1Examples of stored-value cards are merchant gift cards, pre-paid credit cards, etc. They were introduced inCanada around 2000. Contactless-credit cards were first introduced in 2006 and consist of chip embedded onthe credit card. It promises convenience and speed as customers need only tap their card on a payment terminalinstead of swiping the card and providing a signature for verification. For more information on the CanadianPayments landscape see the following report:http://paymentsystemreview.ca/wp-content/uploads/Payments-Landscape-Full-Report-e3.pdf
2
In terms of the relative usage of cash and other means of payment, Figure 2 shows how the
usage of credit cards and debits cards has increased rapidly while cash withdrawals from auto-
mated teller machine (ATM) have fallen over the past 20 years. Table 1 provides estimates of
cash usage in terms of value and volume based on aggregate network data. During this 20 year
period, the share of cash has fallen. Debit and credit cards account for a large portion of the
value substitution while debit has captured a major portion of the cash volume share. However,
despite the widespread diffusion of debit and credit cards the cash volume share illustrates that
there is still a role for cash in retail payments.
To understand the use of cash and other means of payment, the Bank of Canada conducted
the 2009 Method of Payments Survey which offers a clear picture of payment choice at the
micro level. Table 2 illustrates that cash is dominant in volume and value for micro payment
transactions i.e. less than 10 dollars. As transaction value rises, there is a shift towards debit
card in terms of volume and credit cards for value. The main determinants of debit and credit
card usage are safety, record keeping, the ability to delay payment and credit card rewards.
Research by Arango, Huynh, and Sabetti (2011) show that consumer preference for cash is
correlated with speed or convenience, merchant acceptance and low costs. Therefore, for card
payments to compete with cash they must mimic the desirable features of cash.
Stored-value cards and contactless-credit cards were introduced to fill this convenience
niche. The attractiveness of these cards for micro payments is the speed of use (e.g. contact-
less cards entail tapping your card at a POS terminal instead of swiping or entering a PIN code)
and relative low costs for consumers. Currently, these payment innovations have minimal mar-
ket share, see Table 2. Despite the relatively low market share there is a large potential for this
market.2 Figure 3 shows that the payment profile of stored-value cards is similar to cash as they
are predominately used for low value transactions. For contactless-credit cards, see Figure 3,
the profile is similar for debit at intermediate transaction values (20-50 dollars).
Previous studies have attempted to study the impact of payment innovations on the use of
cash.3 Our paper contributes to this literature in two major aspects. First, the novelty of our
2For example, Borzekowski and Kiser (2008) predict that contactless-debit in the U.S. will increase substan-tially in the next 10 years.
3See Lippi and Secchi (2009) for a brief discussion of the related literature. See Stuber (1996) for a discussionof the electronic purse.
3
study is to assess the impact of the most recent payment innovations such as contactless-credit
or stored-value cards, which compete directly with cash in terms of convenience and ease of
use. Second, we use the program evaluation methodology (propensity score matching) to study
the impact of payment innovation on the cash ratio, defined as the ratio of the value of cash pur-
chases to the value of total expenditures in the survey diary. This method allows researchers to
correct for selection bias that is inherent in non-experimental data without imposing too many
assumptions. For example, instrumental variable (IV) or parametric selection models require
that an instrument (exclusion restriction) exists and a specific functional form exists between
the cash ratio and innovation equations. In many cases, it is hard to think of a variable that
affects payment innovation without a direct affect on the cash ratio. Also, solely relying on
functional forms is not considered a convincing identification strategy. In contrast, propensity
score matching (PSM) only requires some assumptions on the probability of payment innova-
tion and that the selection effect is driven by observable factors.
In this paper, we use data from the 2009 Bank of Canada Method of Payment (MOP) sur-
vey to estimate the effect of retail payment innovations on the cash ratio at the individual level.
Using causal inference methods we find that: first, the average treatment effect of contactless-
credit card results in a decrease of 14 per cent in the cash ratio in terms of value and 13 per cent
for volume; second, the average treatment effect of stored-value cards suggests a decrease of
roughly 12 per cent in the cash ratio in terms of value and 15 per cent for volume; third, sensi-
tivity analysis suggests the findings are robust to varying degrees of unobserved heterogeneity.
The rest of this paper will proceed as follows: Section 2 will describe the micro data used
in detail while Section 3 describes the empirical methodology. Section 4 highlights the results
of the paper and Section 5 offers concluding remarks.
2 2009 Method of Payment (MOP) Survey
In order to provide a better understanding of the retail payment landscape, the Bank of Canada
conducted an extensive micro survey of Canadians. The Bank of Canada 2009 MOP survey
was conducted in November of 2009. Stratified random samples of adult Canadians aged 18
to 75 years old were drawn from access panels to obtain a national representative sample.
4
The inclusion of an offline panel ensured coverage of the segment of the population without
internet access. Survey respondents completed a survey questionnaire (SQ) and a three-day
shopping diary (DSI), which was optional for participants from the online panel. The SQ in-
cluded questions on demographics, banking and card information, perceptions on method of
payment attributes and cash management or spending habits. The DSI collected records of pay-
ment behavior such as type of good purchased, value of transaction, payment method used, and
whether any cash was obtained during the transaction. The survey comprised roughly 6,800
SQ respondents, and 3,200 DSI respondents which generated over 17,000 transactions. Finally,
sample weights were designed to combine both online and offline samples using the Statistics
Canada 2009 Canadian Internet Use Survey (CIUS) and a random digital dialing telephone
survey.
The survey specifically asks respondents whether their main credit card was embedded with
the contactless feature and whether the feature was used for transaction purposes. Questions
about stored-value cards also appear in the survey. Table 2 shows the market shares in volume
and value for each retail payment instrument used by individuals in the 2009 MOP Survey. It
shows that cash still accounts for about half of all consumer spending in terms of volume but
for only about 21 percent in terms of value. Credit cards and debit cards account for about the
remaining half in terms of volume, and 76 percent in terms of value. However, cash dominates
in low value transactions. Further, the shares of contactless-credit and stored-value cards are
both small. In 2009, the share of contactless-credit card transactions was 1.2 and 0.9 percent
in volume and value, respectively. Stored-value card purchases represented 1.6 and 1.1 percent
in volume and value, respectively.
To estimate the impact on cash usage, we construct two measures of cash usage based
on value and volume. For each individual in the DSI, we compute the cash ratio in terms of
value, is the ratio of total value of cash purchases to total value of all purchases. The second
measure, the cash share in terms of volume, is the ratio of total number of cash purchases to
total number of all transactions. We suspect the effect on volume is important as the use of
payment innovation is more greatly concentrated at the lower transaction value spectrum. We
use these measures as opposed to a measure of cash holding, whether at the start of the diary
or some average, due to the endogeneity between cash holding and spending. A large cash
5
holding may be partly motivated by the anticipation of incurring a large purchase or may be
due to precautionary motives. Another issue is that cash holdings are strongly linked to eco-
nomic transactions above and beyond retail locations. As a result, we exclusively focus on cash
spending at retail locations as a proportion of total spending, and abstract from cash holdings.
There are some diaries which have no transactions or just a a few (less than three). These re-
spondents may have underreported or did not have many shopping opportunities.4 Therefore,
in the analysis only respondents who conducted at least three transactions in the DSI are used
in our estimation sample. Conditioning on this sample, the average respondent conducts about
six transactions, or roughly two per day. We find that excluding those individuals with fewer
than three transactions does not affect the results, but reduces noise in our outcome variable.
Although a diary of longer duration may have resulted in richer payment histories, the costs
of collecting such information as well as the limitations of survey completion rates and fatigue
effects, made three days the most practical length. For a practical suggestion on diary length
see Jonker and Kosse (2009).
Table 3 distinguishes users of contactless-credit and stored-value cards (innovators) from
individuals who do not (non-innovators) use them. The sample of innovators is more skewed
towards the higher income and education brackets, and also spends more on average in the DSI
and carries higher average bank account balances. Users of contactless-credit begin the diary
with a slightly smaller amount of cash in their wallets on average as to non-users. However,
the initial average cash holding for stored-value card users is roughly 64 dollars, which is less
than the average of 77 dollars for non-users. Table 4 highlights the cash value and volume
shares across innovators and non-innovators. The average non-user of contactless, with access
to a credit card, spends roughly 32 percent of total value of purchases using cash while this
number falls to 13 percent for contactless-users. The average stored-value card user spends 17
percent of total value using cash compared to 37 percent for the average non-user. In terms of
volume, the average non-innovator conducts roughly half of all purchases in cash. The ratio
of number of cash purchases to the total number of purchases in the DSI falls to 34 percent
for the average contactless-user and to 29 percent for the average stored-value card user. We
4A statistical analysis was completed to compare demographic characteristics of these households. There wasno marked statistical significance in the characteristics.
6
find that both cash ratios, in terms of value and volume, are lower for payment innovators than
for non-innovators and this finding is consistent across demographic groups, such as income
levels. Table 4 also highlights a correlation between cash ratios in value and volume and some
observable variables. For instance, the cash ratios are declining as income rises, and as debit
and credit cards are more often accepted during one’s shopping history. Furthermore, higher
rankings of cash in terms of perceptions such as record keeping are associated with higher cash
ratios in value and volume. The correlation across age seems to exhibit a U-shaped pattern,
with higher cash usage seen across young adults under 25 and the elder over 55. An exception
is contactless-credit users whose cash ratio increases with age. The results are generally in line
with previous studies such as Stavins (2001), inter alia.
From the DSI we can observe some interesting empirical facts about the use of contactless-
credit and stored-value cards in relation to the traditional payment methods, cash, debit and
credit. For example, Table 5 shows that the use of stored-value cards varies across types of
purchases but that the bulk of purchases, roughly 43 percent, fall in the category of entertain-
ment or meals, which also includes popular coffee outlets. Contactless-credit card purchases
are overwhelmingly used for groceries, 56 percent, and at gasoline stations, 24 percent. Inter-
estingly, the share of contactless-credit purchases in the retail goods category falls to roughly
three percent, compared to 22 percent for credit cards. The lower use of contactless-credit
feature relative to the traditional swipe-method for this class of purchases which are larger on
average and more time-intensive suggests both reduced availability from the merchant side and
less demand for facilitating the speed of the transaction from the consumer side.
Table 6 computes the proportion of transactions by payment method at different time in-
tervals in terms of value and volume. It compares both weekday and weekend, and morning
(AM) and afternoon or evening (PM). The table reveals that the majority of transactions are
on weekday PM for all payment choices. However, both contactless-credit and stored-value
cards have a larger proportion relative to other payment methods in terms of value. For both
cash and stored-value cards the weekday AM transactions are larger in terms of volume than
value pointing to small value transactions undertaken (i.e. buying a coffee). The patterns for
contactless-credit, relative to debit and credit, indicate that it is used mostly in the PM week-
day where time may be a constraint. On weekend PM the shares are slanted towards debit and
7
credit cards.
The descriptive statistics offer preliminary suggestive evidence that payment innovation,
defined by usage of contactless-credit and stored of value cards, is leading to a reduction of
cash usage. However, we also observe that payment innovators are not a random sample from
the broader population and the decision to use payment innovation may not be exogenous to
cash usage. In the next section we discuss how empirically we can conduct a more appropriate
assessment.
3 Empirical Methodology
From our descriptive statistics in Table 3 we find that innovators tend to use less cash than non-
innovators. To link observable information with cash ratio we can estimate the relationship
using an ordinary least squares (OLS) regression:
CRi = Xiβ + δPIi + ui, (1)
where CRi is cash ratio, PIi takes a value of one if the individual uses innovation and zero
otherwise, and Xi is the vector of observables. In order to obtain an unbiased estimate of δ,
the causal parameter, we require that PI is strictly exogenous. However, the direction of cau-
sation could run in the reverse direction i.e. people who use less cash are more likely to use
innovative payment choices. This raises the endogeneity issues of whether innovation drives
cash usage or vice-versa. Also, there maybe a selection issue whereby a third, unobserved
factor, causes an individual both to select an innovative feature and simultaneously to use less
cash.5 An example could be an individual’s preference for technology. Individuals who prefer
technology may also tend to hold less cash and high propensity to use payment innovations.
Under a scenario of selection bias, the causal effect of payment innovation on cash usage may
be confounded.
The advantage of the 2009 MOP Survey is that beyond pertinent observable characteristics
for each individual, whether demographics, banking profile or shopping behaviour, the inclu-
5For payment card choice it is exacerbated by the issue of two-sided markets. That is the users of cardpayments and the merchants who offer these payment choices via terminals. Therefore, the usage of paymentinnovation may exhibit feedback effects. For more details on the empirics of two-sided markets see Rysman(2007).
8
sion of perceptions on payment attributes helps capture what otherwise would be unobserved
heterogeneity. Therefore, the usage of payment innovation is non-random, so we need to con-
trol for selection. A common approach, suggested by Duca and Whitesell (1995), is to estimate
a two-system equation which models the outcome or cash ratio and the selection or payment
innovation:
CRi = Xiβ1 + δPIi + ui,
P I∗i = Xiβ2 + ρWi + ϵi, (2)
where PI∗i represents the latent utility from using payment innovation or
PIi =
{1, if PI∗i > 0
0, otherwise.(3)
However, this methodology requires the variable, Wi, to be correlated with the probability of
payment innovation but not to directly affect cash usage. In the econometric literature this
shifter is known as an exclusion restriction. The robustness of the results will hinge on the
quality of these exclusion restrictions which can be difficult to ascertain.6 Without exclusion
restrictions, identification depends on strong assumptions of normality and functional forms,
which may not be tenable.7 Our attempt to implement this procedure resulted in implausible
estimates, due to the lack of instruments and the parametric specification that the error terms
follows a bivariate normal distribution.
Panel data methods are an alternative way to account for unobserved heterogeneity. For
example, Hsiao (2002) discusses how to either parametrize the unobserved heterogeneity using
the random-effects approach or to difference it via fixed-effects. Empirical implementation of
such methods have been used by Lippi and Secchi (2009) or Fujiki and Tanaka (2009). These
authors use the panel structure of the Italian and Japanese household data, respectively, to
control for unobserved heterogeneity. Unfortunately, our study does not contain panel data and
so this feature cannot be exploited.
Our analysis is undertaken in the spirit of Mulligan and Sala-i-Martin (2000) who model
6Attanasio, Guiso, and Jappelli (2002) in their study of Italian household data use provincial variation in thenumber of bank branches and ATMs as an exclusion restriction. They argue that the geographical variation inbanking should affect adoption but not money demand.
7Other empirical examples are Stix (2004), Schuh and Stavins (2010), inter alia.
9
the extensive and intensive margins of money demand. They explicitly model the decision to
adopt a bank account (extensive margin) and find that it affects one-half of the interest elasticity
(intensive margin) especially at low interest rates. The intensive margins are important if there
are large variations in the interest rates. However, at low interest rates the extensive margins
dominates since there is a lot of heterogeneity or variation across households.
3.1 Program Evaluation Approach
Here we briefly discuss how we use the program evaluation approach to estimate the impact of
innovations on cash usage. With respect to both measures of cash usage in terms of value and
volume, we can define CRi(PIi) as the cash ratio for individual i, which can take on either
of two values, CRi(1) for innovators (PIi = 1) and CRi(0) for non-innovators (PIi = 0).
We are interested in the difference between cash ratios for individual i as a payment innovator
and as non-innovator or CRi(1) − CRi(0). However, we can only observe either CRi(1) or
CRi(0). Instead, we compare the cash ratio, for a payment innovator and a non-innovator who
has comparable characteristics.
The group of innovators is referred to as the treatment group, whereas the non-innovators
are the control group. The average difference in cash ratios is computed by taking the expecta-
tion of the difference in cash ratios between innovators and non-innovators, conditional on a set
of observables. This quantity is known as the average treatment effect (ATE) and the average
treatment effect on the treated (ATT):
τATE|X = E[CRi(1)− CRi(0)|Xi], (4)
τATT |X = E[CRi(1)− CRi(0)|Xi, P I = 1]. (5)
The ATE (τATE|X ) represents the expected treatment on a randomly drawn individual across
the entire sample whereas the the ATT (τATT |X ) measures the mean effect for the sample of
innovators. From a policy perspective, the latter quantity may be more relevant for individuals
in the sample who are more likely to become payment innovators.
Thus, we estimate the τATE|X and τATT |X by comparing innovators and non-innovators
with the same propensity score, p(PIi = 1|Xi), which denotes the probability that individual
i uses payment innovation conditional on observable characteristics. This technique, known
10
as propensity-score matching (PSM), allows for simple estimation of the desired causal im-
pact because it reduces the matching problem from a vector of observable characteristics to
a simple unit-dimensional measure. In the first stage, the propensity score denoted by p(Xi)
is estimated. The propensity scores can then be compared using some distance metric. In
our implementation we use both nearest-neighbour matching (NN) and kernel matching (KM).
Therefore, we can write the PSM estimators for τATE|X and τATT |X as,
ATE = τATE|X =1
N
N∑i=1
[PIi − p(Xi)]CRi(PIi)
p(Xi)[1 − p(Xi)], (6)
ATT = τATT |X =1
N1
N1∑i=1
[PIi − p(Xi)]CRi(PIi)
1− p(Xi), (7)
where N1 is the number of individuals who are payment innovators while N2 are the non-
innovators. By definition, the total sample is N = N1 + N2 individuals. Intuitively these
estimators can be interpreted as an average of cash ratios weighted by propensities to use pay-
ment innovations.
A technical assumption required is the overlap assumption — individuals with the same
characteristics must be capable of both participating and non-participating in payment innova-
tions, or 0 < p(PIi = 1|Xi) < 1. Otherwise, we would not have a comparison group for this
subset of the sample. This assumption is verified by comparing the propensity scores of the
two groups.
The second and more crucial assumption is commonly known in the literature as ignorabil-
ity of treatment. That is conditional on observables X, the decision to use payment innovation
is random, or in other words, it is exogenous to the cash ratio decision. This assumption, also
known as unconfoundedness or selection on observables, requires that two individuals with the
same observable characteristics will both be just as likely to participate in innovation. In order
for this assumption to hold, there must not exist any remaining factor beyond our current set
of control variables that systematically causes two identically observed individuals to differ
in their odds of using payment innovation, referred to as hidden bias. In practice, we cannot
directly test the unconfoundedness assumption. However, we can offer some guidance on how
much of an impact on the decision to use payment innovation some unobserved factor must
have in order to render our results insignificant.
11
3.2 Sensitivity Analysis: Rosenbaum Bounds
To quantify how sensitive our PSM estimates are to unobserved factors we compute the Rosen-
baum bounds (RB), as described in Rosenbaum (2002). The RB are framed in terms of ratio
of propensities to use innovation for two matched individuals, a payment innovator and a non-
innovator, with the same observed characteristics. The probability of payment innovation can
be written as:
p(PIi|Xi) = F (Xiβ + γui), (8)
where u denotes an unobserved variable, γ is a scalar and F denotes a cumulative density func-
tion. Assuming there is no hidden bias, γ = 0, then the log-odds ratio p(PIi|Xi)/p(PIj|Xj) =
1 for individuals with the exact same characteristics Xi = Xj. If hidden bias exists then γ > 0
so that the log-odds ratio p(PIi|Xi)/p(PIj|Xj) = 1. Sensitivity analysis evaluates the impact
of unobserved heterogeneity on the log-odds ratio of propensities between two matched indi-
viduals reduces the statistical significance of the treatment effect. The RB is the upper bound
on how much hidden bias can be tolerated.
4 Results
We consider two payment innovations: contactless-credit and stored-value cards. The treat-
ment group is defined as the users of these payment innovations during the DSI. Both cases
have as control group non-users of payment innovation, however, the control group for contactless-
credit users excludes individuals without access to credit cards. For each case, we estimate two
models: a simple model controlling for demographics only (DEMO) and a full model (FULL)
which controls additionally for shopping characteristics from the DSI, and perceptions on pay-
ment method attributes. We use perceptions on cash attributes relative to credit and debit. To
avoid potential endogeneity issues, we measure each respondent’s shopping characteristic, such
as initial cash holdings, as a ratio relative to the average within the individual’s demographic
stratum, following Stango (2000). The appendix contains a more complete description of the
variables.
For contactless-credit, the marginal effects of the propensity score estimates for the first
12
stage are displayed in Table 7. Overall, we observe that the coefficients in DEMO are robust to
the more complete (FULL) specification. We observe that family size, whether an individual
revolves on her credit card are significant factors in explaining usage of contactless-credit fea-
ture, along with certain perceptions and shopping characteristics. Individuals in larger house-
holds, likely with children, may be under more time constraints and may be attracted to the
added convenience of the contactless feature. Revolvers on credit cards are roughly six percent
less likely to use the contactless-credit feature, as they may prefer using the credit card for its
credit facility rather than for its transactional services and they may also be individuals with
lower incomes on average. We find that as fear of fraud of cash relative to cards increases,
individuals are less likely to use contactless-credit, perhaps due to the lack of merchant veri-
fication associated with the contactless-credit feature. Individuals are also more likely to use
contactless-credit when they view cash as more expensive than credit and debit cards.
For stored-value card users, there is a significant positive income effect. In contrast to the
effect of perceptions on the propensity to use contactless-credit, as the fear of fraud of cash
relative to cards increases, individuals tend to be more likely to revert to stored-value cards
which have limited liability. Lastly, as the perception of cost of cash increases relative to cards,
individuals tend to be less likely to use stored-value cards, which may suggest some comple-
mentarity between cash and prepaid cards. Figures 4 and 5 display the propensity scores for
innovator and non-innovators for contactless credit and stored-value card, respectively. These
figures confirm visually that the overlap assumption is met. Further, Figures 6 and 7 illustrate
the cash ratio versus propensity score for non-innovator and innovators of contactless-credit
and stored-value cards, in terms of value and volume. These figures show innovators tend to
have a lower cash ratio as their propensity score increases while for non-innovators the rela-
tionship is not as stark.
The treatment effect results are summarized in Table 8 and Table 9 for contactless-credit
and stored-value cards, respectively. The ATE/ATT estimates are computed using both OLS
and PSM methods. OLS ATE/ATT is estimated using the cash ratio regression (1) and comput-
ing the ATE/ATT parameters. The PSM estimates are computed using kernel matching (KM)
13
method.8 Angrist and Pischke (2008) suggest that OLS estimates be provided to serve as a
baseline comparison to the PSM results. We use the Stata module -psmatch2- to implement
PSM estimation in Stata, see Leuven and Sianesi (2003).9
Overall, the results suggest that recent payment innovations is negatively impacting cash
usage, in terms of both value and volume. The results are statistically significant and change
little across DEMO and FULL specifications. For most of the cases the PSM results are simi-
lar to OLS estimates as there confidence intervals intersect so they are almost observationally
equivalent. The results are not surprising since both estimators are semiparametric and are ro-
bust to some parametric assumptions. We concentrate our discussions to the estimates from the
FULL model. The ATE on the cash value share is roughly -14 and -12 percent for contactless-
credit and stored-value cards, respectively. The ATE on the cash volume share is roughly -13
and -15 percent, respectively. As a back-of-the-envelope calculation, for an average non-user
of contactless who spends 221 dollars in total transactions with a cash ratio of 32 percent, the
treatment estimates would imply that cash spending would drop by roughly 32 dollars if they
had used contactless-credit card. Similarly, the treatment estimates imply that cash spending
for the average non-user of stored-value cards would fall by roughly 24 dollars if they had
used a stored-value card. Overall, the number of cash transactions would fall by close to one
transaction on average.
4.1 Sensitivity Analysis
The PSM results are quite significant but are smaller than the difference in means obtained
from analyzing Table 4. Results from OLS are similar but have large confidence intervals.
Controlling for additional observable characteristics in the FULL model seems to reduce po-
tential bias. To understand the potential effect of unobserved heterogeneity on the PSM result
we compute the RB using the rbounds program, see Gangl (2004). The estimates of the RB
range from 1.37 to 2.55 and suggest that our results are quite tolerant to unobserved bias. Only
the results for the impact on the cash value share due to stored-value cards are somewhat less
8We also use nearest neighbour matching (NM) and found that the results are similar. We calculate standarderrors via 1000 bootstrap replications. Abadie and Imbens (2008) show that the bootstrap with NM fails while itis valid for the KM, thus, another reason only to present the KM results.
9The probit specification was also implemented for robustness and the results were quite similar. We also usethe link test to check if the logit link function is correctly specified.
14
convincing, which seems to intuitively follow from the fact that stored-value cards are mostly
used for small value transactions.
For concreteness, we relate the RB to observable factors. For the case of RB = 2, if
an unobserved factor caused a payment innovator to be twice as likely to innovate than a non-
innovator, our results would lose statistical significance. Following Bharath, Dahiya, Saunders,
and Srinivasan (2009), we can solve for the magnitude of a change in an observed covariate
necessary to obtain RB = 2. Based on the logit model, the ratio of propensities should change
by a factor of
RB = exp(βkskn), (9)
where βk is the logit coefficient and sk is the standard deviation of variable k. Setting this
quantity equal to RB = 2, we can solve for n for each continuous variable in our model. For
example, ceteris paribus, for an individual from a matched pair the perception on cost would
have to change by roughly one standard deviation for the treatment effects for contactless-credit
and stored-value cards to become insignificant. These findings suggest our results may remain
statistically significant even in the presence of unobserved factors.
4.2 Definition of Treatment Group
Table 11 provides a summary of the robustness for various definitions of treatment and control
groups. The analysis undertaken considers Case 1. We find that the results are qualitatively
the same when the treatment group is defined as users of payment innovation (NU ) with the
control group being either defined as non-users (NAN ) or non-adopters (NN ), see Case 2 and
3. The only marginally negative impact occurs when the treatment group is adopters non-users
(NAN ) and users (NU ) of payment innovation and control group is non-adopters (NN ), see Case
4. However, when we exclude the users of payment innovation (NU ), the impact of payment
innovation is zero, see Case 5. Exhausting the possible cases demonstrates that the impact
is primarily due to using payment innovation. In the case of contactless-credit, adoption is
not necessarily a choice of the individual and those who have this feature may not use them.
Adoption of stored-value cards is also not necessarily a permanent feature of one’s portfolio
15
and therefore the impact from solely adopting this payment feature may not be evident.10
5 Conclusion
We investigate the effects of innovations of retail payment instruments on the use of cash for
retail transactions in Canada. We find some evidence that recent innovations in Canada such as
contactless-credit cards and stored-value cards have led to a reduction in cash usage. We find
that stored-value cards are primarily used for low-value transactions, under 10 dollars, while
contactless-credit cards are mostly used for intermediate-value transactions, ranging from 10
to 40 dollars.
These results confirm the hypothesis that payment innovations have led to a decrease in
cash usage. The increasing popularity of credit cards and debit cards over the past 20 years
have resulted in a shrinking share of bank notes in retail transactions, both in terms of volume
and value. However, the advent of contactless-credit cards and stored-value cards, which are
designed to be more convenient and less costly, may further reduce cash usage.
One of the limitations of using the 2009 MOP Survey data in this type of study is that it can
provide only a snapshot of the impact of innovation on cash usage. In 2009, the contactless-
credit card was in nascent stage of deployment and therefore our results may be underesti-
mating the current impact. The Canadian Financial Monitor is a household dataset that is
conducted on a biannual basis. To better understand the impact of innovation on cash usage,
it would be useful to consider how innovation affects cash usage over time. Also, it would be
useful to consider supply-side factors such as merchant acceptance and the inherent two-sided
markets issues. We leave these issues for future research.
ReferencesABADIE, A., AND G. W. IMBENS (2008): “On the Failure of the Bootstrap for Matching
Estimators,” Econometrica, 76(6), 1537–1557.
AMROMIN, G., AND S. CHAKRAVORTI (2009): “Whither Loose Change? The Diminishing
10Canadian banks issue new cards with the irregardless whether the consumers ask for it or not. Therefore, inthis case adoption of contactless feature is considered passive. Therefore, there maybe a case when consumershave the contactless feature but do not use it.
16
Demand for Small-Denomination Currency,” Journal of Money, Credit and Banking, 41(2-3), 315–335.
ANGRIST, J. D., AND J.-S. PISCHKE (2008): Mostly Harmless Econometrics: An Empiricist’sCompanion. Princeton University Press, 1 edn.
ARANGO, C., K. HUYNH, AND L. SABETTI (2011): “How Do You Pay? The Role of Incen-tives at the Point-of-Sale,” Working Paper 11-23, Bank of Canada.
ATTANASIO, O. R., L. GUISO, AND T. JAPPELLI (2002): “The Demand for Money, FinancialInnovation, and the Welfare Cost of Inflation: An Analysis with Household Data,” Journalof Political Economy, 110(2), 317–351.
BHARATH, S. T., S. DAHIYA, A. SAUNDERS, AND A. SRINIVASAN (2009): “Lending Rela-tionships and Loan Contract Terms,” Review of Financial Studies, 24(4), 1141–1203.
BORZEKOWSKI, R., AND E. K. KISER (2008): “The choice at the checkout: Quantifying de-mand across payment instruments,” International Journal of Industrial Organization, 26(4),889–902.
DUCA, J. V., AND W. C. WHITESELL (1995): “Credit Cards and Money Demand: A Cross-sectional Study,” Journal of Money, Credit and Banking, 27(2), 604–23.
FUJIKI, H., AND M. TANAKA (2009): “Demand for Currency, New Technology and the Adop-tion of Electronic Money: Evidence Using Individual Household Data,” IMES DiscussionPaper Series 09-E-27, Institute for Monetary and Economic Studies, Bank of Japan.
GANGL, M. (2004): “RBOUNDS: Stata module to perform Rosenbaum sensitivity analysis foraverage treatment effects on the treated,” Statistical Software Components, Boston CollegeDepartment of Economics.
HSIAO, C. (2002): Analysis of Panel Data. Cambridge University Press, second edition edn.
JONKER, N., AND A. KOSSE (2009): “The impact of survey design on research outcomes: Acase study of seven pilots measuring cash usage in the Netherlands,” DNB Working Papers221, Netherlands Central Bank, Research Department.
LEUVEN, E., AND B. SIANESI (2003): “PSMATCH2: Stata module to perform full Maha-lanobis and propensity score matching, common support graphing, and covariate imbalancetesting,” Statistical Software Components, Boston College Department of Economics.
LIPPI, F., AND A. SECCHI (2009): “Technological change and the households’ demand forcurrency,” Journal of Monetary Economics, 56(2), 222–230.
MULLIGAN, C. B., AND X. SALA-I-MARTIN (2000): “Extensive Margins and the Demandfor Money at Low Interest Rates,” Journal of Political Economy, 108(5), 961–991.
ROSENBAUM, P. (2002): Observational Studies. Springer, New York, NY.
17
RYSMAN, M. (2007): “An Empirical Analysis of Payment Card Usage,” Journal of IndustrialEconomics, 55(1), 1–36.
SCHUH, S., AND J. STAVINS (2010): “Why are (some) consumers (finally) writing fewerchecks? The role of payment characteristics,” Journal of Banking & Finance, 34(8), 1745–1758.
STANGO, V. (2000): “Competition And Pricing In The Credit Card Market,” The Review ofEconomics and Statistics, 82(3), 499–508.
STAVINS, J. (2001): “Effect of Consumer Characteristics on the Use of Payment Instruments,”New England Economic Review, 3, 19–31.
STIX, H. (2004): “How Do Debit Cards Affect Cash Demand? Survey Data Evidence,” Em-pirica, 31(2), 93–115.
STUBER, G. (1996): “The Electronic Purse: An Overview of Recent Developments and PolicyIssues,” Technical reports, Bank of Canada.
A Appendix
A.1 Variable ListDemographics:
• Income: The SQ asks, “Which of the following categories best describes your currentannual household income?”
• Education: The SQ asks, “What is the highest level of education you have completed?”
• Region: The SQ asks, “What region of Canada do you reside in?”
• Age: The SQ asks, “In what year were you born?”
• Family size: The SQ asks, “How many family members, including yourself, live in yourhousehold?”
• Gender: The SQ asks, “What is your gender?”
• Homeowner or renter: The SQ asks “Do you rent or own your home?”
• Bank account balance: The SQ asks “What was the lowest balance and the highestbalance in your main bank account in the last month?” From these responses we obtainan average bank account balance.
• Survey access panel: We control for whether respondents stemmed from the offlinepanel.
18
• Credit card revolvers: We include a dummy variable indicating whether respondents arerevolving on their credit card balance.
DSI: We define strata according to age and income groups, and then construct relativemeasures (RDSI) for each respondent in terms of a ratio to the average within their respectivestratum. For each participant i, we calculate:
RDSIi =DSIi
DSIym, (10)
where DSIym denotes the average of the DSI variable for the particular stratum, where y andm index over the age and income strata, respectively.
• Initial cash holdings: The DSI asks the respondent to report the amount of cash, bothbills and coins, in their wallet prior to starting the diary.
• Credit/Debit card accepted: The DSI asks the respondent for each method of paymentrespectively, “Which method of payment would NOT have been accepted?” For eachindividual, we calculate the share of transactions for which both credit and debit wereaccepted.
• Type of Transaction: For every transaction, the DSI asks the respondent, “What wasthe main type of goods or service purchased during this transaction?” The followingcategories: gasoline, goods/retail, services, hobby/sports, entertainment, other. For eachindividual, we calculate the share of purchases made of each type relative to the totalnumber of purchases.
• Weekend: The DSI asks the respondent for each transaction to report the day of the weekon which it was made. Based on this, we calculate the share of weekend purchases foreach individual.
• Time of day: The DSI asks the respondent for each transaction to report the time of dayon which it was made. Based on this, we calculate the share of PM purchases for eachindividual.
Perceptions:
• Ease of Use: The SQ asks the respondent “When making a payment, in your opinionhow easy is it for you to use each of the following methods of payment? Please use ascale from ‘1’ to ‘5’, where ‘1’ means it is “not at all easy to use” and ‘5’ means it is‘very easy to use.’ We calculate the perception for cash relative to credit and debit.
• Record Keeping: The SQ asks the respondent “In your opinion how useful are (or wouldbe) the following methods of payment in terms of helping you to keep a record of yourspending. Please use a scale from ‘1’ to ‘5’, where ‘1’ means it is “not at all useful” and‘5’ means it is ‘very useful.’ We calculate the perception for cash relative to credit anddebit.
19
• Cost: The SQ asks the respondent “Taking into consideration costs such as withdrawalfees, account fees, and interest paid, in your opinion how costly is it (or would it be) tomake a payment using the following methods of payment. Please use a scale from ‘1’ to‘5’, where ‘1’ means it is “not at all costly” and ‘5’ means it is ‘very costly.’ We calculatethe perception for cash relative to credit and debit.
• Risk/Fraud: The SQ asks the respondent “In your opinion, how likely is it (or would itbe) that you will experience fraud in the next year when using the following methods ofpayment? Please use a scale from ‘1’ to ‘5’, where ‘1’ means it is “not at all likely” and‘5’ means it is ‘very likely.’ We calculate the perception for cash relative to credit anddebit.
We construct relative measures of perceived attributes (RCHAR) for cash in terms of paymentcards, debit and credit, for each participant i in the following way:
RCHARki(cash) =CHARki(cash)
CHARki(credit) + CHARki(debit)
, (11)
where k indexes the payment characteristics.
B Tables and Figures
20
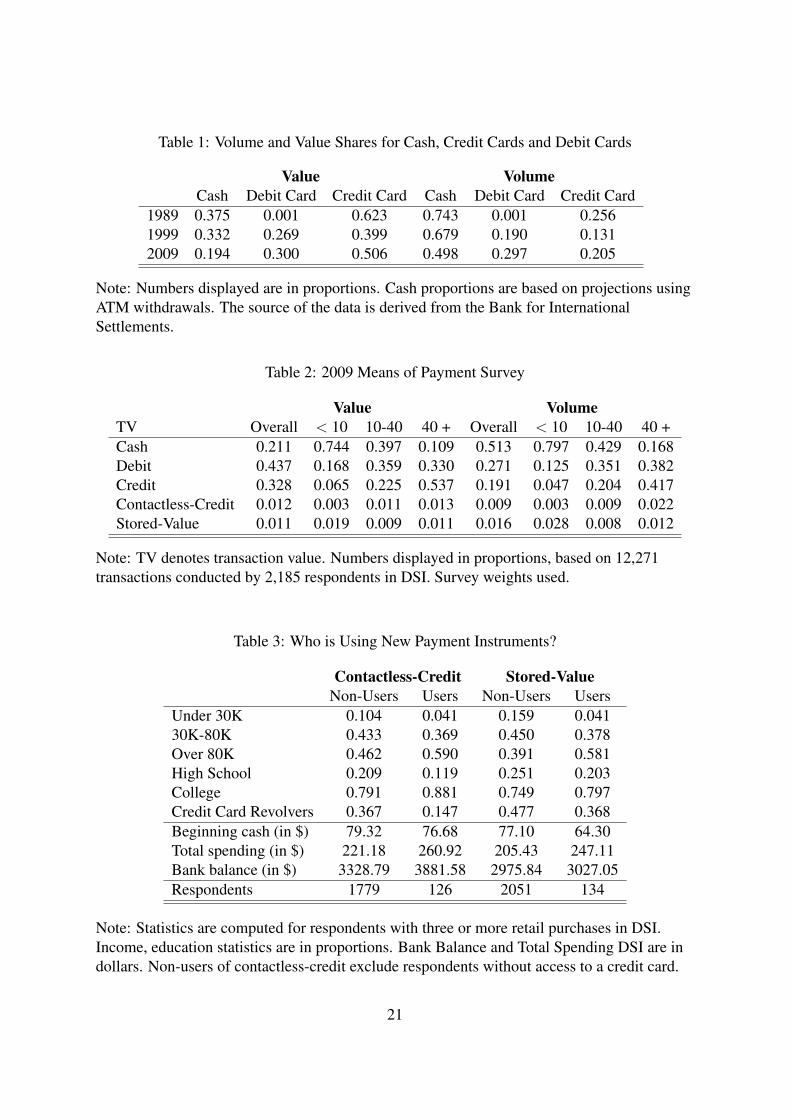
Table 1: Volume and Value Shares for Cash, Credit Cards and Debit Cards
Value VolumeCash Debit Card Credit Card Cash Debit Card Credit Card
1989 0.375 0.001 0.623 0.743 0.001 0.2561999 0.332 0.269 0.399 0.679 0.190 0.1312009 0.194 0.300 0.506 0.498 0.297 0.205
Note: Numbers displayed are in proportions. Cash proportions are based on projections usingATM withdrawals. The source of the data is derived from the Bank for InternationalSettlements.
Table 2: 2009 Means of Payment Survey
Value VolumeTV Overall < 10 10-40 40 + Overall < 10 10-40 40 +Cash 0.211 0.744 0.397 0.109 0.513 0.797 0.429 0.168Debit 0.437 0.168 0.359 0.330 0.271 0.125 0.351 0.382Credit 0.328 0.065 0.225 0.537 0.191 0.047 0.204 0.417Contactless-Credit 0.012 0.003 0.011 0.013 0.009 0.003 0.009 0.022Stored-Value 0.011 0.019 0.009 0.011 0.016 0.028 0.008 0.012
Note: TV denotes transaction value. Numbers displayed in proportions, based on 12,271transactions conducted by 2,185 respondents in DSI. Survey weights used.
Table 3: Who is Using New Payment Instruments?
Contactless-Credit Stored-ValueNon-Users Users Non-Users Users
Under 30K 0.104 0.041 0.159 0.04130K-80K 0.433 0.369 0.450 0.378Over 80K 0.462 0.590 0.391 0.581High School 0.209 0.119 0.251 0.203College 0.791 0.881 0.749 0.797Credit Card Revolvers 0.367 0.147 0.477 0.368Beginning cash (in $) 79.32 76.68 77.10 64.30Total spending (in $) 221.18 260.92 205.43 247.11Bank balance (in $) 3328.79 3881.58 2975.84 3027.05Respondents 1779 126 2051 134
Note: Statistics are computed for respondents with three or more retail purchases in DSI.Income, education statistics are in proportions. Bank Balance and Total Spending DSI are indollars. Non-users of contactless-credit exclude respondents without access to a credit card.
21
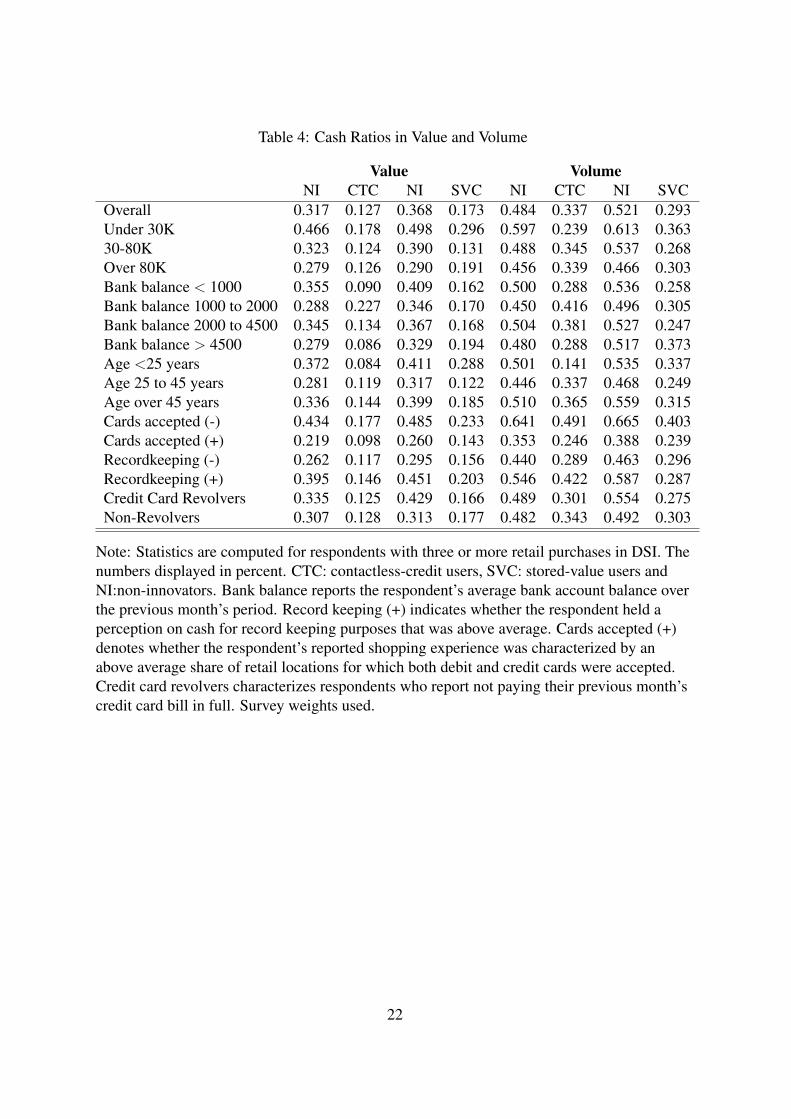
Table 4: Cash Ratios in Value and Volume
Value VolumeNI CTC NI SVC NI CTC NI SVC
Overall 0.317 0.127 0.368 0.173 0.484 0.337 0.521 0.293Under 30K 0.466 0.178 0.498 0.296 0.597 0.239 0.613 0.36330-80K 0.323 0.124 0.390 0.131 0.488 0.345 0.537 0.268Over 80K 0.279 0.126 0.290 0.191 0.456 0.339 0.466 0.303Bank balance < 1000 0.355 0.090 0.409 0.162 0.500 0.288 0.536 0.258Bank balance 1000 to 2000 0.288 0.227 0.346 0.170 0.450 0.416 0.496 0.305Bank balance 2000 to 4500 0.345 0.134 0.367 0.168 0.504 0.381 0.527 0.247Bank balance > 4500 0.279 0.086 0.329 0.194 0.480 0.288 0.517 0.373Age <25 years 0.372 0.084 0.411 0.288 0.501 0.141 0.535 0.337Age 25 to 45 years 0.281 0.119 0.317 0.122 0.446 0.337 0.468 0.249Age over 45 years 0.336 0.144 0.399 0.185 0.510 0.365 0.559 0.315Cards accepted (-) 0.434 0.177 0.485 0.233 0.641 0.491 0.665 0.403Cards accepted (+) 0.219 0.098 0.260 0.143 0.353 0.246 0.388 0.239Recordkeeping (-) 0.262 0.117 0.295 0.156 0.440 0.289 0.463 0.296Recordkeeping (+) 0.395 0.146 0.451 0.203 0.546 0.422 0.587 0.287Credit Card Revolvers 0.335 0.125 0.429 0.166 0.489 0.301 0.554 0.275Non-Revolvers 0.307 0.128 0.313 0.177 0.482 0.343 0.492 0.303
Note: Statistics are computed for respondents with three or more retail purchases in DSI. Thenumbers displayed in percent. CTC: contactless-credit users, SVC: stored-value users andNI:non-innovators. Bank balance reports the respondent’s average bank account balance overthe previous month’s period. Record keeping (+) indicates whether the respondent held aperception on cash for record keeping purposes that was above average. Cards accepted (+)denotes whether the respondent’s reported shopping experience was characterized by anabove average share of retail locations for which both debit and credit cards were accepted.Credit card revolvers characterizes respondents who report not paying their previous month’scredit card bill in full. Survey weights used.
22
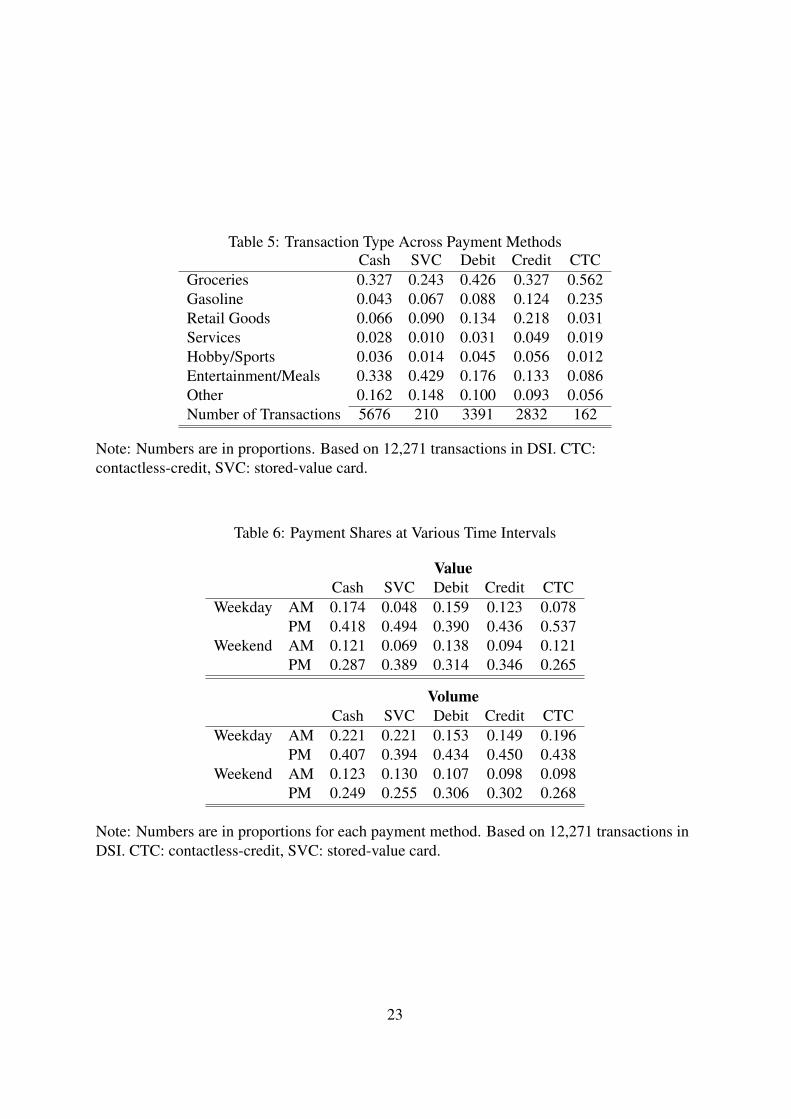
Table 5: Transaction Type Across Payment MethodsCash SVC Debit Credit CTC
Groceries 0.327 0.243 0.426 0.327 0.562Gasoline 0.043 0.067 0.088 0.124 0.235Retail Goods 0.066 0.090 0.134 0.218 0.031Services 0.028 0.010 0.031 0.049 0.019Hobby/Sports 0.036 0.014 0.045 0.056 0.012Entertainment/Meals 0.338 0.429 0.176 0.133 0.086Other 0.162 0.148 0.100 0.093 0.056Number of Transactions 5676 210 3391 2832 162
Note: Numbers are in proportions. Based on 12,271 transactions in DSI. CTC:contactless-credit, SVC: stored-value card.
Table 6: Payment Shares at Various Time Intervals
ValueCash SVC Debit Credit CTC
Weekday AM 0.174 0.048 0.159 0.123 0.078PM 0.418 0.494 0.390 0.436 0.537
Weekend AM 0.121 0.069 0.138 0.094 0.121PM 0.287 0.389 0.314 0.346 0.265
VolumeCash SVC Debit Credit CTC
Weekday AM 0.221 0.221 0.153 0.149 0.196PM 0.407 0.394 0.434 0.450 0.438
Weekend AM 0.123 0.130 0.107 0.098 0.098PM 0.249 0.255 0.306 0.302 0.268
Note: Numbers are in proportions for each payment method. Based on 12,271 transactions inDSI. CTC: contactless-credit, SVC: stored-value card.
23
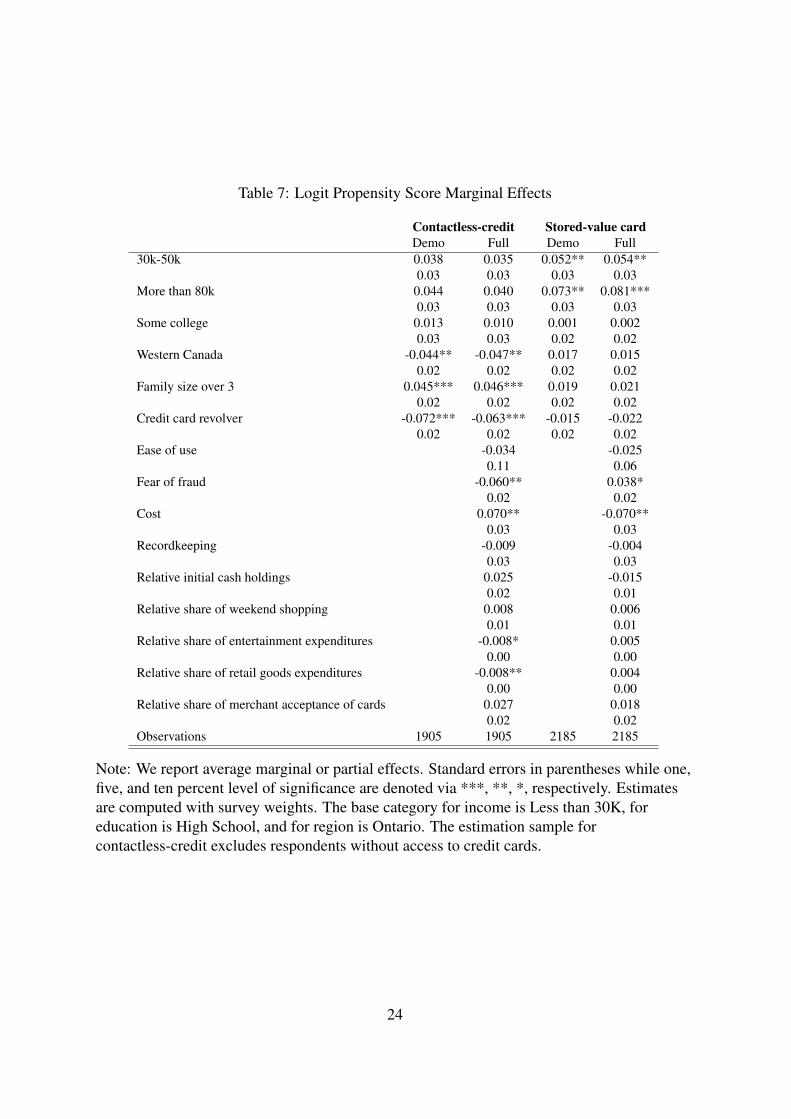
Table 7: Logit Propensity Score Marginal Effects
Contactless-credit Stored-value cardDemo Full Demo Full
30k-50k 0.038 0.035 0.052** 0.054**0.03 0.03 0.03 0.03
More than 80k 0.044 0.040 0.073** 0.081***0.03 0.03 0.03 0.03
Some college 0.013 0.010 0.001 0.0020.03 0.03 0.02 0.02
Western Canada -0.044** -0.047** 0.017 0.0150.02 0.02 0.02 0.02
Family size over 3 0.045*** 0.046*** 0.019 0.0210.02 0.02 0.02 0.02
Credit card revolver -0.072*** -0.063*** -0.015 -0.0220.02 0.02 0.02 0.02
Ease of use -0.034 -0.0250.11 0.06
Fear of fraud -0.060** 0.038*0.02 0.02
Cost 0.070** -0.070**0.03 0.03
Recordkeeping -0.009 -0.0040.03 0.03
Relative initial cash holdings 0.025 -0.0150.02 0.01
Relative share of weekend shopping 0.008 0.0060.01 0.01
Relative share of entertainment expenditures -0.008* 0.0050.00 0.00
Relative share of retail goods expenditures -0.008** 0.0040.00 0.00
Relative share of merchant acceptance of cards 0.027 0.0180.02 0.02
Observations 1905 1905 2185 2185
Note: We report average marginal or partial effects. Standard errors in parentheses while one,five, and ten percent level of significance are denoted via ***, **, *, respectively. Estimatesare computed with survey weights. The base category for income is Less than 30K, foreducation is High School, and for region is Ontario. The estimation sample forcontactless-credit excludes respondents without access to credit cards.
24

Table 8: Contactless-Credit Impact on Cash
Value VolumeDemo Full Demo Full
ATEOLS -0.156 -0.155 -0.166 -0.138(-0.199 -0.112) (-0.203 -0.108) (-0.225 -0.107) (-0.203 -0.074)
ATTOLS -0.132 -0.115 -0.123 -0.100(-0.170 -0.094) (-0.154 -0.076) (-0.173 -0.073) (-0.146 -0.053)
ATEPSM -0.145 -0.144 -0.142 -0.134(-0.188 -0.102) (-0.186 -0.101) (-0.198 -0.085) (-0.194 -0.075)
ATTPSM -0.138 -0.125 -0.124 -0.109(-0.175 -0.100) (-0.163 -0.087) (-0.175 -0.074) (-0.161 -0.058)
RB 1.69 1.67 2.29 2.19
Note: We provide estimates for both OLS and PSM-kernel matching. 95 percent confidenceintervals displayed in parentheses and are constructed with 1000 bootstrap replications. Demodenotes Demographics while Full is Demographics + DSI + Perceptions. Please refer toappendix for complete list of variables.
Table 9: Stored-Value Card Impact on Cash
Value VolumeDemo Full Demo Full
ATEOLS -0.115 -0.115 -0.148 -0.153(-0.168 -0.061) (-0.164 -0.066) (-0.194 -0.102) (-0.196 -0.110)
ATTOLS -0.097 -0.102 -0.136 -0.137(-0.140 -0.055) (-0.143 -0.061) (-0.176 -0.096) (-0.176 -0.099)
ATEPSM -0.128 -0.119 -0.157 -0.145(-0.174 -0.082) (-0.165 -0.072) (-0.199 -0.114) (-0.187 -0.102)
ATTPSM -0.115 -0.099 -0.153 -0.131(-0.158 -0.072) (-0.142 -0.056) (-0.194 -0.112) (-0.174 -0.089)
RB 1.47 1.37 2.55 2.31
Note: We provide estimates for both OLS and PSM-kernel matching. 95 percent confidenceintervals displayed in parentheses and are constructed with 1000 bootstrap replications. Demodenotes Demographics while Full is Demographics + DSI + Perceptions. Please refer toappendix for complete list of variables.
25
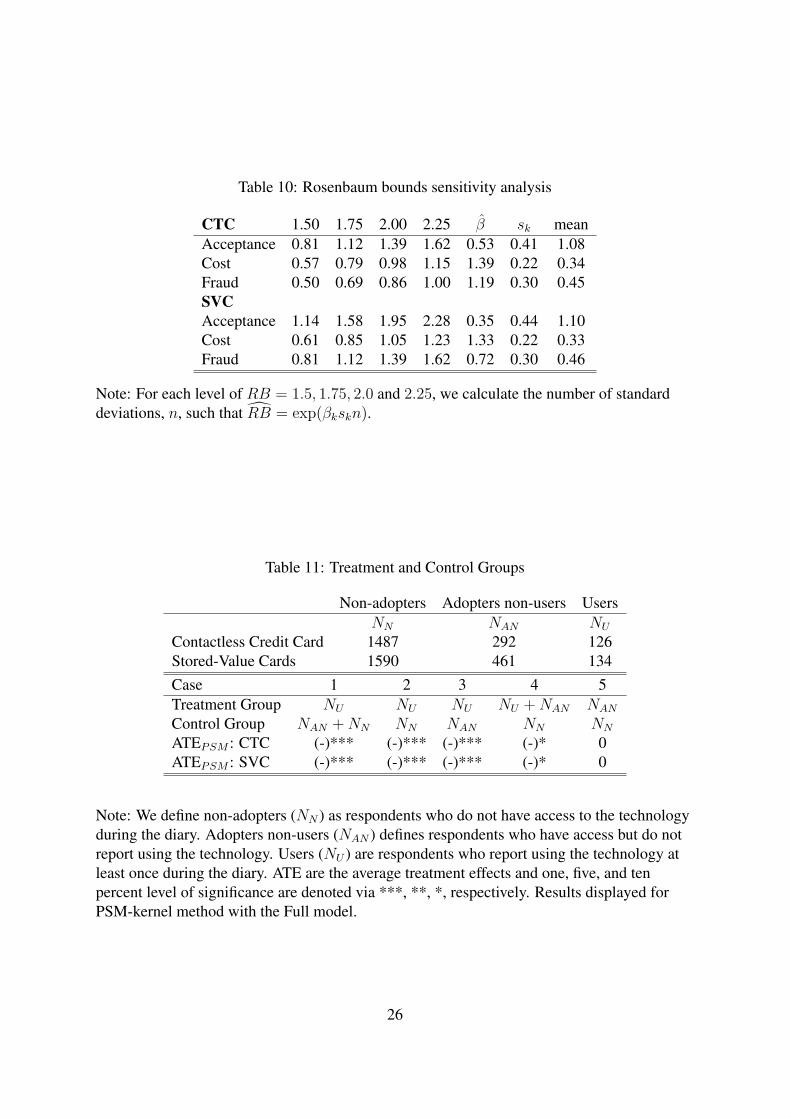
Table 10: Rosenbaum bounds sensitivity analysis
CTC 1.50 1.75 2.00 2.25 β sk meanAcceptance 0.81 1.12 1.39 1.62 0.53 0.41 1.08Cost 0.57 0.79 0.98 1.15 1.39 0.22 0.34Fraud 0.50 0.69 0.86 1.00 1.19 0.30 0.45SVCAcceptance 1.14 1.58 1.95 2.28 0.35 0.44 1.10Cost 0.61 0.85 1.05 1.23 1.33 0.22 0.33Fraud 0.81 1.12 1.39 1.62 0.72 0.30 0.46
Note: For each level of RB = 1.5, 1.75, 2.0 and 2.25, we calculate the number of standarddeviations, n, such that RB = exp(βkskn).
Table 11: Treatment and Control Groups
Non-adopters Adopters non-users UsersNN NAN NU
Contactless Credit Card 1487 292 126Stored-Value Cards 1590 461 134Case 1 2 3 4 5Treatment Group NU NU NU NU +NAN NAN
Control Group NAN +NN NN NAN NN NN
ATEPSM : CTC (-)*** (-)*** (-)*** (-)* 0ATEPSM : SVC (-)*** (-)*** (-)*** (-)* 0
Note: We define non-adopters (NN ) as respondents who do not have access to the technologyduring the diary. Adopters non-users (NAN ) defines respondents who have access but do notreport using the technology. Users (NU ) are respondents who report using the technology atleast once during the diary. ATE are the average treatment effects and one, five, and tenpercent level of significance are denoted via ***, **, *, respectively. Results displayed forPSM-kernel method with the Full model.
26
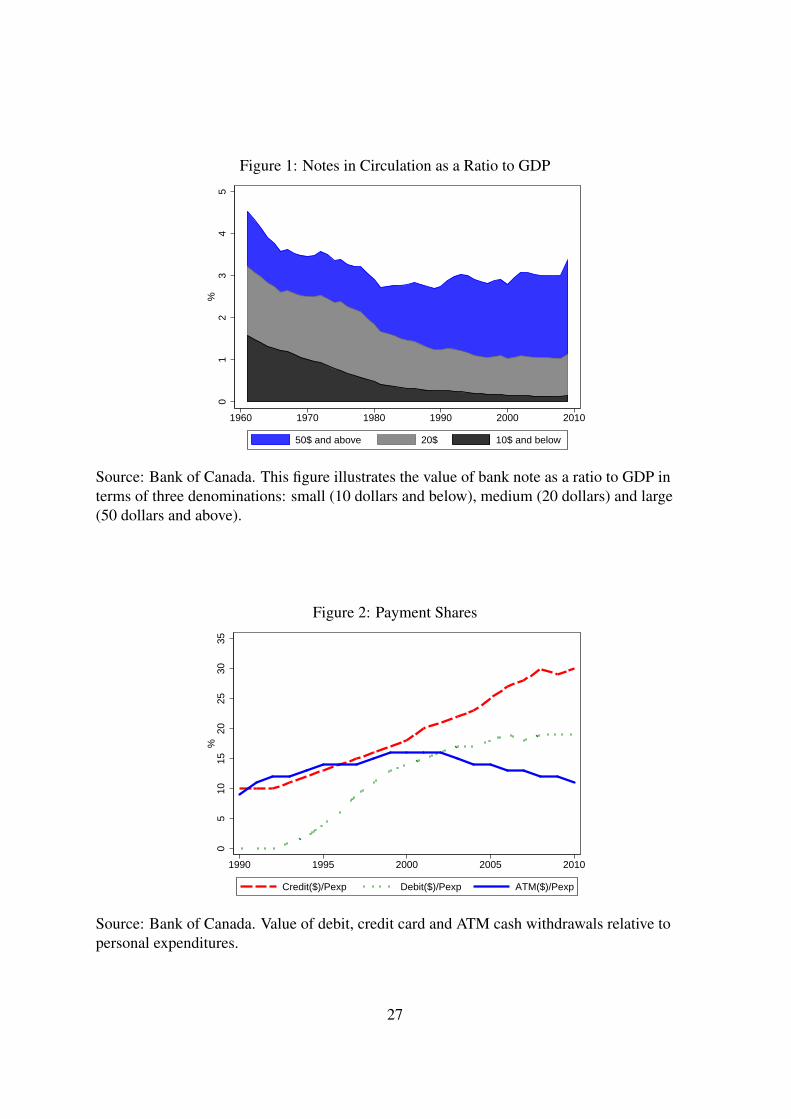
Figure 1: Notes in Circulation as a Ratio to GDP
01
23
45
%
1960 1970 1980 1990 2000 2010
50$ and above 20$ 10$ and below
Source: Bank of Canada. This figure illustrates the value of bank note as a ratio to GDP interms of three denominations: small (10 dollars and below), medium (20 dollars) and large(50 dollars and above).
Figure 2: Payment Shares
05
1015
2025
3035
%
1990 1995 2000 2005 2010
Credit($)/Pexp Debit($)/Pexp ATM($)/Pexp
Source: Bank of Canada. Value of debit, credit card and ATM cash withdrawals relative topersonal expenditures.
27
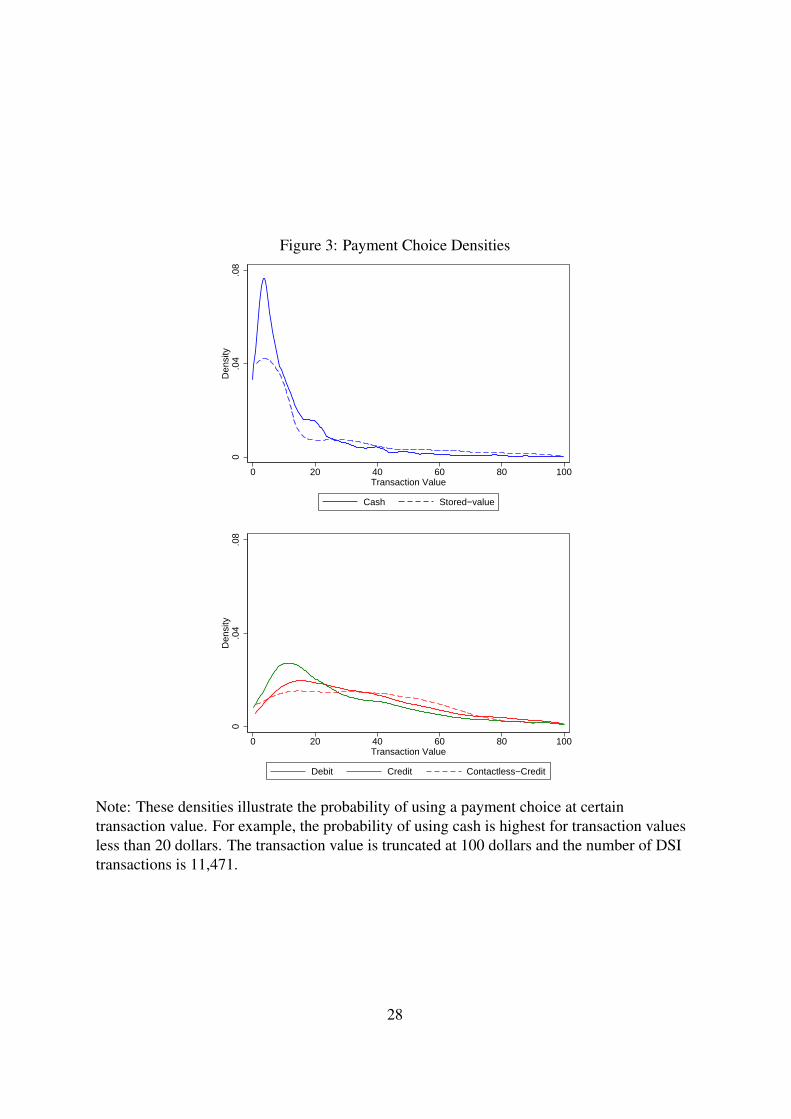
Figure 3: Payment Choice Densities0
.04
.08
Den
sity
0 20 40 60 80 100Transaction Value
Cash Stored−value
0.0
4.0
8D
ensi
ty
0 20 40 60 80 100Transaction Value
Debit Credit Contactless−Credit
Note: These densities illustrate the probability of using a payment choice at certaintransaction value. For example, the probability of using cash is highest for transaction valuesless than 20 dollars. The transaction value is truncated at 100 dollars and the number of DSItransactions is 11,471.
28
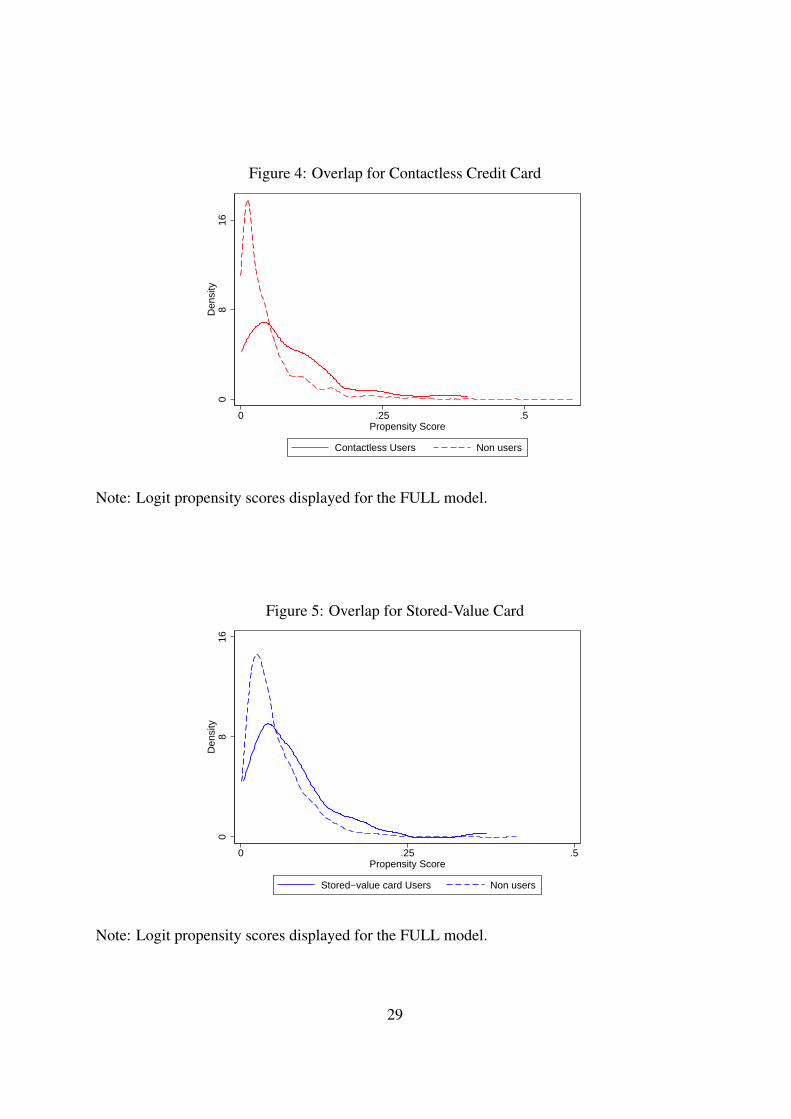
Figure 4: Overlap for Contactless Credit Card
08
16D
ensi
ty
0 .25 .5Propensity Score
Contactless Users Non users
Note: Logit propensity scores displayed for the FULL model.
Figure 5: Overlap for Stored-Value Card
08
16D
ensi
ty
0 .25 .5Propensity Score
Stored−value card Users Non users
Note: Logit propensity scores displayed for the FULL model.
29
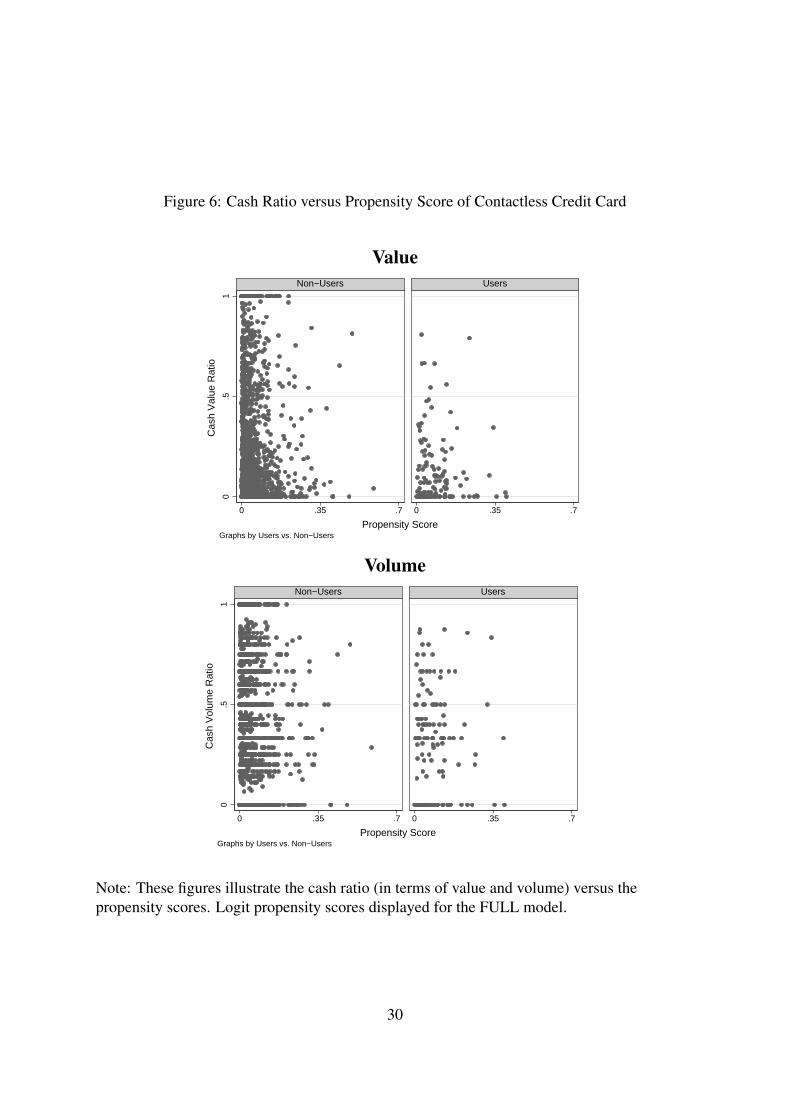
Figure 6: Cash Ratio versus Propensity Score of Contactless Credit Card
Value
0.5
1
0 .35 .7 0 .35 .7
Non−Users Users
Cas
h V
alue
Rat
io
Propensity ScoreGraphs by Users vs. Non−Users
Volume
0.5
1
0 .35 .7 0 .35 .7
Non−Users Users
Cas
h V
olum
e R
atio
Propensity ScoreGraphs by Users vs. Non−Users
Note: These figures illustrate the cash ratio (in terms of value and volume) versus thepropensity scores. Logit propensity scores displayed for the FULL model.
30
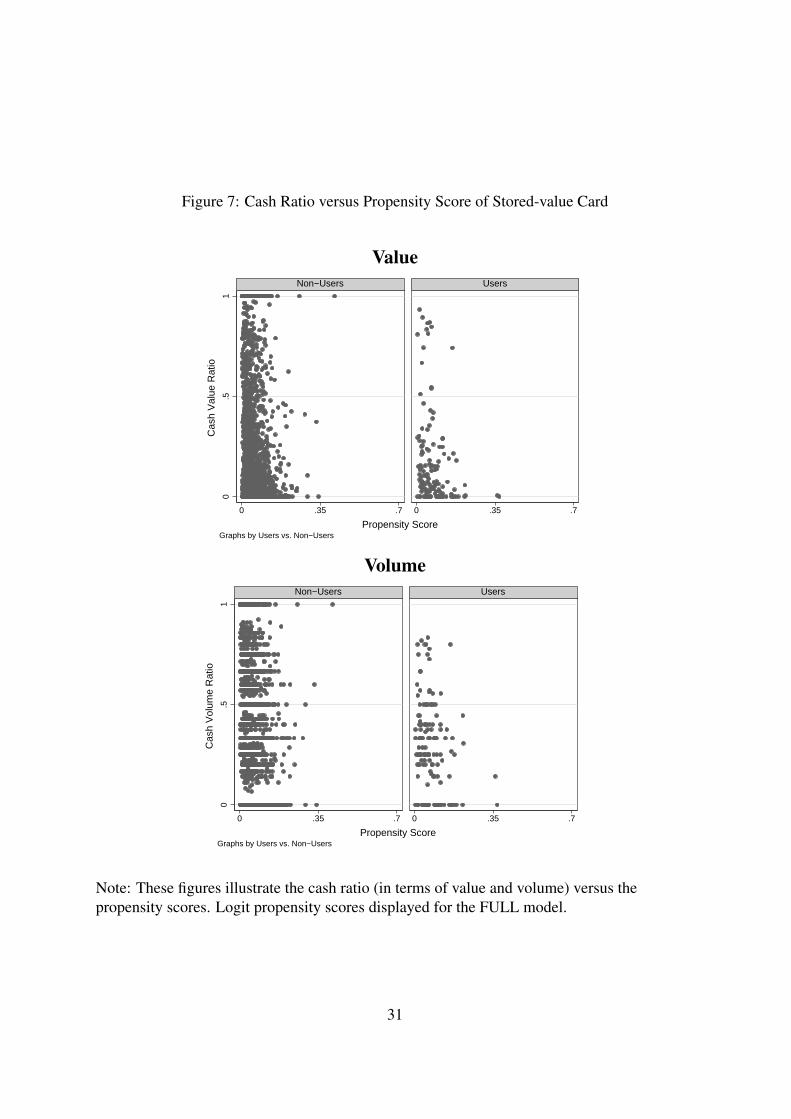
Figure 7: Cash Ratio versus Propensity Score of Stored-value Card
Value
0.5
1
0 .35 .7 0 .35 .7
Non−Users Users
Cas
h V
alue
Rat
io
Propensity ScoreGraphs by Users vs. Non−Users
Volume
0.5
1
0 .35 .7 0 .35 .7
Non−Users Users
Cas
h V
olum
e R
atio
Propensity ScoreGraphs by Users vs. Non−Users
Note: These figures illustrate the cash ratio (in terms of value and volume) versus thepropensity scores. Logit propensity scores displayed for the FULL model.
31


![[Commercial Banking Assignment] Non-Cash Payment in Vietnam](https://static.fdocuments.in/doc/165x107/547f60e6b37959582b8b5846/commercial-banking-assignment-non-cash-payment-in-vietnam.jpg)