TNB Handbook Period Ended Mar'18 with without notes 120618
38
TNB HANDBOOK Prepared by: COE Investor Relations
Transcript of TNB Handbook Period Ended Mar'18 with without notes 120618

TNB HANDBOOK
Prepared by:COE Investor Relations

CONTENTS
2
1. INTRODUCTION TO TENAGA
2. INCENTIVE BASED REGULATION (IBR)
3. BUSINESS STRATEGY & DIRECTION
4. DIVIDEND POLICY & GEARING
5. FINANCIAL HIGHLIGHTS

48%42%
10%41.2%
53.8%
4.9%
Gas & LNG Coal Hydro & Others Oil & Distillate
3
PENINSULARMALAYSIA
SARAWAK
SABAH
Sabah Electricity Sdn Bhd(A 83% TNB Subsidiary)Tenaga Nasional Bhd
24,124MW
5,092MW
1,290MW*
* Based on dependable capacity
Peninsula Installed Capacity vs. Generation mix
INSTALLED CAPACITYTNB : 54.3% @ 13,108MWIPP : 45.7% @ 11,015MW
MARKET SHARETNB : 58.6% @ 17,697.6 GwhIPP: 41.4% @ 12,501.9 Gwh
FY’16 FY’17Period Ended Dec’17
1QFY’18
Installed Capacity – Peninsula (MW)
TNB: 12,904IPP: 10,030
TNB: 12,880IPP: 10,030
TNB: 13,108IPP: 11,015
TNB: 13,108IPP: 11,015
Total units sold (Gwh)
115,505 116,586 39,562 28,347
Customers (mn)TNB: 8.6Sabah: 0.6
TNB: 8.5Sabah: 0.6
TNB: 8.4Sabah: 0.6
TNB: 8.4Sabah: 0.6
Total employees (‘000)
35.6 35.0 35.0 35.1
Total assets (RM bn)
132.9 142.0 144.3 144.8
INTRODUCTION TO TENAGA

4
INTRODUCTION TO TENAGATNB Sectoral Sales Analysis
No ofCustomer
Sales (RM) Sales (Gwh)
0.3%
38.7% 41.1%
16.7%
41.5% 34.6%82.2%
18.3% 22.3%
0.8% 1.6% 2.0%
Industrial Commercial Domestic Others
0% 20% 40% 60% 80% 100%
FY'11
FY'12
FY'13
FY'14
FY'15
FY'16
FY'17
Period Ended Dec'17
1QFY'18
44.3
43.6
42.5
42.0
41.8
39.6
39.9
40.8
41.1
33.8
34.1
34.4
34.5
34.6
35.3
35.7
35.0
34.6
20.3
20.6
21.3
21.6
21.8
23.3
22.5
22.2
22.3
1.6
1.7
1.8
1.8
1.8
1.8
1.9
2.0
2.0
Industrial Commercial Domestic Others
Sectoral Sales Analysis (Gwh)
1QFY’18
Note: TNB exclude SESB

INTRODUCTION TO TENAGAY-o-Y Growth Registered At 2.3%
5
Average demand growth for FY2016 & FY2017. This is toeliminate the one-off El-Nino phenomenon during 3QFY’16
1
PeriodGDP(%)
DemandGrowth
(%)
JAN’17-MAR’17 5.6 (0.8)
JAN’18-MAR’18 5.4 2.3
%
3.1
4.33.8
2.52.2
2.5 2.5
5.3 5.5
4.7
6.0
5.0
4.2
5.9
0
1
2
3
4
5
6
7
8
F Y ' 1 1 F Y ' 1 2 F Y ' 1 3 F Y ' 1 4 F Y ' 1 5 F Y ' 1 6 F Y ' 1 7
Demand Growth GDP
1

INTRODUCTION TO TENAGAPositive Growth for Industrial & Domestic Sector (Y-o-Y)
6
10,975 10,966 10,794 11,118 11,118
(1.1)
1.4 1.8
6.9 4.4
(25.0)(24.0)(23.0)(22.0)(21.0)(20.0)(19.0)(18.0)(17.0)(16.0)(15.0)(14.0)(13.0)(12.0)(11.0)(10.0)(9.0)(8.0)(7.0)(6.0)(5.0)(4.0)(3.0)(2.0)(1.0)0.01.02.03.04.05.06.07.08.09.0
3,000
5,000
7,000
9,000
11,000
13,000
15,000
17,000
19,000
1QFY'17 2QFY'17 3QFY'17 4QFY'17 1QFY'18
Unit Sales (Gwh) Growth (%)
Industrial
10,053 9,530 9,649 10,017 9,373
7.3
1.3
(1.6) (0.5) 0.0
(40.0)(39.0)(38.0)(37.0)(36.0)(35.0)(34.0)(33.0)(32.0)(31.0)(30.0)(29.0)(28.0)(27.0)(26.0)(25.0)(24.0)(23.0)(22.0)(21.0)(20.0)(19.0)(18.0)(17.0)(16.0)(15.0)(14.0)(13.0)(12.0)(11.0)(10.0)(9.0)(8.0)(7.0)(6.0)(5.0)(4.0)(3.0)(2.0)(1.0)0.01.02.03.04.05.06.07.08.09.010.0
3,000
5,000
7,000
9,000
11,000
13,000
15,000
17,000
19,000
1QFY'17 2QFY'17 3QFY'17 4QFY'17 1QFY'18
Unit Sales (Gwh) Growth (%)
Commercial
6,244 5,930 5,980 6,586 6,036
6.1
(0.9)
(10.7)
(2.5)
2.0
(30.0)(29.0)(28.0)(27.0)(26.0)(25.0)(24.0)(23.0)(22.0)(21.0)(20.0)(19.0)(18.0)(17.0)(16.0)(15.0)(14.0)(13.0)(12.0)(11.0)(10.0)(9.0)(8.0)(7.0)(6.0)(5.0)(4.0)(3.0)(2.0)(1.0)0.01.02.03.04.05.06.07.08.09.010.0
4,000 4,500 5,000 5,500 6,000 6,500 7,000 7,500 8,000 8,500 9,000 9,500
10,000
1QFY'17 2QFY'17 3QFY'17 4QFY'17 1QFY'18
Unit Sales (Gwh) Growth (%)
Domestic
539 531 530 545 543
9.8 6.6 7.3
11.7
2.6
(40.0)(39.0)(38.0)(37.0)(36.0)(35.0)(34.0)(33.0)(32.0)(31.0)(30.0)(29.0)(28.0)(27.0)(26.0)(25.0)(24.0)(23.0)(22.0)(21.0)(20.0)(19.0)(18.0)(17.0)(16.0)(15.0)(14.0)(13.0)(12.0)(11.0)(10.0)(9.0)(8.0)(7.0)(6.0)(5.0)(4.0)(3.0)(2.0)(1.0)0.01.02.03.04.05.06.07.08.09.010.011.012.013.014.015.0
300
400
500
600
700
800
900
1QFY'17 2QFY'17 3QFY'17 4QFY'17 1QFY'18
Unit Sales (Gwh) Growth (%)
Others

7
INTRODUCTION TO TENAGAIndustry Regulatory Framework
PRIME MINISTER/CABINET
MINISTRY of ENERGY, GREEN TECHNOLOGY AND WATER (KeTTHA)
ENERGY COMMISSION (Regulator)
- Promote competition- Protect interests of
consumers- Issue licenses- Tariff regulation
Tenaga Nasional Berhad
ECONOMIC PLANNING UNIT (EPU)- Develops and complements
Privatisation Policy- Evaluates and selects IPPs- Recommends ESI policies
Ministry of Finance/
Khazanah Nasional Berhad
Shareholders Policy Maker
Other Corporations & Govt. Agencies :
i. EPF
ii. PNB
iii. Others
Public
Holds ‘Golden’
Share
IPPs
Consumers
Foreign
SEDA Malaysia

Stable Foreign Shareholding at 24%
28.1
15.912.2
5.8
13.9
24.1
Khazanah NasionalBerhad
PermodalanNasional Bhd
Employees ProvidentFund Board
Other GovernmentAgencies
Other Corp. &Malaysian Public
Foreign
(%)
Shareholding as at Mar’18
22.81 28.28 24.38 24.06 24.13
Aug'15 Aug'16 Aug'17 Dec'17 Mar'18
Foreign Shareholding (%)
Top 10 KLCI Stocks by Market Capitalization as at Mar’18
37.5
38.5
44.8
49.3
49.8
66.1
66.3
92.0
92.7
115.5
Sime Darby Plantation
Hong Leong Bank
Maxis
Axiata
IHH Healthcare
Petronas Chemicals
CIMB
TNB
Public Bank
Maybank
+6.4%
(RM bn)
Note:1) TNB Latest Market Cap: RM90.4bn (3rd), as at 16th May 2018
8
INTRODUCTION TO TENAGA

INTRODUCTION TO TENAGAComposition of BOD
9
CHAIRMANTAN SRI LEO MOGGIE
Years of directorship: 14 years
EXECUTIVE DIRECTOR / CEODATUK SERI IR. AZMAN BIN MOHD
Years of directorship: 8 years
Independent Non-Executive Directors (Total = 5) Non-Independent Non-Executive Directors (Total =1)
AMRAN HAFIZ BIN AFFIFUDIN (Khazanah(< 1 Year)
TAN SRI DATO’ SERI CHOR CHEE HEUNG
(3 Years)
NORAINI BINTI CHE DAN(2 Years)
JUNIWATI BINTI RAHMAT HUSSIN
(< 1 Year)
BADRUL ILAHAN BIN ABD JABBAR
(< 1 Year)
GEE SIEW YOONG
(2 Years)

CONTENTS
10
1. INTRODUCTION TO TENAGA
2. INCENTIVE BASED REGULATION (IBR)
3. BUSINESS STRATEGY & DIRECTION
4. DIVIDEND POLICY & GEARING
5. FINANCIAL HIGHLIGHTS

INCENTIVE BASED REGULATION (IBR) A Mechanisms For Tariff Setting With Incentives To Improve Efficiency & Greater Transparency
*Source: EC
The Economic Regulatory Framework for Regulating TNB
The Tariff Setting Mechanism and Principles for Tariff Design
Incentive Mechanisms to Promote Efficiency and Service Standards
The Process of Tariff Reviews
Creation of Regulatory Accounts and Its Annual Review Process
IBR mechanism to strengthen the following:
Business entities under IBR (Accounting Separation)
11
Reg
ula
ted
Non
-R
egula
ted

INCENTIVE BASED REGULATION (IBR)Imbalance Cost Pass-Through (ICPT) Mechanisms Ensures TNB Remain Neutral
12*Source: EC
• Reviewed every 6 months
d) Reviewed every 3 years
39.45

13
INCENTIVE BASED REGULATION (IBR)Imbalance Cost Pass-Through (ICPT) Comprises Two Components
Imbalance Cost Pass-Through (ICPT)
Fuel Cost Pass Through (FCPT)
Generation Specific Cost Adjustment
(GSCPT)
Adjustment in the following 6 month period, subject to
government approval
FCPT (gas/LNG and coal
only)
Actual cost of generation
Adjustment in the following 6 month period, subject to
government approval
Changes in:• Other fuel costs such as distillate and fuel oil• All costs incurred by SB under the power
procurement agreements (PPAs, SLAs and etc.) and fuel procurement agreements (CSTA, CPC, GFA/GSA and etc.)
• Renewable energy FiT displaced cost
Changes in gas/LNG and coal costs
PPAsSLAs CSTA CPCGFAGSA
Power Purchase AgreementsService Level AgreementsCoal Supply and Transportation AgreementCoal Purchase ContractGas Framework AgreementGas Supply Agreement

INCENTIVE BASED REGULATION (IBR)Total of RM6.3 Billion ICPT Rebate Approved as at Dec 2017
*Source: EC 14

15
INCENTIVE BASED REGULATION (IBR)New Features in Electricity Tariff Review for RP2 (2018-2020)
*Has yet to be approved and finalized by regulator
*

INCENTIVE BASED REGULATION (IBR)IBR Entities
In RP1, these 2 entity are grouped as Price –Cap entity
1
1
16

INCENTIVE BASED REGULATION (IBR)New Base Tariff Under IBR Mechanism RP2
17
EntitiesSingle Buyer Grid
System Operator
Transmission Distribution Base TariffGeneration Operation
RP1(sen/kWh) 26.76 0.19 0.05 3.66 7.87 38.53
Variance (sen/kWh) +0.29 -- +0.01 +0.37 +0.24 +0.92
8.11
(69%) (0.5%) (0.2%) (10%)
(2%)(18%)

RP2 Parameters
No Item RP1 RP2
1. WACC 7.5% 7.3%
2.
Avg.Regulated
Asset Based (RAB)
Closing RABRM43.6 bn
Avg. RAB in 2020RM54.8 bn
3. CAPEXClosing CAPEX
RM15.7 bnApproved CAPEX
RM18.8 bn*
4. OPEXClosing OPEXRM16.9 bn
Approved OPEX RM18.2 bn
18
INCENTIVE BASED REGULATION (IBR)
@ 1,000mmbtu
* Special Projects approved are as follows:
• Development of Advanced Metering Infrastructure (AMI) involving installation of 1.5 million smart meters
• Development of additional fibre optic network to enhance security and reliability of electricity supply
• Installation of 367,000 energy efficient LED street lighting in major cities
RP2 Forecasted Gas Utilization: 840 mmscfd

INCENTIVE BASED REGULATION (IBR)Generation & Customer Mix
19
Made possible by improved coal plants performance and additional commissioning of coal plants.
Changes in Customer Mix (%) in RP1 (2015-2017)
Generation Mix RP1 vs RP2
61%
33%
4%
1% 1%0.1%
Coal
Gas
Hydro
RE
LTM
LSS
RP2
RP2 Forecasted Demand Growth: 1.8 – 2.0%

CONTENTS
20
1. INTRODUCTION TO TENAGA
2. INCENTIVE BASED REGULATION (IBR)
3. BUSINESS STRATEGY & DIRECTION
4. DIVIDEND POLICY & GEARING
5. FINANCIAL HIGHLIGHTS

21
TNB 2025 GROWTH ASPIRATION Aspire to Grow our EBIT to RM20.0 billion by 2025 through Domestic & International Investment

22
3 STRATEGIC PILLARS
SHAPING SUSTAINABLE FUTUREOur Strategic Plan

23
EXPANDING GLOBAL FOOTPRINT TO ACHIEVE ASPIRATIONTNB is currently present in more than 5 countries
REMACO O&M Services for Shuaibah IWPP
IWPP: Shuaibah 900MW Power880,000 m3 / day water
150,000 m3 / day water
IPP: Liberty Power Ltd 235MW
IPP, IWPP & Development Projects
Supply & Services
REMACO O&M for Shuaiba North Co-Gen 780MW Power;
204,000 m3 / day water (Kuwait)
Development of the Sumatera – Peninsular Malaysia HVDC Interconnection, coal-fired
power plant & coal mine mouth projects
REMACO O&M services for Bong Hydro Plant in Pakistan
REMACO O&M for 225MW Sabiya Power Generation &
Water Distillation Plant (Kuwait)
30% equity ownership
in GAMA Enerji A.S.
Equity ownership
REMACO O&M for 210MW Doha West Power Generation
& Water Distillation Plant (Kuwait)
30% equity ownership
in GMR Energy Limited
REMACO O&M services for 1,223 MW Balloki Power Plant in
Pakistan
50% equity ownership
in Vortex Solar Investments S.a.r.l..80% equity ownership
in Operational Onshore Wind Portfolio in UK

16
INTERNATIONAL ACQUISITIONFour International Acquisitions to Support Aspiration
Equity interest of GAMA Enerji A.S.
30%
Assets include a 840MW natural gas-fired plant and 117.5MW wind plants
Equity interest of GMR Energy Limited.
30%
Assets include 2,298MW coal, gas andsolar plants.
Equity interest of Vortex SolarInvestments S.a.r.l.
50%
Assets include 24 operational solar PVFarm across England and Wales with netinstalled capacity of about 365MW
Vortex Solar UK
Equity interest of GVO Wind Limited &Blumerang Capital Limited
80%
Assets include 53 operational onshoremedium wind turbines with a totalcombined capacity of 26.1MW
Tenaga Wind Ventures
24

Evolution on National Energy Policies
2013 : 33%8th Malaysia Plan (2001-2005)
•RE as the fifth fuel•Target: 5% RE in energy mix
9th Malaysia Plan (2006-2010)
•RE Grid-connectivity•Target: Peninsula 300 MW Sabah 50 MW
10th Malaysia Plan (2011-2015)
•RE installed capacity•Target: 985 MW of RE by 2015
11th Malaysia Plan (2016-2020)
Reduction in GHGs emission intensity of GDP compared to 2005 level
Formulation of a comprehensive demand side management master plan
In renewable energy installed capacity by 2020 (7.5% energy mix)
As at Mar 2018: 456MW
• Minimise negative impacts on the environment
• Promote efficient utilisation of energy
• Green Technology as the driver to accelerate the national economy
• Promote Sustainable Development
Government Green Development Plan
25
RENEWABLE GENERATIONGovernment Green Policy & Initiatives

TNB Green Policy
“TNB is committed to support the national green agenda and minimise the environmental impact of our business by applying sustainable, efficient operations and
delivering green energy through the application of appropriate technologies and investments”
1,700MW
TNB RE Targets by 2025
26
BUILDING RENEWABLE ENERGY PORTFOLIO FOR BETTER FUTURETNB Green Policy & Initiatives
As at to date:International - 280MW
Domestic - 80MW
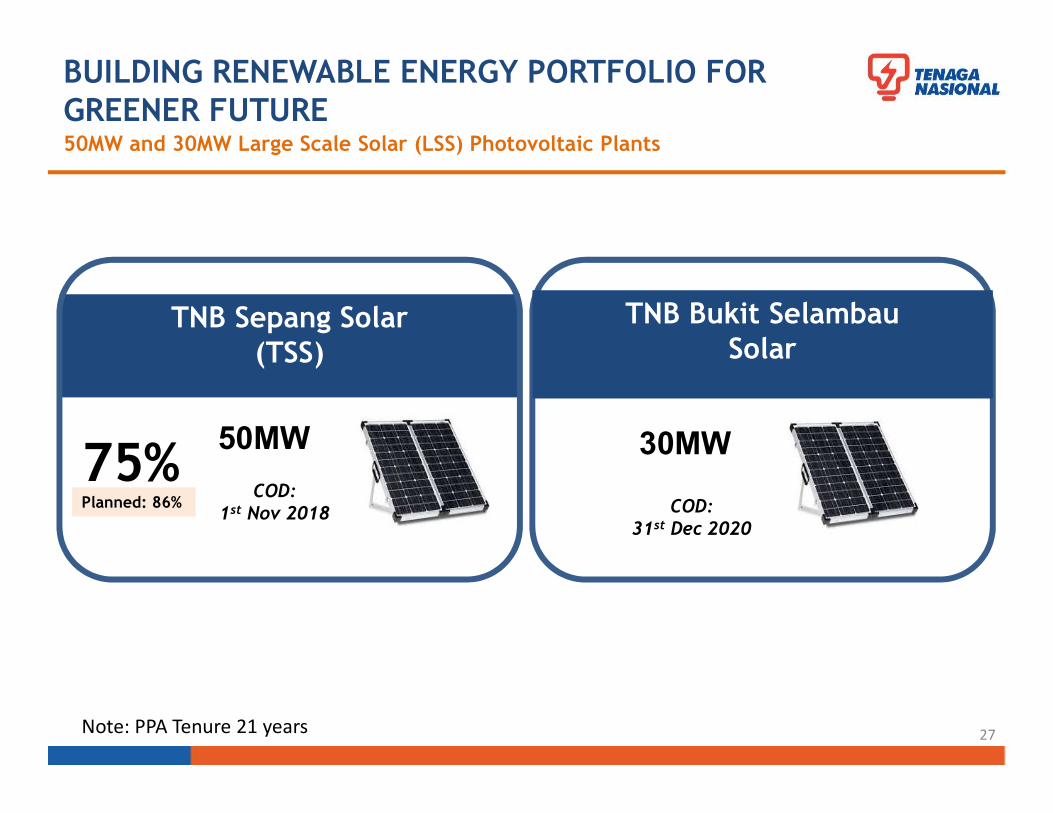
BUILDING RENEWABLE ENERGY PORTFOLIO FOR GREENER FUTURE50MW and 30MW Large Scale Solar (LSS) Photovoltaic Plants
27Note: PPA Tenure 21 years
50MW
COD:1st Nov 2018
TNB Sepang Solar(TSS)
75%Planned: 86%
30MW
COD:31st Dec 2020
TNB Bukit SelambauSolar

28
OTHER GENERATION PROJECTS
2,000MW
COD:U1: 15th Jun 2019 U2: 15th Dec 2019
Jimah East Power(Coal)
87% 1,440MW
COD:1st July 2020
Southern Power Generation(Gas)
28%Planned: 87% Planned 23.5%
2,000MW Coal-Fired Plant and 1,440MW Gas-Fired Plant

CONTENTS
29
1. INTRODUCTION TO TENAGA
2. INCENTIVE BASED REGULATION (IBR)
3. BUSINESS STRATEGY & DIRECTION
4. DIVIDEND POLICY & GEARING
5. FINANCIAL HIGHLIGHTS

30
FY2017 MARKS THE HIGHEST DIVIDEND PAYOUT TO DATEContinue to Maximise Shareholders Value Through Consistent and Sustainable Dividend Payout Ratio at 50%
Dividend Policy
Distribution of dividend is based on 30% to 60% dividend payout ratio, based on the reported Consolidated
Net Profit Attributable to Shareholders After Minority Interest, excluding Extraordinary, Non-Recurring items
25.0 29.0 29.0 32.0
61.0
21.4
FY2013 FY2014 FY2015 FY2016 FY2017 Period EndedDec'17
26.1% 25.5% 27.0% 24.7%
50.0% 50.0%Dividend Payout (PATAMI)
Dividend Paid Per Share (sen)
Based on 30-50% of Company Free Cash Flow
Based on 30-60% of Group PATAMI

33.4
5.72.5
0.7
32.8
6.02.5
0.1
RM USD YEN OTHERS
Mar-18 Dec-17 Total Debt 42.3
Net Debt 27.1
Gearing 41.9
Net Gearing 26.9
Fixed : Floating 95:5
Final Exposure 96:4
Weighted Average Cost of Debt 4.97
Final Exposure 4.96
Statistics (%) 31st Mar'18
Closing FOREX 31st Mar’18
USD/RM 3.86
100YEN/RM 3.64
USD/YEN 106.04* Net Debt excludes deposits, bank and cash balances & investment in UTF
78.9%
13.5%
5.9%
1.7%
RM Billion
31
GEARING LEVEL REGISTERED AT 42%Optimum Capital Structure at 55%

CONTENTS
32
1. INTRODUCTION TO TENAGA
2. INCENTIVE BASED REGULATION (IBR)
3. BUSINESS STRATEGY & DIRECTION
4. DIVIDEND POLICY & GEARING
5. FINANCIAL HIGHLIGHTS

33
FINANCIAL HIGHLIGHTSEncouraging Outlook for 2018
3.79 3.49
4.30
3.89 3.86
4.22
1QFY'17
2QFY'17
3QFY'17
4QFY'17
PENov'17
1QFY'18
EBITDA (RM bn)
34.2% 31.2% 33.7% 31.2% 34.4%
11.24 11.16 12.55 12.46
11.61 12.27
1Q FY'17
2QFY'17
3QFY'17
4QFY'17
PE Nov'17
1QFY'18
Revenue (RM bn)
33.3%
**
*Period Sept-Nov 2017

34
FINANCIAL HIGHLIGHTSEncouraging Outlook for 2018
Normalized PAT (RM bn)
1.69
1.22
1.51
1.65
1.47
1.71
1QFY'17
2QFY'17
3QFY'17
4QFY'17
PENov'17
1QFY'18
1.79
1.44
1.951.75
2.16 2.12
1QFY'17
2QFY'17
3QFY'17
4QFY'17
PENov'17
1QFY'18
PAT (RM bn)
* *
*Period Sept-Nov 2017

35
FINANCIAL HIGHLIGHTSTechnical Indicators
Distribution SAIDI
11.7 mins0.04 mins
Transmission System Minutes
92.9%
EquivalentPlant Availability
Factor (EAF)

DISCLAIMER
All information contained herein is meant strictly for the use of this presentation only
and should not be used or relied on by any party for any other purpose and without the
prior written approval of TNB. The information contained herein is the property of
TNB and it is privileged and confidential in nature. TNB has the sole copyright to such
information and you are prohibited from disseminating, distributing, copying,
re-producing, using and/or disclosing this information.

CONTACT DETAILS
CoE INVESTOR RELATONSGROUP FINANCE DIVISIONTenaga Nasional Berhad4th Floor, TNB HeadquartersNo.129, Jalan Bangsar,59200 Kuala Lumpur, MALAYSIATel : +603 2296 6748Fax : +603 2284 0095Email : [email protected] : www.tnb.com.my
IR OFFICERS:
Anis Ramli +603 2296 6821 [email protected] Norliyana +603 2296 6698 [email protected] Khan +603 2296 6951 [email protected]
For further enquiries, kindly contact us at:

THANK YOU