Building Spark Streaming Pipelines with Cask Hydrator, by Gokul Gunasekaran, Cask

TN 68 TRANSPORT PACKAGING
APPENDIX 2.10.1
TABLE OF CONTENTS
Page
2.10.1 STRUCTURAL EVALUATION OF CASK BODY
2.10.1.1 Introduction ...................................................................................... 2.10.1-1
2.10.1.2 ANSYS M odel ................................................................................. 2.10.1-1
2.10.1.3 Axisymmetric Loadings .................................................................. 2-10.1-3
2.10.1.4 Asymmetric Loading ........................................................................ 2.10.1-8
2.10.1.5 Transport Shock Loading ............................................................... 2.10.1-18
2.10.1.6 Transport Vibration Loading .......................................................... 2.10.1-19
2.10.1.7 Transport Tie-Down Loading ......................................................... 2.10.1-20
2.10.1.8 6 G Lifting ...................................................................................... 2.10.1-20
2.10.1.9 Summary of Individual Load Cases ............................................... 2.10.1-21
2.10.1.10 Trunnion Local Stress Analysis ..................................................... 2.10.1-22
2.10.1.11 References ...................................................................................... 2.10.1-24
Rev. 0 4/992.10.1-i

LIST OF TABLES
2.10.1-4A Individual Load Cases for TN-68 Cask Body Analysis 2.10.1-4B Trunnion Loads 2.10.1-1 Bolt Pre-Load and Gasket Seating Pressure 2.10.1-2 Bolt Pre-Load and Gasket Seating Pressure 2.10.1-3 Fabrication Stresses 2.10.1-4 Fabrication Stresses 2.10.1-5 Internal Pressure (100 psi) 2.10.1-6 Internal Pressure (100 psi) 2.10.1-7 External Pressure (25 psi) 2.10.1-8 External Pressure (25 psi) 2.10.1-9 End Drop on Bottom - Rear Impact Limiter (1 G) 2.10.1-10 End Drop on Bottom - Rear Impact Limiter (1 G) 2.10.1-11 End Drop on Lid - Front Impact Limiter (I G) 2.10.1-12 End Drop on Lid - Front Impact Limiter (IG) 2.10.1-13 Thermal Stress at 1000 F Hot Environment 2.10.1-14 Thermal Stress at 100' F Hot Environment 2.10.1-15 Thermal Stress at -20* F Environmental Conditions 2.10.1-16 Thermal Stress at -20' F Environmental Conditions 2.10.1-17 Thermal Stress at -40' F Environmental Conditions 2.10.1-18 Thermal Stress at -40' F Environmental Conditions 2.10.1-19 Transport Shock Load/Truck,
Horizontal Cask Supported at Rear Trunnions and Front Saddle, (Stress at 1800 Orientation)
2.10.1-20 Transport Shock Load / Truck, Horizontal Cask Supported at Rear Trunnions and Front Saddle, (Stress at 1800 Orientation)
2.10.1-21 1G Down Load, Horizontal Cask Supported at Rear Trunnions and Front Saddle, (Stress at 180' Orientation)
2.10.1-22 1G Down Load Horizontal Cask Supported at Rear Trunnions and Front Saddle, (Stress at 1800 Orientation)
2.10.1-23 Side Drop (1G), (Stress at 900 Orientation) 2.10.1-24 Side Drop (IG), (Stress at 90' Orientation) 2.10.1-25 Side Drop (IG), (Stress at Impact Side 180" Orientation) 2.10.1-26 Side Drop (IG), (Stress at Impact Side 1800 Orientation) 2.10.1-27 C.G. Over Bottom Comer Drop - Rear Impact Limiter (1G),
(Stress at 900 Orientation) 2.10.1-28 C.G. Over Bottom Comer Drop - Rear Impact Limiter (IG),
(Stress at 90' Orientation)
Rev. 0 4/992.10.1-ii

LIST OF TABLES (Continued)
2.10.1-29 C.G. Over Bottom Comer Drop - Rear Impact Limiter (IG),
(Stress at Impact Side, 1800 Orientation) 2.10.1-30 C.G. Over Bottom Comer Drop - Rear Impact Limiter (IG),
(Stress at Impact Side, 1800 Orientation) 2.10.1-31 C.G. Over Lid Comer Drop - Front Impact Limiter (1G),
(Stress at 90' Orientation) 2.10.1-32 C.G. Over Lid Comer Drop - Front Impact Limiter (IG),
(Stress at 900 Orientation) 2.10.1-33 C.G. Over Lid Comer Drop - Front Impact Limiter (IG),
(Stress at Impact Side, 180' Orientation) 2.10.1-34 C.G. Over Lid Comer Drop - Front Impact Limiter (IG),
(Stress at Impact Side, 180' Orientation)
2.10.1-35 150 Slap Down Drop - Second Impact (Gnornial = 42.22, Grotational = 77.78),
(Stress at 900 Orientation) 2.10.1-36 150 Slap Down Drop - Second Impact
(Gnormal = 42.22, Grotationai = 77.78), (Stress at 90' Orientation)
2.10.1-37 150 Slap Down Drop - Second Impact (Gno.ma = 42.22, Grotational = 77.78),
(Stress at Impact Side, 1800 Orientation)
2.10.1-38 150 Slap Down Drop - Second Impact
(Gnorml = 42.22, Grotationa = 77.78), (Stress at Impact Side, 1800 Orientation)
2.10.1-39 Fire Accident 2.10.1-40 Fire Accident 2.10.1-41 1 g Longitudinal Loading, Horizontal Cask Held at Rear Trunnions and
Front Saddle 2.10.1-42 1 g Longitudinal Loading, Horizontal Cask Held at Rear Trunnions and
Front Saddle 2.10.1-43 Transport Truck Vibration Load (0.3g Long., 0.3g Lat., 0.6g Vert.),
Horizontal Cask Held at Rear Trunnions and Front Saddle
2.10.1-44 Transport Truck Vibration Load (0.3g Long., 0.3g Lat., 0.6g Vert.),
Horizontal Cask Held at Rear Trunnions and Front Saddle
2.10.1-45 Transport Tie-Down Load (10g Long., 5g Lat., 2g Vert.),
Horizontal Cask Held at Rear Trunnions and Front Saddle
2.10.1-46 Transport Tie-Down Load (log Long., 5g Lat., 2g Vert.),
Horizontal Cask Held at Rear Trunnions and Front Saddle
2.10.1-47 6g Lifting Load on Trunnion (Cask Vertical) 2.10.1-48 6g Lifting Load on Trunnion (Cask Vertical)
2.10.1-49 Local Stresses at Rear Trunnion / Cask Body Interface with lg Down
Load (Cask Horizontal)
Rev. 0 4/992.10.1-iii

LIST OF TABLES (Continued)
2.10.1-50 Local Stresses at Rear Trunnion / Cask Body Interface with Ig Down Load (Cask Horizontal)
2.10.1-51 Local Stresses at Rear Trunnion / Cask Body Interface with Truck Shock Loads (Cask Horizontal)
2.10.1-52 Local Stresses at Rear Trunnion / Cask Body Interface with Truck Shock Loads (Cask Horizontal)
2.10.1-53 Local Stresses at Rear Trunnion / Cask Body Interface with Vibration Loads (Cask Horizontal)
2.10.1-54 Local Stresses at Rear Trunnion / Cask Body Interface with Vibration Loads (Cask Horizontal)
2.10.1-55 Local Stresses at Rear Trunnion / Cask Body Interface with Tie-Down Loads (Cask Horizontal)
2.10.1-56 Local Stresses at Rear Trunnion / Cask Body Interface with Tie-Down Loads (Cask Horizontal)
2.10.1-57 Local Stresses at Rear Trunnion / Cask Body Interface with 6g Lifting Load (Cask Vertical)
2.10.1-58 Local Stresses at Rear Trunnion / Cask Body Interface with 6g Lifting Load (Cask Vertical)
2.10.1-59 Local Stresses at Rear Trunnion / Cask Body Interface with Rail Car Shock Loads (Cask Horizontal)
2.10.1-60 Local Stresses at Rear Trunnion / Cask Body Interface with Rail Car Shock Loads (Cask Horizontal)
2.10.1-61 Transport Rail Car Shock Load (4.7g All Directions) Horizontal Cask Held at Rear Trunnions and Front Saddle
2.10.1-62 Transport Rail Car Shock Load (4.7g All Directions) Horizontal Cask Held at Rear Trunnions and Front Saddle
2.10.1-63 Bijlaard Computation Sheet
2.10.1-iv Rev. 0 4/99

LIST OF FIGURES
2.10.1-1 2.10.1-2 2.10.1-3 2.10.1-4 2.10.1-5 2.10.1-6 2.10.1-7 2.10.1-8 2.10.1-9 2.10.1-10 2.10.1-11 2.10.1-12 2.10.1-13 2.10.1-14 2.10.1-15 2.10.1-16 2.10.1-17 2.10.1-18 2.10.1-19 2.10.1-20 2.10.1-21
2.10.1-22 2.10.1-23 2.10.1-24
2 Rev. 0 4/99
Cask Body Key Dimensions Cask Body Finite Element Model Cask Body Bottom Corner Cask Body Top Comer Cask Lid to Shield Plate Connection Bolt Preload and Seal Reaction Design Internal Pressure (100 psi)
External Pressure Loading (25 psi)
Impact at Bottom End Load Distribution Impact at Lid End Load Distribution
1G Longitudinal Supported by Two Rear Trunnions
Fourier Coefficients for 1 G Lateral
Location of C.G., Trunnions, Saddle, and Impact Limiters
1G Vertical Down, Supported by Two Rear Trunnions and Front Saddle
Side Drop Load Distribution C.G. Over Bottom Corner Drop Load Distribution
C.G. Over Lid End Corner Drop Load Distribution Transverse g Load Combinations
Combined g Load Used for 30 Foot 15' Slap Down Structural Analysis
150 Slap Down (Second Impact at Lid End) Load Distribution
15' Slap Down (Second Impact at Lid End) Rotational Quasistatic
Equilibrium Standard Reporting Locations for Cask Body Weld Stress Locations Lifting: 6g Vertical Up
2.10.1-v

THIS PAGE IS INTENTIONALLY LEFT BLANK.
Rev. 0 4i99
APPENDIX 2.10.1
STRUCTURAL EVALUATION OF CASK BODY
2.10.1.1 Introduction
This appendix presents the structural analyses of the TN-68 cask body including the cylindrical
shell assembly and bottom assembly, the lid, and the local stress at the trunnion / cask body
interface. The specific methods, models and assumptions used to analyze the cask body for the
various individual loading conditions specified in 10CFR71.71(') and 10CFR71.73(2) are
described. Stress results are reported at selected locations for each load case. Maximum stresses
from this appendix are evaluated in Sections 2.6 and 2.7 of Chapter Two where the load
combinations outlined in Regulatory Guide 7.0(3) are performed and the results evaluated against
the ASME Code(4) and Regulatory Guide 7.6(5) design criteria described in Section 2.1.2.
The TN-68 cask body structural analyses generally use static or quasistatic linear elastic methods
so that combinations of loads can be examined by superimposing the results from individual
loads. The stresses and deformations due to the applied loads are generally determined using the
ANSYS( 6) computer program.
The detailed calculations for the lid bolts are presented in Appendix 2.10.2. The calculations for
the outer shell are reported in Appendix 2.10.3. Stress evaluations of the lifting and tie-down
devices are described in Section 2.6 of Chapter 2. The evaluation of the cask body under the 40
inch puncture event is described in Section 2.7.2.
The two analysis methods described in this appendix and used to evaluate the cask body for the
individual loading conditions are:
"° ANSYS Analysis - Axisymmetric and Asymmetric Loads
"0 Bijlaard Trunnion Local Stress Analysis
The Bijlaard(7) trunnion local stress analysis is performed to determine the local stresses in the
gamma shield shell at locations that correspond to stress reporting locations selected for the
ANSYS analyses. This permits the localized trunnion induced stresses to be easily combined
with stresses obtained from appropriate ANSYS load cases. The method of combining stress
results from individual load cases to evaluate the required load combinations is discussed in
Section 2.6 of Chapter Two for normal conditions of transport and Section 2.7 for hypothetical
accident conditions.
2.10.1.2 ANSYS Analysis
Geometry Description
The cask body as shown in Figure 2.10.1-1 consists of:
Rev. 0 4/992.10.1-1

1. A 1 1/2 in. thick inner vessel with a welded flat bottom, a flange welded at the top, and a lid bolted to the flange by 48, 1.875 in. diameter high strength bolts and sealed with two metallic o-rings. This is the containment vessel, the primary containment boundary of the cask.
2. A thick cylindrical vessel with a welded flat bottom surrounding the containment. This vessel and a steel disk welded to the lid inner surface provide the gamma shielding.
The lid and the flange are carbon steel forgings as are the gamma shielding components. The cask body is designed as a Class 1 component in accordance with the rules of the ASME Code.
ANSYS Cask Model
A two dimensional ANSYS model is used to evaluate the stresses in the cask body due to the individual load cases. The finite elements used in the model are the axisymmetric shell element, SHELL 61, and the axisymmetric harmonic element, PLANE 25. Both of these elements consider axisymmetric and non-axisymmetric loadings.
The cylindrical containment shell and bottom are modeled using SHELL 61 elements. The remainder of the cask body is modeled with PLANE 25 elements except for the lid bolts which are modelled with the two dimensional elastic beam, BEAM 3. The finite element model of the cask body is shown in Figure 2.10.1-2.
Figure 2.10.1-3 shows an enlarged view of the bottom comer with the weld joining the gamma shielding flat bottom to cylinder simulated by coupling nodes 236-107 and 280-108.
The weld connecting the gamma shielding cylinder to the containment flange is simulated by coupling nodes 63-328 and 64-329 as shown in Figure 2.10.1-4. The gamma shielding is heated prior to assembly with the containment shell and flange for ease of installation. During cooldown, a gap may result between the flange and the gamma shield shell. The gap is filled with shim plates made from SA-516, Grade 70 plate. The plates are fit between the gamma shield shell and the flange behind the weld. These shim plates are not modeled. The weld between the gamma shield and the flange is not affected by the shims. Also shown in this figure are the lid bolts connecting the lid to the containment flange. The connection is simulated by coupling nodes 505, 506 and 507 of the bolts to the corresponding nodes 81, 74, and 67 of the flange; and nodes 501, 502 and 503 of the bolts to the corresponding nodes 438, 439, and 440 of the lid. In this manner the threaded portion of the bolt is fixed to the flange while the bolt head is fixed to the top surface of the lid. In order to prevent the lid from moving into the flange, nodes 79 and 395 are also coupled in the axial or Y direction. The enlarged view in Figure 2.10.1-5 shows the coupling of nodes 394-383 and 395-384 which simulates the weld connecting the containment lid to the gamma shielding disk.
The pairs of nodes listed above, with the exception of nodes 79-395, are coupled in the X, Y and Z directions. The coupling of nodes 79-395 is in the Y direction only. Nodes 80-396 and 82-398 are also coupled in Y-direction. This is accomplished using constraint equations. The reactions
Rev. 0 4/992.10.1-2

at these nodes are monitored during the analysis to insure that tensile forces between the flange
and the lid are not developed.
Appropriate boundary conditions are applied to prevent rigid body motion and to show that the
system of forces applied to the cask in each of the individual load cases is in equilibrium.
Generally a node at the center of the vessel bottom is held in all directions and all nodes at the
center line are held in the X direction. Node 78 (Figure 2.10.1-4) is held in the Z direction to
avoid rigid body motion.
Loading Conditions
The loading conditions analyzed simulate or represent various effects due to the normal
conditions of transport and hypothetical accident conditions specified in 1 OCFR7 1. These
individual loading conditions, called load cases, are superimposed or combined as specified in
Regulatory Guide 7.8 in Sections 2.6 and 2.7 of this SAR.
2.10.1.3 Axisvmmetric Loadings
The following individual axisymmetric load cases analyzed using this ANSYS model are
described in this section.
(1) Bolt preload and lid seating pressure
"(2) Internal pressure loading
(3) External pressure loading
(4) 30 foot end drop on bottom (Rear Impact Limiter)
(5) 30 foot end drop on lid (Front Impact Limiter)
(6) Thermal stresses for hot environment at 100°F ambient temperature
(7) Thermal stresses for cold environment at -20'F ambient temperature
(8) Thermal stresses for cold test at -40'F ambient temperature
(9) Thermal accident condition
(10) Fabrication stress
(11) 1G in the longitudinal direction with the cask axis horizontal, held at the rear trunnions and
supported at the front saddle
Rev. 0 4/992.10.1-3
Since the individual load cases are linearly elastic, their results can be scaled and superimposed as required in order to perform the normal and hypothetical accident condition load combinations. The load combination approaches for these cases are described in Sections 2.6 and 2.7. The magnitudes of the loads used in each individual load case analysis are computed as described in the following paragraphs:
Detailed stresses and displacements in the ANSYS model of the cask body are obtained and stored (on magnetic tape) for every node location for each individual load case. These stored results are postprocessed to printout the stresses at the 39 standard locations on the cask body structure shown in Figures 2.10.1-22 and 2.10.1-23. The locations selected as shown in Figures 2.10.1-22 and 2.10.1-23 are key points that, when carefully studied, indicate the behavior of the entire structure. The maximum stress may occur at a different location for each individual load.
1. Bolt Preload and Lid Seating Pressure
A lid bolt preload corresponding to 86,000 psi direct stress (actual stress is 56,000 psi) in the bolt shank is simulated by specifying an initial strain in the elements representing the bolts. A portion of this strain becomes elastic preload strain in the bolts, and a portion becomes strain in the clamped parts. The required initial strain value of 0.00331 in/in (in the bolts) was determined by trial and error.
The selected bolt preload is sufficient to insure a full seating of the metallic seals under a maximum design internal pressure of 100 psig. The metallic seal seating load is 1,399 lb./in./seal(8 ) or 2,798 lb./in. for 2 seals. This load is simulated by applying a pressure of 3,498 psi on an annular ring on both the containment lid and flange surfaces as shown in Figure 2.10.1-6. The stress intensities from the ANSYS run at the selected locations of the containment vessel and gamma shield are presented in Tables 2.10.1 -1 and 2.
2. Internal Pressure Loading
An internal pressure of 100 psig is applied to the cavity surface as shown in Figure 2.10.1-7. The stress intensities from the ANSYS run at the selected locations of the containment vessel and gamma shield are presented in Tables 2.10.1-5 and 6.
3. External Pressure Loading
An external pressure of 25 psig is applied to the outer surface of the cask body as shown in Figure 2.10.1-8. The stress intensities from the ANSYS run at the selected locations of the containment vessel and gamma shield are presented in Tables 2.10.1-7 and 8.
4. 30 Foot End Drop on Bottom (Rear Impact Limiter)
The dynamic analysis described in Appendix 2.10.8 determined the inertial loads on the TN-68 packaging for a 30 foot end drop onto an unyielding surface. That analysis concluded that the maximum axial deceleration is 66 G for this case. A static elastic analysis of the cask is performed for a unit load (1 G) with inertial forces balanced by the
Rev. 0 4/992.10.1-4

impact force. The results of this elastic analysis will be ratioed up for the actual G load in
the load - combination runs. Since the payload or cargo and the impact limiters are not
included in the model, their loading effects are simulated as distributed pressures applied
on the cask at the appropriate locations. The contacting impact limiter force on the cask is
applied as the reaction pressure on the bottom required to balance the inertial forces of the
system. Thus, the cask body vessel is in equilibrium under the applied forces. The system
of forces on the cask body is presented on Figure 2.10.1-9.
Following is the derivation of the inertia load (pressure) magnitudes for the ANSYS model
run:
"O Weight of Cask: 162,760 lb.
"O Weight of Front Impact Limiter (with spacer): 16,500 lb.
"O Weight of Rear Impact Limiter: 15,450 lb.
"O Weight of Internals: 77,240 lb.
F = 162,760 lb. resultant of all of the distributed inertia forces acting on the cask body.
This force is actually distributed throughout the model and is simulated by applying 1G
acceleration to the finite element model in the longitudinal direction.
Pressure due to internals, P, = 77,240/(mr x 35.52) = 19.509 psi
Pressure due to front impact limiter, PF = 16,500/(rt x 42.252) = 2.942 psi
Reaction pressure due to cask body, internals and front impact limiter,
PR = (162,760 + 77,240 + 16,500)/( 7t x 42.252) = 45.739 psi
The stress intensities from the ANSYS run at the selected locations of the containment
vessel and gamma shield are presented in Tables 2.10.1-9 and 10.
5. 30 Foot End Drop on Lid (Front Impact Limiter)
An analysis similar to that for the 30 foot free drop on the bottom is performed for the 30
foot drop on the lid. The same inertial forces (1 G) are used for the lid or front impact case
as for the rear impact case. The results of this elastic analysis will be ratioed up for the
actual G load in the load - combination runs. The system of forces on the cask body is
presented on Figure 2.10.1-10, and the derivation of the magnitudes follows:
"O Weight of Cask: 162,760 lb.
"o Weight of Front Impact Limiter (with spacer): 16,500 lb.
"O Weight of Rear Impact Limiter: 15,450 lb.
" Weight of Internals: 77,240 lb.
Rev. 0 4/992.10.1-5

F = 162,760 lb. resultant of all of the distributed inertia forces acting on the cask body. This force is actually distributed throughout the model and is also simulated by applying 1G acceleration to the finite element model in the longitudinal direction.
Pressure due to internals, P1 = 77,240/(it x 34.182) = 21.045 psi
Pressure due to rear impact limiter, PR = 15,450/(7t x 42.252) = 2.755 psi
Reaction pressure due to cask body, internals and front impact limiter,
PF = (162,760 +77,240 + 15,450)/( It x 42.252) = 45.5515 psi
The reaction forces are slightly different for the drop on the lid end compared to the drop on the bottom end because of the slight geometry and configuration differences of the model at each end.
The stress intensities from the ANSYS run at the selected locations of the containment vessel and gamma shield are presented in Tables 2.10.1-11 and 12.
6. Thermal Stress for Hot Environment Condition at 100°F Ambient Temperature
The thermal analysis of the cask body is described in Chapter Three. The thermal model is used to obtain the steady state metal temperatures in the cask body for the normal condition which includes 1000 F daily averaged ambient air temperature, maximum decay heat and maximum solar heat loading. The thermal stress evaluations were conservatively based on an outside gamma shield temperature of 301'F and an inside cavity temperature of 256°F (temperature differential of 45°F). The actual temperature difference is less than 10'F from the thermal analysis presented in Chapter 3. Therefore the thermal stresses calculated here are conservative. It is assumed that there is a stress free state at 70'F uniform temperature.
The stress intensities from the ANSYS run at the selected locations of the containment vessel and garmma shield are presented in Tables 2.10.1-13 and 14.
7. Thermal Stresses for Cold Environment Condition at -20'F Ambient Temperature
A uniform temperature of -20'F is input to the structural model to calculate the stresses due to differential thermal expansion between the two shells of the cask. This differential expansion is entirely due to the difference in expansion coefficients of the construction materials of the cask assembly.
The stress intensities from the ANSYS run at the selected locations of the containment vessel and gamma shield are presented in Tables 2.10.1-15 and 16.
Rev. 0 4/992.10.1-6

8. Thermal Stresses for Cold Test at -40°F Ambient Temperature
A uniform temperature of -40°F is input to the structural model to calculate the stresses
due to differential thermal expansion between the two shells of the cask. Stresses occur
due to the difference in coefficients of expansion of the cask construction materials.
The stress intensities from the ANSYS run at the selected locations of the containment
vessel and gamma shield are presented in Tables 2.10.1-17 and 18.
9. Thermal Accident Condition
An ANSYS transient thermal analysis of the cask for the 30 minute thermal accident is
reported in Chapter Three. The initial condition is steady state at 100°F ambient
conditions with maximum decay heating. The initial steady state condition is followed by
a 0.5 hour severe thermal transient which is then followed by a cool-down period. The
temperatures through the cross section of the cask at the time which result in the
maximum thermal gradient are used for input to the cask model for thermal stress analysis.
The stress intensities from the ANSYS run at the selected locations of the containment
vessel and gamma shield are presented in Tables 2.10.1- 39 and 40.
10. Fabrication Stress
The fabrication stresses are computed due to 0.03 in. shrink-fit (diametrically) between
the inner containment cylinder and outer gamma cylinder. This interference results in an
interface pressure of 403.4 psi between the outer surface of the inner shell and inner
surface of the gamma shell. The two-dimensional axisymmetric finite-element model
was modified by removing all the couplings between the inner and outer cylinders. A run
was made by applying a pressure of 403.4 psi to the outer surface of inner containment
vessel and the inner surface of outer gamma shield cylinder.
The stress intensities from the ANSYS run at the selected locations of the containment
vessel and gamma shield are presented in Tables 2.10.1-3 and 4.
11. 1G Unit Loading (Longitudinal)
This analysis is conducted to evaluate the stresses while the cask axis is horizontal and
the rear of the cask is supported at the trunnions and the front of the cask is support at the
saddle. The loading used is the unit (IG) longitudinal deceleration resulting from
braking.
The results of this elastic analysis will be ratioed up for the actual G load (2.3G) in the
load- combination runs. Since the internals and impact limiters are not included in the
model , their loading effects are simulated as distributed pressure applied on the vessel at
"the appropriate locations. The system of forces acting on the cask is presented in Figure
Rev. 0 4/992.10.1-7

2.10.1-11. The node in the finite element model corresponding to the rear trunnion location is held in the Y- direction (longitudinal direction).
The forces acting on the cask in this case are:
F = 162,760 lb. resultant of all of the distributed inertia forces acting on the cask body. This force is actually distributed throughout the model and is simulated by applying IG acceleration in the longitudinal direction.
Pressure due to internals, P, = 77,240/(0t x 34.182) =21.045 psi
Weight of both impact limiters (including spacer) = 15,450 + 16,500 = 31,950 lb.
Pressure due to both impact limiters, PF+R= 31,950 /(7t x 42.252) = 5.697 psi
Since the two impact limiters are connected by tie rods, the entire load shifts to the rear cask surface.
The stress intensities from the ANSYS run at the selected locations of the containment vessel and gamma shield are presented in Tables 2.10.1-41 and 42.
2.10.1.4 Asymmetric Loading
The asymmetric loadings to the axisymmetric cask body are applied by special ANSYS harmonic elements. Each load acting on the cask is expanded into a Fourier series and is input into ANSYS as a series of load steps. Each load step contains all of the terms from the applied loads having the same mode number. The number of terms in the Fourier series, required to adequately represent a load varies with the type of load (whether it is a concentrated or a distributed load) and the degree of accuracy required. In the particular case where the applied loads are distributed over a large area (i.e., 180 degrees of the cask circumference), three terms of the series are sufficient to represent the desired loading within a few percent. See Figure 2.10.1-12 which shows the Fourier series approximations of cosine functions acting on the arc from 900 to 2700.
The following individual asymmetric load cases analyzed (using the same two-dimensional ANSYS model previously discussed) are described in this section.
(1) 1G downward loading with the cask axis horizontal, supported vertically on front saddle and two rear trunnions.
(2) 30 foot side drop with the cask axis parallel to the target.
(3) 30 foot CG over bottom corner (rear impact limiter) drop.
(4) 30 foot CG over lid corner (front impact limiter) drop.
Rev. 0 4/992.10.1-8

(5) 30 foot 150 slap down (lid end).
Since the individual load cases are linear and elastic, their results can be scaled and
superimposed as required in order to perform the normal and hypothetical accident load
combinations. Figure 2.10.1-13 illustrates the locations of the CG, trunnions, saddle, and impact
limiters. The magnitudes of the loads used in each individual load case analysis are computed in
the following paragraphs:
1. 1G Unit Loading (Vertical Down)
A static elastic analysis of cask is performed for a unit vertical down load (1 G) inertial
forces on horizontal cask supported at front saddle and rear trunnions. The system of
forces acting on the cask is presented in Figure 2.10.1-14. The results of this elastic
analysis will be ratioed up for the actual g load in the load- combination runs. Since the
internals and impact limiter are not included in the model, their loading effects are
simulated as distributed pressure applied on the vessel at the appropriate locations. The
saddle reaction pressure required to balance the inertial forces is applied at the vessel
bottom. The rear trunnion node is supported in the Z direction. The pressures due to
internals, impact limiters and saddle are assumed to vary as a cosine function over 180
degrees.
The forces acting on the cask in this case are:
A. Cask Body Inertia
F = 162,760 lb. downward resultant of the distributed inertia force acting on the mass of
the cask (shown at the C G) and is simulated by applying 1G acceleration in X-direction
(normal direction).
B. Pressure due to internals:
The downward force acting on the lower half of the inside surface of the cavity due to the
internals which are represented as a pressure varying sinusoidally around the bottom half (90' to 270' range) of the cavity as shown below:
3,t/2 WI P1 (cos 0) (L) cos 0 R dO = (PI) (R) (L) (tC/2)
Therefore, P1 = 2W/(ic RL)
The peak pressure of the internals is calculated as follows:
W, = weight of internals = 77,240 lb.
"Internals peak pressure, P1= 2Wi/(7L RL) = 2 x 77,240/(3.142 x 34.75 x 178.5) = 7.927
psi.
Rev. 0 4/992.10.1-9
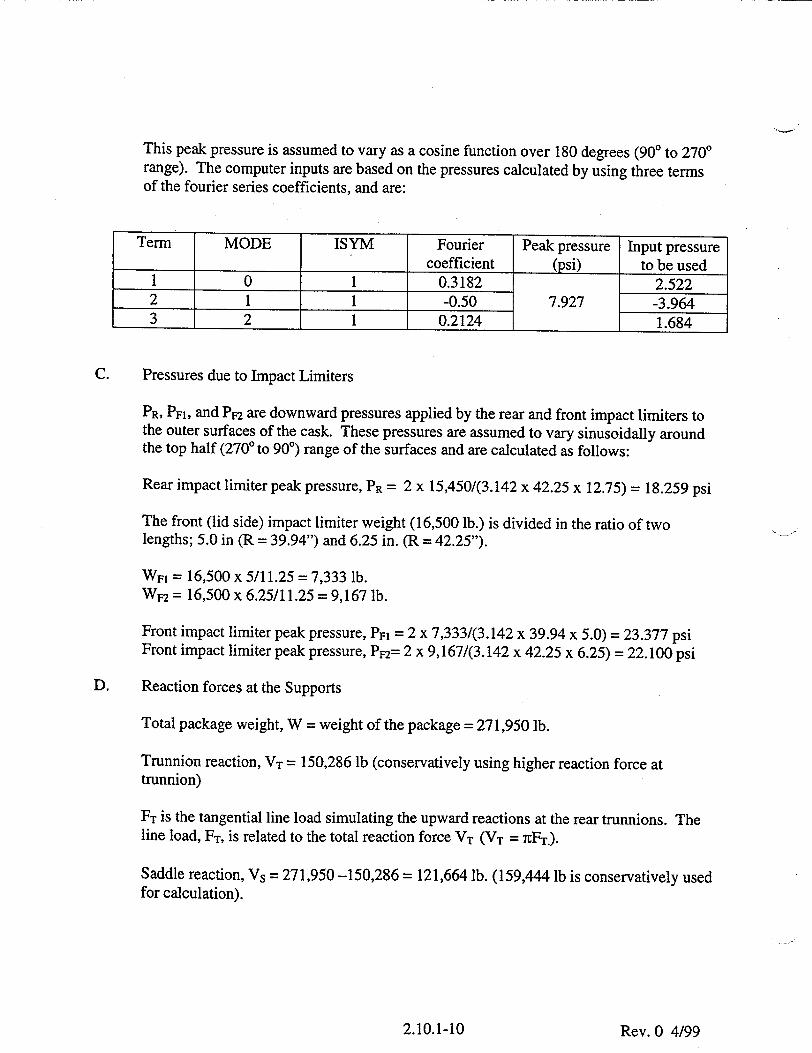
This peak pressure is assumed to vary as a cosine function over 180 degrees (900 to 2700 range). The computer inputs are based on the pressures calculated by using three terms of the fourier series coefficients, and are:
Term MODE ISYM Fourier Peak pressure Input pressure coefficient (psi) to be used
1 0 1 0.3182 2.522 2 1 1 -0.50 7.927 -3.964 3 2 1 0.2124 1.684
C. Pressures due to Impact Limiters
PR, PF1, and PF2 are downward pressures applied by the rear and front impact limiters to the outer surfaces of the cask. These pressures are assumed to vary sinusoidally around the top half (270 to 90-) range of the surfaces and are calculated as follows:
Rear impact limiter peak pressure, PR = 2 x 15,450/(3.142 x 42.25 x 12.75) = 18.259 psi
The front (lid side) impact limiter weight (16,500 lb.) is divided in the ratio of two lengths; 5.0 in (R = 39.94") and 6.25 in. (R = 42.25").
WFI = 16,500 x 5/11.25 = 7,333 lb. WF2 = 16,500 x 6.25/11.25 = 9,167 lb.
Front impact limiter peak pressure, PF1 = 2 x 7,333/(3.142 x 39.94 x 5.0) = 23.377 psi Front impact limiter peak pressure, PF2= 2 x 9,167/(3.142 x 42.25 x 6.25) = 22.100 psi
D. Reaction forces at the Supports
Total package weight, W = weight of the package = 271,950 lb.
Trunnion reaction, VT = 150,286 lb (conservatively using higher reaction force at trunnion)
FT is the tangential line load simulating the upward reactions at the rear trunnions. The line load, FT, is related to the total reaction force VT (VT = IrFT.).
Saddle reaction, Vs = 271,950 -150,286 = 121,664 lb. (159,444 lb is conservatively used for calculation).
Rev. 0 4/992.10.1-10

The saddle reaction is applied as a pressure applied to the outer surface of the cask, this
pressure is assumed to vary sinusoidally around the bottom half (900 to 2700 range) of the
surface (8.85" width). The peak pressure is calculated as follow:
Peak Pressure, Ps = 2 x 159,444/(3.142 x 42.25 x 8.85) = 271.59 psi
The stress intensities from the ANSYS run at the selected locations of the containment
vessel and gamma shield are presented in Tables 2.10.1-21 and 22.
2. 30 Foot Side Drop
A static elastic analysis of the cask is performed for a unit load (1 G) with inertial forces
balanced by impact forces. The results of this elastic analysis are ratioed up for the actual
g load in the load- combination runs. Since the internals and impact limiter are not
included in the model, their loading effects are simulated as distributed pressure applied
on the vessel at the appropriate locations. The impact limiter reaction pressure required
to balance the inertial forces is applied at the vessel bottom. During the side drop, the
pressure at inner surface due to internals and reaction pressure on the outer side by the
impact limiters is assumed to vary as a cosine function over 180 degrees. The system of
forces acting on the cask is presented in Figure 2.10.1-15.
The forces acting in this case are:
A. Cask Body Inertia
F = 162,760 lb. downward resultant of the distributed inertia force acting on the cask
(shown at the CG) and is simulated by applying 1G acceleration in X-direction (normal
direction).
B. Pressure Due to Internals
The downward force acting on the lower half of the inside surface of the cavity due to the
internals which are represented as a pressure varying as a cosine function around the
bottom half (90' to 2700 range) of the cavity as shown below:
W1 =f P1 (cos 0) (L) cos 0 R dO = (PO) (R) (L) (ic/2) I it/2
Therefore, P1 = 2WV/(ic RL)
The peak pressure of the internals is calculated as follows:
WI = weight of internals = 77,240 lb.
Peak pressure, P1 = 2Wi/(nt RL) = 2 x 77,240/(3.142 x 34.75 x 178.5) = 7.927 psi
Rev. 0 4/992.10.1-11

C. Impact Reaction Pressures:
PR, PFI, and P1: are the peak pressures applied by the rear and front impact limiter reactions on the bottom half of the cask body outer surface during impact. These pressures are assumed to vary sinusoidally around the bottom half of the outer surfaces (900 to 2700 range) and are calculated as follows:
Total cask weight, W = 240,000 lb (cask + internals)
Reaction force, Rear (bottom) = 240,000 x 94.88/185.24 = 122,928 lb.
Reaction force, Front (lid) = 240,000 x 90.36/185.24 = 117,072 lb.
Rear Peak Pressure, PR = 2 x 122,928/(3.142 x 42.25x 12.75) = 145.276 psi
The front (lid side) reaction force is divided in the ratio of two lengths; 5.Oin (R = 39.94") and 6.25 in. (R = 42.25").
RFI = 117,072 x 5/11.25 = 52,032 lb. R2 = 117,072 x 6.25/11.25 = 65,040 lb.
Rear Peak Pressure, PFI = 2 x 52,032/(3.142 x 39.94 x 5.0) = 165.872 psi Rear Peak Pressure, Pm = 2 x 65,040/(3.142 x 42.25 x 6.25) = 156.803 psi
The stress intensities from the ANSYS run at the selected locations of the containment vessel and gamma shield are presented in Tables 2.10.1-23 to 26.
3. 30 Foot C.G. Over Bottom Comer Drop (Rear Impact Limiter)
A static elastic analysis of the cask is performed for a unit load (1 G) with inertial forces balanced by impact forces. The results of this elastic analysis are ratioed up for the actual g load in the load- combination runs. Since the internals and impact limiter are not included in the model, their loading effects are simulated as distributed pressure applied on the vessel at the appropriate locations. For CG-over-comer, the cask is inclined at about 60 degrees with the horizontal. All the applied loads and reaction forces are transformed in axial and normal components. The axial pressure components due to internals, top (front) impact limiter and bottom (rear) impact reaction are assumed uniformly distributed. All the normal pressure components are assumed to vary as cosine functions over 180 degrees of the circumference. The system of forces acting on the cask is presented in Figure 2.10.1-16.
Rev. 0 4/992.10.1-12

The forces acting in this case are:
A. Cask Body Inertia
F = 162,760 lb. downward resultant of the distributed inertia force acting on the cask
(shown at the C G) and is simulated by applying 0.5G in the normal direction and 0.866G
in the longitudinal direction (resulting 1 G in the vertical direction).
B. Pressure Due to Internals
The internals inertia loading was applied in two mutually perpendicular directions (one
along the axis of the cask and the other perpendicular to it). The component along the
axial direction (PtA) was distributed uniformly over the inside surface of the bottom plate.
The other component (PIN) was assumed to vary sinusoidally around the lower half (90*
to 2700 range) of the inside surface of the inner shell; the fourier coefficients for this
function are computed in Figure 2.10.1-12.
WI = weight of internals = 77,240 lb.
Axial pressure, PtA = 77,240 sin 600/(3.142 x 35.52) = 16.895 psi
Peak normal pressure, PIN= 2Wtcos 600/(it RL) = 2 x 77,240x 0.5 /(3.142 x 34.75 x
178.5) = 3.964 psi
C. Pressure Due to Top (Front) Impact Limiter
The inertia load of the nonstriking impact limiter was also applied to the cask in two
mutually perpendicular directions. The axial component (PFA) was applied as a uniform
pressure over the outside surface at the interface with the impact limiter on the lid end.
The other component (Pm) was assumed to vary sinusoidally around the upper half of the
outside surface (2700 to 90 range) of the cask.
WF = weight of front impact limiter = 16,500 lb.
Axial pressure, PFA =16,500 sin 600/ (3.142 x 34.942) = 2.8513 psi
Normal pressure is applied on two lengths; 5.0 in (R = 39.94") and 6.25 in. (R = 42.25").
F1 = 16,500 cos 600 x 5/11.25 = 3,667 lb. F2 = 16,500 cos 600 x 6.25/11.25 = 4,583 lb.
Peak Pressure due to F 1, PNI = 2 x 3,667/(3.142 x 39.94 x 5.0) = 11.690 psi
Peak Pressure due to F2, PF2 = 2 x 4,583/(3.142 x 42.25 x 6.25) = 11.049 psi
Rev. 0 4/992.10.1-13

D. Reaction Pressures Due to Bottom (Rear) Impact Limiter
The reaction pressure of the striking impact limiter was also applied to the cask in two mutually perpendicular directions. The axial component (PRA) was applied as a uniform pressure over the outside surface at the interface with the impact limiter on the bottom end. The other component (PRN) was assumed to vary sinusoidally around the lower half of the outside surface (900 to 2700 range) of the cask.
Total weight = 162,760 + 77,240 + 16,500 = 256,500 lb.
Axial pressure, PRA =256,500 sin 600 /(3.142 x 42.252) = 39.6097 psi
Peak normal pressure, PRN= 2W cos 600 /(i RL) =2 x 256,500 x 0.5/(3.142 x 42.25 x 12.75) = 151.556 psi.
The stress intensities from the ANSYS run at the selected locations of the containment vessel and gamma shield are presented in Tables 2.10.1-27 to 30.
4. 30 Foot CG Over Lid Comer Drop (Front Impact Limiter)
A static elastic analysis of the cask is performed for a unit load (1 G) with inertial forces balanced by impact forces. The results of this elastic analysis are ratioed up for the actual G load in the load - combination runs. Since the internals and impact limiter are not included in the model, their loading effects are simulated as distributed pressure applied on the vessel at the appropriate locations. For CG-over-comer, the cask is inclined at about 60 degrees from the horizontal. All the applied loads and reaction forces are transformed in axial and normal components. The axial pressure components due to internals, top impact limiter and bottom impact reaction are assumed uniformly distributed. All the normal pressure components are assumed to have cosine variation over 180 degrees circumference. The system of forces acting on the cask is presented in Figure 2.10.1-17.
The forces acting in this case are:
A. Cask Body Inertia
F = 162,760 lb. downward resultant of the distributed inertia force acting on the mass of the cask (shown at the CG) and is simulated by applying 0.5G in the normal direction and 0.866G in the longitudinal direction (resulting IG in the vertical direction).
B. Pressure Due to Internals:
The internals inertia loading was applied in two mutually perpendicular directions (one along the axis of the cask and the other perpendicular to it). The component along the axial direction (Pts) was distributed uniformly over the inside surface of the bottom plate.
Rev. 0 4/992.10.1-14
The other component (PIN) was assumed to vary sinusoidally around the lower half of the inside surface (90' to 2700 range) of the inner shell.
W= weight of internals = 77,240 lb.
Axial pressure, PLA =77,240 sin 600 /(3.142 x 35.52) = 16.895 psi
Peak normal pressure, PN= 2W, cos 600 /(ir RL) = 2 x 77,240x0.5 /(3.142 x 34.75 x 178.5) = 3.964 psi.
C. Pressure Due to Rear Impact Limiter:
The inertia load of the nonstriking impact limiter was also applied to the cask in two mutually perpendicular directions. The axial component (PRA) was applied as a uniform pressure over the outside surface at the interface with the impact limiter on the bottom end. The other component (PRN) was assumed to vary sinusoidally around the upper half of the outside surface (2700 to 90' range) of the cask.
WR = weight of rear limiter = 15,450 lb.
Axial pressure, PRA =15,450 sin 60'/(3.142 x 42.252) = 2.386 psi Peak normal pressure, PRN = 2 x 15,450 cos 600/(3.142 x 42.25 x 12.75) = 9.129 psi
D. Reaction Pressures Due to Front Impact Limiter
The reaction pressure of the striking impact limiter was also applied to the cask in two mutually perpendicular directions. The axial component (PFA) was applied as a uniform pressure over the outside surface at the interface with the impact limiter on the lid end. The other component (PFN) was assumed to vary sinusoidally around the lower half of the outside surface (90' to 270' range) of the cask.
Total weight = 162,760 + 77,240 + 15,450=- 255,450 lb.
Axial pressure, PFA = 255,450 sin 600 / (3.142 x 42.252) = 39.4476 psi
Normal pressure is applied on two lengths; 5.0 in (R = 39.94") and 6.25 in. (R = 42.25").
F1 = 255,450 cos 600 x 5/11.25 = 56,767 lb. F2 = 255,450 cos 600 x 6.25/11.25 = 70,958 lb.
Peak Pressure due to F1, PFN1 = 2 x 56,767/(3.142 x 39.94 x 5.0) = 180.966 psi Peak Pressure due to F2, PFN2 = 2 x 70,958/(3.142 x 42.25 x 6.25) = 171.070 psi
The stress intensities from the ANSYS run at the selected locations of the containment vessel and gamma shield are presented in Tables 2.10.1-31 to 34.
Rev. 0 4/992.10.1-15
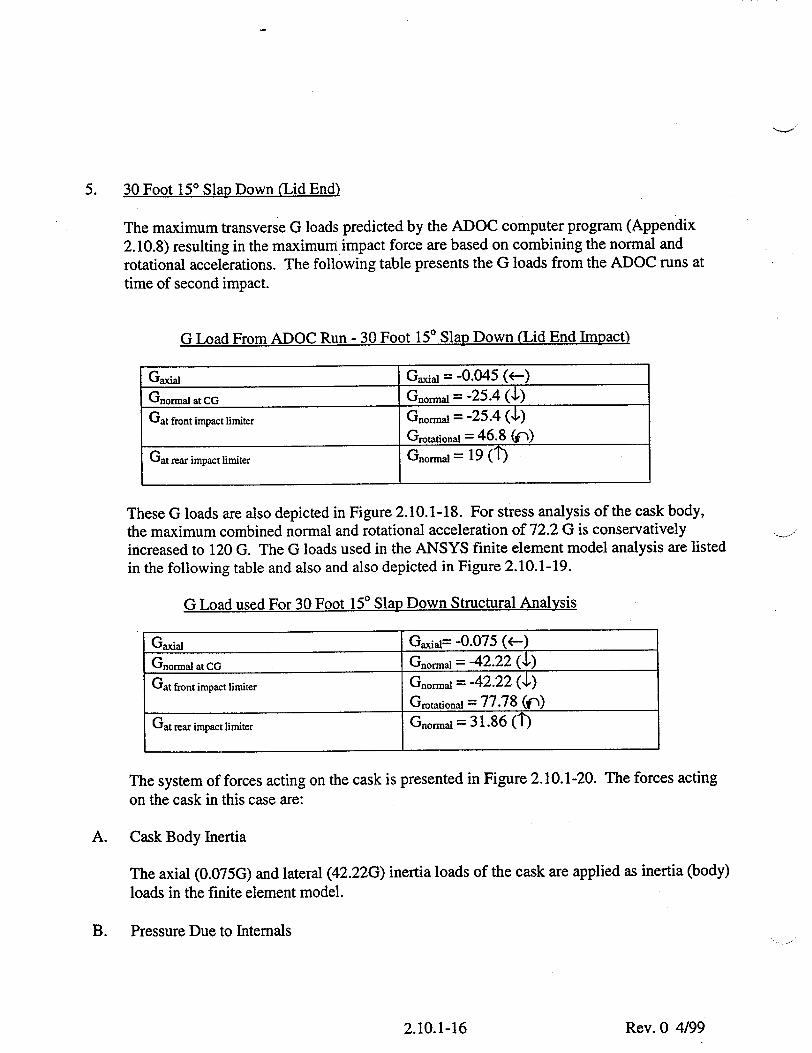
5. 30 Foot 150 Slat Down (Lid End)
The maximum transverse G loads predicted by the ADOC computer program (Appendix 2.10.8) resulting in the maximum.impact force are based on combining the normal and rotational accelerations. The following table presents the G loads from the ADOC runs at time of second impact.
G Load From ADOC Run - 30 Foot 150 Slap Down (Lid End Impact)
Gaxial Gaxia = -0.045 (<-) Gnormal at CO Gnori• = -25.4(,) Gat front impact limiter Gnormal = -25.4 (,4)
Grotational = 46.8 (j-) Gat rear impact limiter Gnormal = 19 (1M)
These G loads are also depicted in Figure 2.10.1-18. For stress analysis of the cask body, the maximum combined normal and rotational acceleration of 72.2 G is conservatively increased to 120 G. The G loads used in the ANSYS finite element model analysis are listed in the following table and also and also depicted in Figure 2.10.1-19.
G Load used For 30 Foot 150 Slap Down Structural Analysis
Gaxiaj Gaiai= -0.075 (<--)
Gnormal at CG Gnormal = -42.22 (,!) Gat front impact limiter Gnormal = -42.22 (4)
Grotational = 77.78 (f) Gat rear impact limiter Gnormai = 31.86 (1")
The system of forces acting on the cask is presented in Figure 2.10.1-20. The forces acting on the cask in this case are:
A. Cask Body Inertia
The axial (0.075G) and lateral (42.22G) inertia loads of the cask are applied as inertia (body) loads in the finite element model.
B. Pressure Due to Internals
Rev. 0 4/992.10.1-16

The cask contents inertia load was again resolved into components acting in two mutually
perpendicular directions. The component in the axial direction was applied as a pressure
acting on the inside surface of the lid. The lateral component was applied as a pressure
acting over the lower half (90' to 2700 range) of the inside surface of the inner shell. In this
case, these pressures are not only varied sinusoidally around the circumference but also
varied linearly with distance from the center of the surface to which they are applied since
the containment vessel is being subjected to rotational as well as axial and lateral
accelerations.
Wi = weight of internals = 77,240 lb.
Peak normal pressure, P1= 2W1 x 120/(ic RL) = 2 x 77,240x 120/(3.142 x 34.75 x 178.5)
= 951.28 psi
P2 = 951.28 x 97.24/120 = 770.85 psi
P 3 = 951.28 x 55.96/120 = 443.61 psi
P4 = 951.28 x 18.72/120 = 148.4 psi
P5 = 951.28 x 7.81/120 = 61.91 psi
P6 = 951.28 x 23.74/120 = 188.19 psi
P1, P 2, P3, and P 4 are acting over the lower half (900 to 2700 range) of the inside surface of
the inner shell. P5 and P 6 are acting over the upper half (2700 to 900 range) of the inside
surface of the inner shell. The computer inputs are based on the pressures calculated by
using three terms of the fourier series coefficients; the fourier coefficients for this
function are computed in Figure 2.10.1-12.
Axial pressure, P9 =77,240 x 0.075 /(3.142 x 35.52) = 1.46 psi
C. Pressure Due to Rear Impact Limiter:
The inertia load of the rear impact limiter is also applied to the cask in two mutually
perpendicular directions. The axial component (P7) is applied as a uniform pressure over
the outside surface at the interface with the impact limiter on the bottom end. The other
component (Ps) is assumed to vary sinusoidally around the upper half of the outside
surface (2700 to 900 range) of the cask.
WR = weight of rear limiter = 15,450 lb.
Axial pressure, P7 =15,450 x 0.075/(3.142 x 42.252) = 0.21psi
Peak normal pressure, P8 = 2 x 15,450 x 42.22/(3.142 x 42.25 x 12.75) = 770.89 psi
Rev. 0 4/992.10.1-17
D. Reaction Pressures Due to Front Impact Limiter
The reaction pressure of the front impact limiter is also applied to the cask in two mutually perpendicular directions. The axial component (PIo) is applied as a uniform pressure over the outside surface at the interface with the impact limiter on the lid end. The other component (P1 ) is assumed to vary sinusoidally around the lower half of the outside surface (90' to 2700 range) of the cask.
Total weight = 162,760 + 77,240 + 15,450=- 255,450 lb.
Axial pressure, P10 = (255,450) x 0.075/ (3.142 x 42.252) = 3.42 psi
Peak normal pressure, P11= 2 (255,450) x 42.22/(3.142 x 42.25 x 11.25) = 4,445.25 psi.
E. Rotational Acceleration
A rotational acceleration, a, is also input to the finite element model to satisfy the rotational quasistatic equilibrium condition (see Figure 2.10.1-21):
ZM=0
The rotational acceleration, a, required to place the model in equilibrium was calculated Based on:
ZM=I, a=Fd, + F2 d2 +F 3 d3 + ........
Where
F1, F2, etc. are the various inertial loadings in the system of forces.
L= Mass moment of inertia I M = Net moment resulting from axial and normal loads on the finite element model.
The stress intensities from the ANSYS run at the selected locations of the containment vessel and gamma shield are presented in Tables 2.10.1-35 to 38.
2.10.1.5 Transport Shock Loading
Transport By Truck
The transport shock loadings used to evaluate the TN-68 transport cask are based on truck bed accelerations in ANSI N 14.23 which are:
Vertical 3.5G Longitudinal 2.3G Lateral 1.6G
Rev. 0 4/992.10.1-18

"1-1 The resultant transverse load is (3.52 + 1.62)12 = 3.85 G
The transport shock load stresses are obtained by multiplying the IG transverse load (Tables 2.10.1-21 and 22) and 1G longitudinal load (Tables 2.10.1-41 and 42) stresses by 3.85 and 2.3 factors, respectively and summing them. This operation is conducted using an ANSYS postprocessor.
The stress intensities from the ANSYS run at the selected locations of the containment vessel and gamma shield are presented in Tables 2.10.1- 19 and 20.
Transport By Rail
The transport shock loadings used to evaluate the TN-68 transport cask are based on NUREG 766510(9) which specifies a maximum inertia loading of 4.7G in each of the three x-y-z coordinate directions:
Vertical 4.7G Longitudinal 4.7G Lateral 4.7G
The resultant transverse load is (4.72 +4.72)112 = 6.65 G
The transport shock load stresses are obtained by multiplying the 1G transverse load (Tables 2.10.1-21 and 22) and 1G longitudinal load (Tables 2.10.1-41 and 42) stresses by 6.65 and 4.7 factors, respectively and summing them. This operation is conducted using an ANSYS postprocessor.
The stress intensities from the ANSYS run at the selected locations of the containment vessel and gamma shield are presented in Tables 2.10.1- 61 and 62.
2.10.1.6 Transport Vibration Loading
Transport By Truck
The input loading conditions used to evaluate the TN-68 cask for transport vibration are also obtained from truck bed accelerations in ANSI N14.23. The peak inertia values used are:
Vertical 0.60G Longitudinal 0.30G Lateral 0.30G
The resultant transverse load is (0.62 +0.32)112 =0.67 G
__ The transport vibration load stresses are obtained by multiplying the IG transverse load (Tables 2.10.1-21 and 22) and IG longitudinal load (Tables 2.10.1-41 and 42) stresses by 0.67 and 0.3
Rev. 0 4/992.10.1-19

factors, respectively and summing them. This operation is conducted using an ANSYS postprocessor.
The stress intensities from the ANSYS run at the selected locations of the containment vessel and gamma shield are presented in Tables 2.10.1- 43 and 44.
Transport By Rail
The input loading conditions used to evaluate the TN-68 cask for transport vibration are obtained from NUREG 766510. The peak inertia values used are:
Vertical 0.37G Longitudinal 0.19G Lateral 0.19G
These values are less than the truck vibration loadings. Therefore, the stresses obtained from the truck vibration analysis are used to evaluate the combined stresses for transport inertia load combination.
2.10.1.7 Transport Tie-Down Loading
The input loading conditions used to evaluate the TN-68 cask for transport tie-down loadings are obtained from 10CFR71.45. The peak inertia values used are:
Vertical 2 G Longitudinal 10 G Lateral 5 G
The resultant transverse load is (22 + 52)112 =5.4 G
The transport tie-down load stresses are obtained by multiplying the 1G transverse load (Tables 2.10.1-21 and 22) and 1G longitudinal load (Tables 2.10.1-41 and 42) stresses by 5.4 and 10 factors, respectively and summing them. This operation is conducted using an ANSYS postprocessor.
The stress intensities from the ANSYS run at the selected locations of the containment vessel and gamma shield are presented in Tables 2.10.1- 45 and 46.
2.10.1.8 6 G Lifting
The cask is oriented vertically in space and held by the 2 top trunnions. The down load is simulated by applying 6G vertical acceleration to the finite element model. Since the resin, outer shell and trunnions are not included in the model, they are accounted for by increasing the density of the gamma shielding. Figure 2.10.1-24 shows the loading conditions.
Rev. 0 4/992.10.1-20
The internals are not included in the model, their loading effects are simulated by a distributed pressure acting on the inside bottom surface of the cask cavity.
The total cask weight (including internals) is replaced by forces applied to the 2 top trunnions so
that the system of forces acting on the cask is again in equilibrium. A cask weight of 240,000 lb.
is used in the calculations (weight of impact limiters is not included). The two trunnion forces
FTR are replaced by a total force:
Fy = 6.0 x (240,000) x 1.15 = 1,656,000 lbs
A 15% additional load is included to cover the dynamic effects of lifting. This force is acting in
the Y direction on the outer surface of the gamma shielding at the trunnion location. The stress intensities from the ANSYS run at the selected locations of the containment vessel
and gamma shield are presented in Tables 2.10.1- 47 and 48.
2.10.1.9 Summary of Individual Load Cases
Detailed stresses and displacements in the ANSYS model of the cask body are obtained and stored (on magnetic tape) for every node location for each individual load case. These stored
results are postprocessed to printout the stresses at the 39 standard locations on the cask body
structure shown in Figures 2.10.1-22 and 2.10.1-23. The locations selected as shown in Figures
2.10.1-22 and 2.10.1-23 are key points that, when carefully studied, indicate the behavior of the
entire structure. The maximum stress may occur at a different location for each individual load.
The individual load cases analyzed are listed in Table 2.10.1-1A. Linear elastic analyses were
performed for all load cases. Stress intensities at nodal locations on the inner and outer surfaces
of each cask body component are reported in Tables 2.10.1-1 to 2.10.1-48, and Tables 2.10.1-61to 2.10.1-62 as listed in Table 2.10.1-lA. There are no specific limits for individual
stress components. The stress components of each load case are combined for the various load combinations as described in Sections 2.6 and 2.7 by factoring and algebraic addition. Then the
stress intensities at each location are determined, classified and compared with the design criteria of Section 2.1.2 in Sections 2.6 and 2.7.
The local stresses at the trunnion locations are not included in these results. The local stresses
are obtained as described below in Section 2.10.1.8 and they are reported in Tables 2.10.1-49
through 2.10.1-60. The method used is the "Bijlaard" analysis using hand calculations rather
than an ANSYS model.
It should be noted that, for the axisymmetric analyses, the stress is constant around the cask at
every location. For asymmetric analyses with significant differences in stress magnitudes on the
extreme opposite sides of the cask, the stresses at locations on different sides of the cask are
reported. In those cases where the cask is supported on the trunnions, the stresses under
transverse loadings (such as gravity) are nearly equal in magnitude on the top and bottom.
Therefore only the tensile results for the bottom side are listed for these cases.
Rev. 0 4/992.10.1-21

In order to check the reasonableness of the finite element model response, some simple closedform calculations are conducted. While these simple results are unlikely to duplicate the complex area of model and complex loading conditions, they can be used to verify the stresses in simple areas away from discontinuities.
"* Internal Pressure (100 psig)
P*rm P Membrane stress intensity in a cylinder - + P
t 2
= [(100 * 38.5/7.5) + (100/2)] = 513 psi
Average of stress intensities at locations 11 and 32 from computer output at Tables 2.10.1-5 and 2.10.1-6 = ½ (586 + 417) = 502 psi. This is close to the hand-calculated stress intensity.
"• Normal Thermal Condition
E'a'AT Thermal stress in a cylinder = 2(1
AT between locations 11 and 32 = 301 - 256 = 45'F Thermal stress = (28.3E6*6.43E-6*45)/(2*0.7) = 5,849 psi
Average stress intensity at locations 11 and 32 from computer output (Tables 2.10.1-13 and 2.10.1-14) = 1/2 (5599+5435) = 5517 psi. This is close to the hand-calculated intensity.
The above comparison indicates that the finite element response to various simple loads is reasonable.
2.10.1.10 Trunnion Local Stress Analysis
This section discusses the analysis performed to calculate the local stresses in the cask body outer shell at the trunnion locations due to the loadings applied through the trunnions. These local effects are not included in the ANSYS stress results tables reported above. The local stresses must be superimposed on the above stress results for the cases where the inertial loadings are reacted at the trunnions. The local stresses are calculated in accordance with the methodology of Reference WRC-107(7 ) which is based on the "Bijlaard" analysis for local stresses in cylindrical shells due to external loadings.
Loading
The Bijlaard analysis was performed for several different trunnion loading conditions to support various structural evaluations. A summary of the load cases considered is provided in Table 2.10.1-lB.
Rev. 0 4/992.10.1-22

Loads used for the "Bijlaard" analysis are obtained from the packaging inertial loadings and are
also listed in Table 2.10.1-lB. The loads are based on a transport weight of 271,950 lb except
for lifting loads which use a weight of 240,000 lb (which does not include the impact limiter
weight).
Method of Analysis
The local stresses induced in the outer shell cylinder by the trunnions are calculated using
"Bijlaard's" method. The neutron shield and thin outer shell are not considered to strengthen
either the trunnions or the gamma shield shell. The trunnion is approximated by an equivalent
attachment so that the curves of the Reference WRC-107 can be used to obtain the necessary
coefficients. These resulting coefficients are inserted into blanks in the column entitled "Read
Curves For," in a standard computation form, a sample of which is attached as Table 2.10.1-59.
The stresses are calculated by performing the indicated multiplication in the column entitled
"Compute Absolute Values of Stress and Enter Result". The resulting stress is inserted into the
stress table at the eight stress locations, i.e., AU, AL, BU, BL, etc. Note that the sign convention
for this table is defined on the figure as if the load directions are as shown. The membrane plus
bending stresses are calculated by completing Table 2.10.1-59.
Model, Boundary Conditions and Assumptions
The cylindrical body is assumed to be a hollow cylinder of infinite length. Since the trunnions
are located away from the ends of the cylinder, this assumption is acceptable because the local
effects are not significantly affected by the end restraints, i.e., lid and bottom. This is
conservative since end restraints would reduce the local bending effects.
Results of Trunnion Local Stress Analysis
Tables 2.10.1-49 to 60 summarize the resulting nodal stress intensity for the various loading
conditions. These local stresses are combined with the finite element results at the same
locations from the individual load cases above and compared with allowables in Section 2.6.
Rev. 0 4/992.10.1-23

2.10.1.11 References
1. 1 OCFR 71.71, Normal Conditions of Transport. 2. 10CFR 71.73, Hypothetical Accident Conditions. 3. Regulatory Guide 7.8, "Load Combinations for the Structural Analysis of Shipping casks
for Radioactive Material". 4. ASME Code Section III, Division 3, Subsection WB, Containment Systems and Transport
Packagings for Spent Nuclear. 5. Regulatory Guide 7.6, "Design Criteria for the Structural Analysis of Shipping Cask
Containment Vessels". 6. ANSYS Users Manual, Rev. 5.5. 7. WRC Bulletin 107, March 1979, "Local Stresses in Spherical and Cylindrical Shells Due
to External Loadings". 8. High Performance Sealing, Metal Seals Helicoflex Catalog, Helicoflex Co., Boonton, N.J.
ET 507 E 5930. 9. NUREG 766510, "Shock and Vibration Environments for Large Shipping Containers on
Rail Cars and Trucks".
Rev. 0 4/992.10.1-24

Table 2.10.1-1A
Individual Load Cases For TN-68 Cask Body Analysis
Load Individual Load Description Stress Result
Case Tables
Number IL - 1 Bolt Preload and Lid Seating Pressure 2.10.1-1, -2
IL - 2 Fabrication Stress 2.10.1-3, -4
IL - 3 Internal Pressure (100 psi) 2.10.1-5, -6
IL - 4 External Pressure (25 psi) 2.10.1-7, -8
IL - 5 End Drop on Bottom -Rear Impact Limiter (MG) 2.10.1-9, -10
IL - 6 End Drop on Lid - Front Impact Limiter (IG) 2.10.1-11, -12
IL - 7 Thermal Stress Due to Hot Environment 2.10.1-13, -14
IL - 8 Thermal Stress Due to -20°F Cold Environment 2.10.1-15, -16
IL - 9 Thermal Stress Due to -40'F Cold Environment 2.10.1-17, -18
IL - 10 Transport Shock Load/Truck (2.3G Long., 1.6G Lat., 2.10.1-19, -20 3.5G Vert.)
IL - 11 Cask Horizontal, IG Down 2.10.1-21, -22
IL - 12 Side Drop (1G) 2.10.1-23, -24, -25, -26
IL - 13 CG Over Comer Drop on Rear Impact Limiter (IG) 2.10.1-27, -28, -29, -30
IL - 14 CG Over Comer Drop on Front Impact Limiter (IG) 2.10.1-3 1, -32, -33, -34
IL - 15 150 Slap Down Second Impact on Lid End (120G) 2.10.1-35, -36, -37, -38
IL - 16 Thermal Stress Due to Fire Accident 2.10.1-39, -40
IL - 17 Cask Horizontal, 1G Longitudinal 2.10.1-41, -42
IL - 18 Transport Vibration Load/Truck (0.3G Long., 0.3G Lat., 2.10.1-43, -44 0.6G Vert.)
IL - 19 Transport Tiedown Load (10G Long., 5G Lat., 2G Vert.) 2.10.1-45, -46
IL - 20 6G on Trunnion Lifting Load (Cask Vertical, 6GUp) 2.10.1-47, -48
IL - 21 Local Stresses at Rear Trunnion/Cask Body Interface 2.10.1-49, -50 with 1G Down - Cask Horizontal
IL - 22 Local Stresses at Rear Trunnion/Cask Body Interface 2.10.1-51, -52
with Shock Loads/Truck - Cask Horizontal IL - 23 Local Stresses at Rear Trunnion/Cask Body Interface 2.10.1-53, -54
with Vibration Loads/Truck - Cask Horizontal IL - 24 Local Stresses at Rear Trunnion/Cask Body Interface 2.10.1-55, -56
with Tiedown Loads - Cask Horizontal IL - 25 Local Stresses at Front Trunnion/Cask Body Interface 2.10.1-57, -58
with 6G up - Cask Vertical IL - 26 Local Stresses at Rear Trunnion/Cask Body Interface 2.10.1-59, -60
with Shock Loads/Rail - Cask Horizontal
IL - 27 Transport Shock Load/Rail (4.7G All Directions) - Cask 2.10.1-61, -62
Horizontal II
Rev. 0 4/99

Table 2.10.1-4B
Trunnion Loads
Trunnion Load Description Inertial Load Max. Each Trunnion Load
Gravity !G Vertical Vc = 67.99 kips
(Cask Horizontal - Rear Trunnion) Mc - 543.22 in-kips
Shock/Truck 2.3G - Longitudinal VL =312.74 kips
(Cask Horizontal - Rear Trunnion) 1.6G - Lateral Vc = 237.96 kips 3.5G - Vertical P = 21.56 kips
ML = 2498.81 in-kips Mc = 1901.27 in-kips
Vibration/Truck 0.3G - Longitudinal VL = 40.79 kips
(Cask Horizontal - Rear Trunnion) 0.3G - Lateral Vc = 40.79 kips 0.6G - Vertical P = 40.79 kips
ML = 325.93 in-kips Mc = 325.93 in-kips
Tiedown lOG - Longitudinal VL = 1359.75 kips
(Cask Horizontal - Rear Trunnion) 5G - Lateral Vc = 135.98 kips 2G - Vertical P = 679.88 kips
ML = 10864.40 in-kips Mc = 1086.44 in-kips
Lifting 6G- vertical VL = 828.00 kips
(Cask vertical - Front Trunnion) ML= 6218.28 in-kips
Shock/Rail 4.7G - Longitudinal VL = 639.08 kips
(Cask Horizontal - Rear Trunnion) 4.7G - Lateral Vc = 320.90 kips 4.7G - Vertical P = 639.08 kips
ML = 4786.73 in-kips Mc = 2403.55 in-kips
Vibration/rail 0.19G - Longitudinal VL = 40.79 kips
(Cask Horizontal - Rear Trunnion) 0.19G - Lateral Vc = 40.79 kips 0.37G - Vertical P = 40.79 kips
ML = 305.54 in-kips Mc = 305.54 in-kips
Rev. 0 4/99
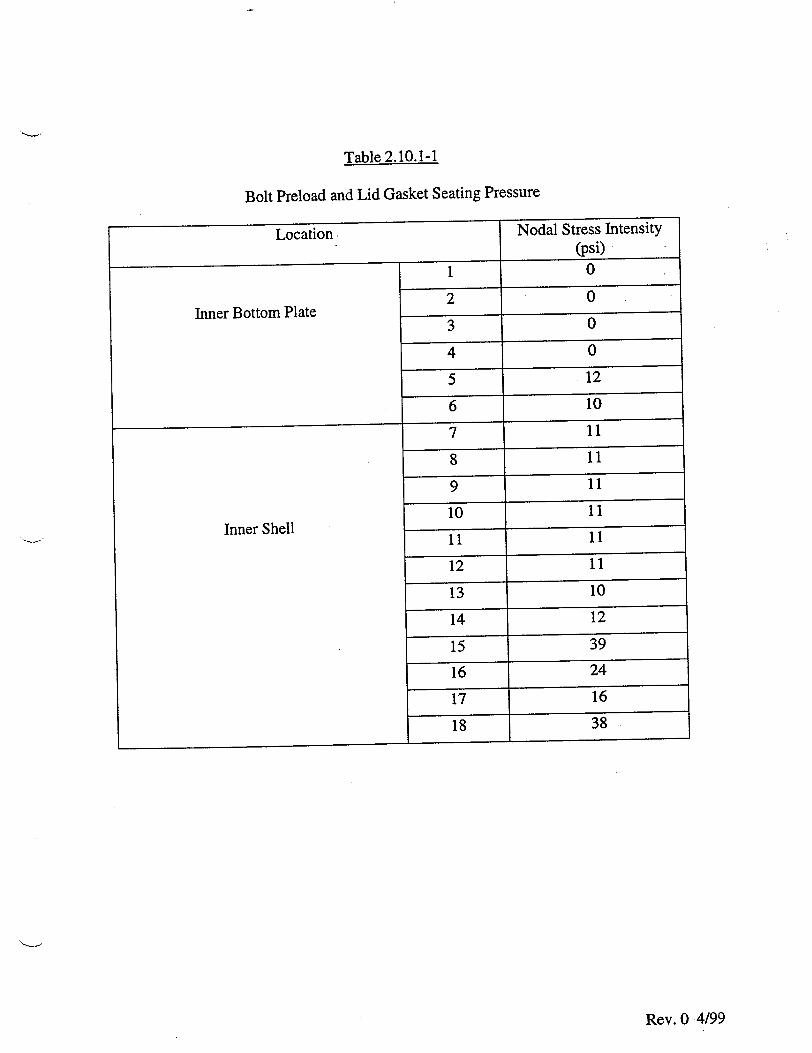
Table 2.10.1-1
Bolt Preload and Lid Gasket Seating Pressure
Location. Nodal Stress Intensity (psi)
1 0
20 Inner Bottom Plate
3 0 4 0
5 12
6 10
7 11
8 11 9 11
10 1 Inner Shell111
12 1
13 10
14 12
15 39
16 24
17 16
18 38
Rev. 0 4/99
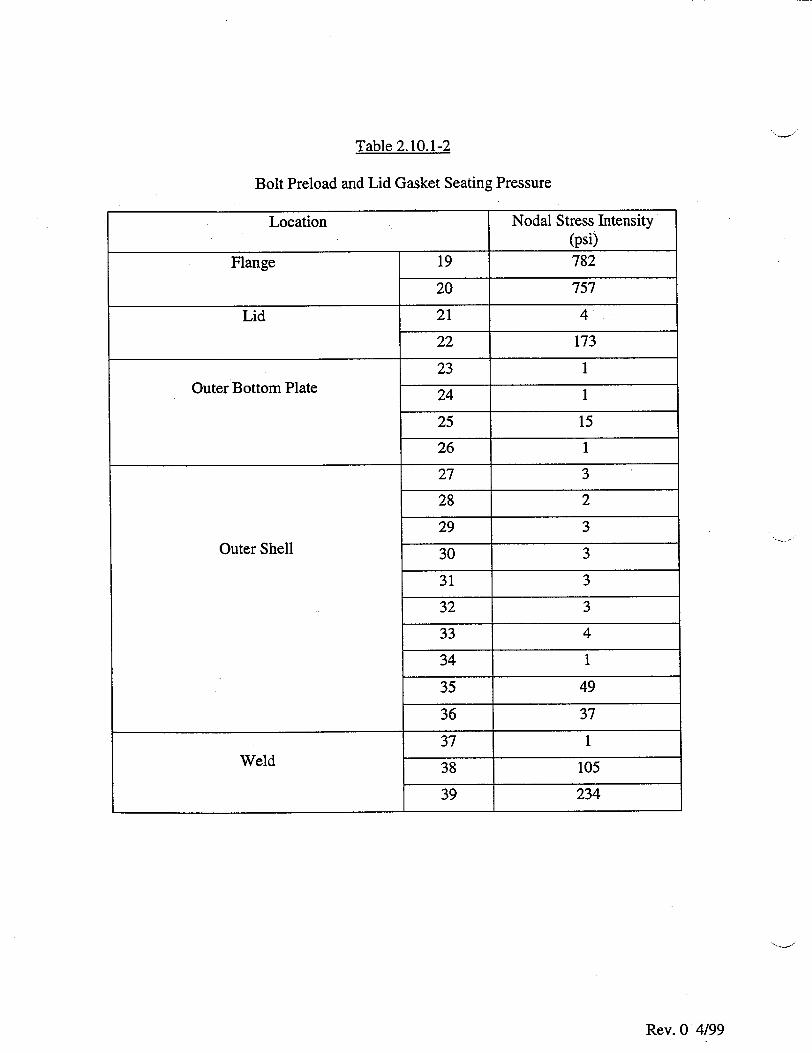
Table 2.10.1-2
Bolt Preload and Lid Gasket Seating Pressure
Location Nodal Stress Intensity (psi)
Flange 19 782
20 757
Lid 21 4
22 173
23 1 Outer Bottom Plate 24 1
25 15
26 1
27 3
28 2
29 3
Outer Shell 30 3
31 3
32 3
33 4
34 1
35 49
36 37
37 1 Weld 38 105
39 234
Rev. 0'4/99

Table 2.10.1-3
Fabrication Stresses
Location Nodal Stress Intensity (psi)
1 2355
2 751 Inner Bottom Plate 3 2355
4 751
5 2192
6 1653
7 9931
8 10076
9 9752
10 9747 Inner Shell1199
11 9749
12 9749
13 9747
14 9741
15 11124
16 9928
17 4326
18 5254
Rev. 0 4/99
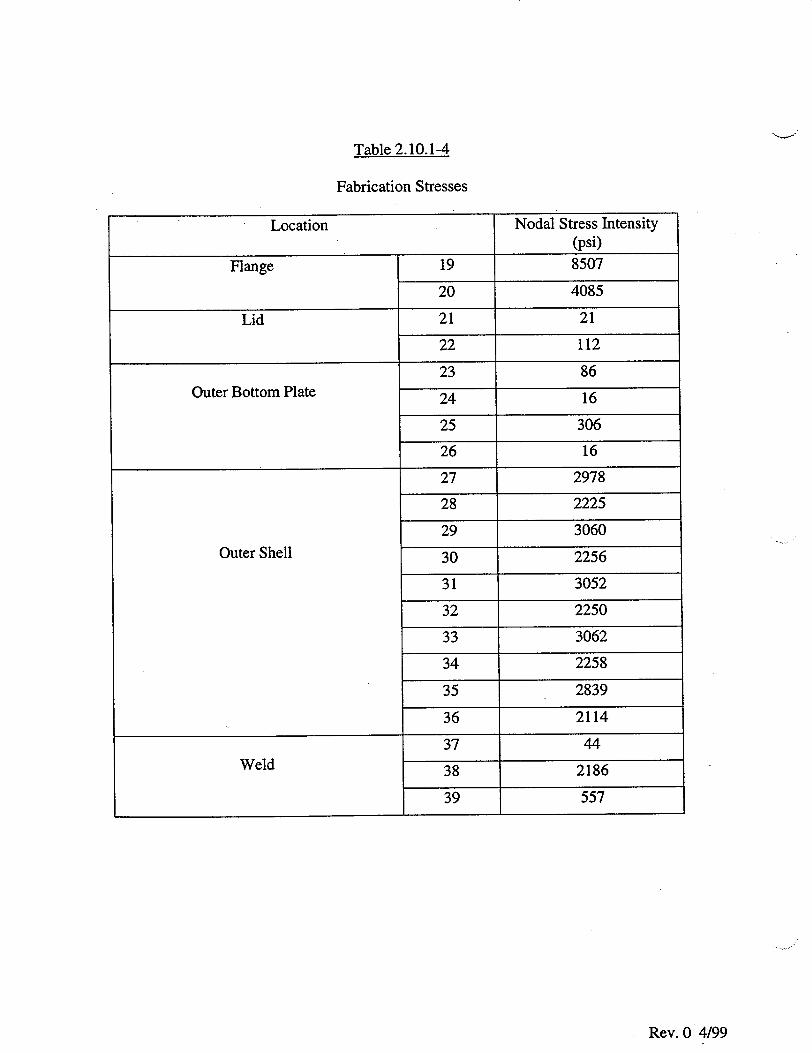
Table 2.10.1-4
Fabrication Stresses
Location Nodal Stress Intensity (psi)
Flange 19 8507
20 4085
Lid 21 21
22 112
23 86 Outer Bottom Plate 24 16
25 306
26 16
27 2978
28 2225
29 3060
Outer Shell 30 2256
31 3052
32 2250
33 3062
34 2258
35 2839
36 2114
37 44
Weld 38 2186
39 557
Rev. 0 4/99

Table 2.10.1-5
Internal Pressure (100 psi)
Location Nodal Stress Intensity (psi)
1 300
2 135 Inner Bottom Plate
3 238
4 73
5 1411
6 732
7 460
8 453
9 598
10 541 Inner Shell
11 586
12 529
13 587
14 532
15 522
16 415
17 636
18 499
Rev. 0 4/99
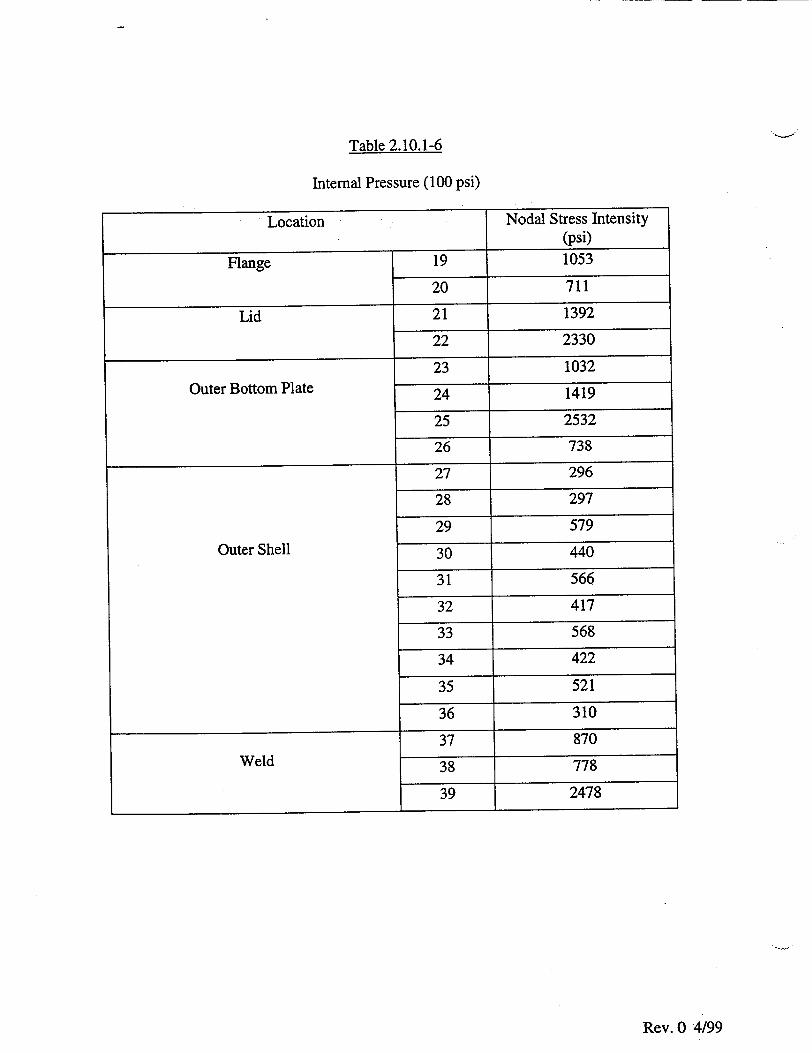
Table 2.10.1-6
Internal Pressure (100 psi)
Location Nodal Stress Intensity (psi)
Flange 19 1053
20 711
Lid 21 1392
22 2330
23 1032
Outer Bottom Plate 24 1419
25 2532
26 738
27 296
28 297
29 579
Outer Shell 30 440
31 566
32 417
33 568
34 422
35 521
36 310
37 870
Weld 38 778
39 2478
Rev. 0 4/99
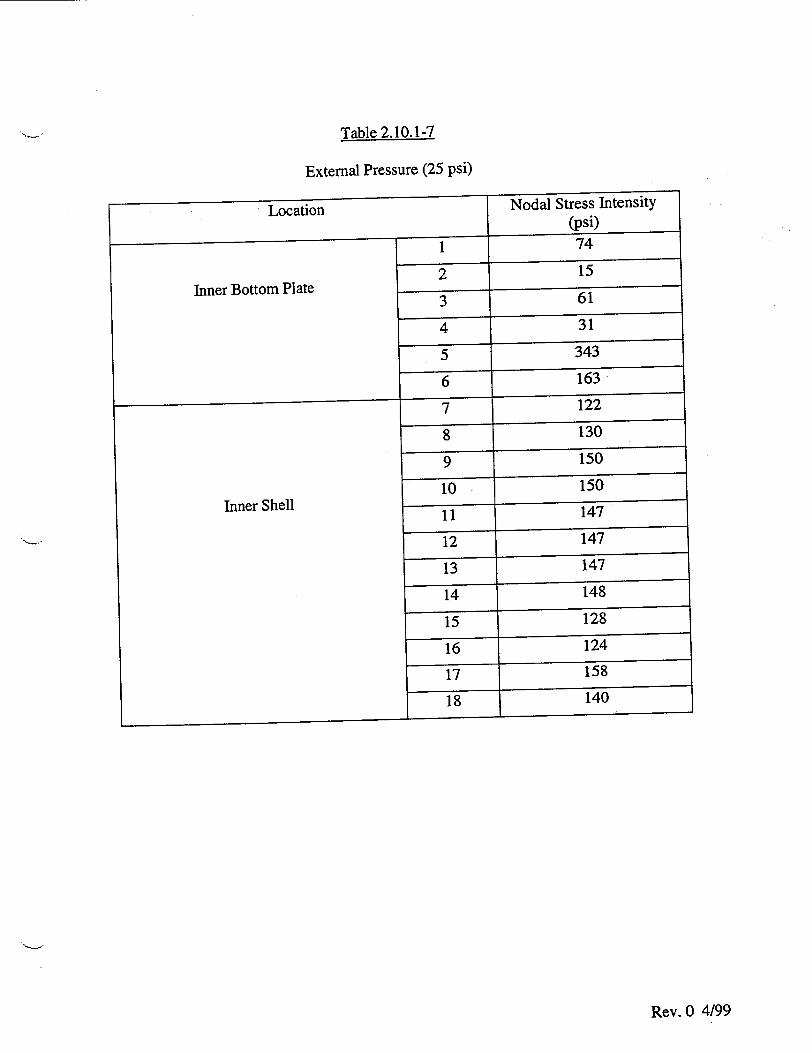
Table 2.10.1-7
External Pressure (25 psi)
Location Nodal Stress Intensity (psi)
1 74 2 15
Inner Bottom Plate
3 61
4 31 5 343
6 163
7 122
8 130
9 150 10 150
Inner Shell
11 147 12 147
13 147
14 148
15 128
16 124
17 158
18 140
Rev. 0 4/99
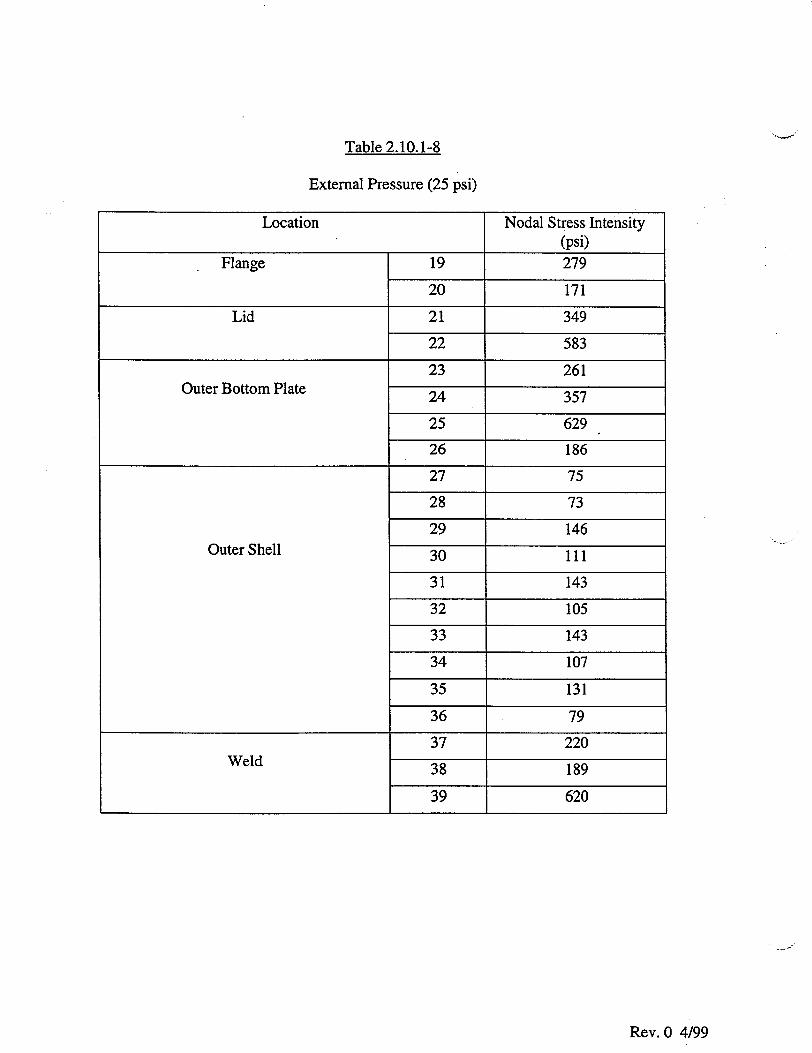
Table 2.10.1-8
External Pressure (25 psi)
Location Nodal Stress Intensity (psi)
Flange 19 279
20 171
Lid 21 349
22 583
23 261 Outer Bottom Plate 24 357
25 629
26 186
27 75
28 73
29 146 Outer Shell 30 111
31 143
32 105
33 143
34 107
35 131
36 79
37 220 Weld 38 189
39 620
Rev. 0 4/99

Table 2.10.1-9
End Drop on Bottom - Rear Impact Limiter (1G)
Location Nodal Stress Intensity (psi)
1 144 2 24
Inner Bottom Plate 3 134
4 39
5 312
6 117
7 102
8 108
9 78
10 79 Inner Shell61
12 61
13 44
14 45
15 37 16 34
17 36
18 23
Rev. 0 4/99
Table 2.10.1-10
End Drop on Bottom - Rear Impact Limiter (1G)
Location Nodal Stress Intensity (psi)
Flange 19 74
20 15
Lid 21 93
22 148
23 312 Outer Bottom Plate 24 303
25 446
26 173
27 139
28 104
29 64 Outer Shell 30 76
31 54
32 54
33 37
34 38
35 35
36 23
37 131 Weld 38 19
39 170
Rev. 0 4/99

Table 2.10.1-11
End Drop on Lid - Front Impact Limiter (1G)
Location
Inner Bottom Plate
Inner Shell
I
Nodal Stress Intensity (psi) 36
2 3
3 33
4 9
5 92
6 37
7 37
8 39
9 45
10 45
11 62
12 62
13 78
14 79
15 109
16 98
17 116
18
Rev. 0 4/99
1
72

Table 2.10.1-12
End Drop on Lid - Front Impact Limiter (I G)
Location Nodal Stress Intensity (psi)
Flange 19 259
20 55
Lid 21 327
22 441
23 82 Outer Bottom Plate 24 96
25 129
26 49
27 40
28 30
29 32 Outer Shell 30 35
31 51
32 51
33 66
34 68
35 118
36 77
37 44 Weld 38 41
39 548
Rev. 0 4/99

Table 2.10.1-13
Thermal Stress at 1000 F Hot Environment
Location Nodal Stress Intensity (psi)
1 2710
2 3281 Inner Bottom Plate
3 2747
4 3269
5 7963
6 4626
7 5713
8 5507
9 5794
10 5426 Inner Shell 11 5599
12 5619
13 6116
14 5244
15 5633 16 6314
17 5303
18 6628
Rev. 0 4/99

Table 2.10.1-14
Thermal Stress at 1000 F Hot Environment
Location Nodal Stress Intensity (psi)
Flange 19 1772
20 3376
Lid 21 2924
22 2058
23 1550 Outer Bottom Plate 24 2449
25 7135
26 2556
27 2839
28 6197
29 4527 Outer Shell 30 6967
31 2905
32 5435
33 4099
34 6551
35 2593
36 4981
37 2783 Weld 38 4860
39 3233
Rev. 0 4/99

Table 2.10.1-15
Thermal Stresses at -201F Environmental Conditions
Location Nodal Stress Intensity (psi)
1 1277 2 1183
Inner Bottom Plate
3 1270
4 1184
5 1415
6 1199
7 1259
8 1266
9 1273
10 1272 Inner Shell 11 1289
12 1290
13 1317
14 1296
15 1253 16 1492
17 1237
18 1404
Rev. 0 4/99

Table 2.10.1-16
Thermal Stresses at -20'F Environmental Conditions
Location Nodal Stress Intensity (psi)
Flange 19 1341
20 1254
Lid 21 1034
22 591
23 61 Outer Bottom Plate 24 410
25 3503
26 180
27 451
28 370
29 420 Outer Shell 30 382
31 409
32 359
33 379
34 365
35 964
36 229
37 161 Weld 38 2005
39 1352
Rev. 0 4/99

Table 2.10.1-17
Thermal Stresses at -40'F Environmental Conditions
Location Nodal Stress Intensity (psi)
1 1533 2 1445
Inner Bottom Plate
3 1529
4 1445
5 1805
6 1447
7 1563
8 1573
9 1579
10 1578 Inner Shell
11 1595
12 1595
13 1624 14 1599
15 1536
16 1836
17 1525
18 1727
Rev. 0 4/99

Table 2.10.1-18
Thermal Stresses at -40TF Environmental Conditions
Rev. 0 4/99
Location Nodal Stress Intensity (psi)
Flange 19 1627
20 1535
Lid 21 1247
22 691
23 34 Outer Bottom Plate 24 434
25 4195
26 205
27 530
28 440
29 500 Outer Shell 30 450
31 460
32 428
33 464
34 439
35 1175
36 286
37 200 Weld 38 2457
39 1680

Table 2.10.1-19
Transport Shock Load/Truck
Horizontal Cask Supported at Rear Trunnions and Front Saddle
(Stress at 1800 Orientation)
Location Nodal Stress Intensity (psi)
1 459 2 407
Inner Bottom Plate 3 262
4 173
5 190
6 432
7 403
8 436
9 427
10 434 Inner Shell11 557
12 609
13 422
14 497
15 1071
16 877
17 1946 18 1310
Rev. 0 4/99
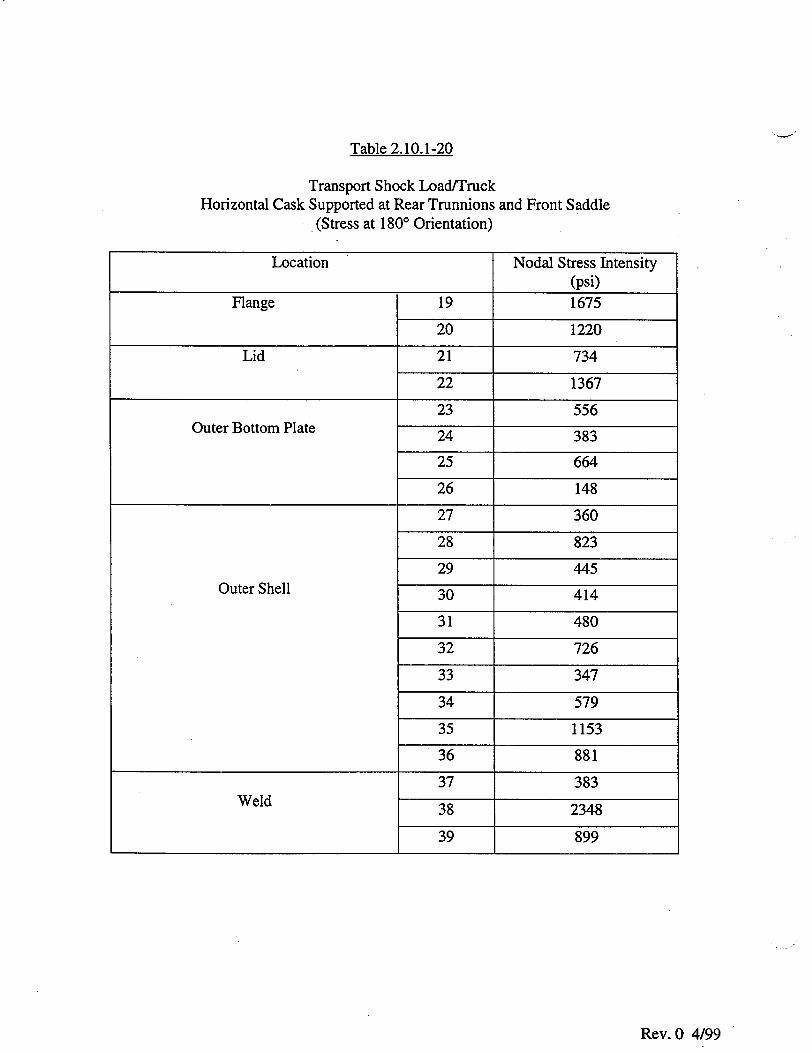
Table 2.10.1-20
Transport Shock Load/Truck Horizontal Cask Supported at Rear Trunnions and Front Saddle
(Stress at 1800 Orientation)
Location Nodal Stress Intensity (psi)
Flange 19 1675
20 1220
Lid 21 734
22 1367
23 556 Outer Bottom Plate 24 383
25 664
26 148
27 360
28 823
29 445 Outer Shell 30 414
31 480
32 726
33 347
34 579
35 1153
36 881
37 383 Weld 38 2348
39 899
Rev. 0 4/99

Table 2.10.1-21
1G Down Load
Horizontal Cask Supported at Rear Trunnions and Front Saddle (Stress at 180' Orientation)
Location Nodal Stress Intensity (psi)
1 109 210
Inner Bottom Plate 3 50
4 46
5 41
6 43
78 93
9 55
10 62
11 102
12 115
13 77
14 95
15 232
16 200
17 467
18
Rev. 0 4/99
Inner Shell
83
334
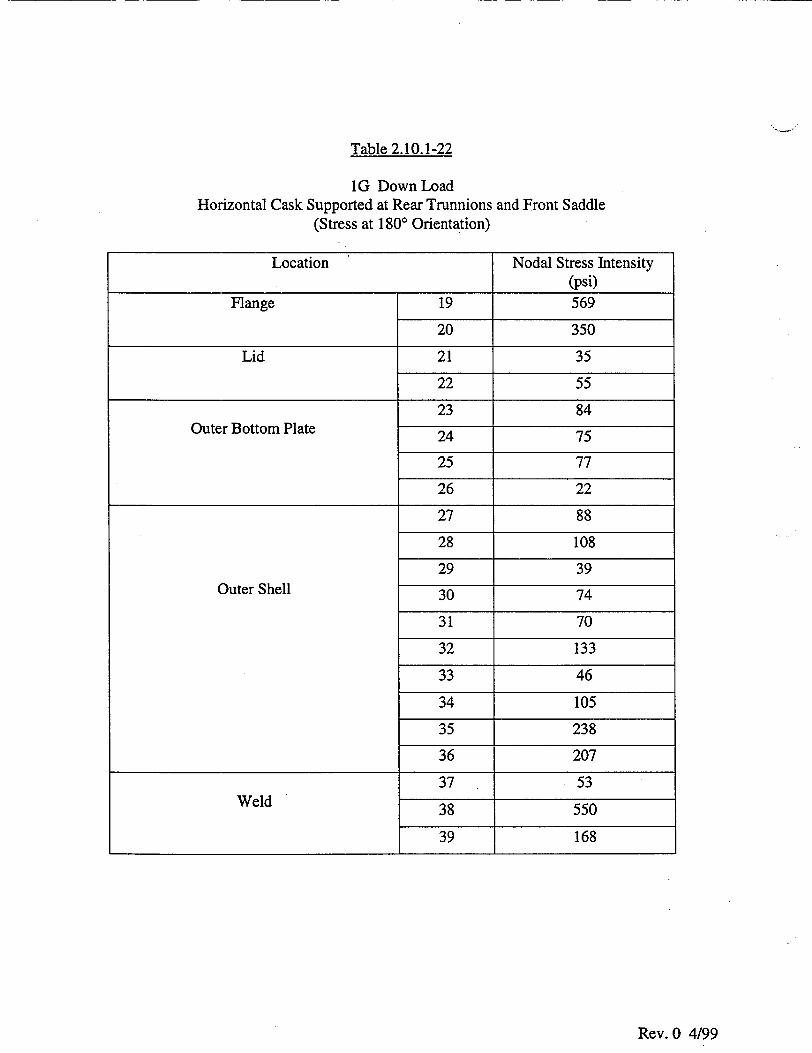
Table 2.10.1-22
1G Down Load Hoiizontal Cask Supported at Rear Trunnions and Front Saddle
(Stress at 180' Orientation)
Location Nodal Stress Intensity (psi)
Flange 19 569
20 350
Lid 21 35
22 55
23 84 Outer Bottom Plate 24 75
25 77
26 22
27 88
28 108
29 39 Outer Shell 30 74
31 70
32 133
33 46
34 105
35 238
36 207
37 53 Weld 38 550
39 168
Rev. 0 4/99

Table 2.10.1-23
Side Drop (IG) (Stress at 900 Orientation)
Rev. 0 4/99

Table 2.10.1-24
Side Drop (IG) (Stress at 900 Orientation)
Location Nodal Stress Intensity (psi)
Flange 19 351
20 272
Lid 21 158
22 219
23 81 Outer Bottom Plate 24 87
25 109
26 49
27 225
28 143
29 138 Outer Shell 30 119
31 60
32 57
33 111
34 91
35 222
36 144
37 204 Weld 38 215
39 48
Rev. 0 4/99

Table 2.10.1-25
Side Drop (I G)
(Stress at Impact Side, 1800 Orientation)
Location Nodal Stress Intensity (psi)
1 54 2 63
-Inner Bottom Plate
3 113
4 120
5 214
6 214
8 55
9 89
10 103
11 130
12 137
13 76
14 89
15 36
16
17
18
150
166
Rev. 0 4/99
Inner Shell
7 1la
150

Table 2.10.1-26
Side Drop (IG) (Stress at Impact Side, 180* Orientation)
Location Nodal Stress Intensity (psi)
Flange 19 297
20 209
Lid 21 260
22 266
23 78 Outer Bottom Plate 24 140
25 153
26 233
27 47
28 134
29 82 Outer Shell 30 155
31 125
32 204
33 107
34 170
35 55
36 178
37 168 Weld 38 224
39 48
Rev. 0 4/99
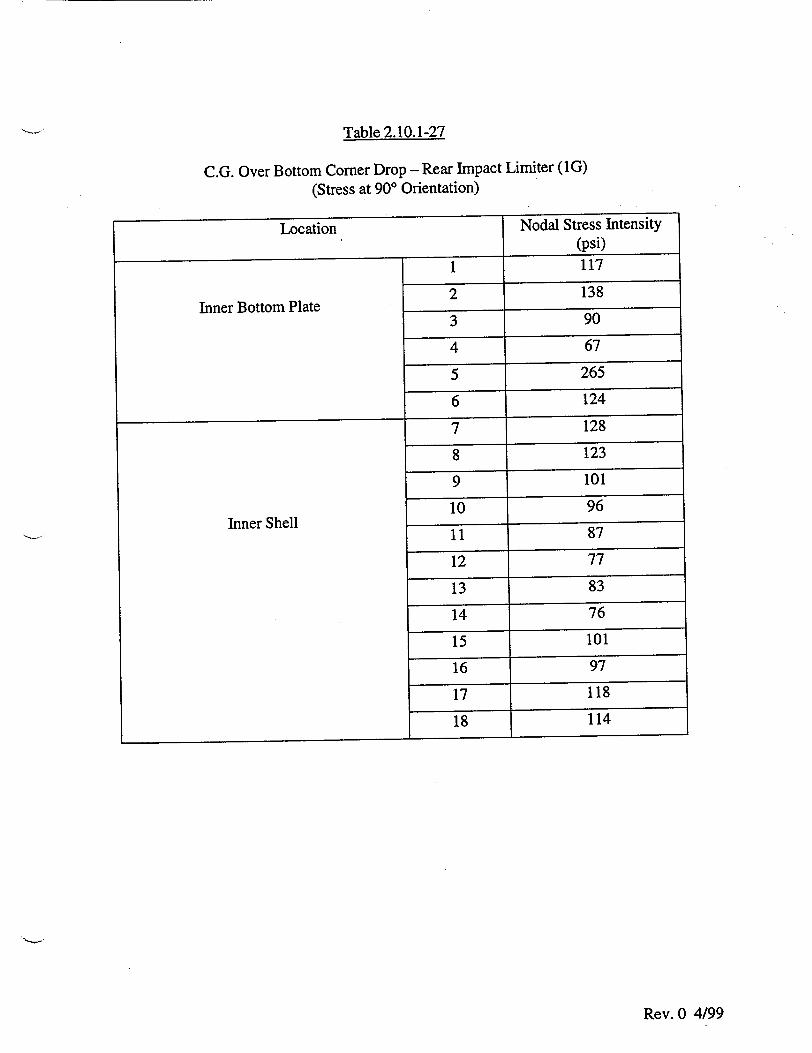
Table 2.10.1-27
C.G. Over Bottom Comer Drop - Rear Impact Limiter (MG) (Stress at 90' Orientation)
Location
Inner Bottom Plate
Inner Shell
Nodal Stress Intensity (psi)
1 117
2 138
3 90
4 67
5 265
6 124
7 128
8 123
9 101
10 96
11 87
12 77
13 83
14 76
15 101
16 97
17 118
18 114
Rev. 0 4/99

Table 2.10.1-28
C.G. Over Bottom Comer Drop - Rear Impact Limiter (IG) (Stress at 90' Orientation)
Location Nodal Stress Intensity (psi)
Flange 19 231
20 179
Lid 21 104
22 145
23 249 Outer Bottom Plate 24 365
25 318
26 174
27 166
28 105
29 101 Outer Shell 30 92
31 76
32 70
33 77
34 65
35 106
36 91
37 146 Weld 38 216
39 128
Rev. 0 4/99

Table 2.10.1-29
C.G. Over Bottom Comer Drop - Rear Impact Limiter (1G) (Stress at Impact Side, 1800 Orientation)
Location Nodal Stress Intensity (psi)
1 351
2 340 Inner Bottom Plate 3 130
4 149
5 233
6 86
Inner Shell
78
9
10
11
12 13
14
15
16
17
18
70
26
29
16
19
8
13
35
40
62
55
Rev. 0 4/99
I
6 1

Table 2.10.1-30
C.G. Over Bottom Comer Drop - Rear Impact Limiter (IG) (Stress at Impact Side, 1800 Orientation)
Location Nodal Stress Intensity (psi)
Flange 19 96
20 57
Lid 21 144
22 119
23 332 Outer Bottom Plate 24 580
25 466
26 158
27 101
28 18
29 38 Outer Shell 30 44
31 14
32 54
33 580
34 54
35 26
36 43
37 205 Weld 38 51
39 102
Rev. 0 4/99

Table 2.10.1-31
C.G. Over Lid Comer Drop - Front Impact Limiter (I G) (Stress at 90' Orientation)
-V Nodal Stress Intensity (psi)
1 102
2 148 Inner Bottom Plate
3 64
4 57
5 120
6 75
8 97
9 83
10 75
11 89
12 80
13 112
14 107
15 174
16 153
17 182
18
Rev. 0 4/99
Location
Inner Shell
IV,,+7
146

Table 2.10.1-32
C.G. Over Lid Comer Drop - Front Impact Limiter (MG) (Stress at 90' Orientation)
Location Nodal Stress Intensity (psi)
Flange 19 433
20 171
Lid 21 317
22 550
23 123 Outer Bottom Plate 24 119
25 140
26 49
27 123
28 79
29 81
Outer Shell 30 68
31 74
32 68
33 93
34 86
35 169
36 102
37 112 Weld 38 71
39 402
Rev. 0 4/99
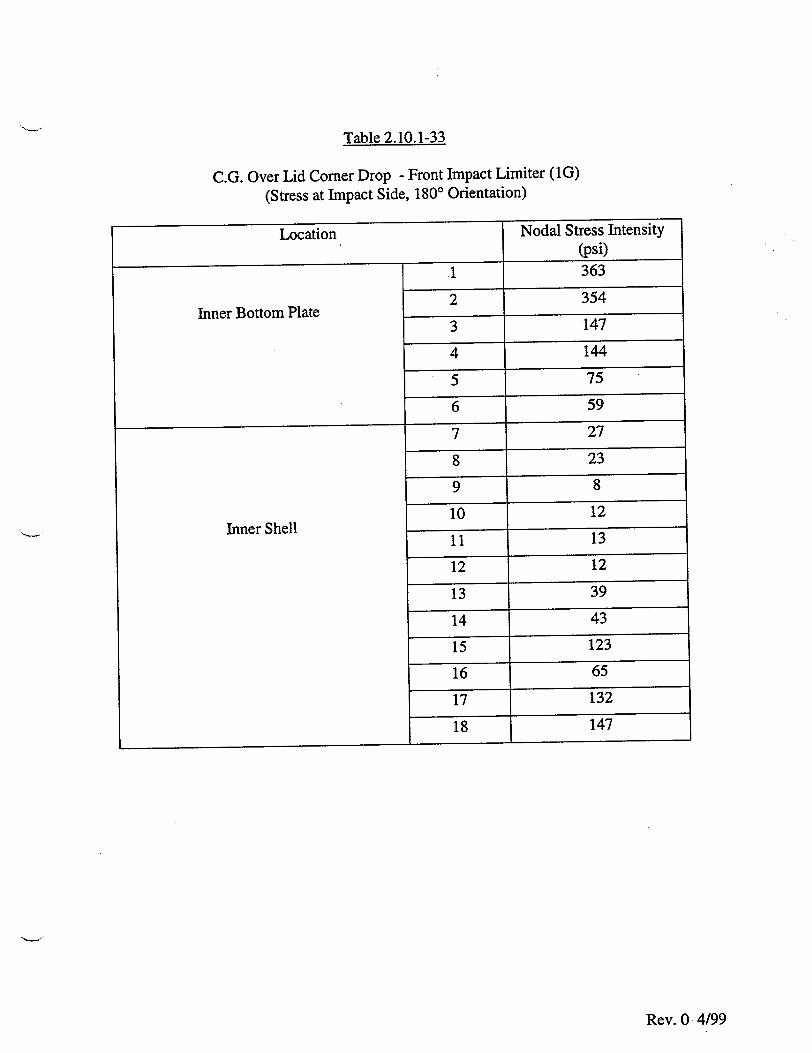
Table 2.10.1-33
C.G. Over Lid Comer Drop - Front Impact Limiter (1G)
(Stress at Impact Side, 1800 Orientation)
Location
Inner Bottom Plate
Inner Shell
Rev. 0 4/99
Nodal Stress Intensity (psi)
.1 363
2 354
3 147
4 144
5 75
6 59
7 27
8 23
9 8
10 12
11 13
12 12
13 39
14 43
15 123
16 65
17 132
18 147
I
i

Table 2.10.1-34
C.G. Over Lid Comer Drop - Front Impact Limiter (IG) (Stress at Impact Side, 1800 Orientation)
Location Nodal Stress Intensity (psi)
Flange 19 273
20 178
Lid 21 284
22 659
23 297 Outer Bottom Plate 24 277
25 164
26 112
27 37
28 60
29 19 Outer Shell 30 51
31 21
32 61
33 13
34 48
35 156
36 73
37 69 Weld 38 237
39 416
Rev. 0 4/99
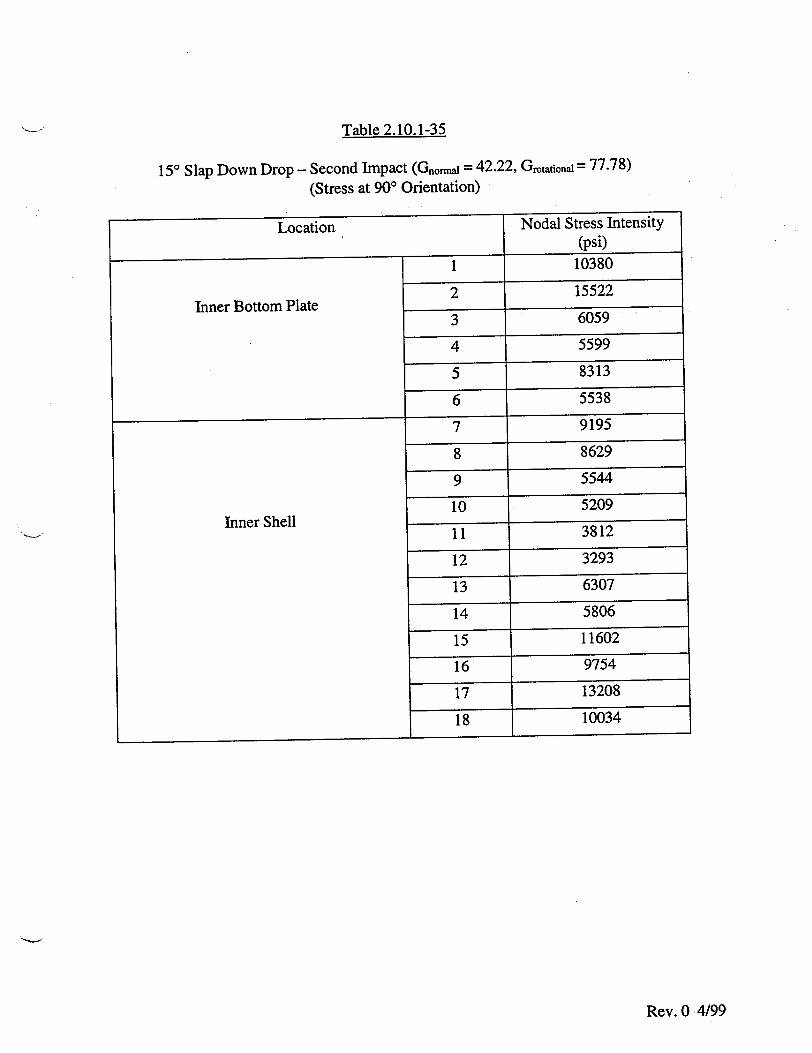
Table 2.10.1-35
150 Slap Down Drop - Second Impact (Gnomal = 42.22, G ucational = 77.78)
(Stress at 90* Orientation)
Location Nodal Stress Intei (psi)
1 10380 2 15522
Inner Bottom Plate
3 6059
4 5599
5 8313
6 5538
7 9195
8 8629
9 5544
10 5209 Inner Shell
11 3812
12 3293
13 6307
14 5806
15 11602
16 9754
17 13208
18 10034
nsity
Rev. 0 4/99
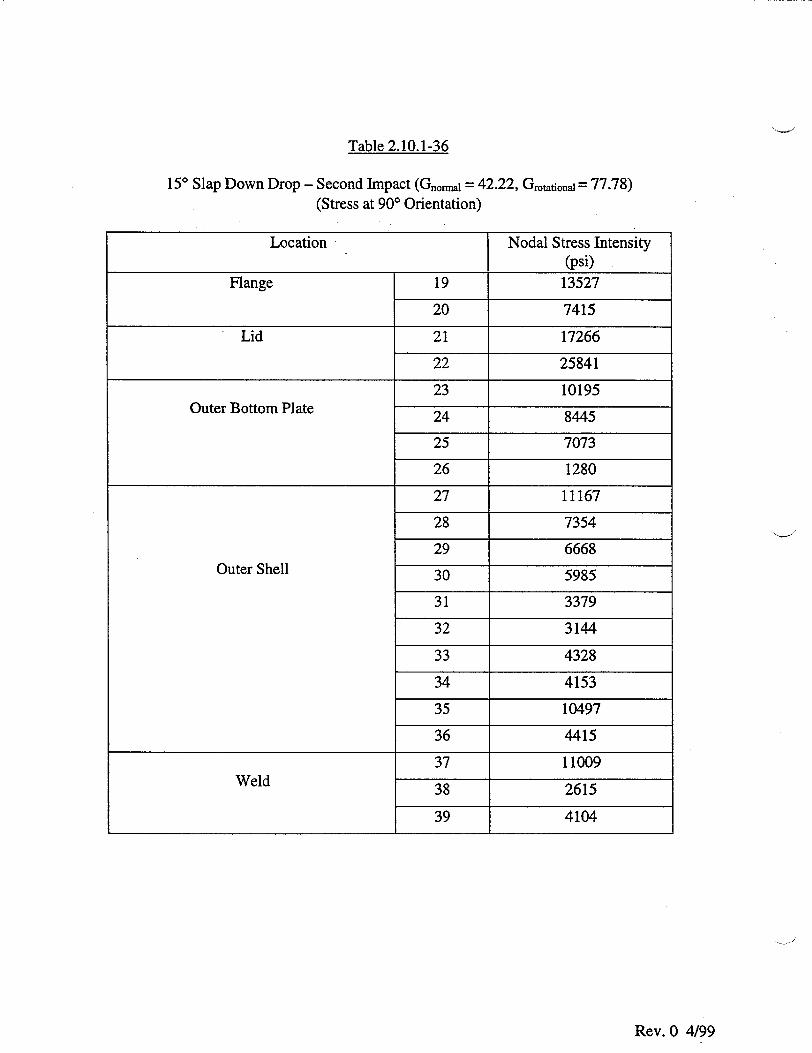
Table 2.10.1-36
150 Slap Down Drop - Second Impact (Gnom = 42.22, Grotatjona = 77.78) (Stress at 90' Orientation)
Location Nodal Stress Intensity (psi)
Flange 19 13527
20 7415
Lid 21 17266
22 25841
23 10195 Outer Bottom Plate 24 8445
25 7073
26 1280
27 11167
28 7354
29 6668 Outer Shell 30 5985
31 3379
32 3144
33 4328
34 4153
35 10497
36 4415
37 11009 Weld 38 2615
39 4104
Rev. 0 4/99

Table 2.10.1-37
15' Slap Down Drop - Second Impact (Gno.0 l = 42.22, Gottjor0 = 77.78) (Stress at Impact Side, 1800 Orientation)
Location Nodal Stress Intensity (psi)
1 37507
2 36377 Inner Bottom Plate
3 14637
4 13805
5 7478
6 8201
7 99
8 1571
9 3571
10 3680 Inner Shell
11 5612
12 5816
13 3366
14 4212
15 3469
16 3198
17 14353
18 15655
Rev. 0 4/99
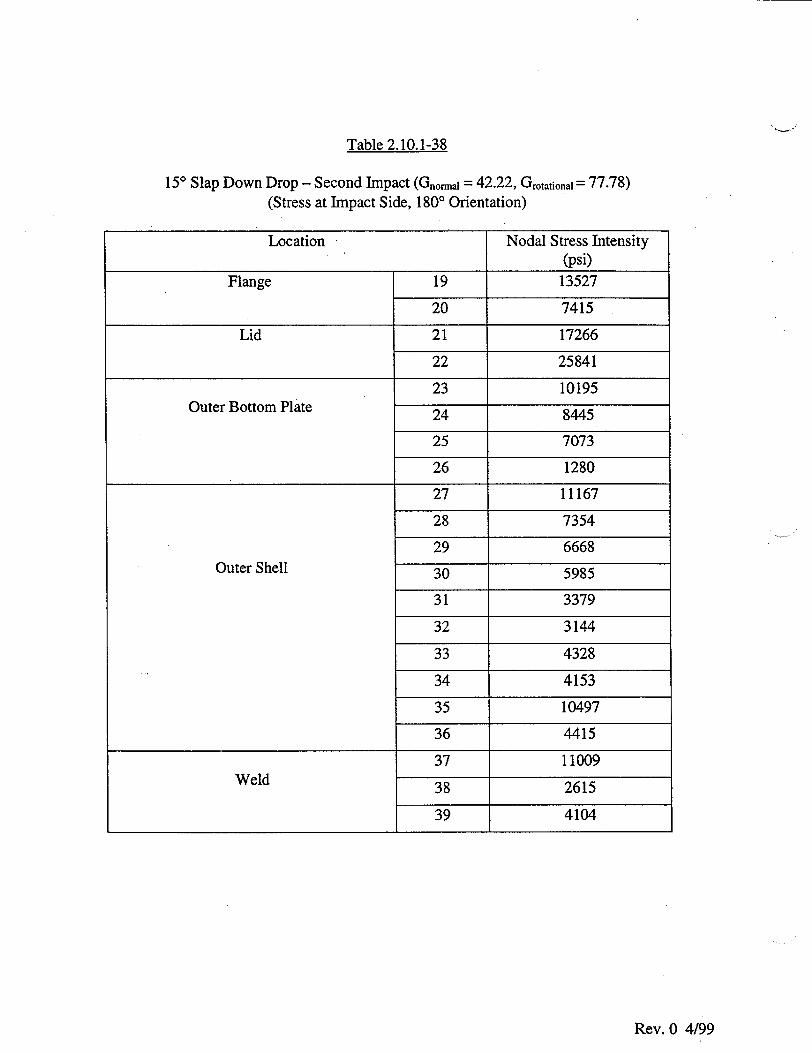
Table 2.10.1-38
150 Slap Down Drop - Second Impact (Gnomia = 42.22, Grotatjonal = 77.78) (Stress at Impact Side, 180* Orientation)
Location Nodal Stress Intensity (psi)
Flange 19 13527
20 7415
Lid 21 17266
22 25841
23 10195 Outer Bottom Plate 24 8445
25 7073
26 1280
27 11167
28 7354
29 6668 Outer Shell 30 5985
31 3379
32 3144
33 4328
34 4153
35 10497
36 4415
37 11009 Weld 38 2615
39 4104
Rev. 0 4/99

Table 2.10.1-39
Fire Accident
Location
Inner Bottom Plate
Inner Shell
Nodal Stress Intensity (psi) 2350
2822
2198
2877
6409
4447
5625
4764
5392
4993
5208
5175
5704
4824
7361
3052
7992
2429
Rev. 0 4/99
1
2
3
4
5
6
7
8
9
10
11
12
13
14
15
16
17
18

Table 2.10.1-40
Fire Accident
Location Nodal Stress Intensity (psi)
Flange 19 7544
20 8626
Lid 21 3393
22 2870
23 5139 Outer Bottom Plate 24 4252
25 6512
26 4836
27 8873
28 17653
29 5253 Outer Shell 30 7506
31 4018
32 6480
33 5248
34 7211
35 2483
36 8882
37 3853 Weld 38 34774
39 4568
Rev. 0 4/99
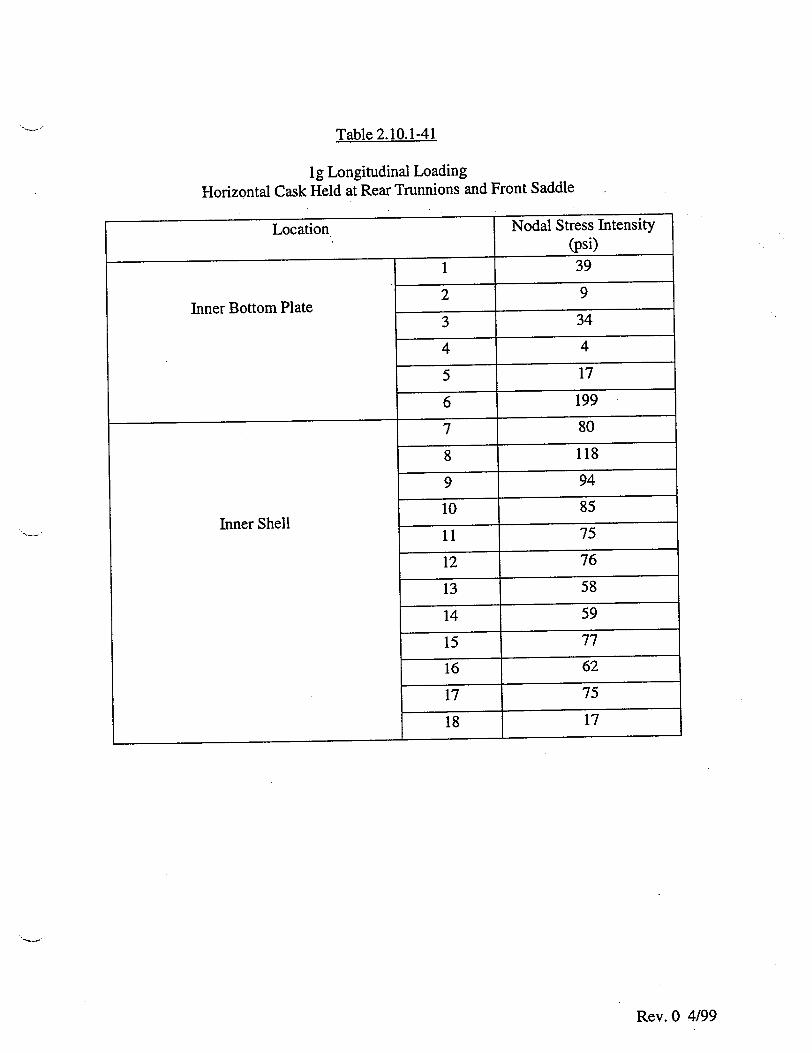
Table 2.10.1-41
lg Longitudinal Loading Horizontal Cask Held at Rear Trunnions and Front Saddle
T .. n . i�oaai �tress 1flL�flS1LYLocation
Inner Bottom Plate
Inner Shell
I I
1
Nodal Stress Intens(ty (psi)
2 9
3 34
4 4
5 17
6
7
8
9
10
11
12
13
14
15
16
17
18
199
80 118
94 85
75
76 58
59
77
62
75
17
Rev. 0 4/99
• ml,.3y

Table 2.10.1-42
lg Longitudinal Loading Horizontal Cask Held at Rear Trunnions and Front Saddle
Location Nodal Stress Intensity (psi)
Flange 19 233
20 70
Lid 21 335
22 569
23 113 Outer Bottom Plate 24 141
25 417
26 72
27 72
28 282
29 128
Outer Shell 30 90
31 92
32 93
33 74
34 77
35 110
36 57
37 85 Weld 38 101
39 640
Rev. 0 4/99

Table 2.10.1-43
Transport Truck Vibration Load (0.3g Long., 0.3g Lat., 0.6g Vert.)
Horizontal Cask Held at Rear Trunnions and Front Saddle
Location Nodal Stress Intensity (psi)
1 76
2 71 Inner Bottom Plate 3 431s
4 30
5 31
6 55
7 66
8 71
9 65
10 67 Inner Shell90
12 99
13 68
14 81 15 179
16 146
17 332
18 227
Rev. 0 4/99

Table 2.10.1-44
Transport Truck Vibration Load (0.3g Long., 0.3g Lat., 0.6g Vert.) Horizontal Cask Held at Rear Trunnions and Front Saddle
Rev. 0 4/99
Location Nodal Stress Intensity (psi)
Flange 19 314
20 219
Lid 21 95
22 181
23 86 Outer Bottom Plate 24 52
25 74
26 21
27 61
28 125
29 65 Outer Shell 30 63
31 74
32 117
33 53
34 93
35 190
36 150
37 25 Weld 38 396
39 96
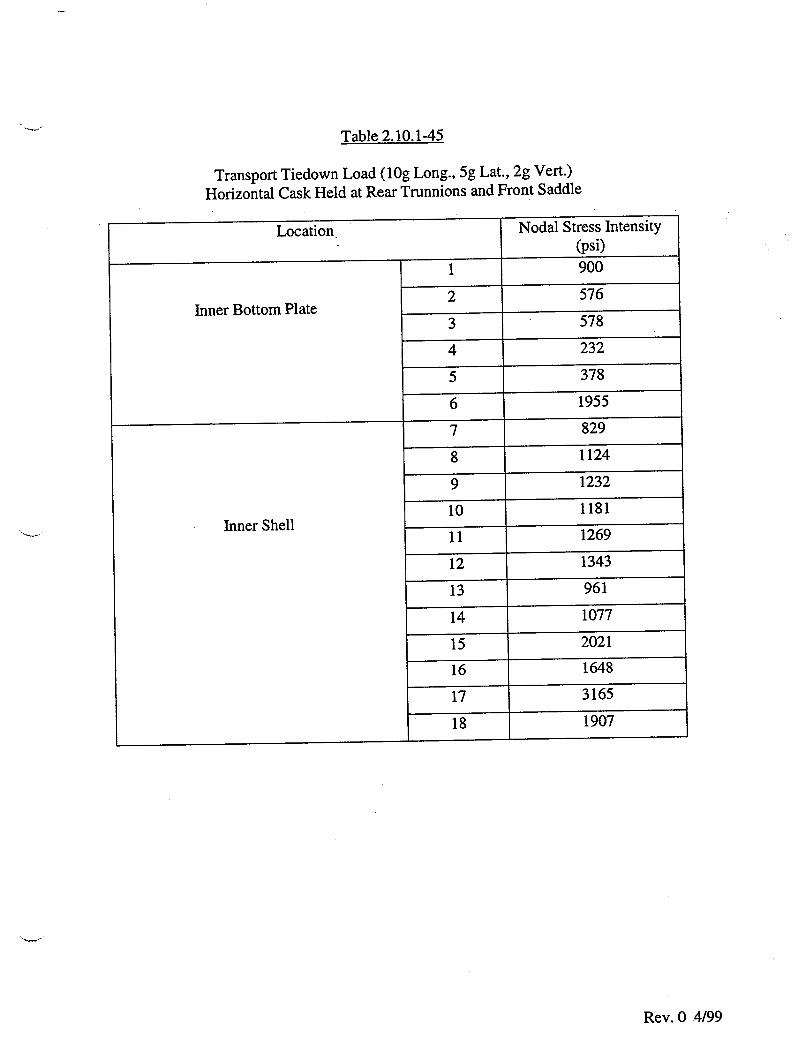
Table 2.10.1-45
Transport Tiedown Load (10g Long., 5g Lat., 2g Vert.)
Horizontal Cask Held at Rear Trunnions and Front Saddle
Location
Inner Bottom Plate
T
Inner Shell
1
2
3
4
5
6
7 8
9
10
11
12
13
14
15
16
17
18
Rev. 0 4/99
Nodal Stress Intensity (psi) 900
576
578
232
378
1955
829
1124
1232
1181
1269
1343
961
1077
2021
1648
3165
1907

Table 2.10.1-46
Transport Tiedown Load (1Og Long., 5g Lat., 2g Vert.) Horizontal Cask Held at Rear Trunnions and Front Saddle
Location Nodal Stress Intensity (psi)
Flange 19 1311
20 1332
Lid 21 3243
22 5770
23 1497
Outer Bottom Plate 24 1493
25 3753
26 666
27 712
28 2889
29 1494
Outer Shell 30 1190
31 1294
32 1646
33 986
34 1333
35 2340
36 1517
37 663
Weld 38 3972
39 5562
Rev. 0 4/99

Table 2.10
6g Lifting Load c (Cask Ver
Location
Inner Bottom Plate
Inner Shell
.1-47
,n Trunnion tical)
Nodal Stress Intensity
(psi)
1 797
2 13
3 700
4 167
5 1961
6 1323
7 501
8 547
9 428
10 432
11 558
12 559
13 693
14 631
15 812
16 669
17 755
18 939
Rev. 0 4/99

Table 2.10.1-48
6g Lifting Load on Trunnion (Cask Vertical)
Location Nodal Stress Intensity (psi)
Flange 19 579
20 791
Lid 21 351
22 625
23 1932 Outer Bottom Plate 24 2465
25 3712
26 1223
27 851
28 591
29 445 Outer Shell 30 535
31 607
32 608
33 800
34 676
35 118
36 1243
37 1216 Weld 38 427
39 846
Rev. 0 4/99

Table 2.10.1-49
Local Stresses at Rear Trunnion / Cask Body Interface with Ig Down Load
(Cask Horizontal)
Location Nodal Stress Intensity (psi)
1
2
Inner Bottom Plate 3
4
5
6
7 704 8 704
9
10 Inner Shell11
12
13
14
15 16
17
18
Rev. 0 4/99

Table 2.10.1-50
Local Stresses at Rear Trunnion / Cask Body Interface with Ig Down Load (Cask Horizontal)
Location Nodal Stress Intensity (psi)
Flange 19
20
Lid 21
22
23 Outer Bottom Plate 24
25
26
27 756
28 756
29
Outer Shell 30
31
32
33
34
35
36
37
Weld 38
39
Rev. 0 4/99

Table 2.10.1-51
Local Stresses at Rear Trunnion / Cask Body Interface with Truck Shock Loads
(Cask Horizontal)
Location Nodal Stress Intensity (psi)
1
2
Inner Bottom Plate
3
4
5
6 7 6385
8 6385
9
10 Inner Shell1
12
13
14
15
16
17
18
Rev. 0 4/99

Table 2.10.1-52
Local Stresses at Rear Trunnion / Cask Body Interface with Truck Shock Loads (Cask Horizontal)
Location Nodal Stress Intensity (psi)
Flange 19
20
Lid 21
22
23 Outer Bottom Plate 24
25
26
27 6385
28 7989
29 Outer Shell 30
31
32
33
34
35
36
37 Weld 38
39
Rev. 0 4/99
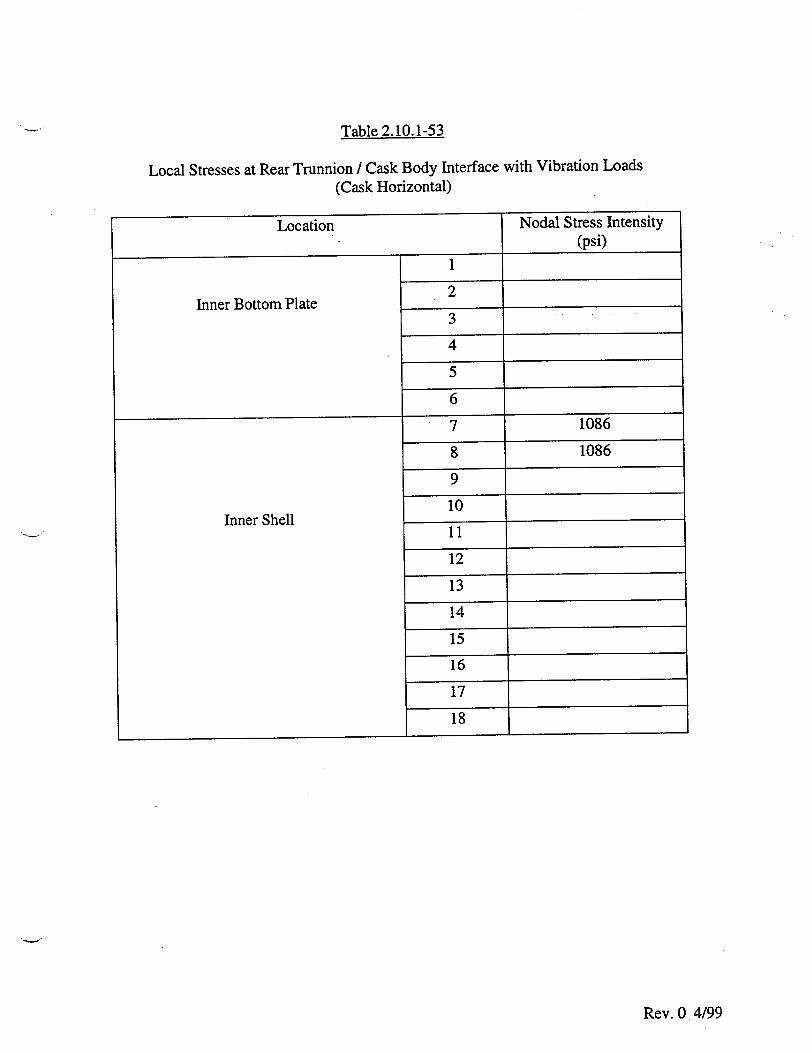
Table 2.10.1-53
Local Stresses at Rear Trunnion / Cask Body Interface with Vibration Loads (Cask Horizontal)
Location Nodal Stress Intensity (psi)
1
2 Inner Bottom Plate
3
4
5
6
7 1086
8 1086
9
10 Inner Shell 11
12
13
14
15
16
17
18
Rev. 0 4/99

Table 2.10.1-54
Local Stresses at Rear Trunnion / Cask Body Interface with Vibration Loads (Cask Horizontal)
Location Nodal Stress Intensity (psi)
Flange 19
20
Lid 21
22
23 Outer Bottom Plate 24
25
26
27 1086
28 1383
29 Outer Shell 30
31
32
33
34
35
36
37 Weld 38
39
Rev. 0 4/99
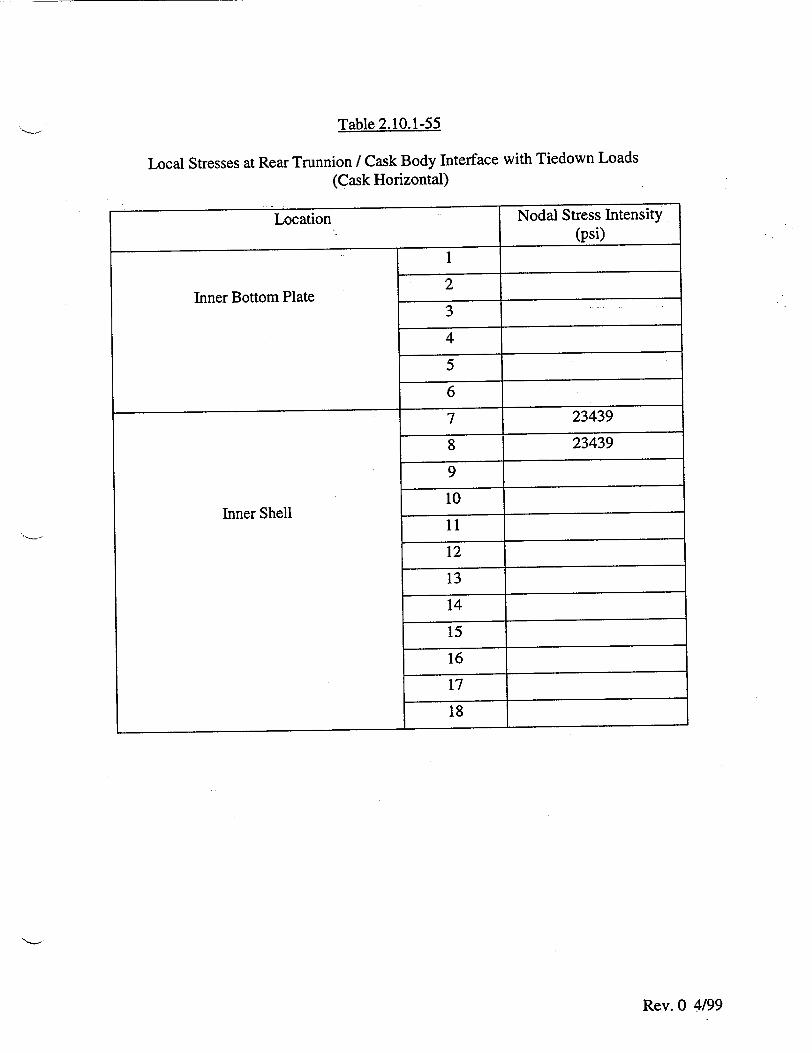
Table 2.10.1-55
Local Stresses at Rear Trunnion / Cask Body Interface with Tiedown Loads (Cask Horizontal)
Location Nodal Stress Intensity (psi)
1
2 Inner Bottom Plate
3
4
5
6
7 23439
8 23439
9
10 Inner Shell
11
12
13
14
15
16
17
18
Rev. 0 4/99

Table 2.10.1-56
Local Stresses at Rear Trunnion / Cask Body Interface with Tiedown Loads (Cask Horizontal)
Location Nodal Stress Intensity (psi)
Flange 19
20
Lid 21
22
23 Outer Bottom Plate 24
25
26
27 27904
28 27904
29 Outer Shell 30
31
32
33
34
35
36
37 Weld 38
39
Rev. 0 -4/99
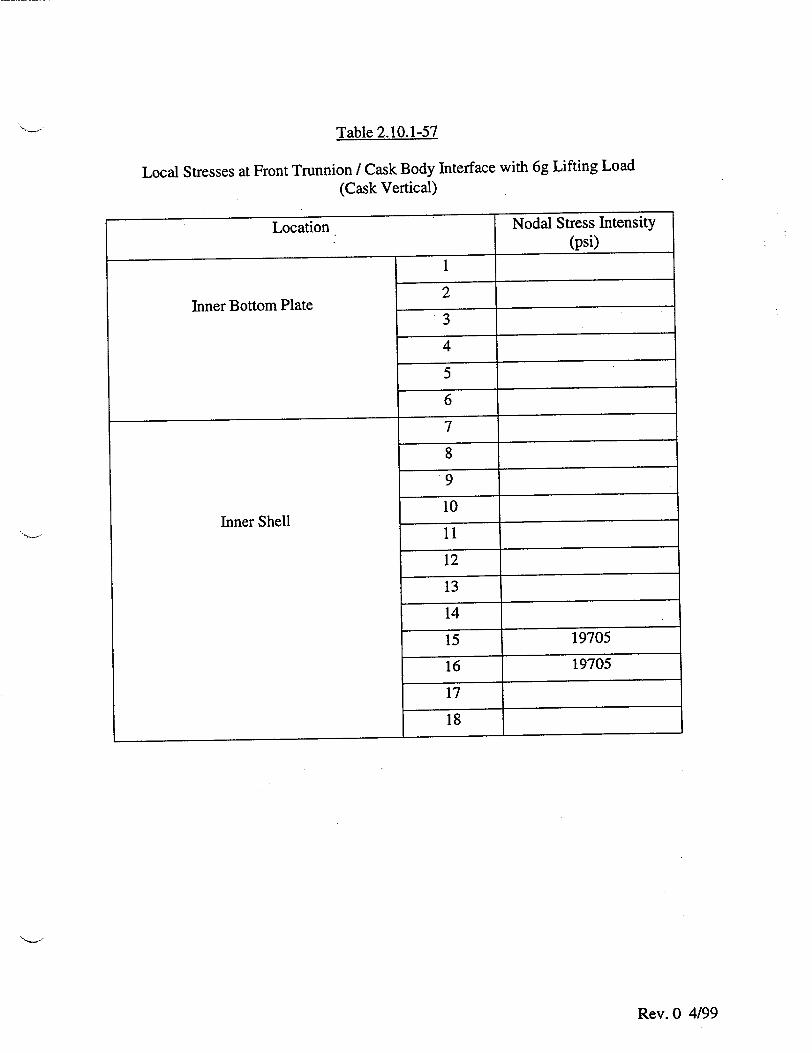
Table 2.10.1-57
Local Stresses at Front Trunnion / Cask Body Interface with 6g Lifting Load (Cask Vertical)
Nodal Stress Intensity (psi)
1
2 Inner Bottom Plate
3
4
5
6
_________________________________________ I.8
9 10
11
12
13
14
15 19705
16 19705
17
18
Rev. 0 4/99
Location
Inner Shell
7

Table 2.10.1-58
Local Stresses at Front Trunnion / Cask Body Interface with 6g Lifting Load (Cask Vertical)
Location Nodal Stress Intensity (psi)
Flange 19
20
Lid 21
22
23 Outer Bottom Plate 24
25
26
27
28
29 Outer Shell 30
31
32
33
34
35 19705
36 19705
37 Weld 38
39
Rev. 0 4/99

Table 2.10.1-59
Local Stresses at Rear Trunnion / Cask Body Interface with Rail Car Shock Load (Cask Horizontal)
Location Nodal Stress Intensity (psi)
1 2
Inner Bottom Plate 3
4
5
6
7 14089 8 14089
9
10 Inner Shell
12
13
14
15
16
17
18
Rev. 0 4/99
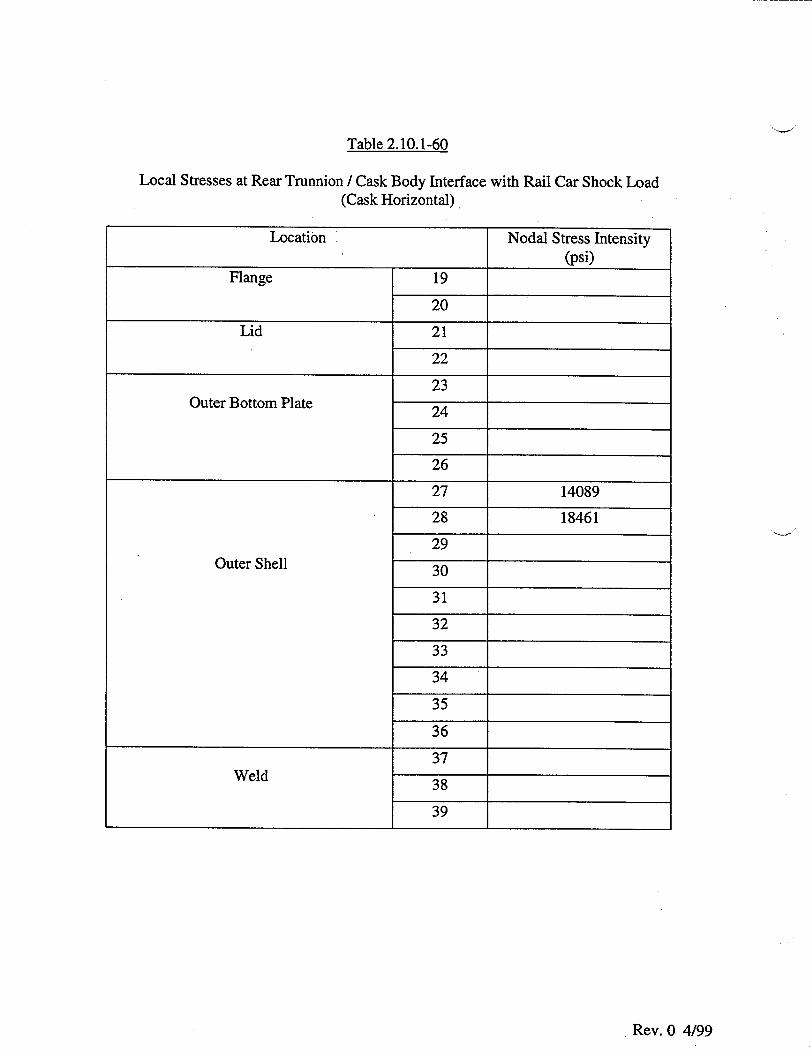
Table 2.10.1-60
Local Stresses at Rear Trunnion / Cask Body Interface with Rail Car Shock Load (Cask Horizontal)
Location Nodal Stress Intensity (psi)
Flange 19
20
Lid 21
22
23 Outer Bottom Plate 24
25
26
27 14089
28 18461
29 Outer Shell 30
31
32
33
34
35
36
37 Weld 38
39
Rev. 0 4/99
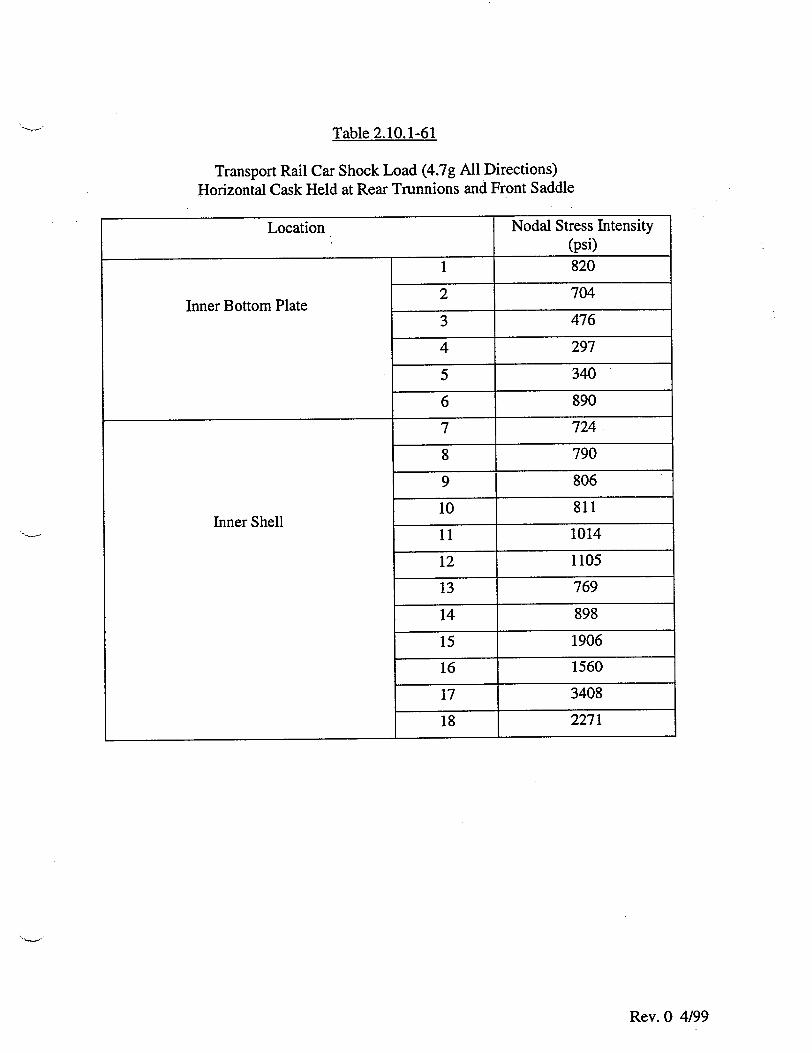
Table 2.10.1-61
Transport Rail Car Shock Load (4.7g All Directions) Horizontal Cask Held at Rear Trunnions and Front Saddle
Location Nodal Stress Intensity (psi)
1 820 2 704
Inner Bottom Plate
3 476
4 297
5 340
6 890
7 724
8 790
9 806
10 811 Inner Shell
11 1014
12 1105
13 769
14 898
15 1906
16 1560
17 3408
18 2271
Rev. 0 4/99
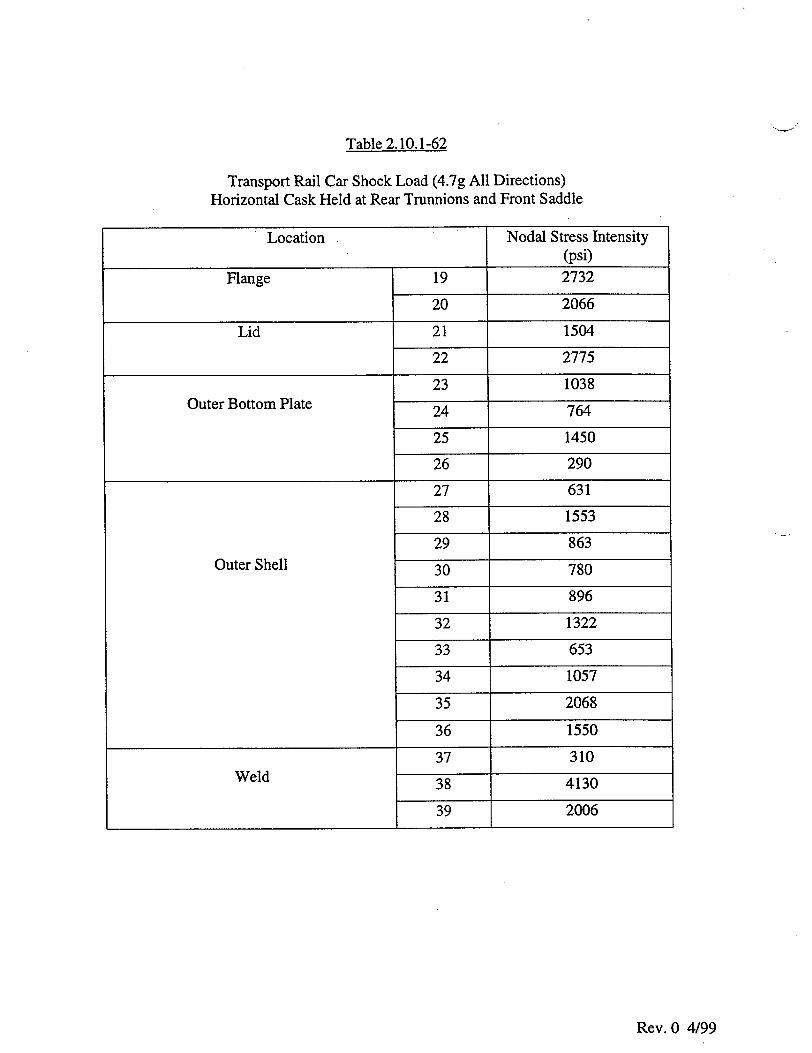
Table 2.10.1-62
Transport Rail Car Shock Load (4.7g All Directions) Horizontal Cask Held at Rear Trunnions and Front Saddle
Location Nodal Stress Intensity (psi)
Flange 19 2732
20 2066
Lid 21 1504
22 2775
23 1038 Outer Bottom Plate 24 764
25 1450
26 290
27 631
28 1553
29 863 Outer Shell 30 780
31 896
32 1322
33 653
34 1057
35 2068
36 1550
37 310 Weld 38 4130
39 2006
Rev. 0 4/99
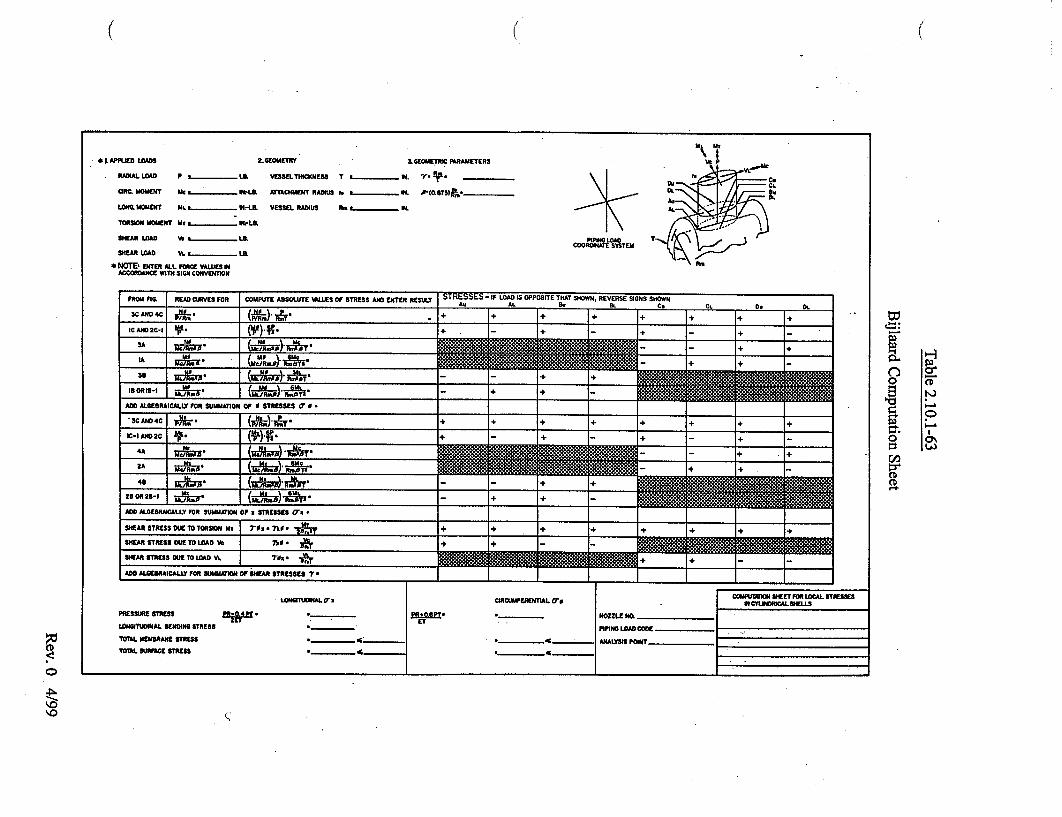
(
Sf APP.LD LOADS
RADIAL LOAD P I. L8.
CIRC. MOMENT Mo w 6,-LR
LONG. MOMENT MLI N-.-.-.. . H-LBL
TORSION MOMENT Mv I - IK-LB.
SHEAR LOAD VS LB.
SJHEAR WAD VI. L...... LL.
* NOTE- ENTER ALL FORCE VALUES IN ACCORDANCE WITH SIGN CONVENTION
L fOMLM I &GEOMETRIC PARAMETERS
VESSELTHICKNESN T L.%-.. _ I. "* . -r
ArlACHNENT RADIUS ft L. . I. O.N"ST5lR.
VESSEL RADIUS R- I - *4
/ (
DL. Au'
COO=4LA EM T
FROM FIG. READ CURVES FOR COMPUTE ANSOLUTE WUES OF STRESS AND SNTES RESULT SAS AL a. . el PT DL
SA RND 4CftTRIN W.J .& I + + +.4 + + SE ATE S•-1 TrE U DV 4 .-- ÷
115Am~~~~~~~ +TESCET A I U
ADD ALGEBRAICALLY FOR SUMMATION Of A STRESSES 17.0
3C EAN TRSDIETfSN 4C a-x*T I +" + + + + +
ADD AL.GEBRAICALL.Y FOR SUMMATION OF STRESSES ý7,
LONGM
PRESSURE STRESS
LONGITUDINAL SENDING STRESS TOTAL MEMBRANE STRESS
TOhU. SUIffCE STRESS
"MCT °*,1 40,•.1•
CIDmAmEmrNTIAL omp OIW I SIME FOR LOCAL SYSESLES
SINCTLISIMOCAL SHELLS5
NOZZLE NO.
PIPING LOAD COD
"* G ANALYSIS POINTe
tz
o CD
o a
CD
0

THIS PAGE IS INTENTIONALLY LEFT BLANK.
Rev. 0 4/99
FIGURE 2.10.1-1
CASK BODY KEY DIMENSIONS REV. 0 4/99

y
-sH'L E T /
7_ FA. 3..
ZIAE Z5
FIGURE 2.10.1-2 CASK BODY FINITE
ELEMENT MODELREV. 0 4/99
x---snow
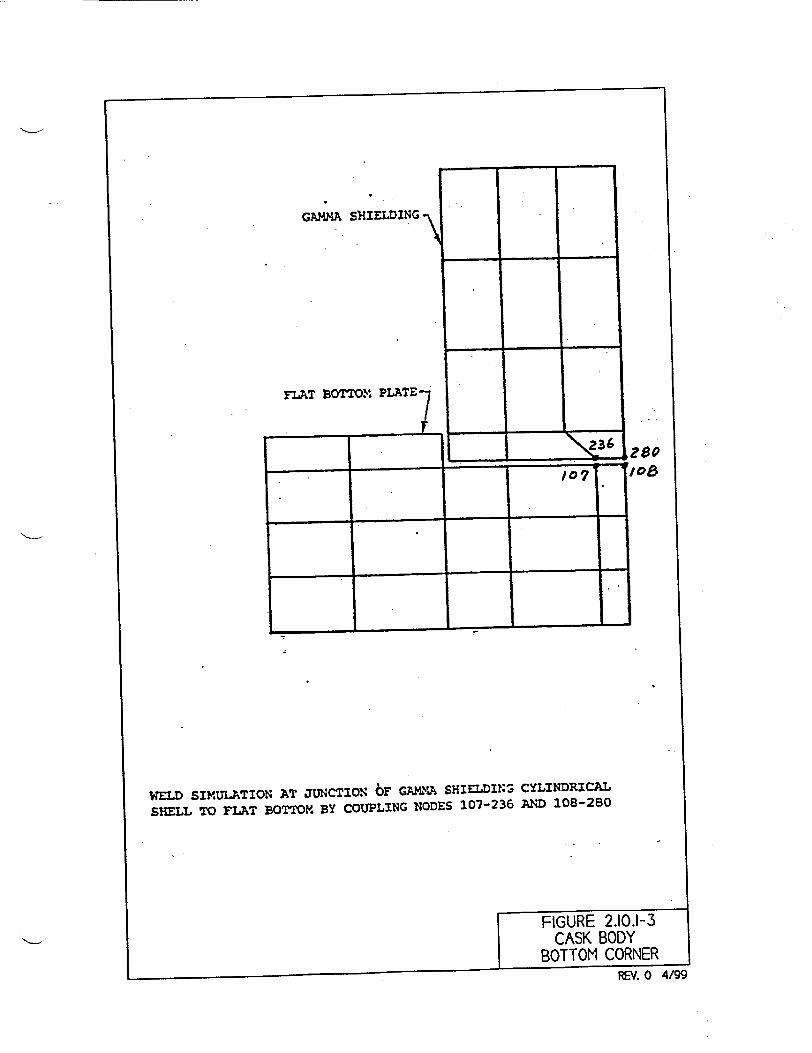
FIGURE 2.10.1-3 CASK BODY
BOTTOM CORNER REV. 0 4/99
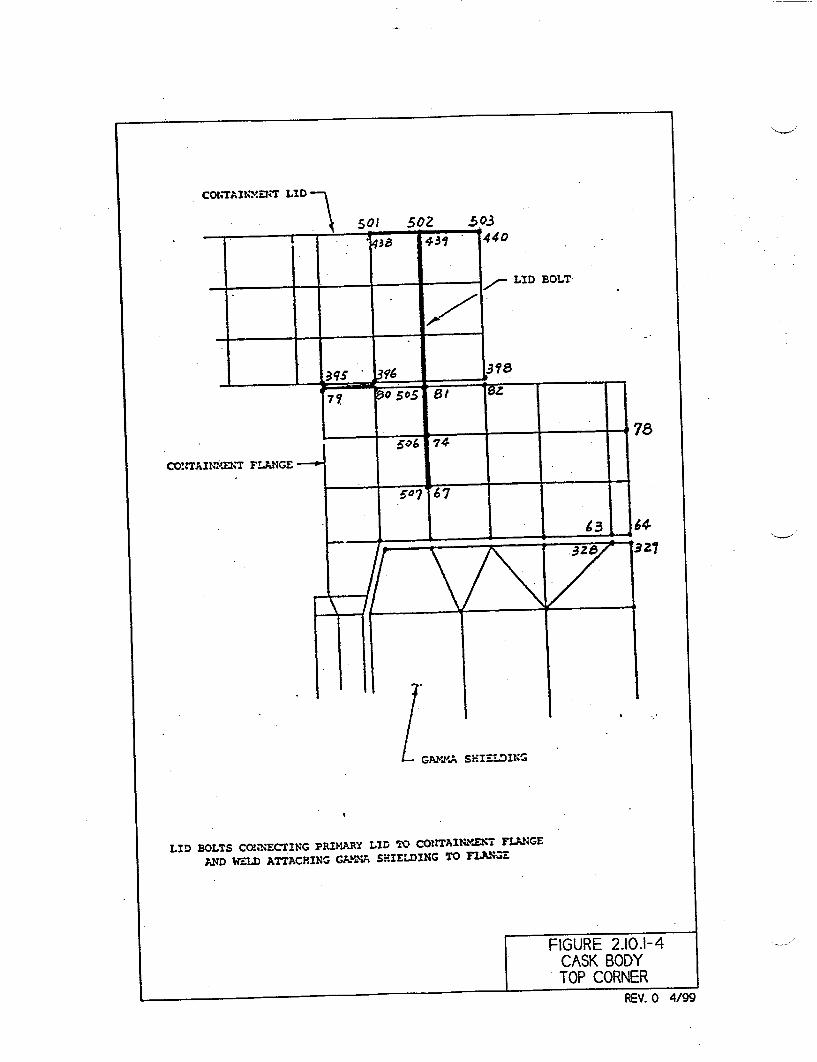
CO..TAINLl,*M FZANGE
LID BO~rS CVO'.ECTING PMII1AY LID -L0 COflTAINYXKT FLANGE
AND WZ-LD ATTACHII4G Gk'.1A SHIELDING TO FAG
REV. 0 4/99

FIGURE 2.10.1-5 . CASK LID TO SHELD PLATE CONNECTION
REV. 0 4/99

II
75.880"
SEAL LOAD F. "
SEAL PRESSURE
ICONTAINMENT FLANGE
LD. xPs 2
D.B.C .
GAMMA SHIELDING
2 x 1399 #/IN - 2798 #/IN AT Day - 72.10"
Tr (72.10)(2798) PS- Tr /4 (72.902- 71.302)"
3498 psi
BOLT PRELOAD STRESS: 86,000 psi
- The actual lid preload stress is 56,000 psi. however, rid bolt prelood corresponding to 86,000 psi is used for all load combinations.
FIGURE 2.10.1-6 BOLT PRELOAD AND
SEAL REACTION
REV. 0 4/99

FIGURE 2.10.1-7 DESIGN INTERNAL
PRESSURE (100 PSIG) REV. 0 4/99

y
L-
FIGURE 2.10.1-8 EXTERNAL PRESSURE
LOADING (25 PSIG) REV. 0 4/99
I
"",7

FRONT IMPACT LIMITER INERTIA
I INTERNALS= WEIGHT OF BASKET. RAILS. HOLDDOWN RING. AND FUEL ASSEMBLIES
INTERNALS INERTIA
pite
PR
REAR IMPACT LIMITER REACTION
FIGURE 2].10-9 IMPACT AT BOTTOM END
LOAD DISTRIBUTION REV. 0 4/99

REAR IMPACT LIMITER INERTIA
FRONT IMPACT LIMITER REACTION
FIGURE 2.10.1-10 IMPACT AT LID END LOAD DISTRIBUTION
r%,l I"- ll! A I ,%l
KI-V. U -4/YY

,
liNTRNL INERTIA DUE TO INERTIA RESULTANT OF FRONT & REAR CASK INERTIA IMPACT LIMITER
p -- - --~ FF+
REACTION FORCE AT REAR TRUNNION
m
0 FIGURE 2.10.1-11I IN IG LONGITUDINAL SUPPORTED (o BY TWO REAR TRUNNIONS
( ,

/~~I ýý/Iz:IzI LzLI a� 4a
140me
COL 1
THETA( 1)
FOURIER COEFFICIENTS
MODE
0.0000 1.0000 1.0000 2.0000 2.0000 3.0000 3.0000 4.0000 4.0000 5.0000 5.0000 6.0000 6.0000 7.0000. 7.0000 8.0000 8.0000 9.0000 9.0000
10.0000 10.0000
COEFF
-0.3182 0.5000 0.0000
-0.2124 0.0000 .0.0000 0.0000 0.0426 0.0000 0.0000 0.0000
-0.0183 0.0000 0.0000 0.0000 0.0103 0.0000 0.0000 0.0000
-0.0066 0.0000
ISYM
1.0000 1.0000
-1.0000 .1.0000 -1.0000 1.0000
-1.0000 1.0000
-1.0000 1.0000
-1.0000 1.0000
-1.0000 1.0000
-1.0000 1.0000
-1.0000 1.0000
-1.0000 1.0000
-1.0000
FOURIER OUTPUT CURVE FOR COS FUNCTION OVER 90-270 DEGREES
FIGURE 2.10.1-12 FOURIER COEFFICIENTS FOR
IG LATERALREV. 0 4/99
iC
0
REV. 0 4/99
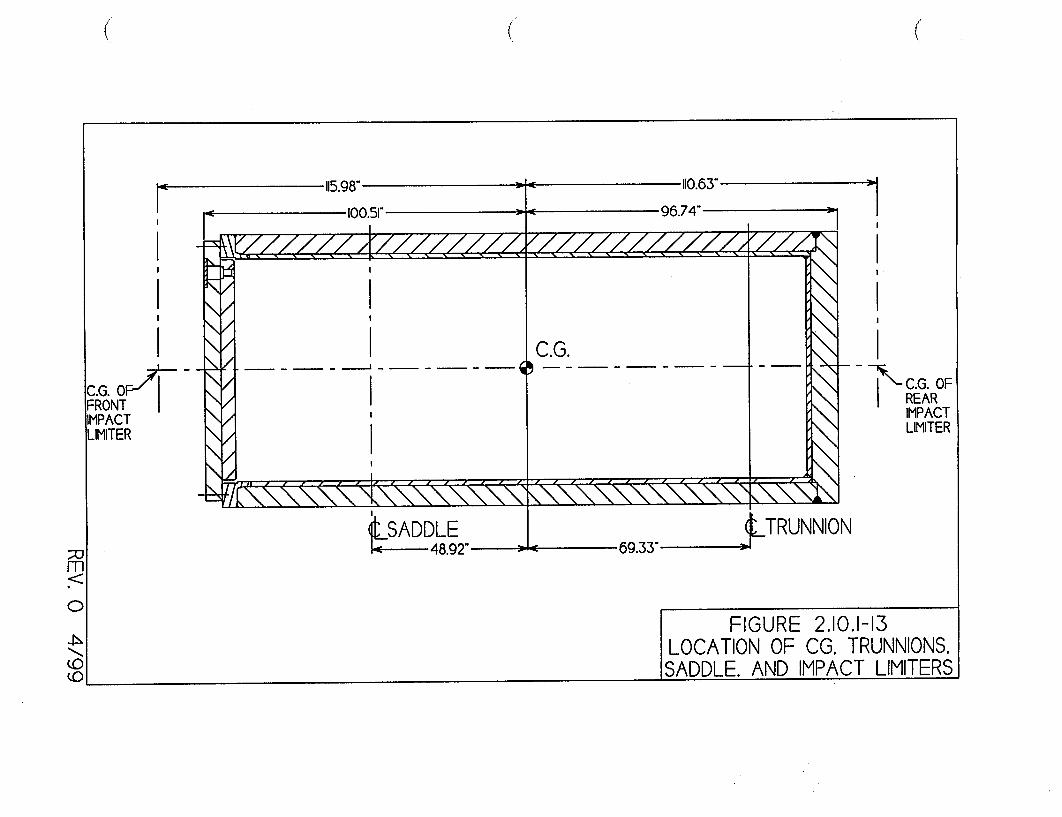
(
C, 0io"
I -ME -- I00.51" IUU=MI
C.G. O-' FRONT IMPACT
SADDLE 48.92"
C (
II3*.: II0.63"
96.74"
1 I
(-69.33"
- -N-C.G. OF
REAR IMPACT LIMITER
LTRUNNION
FIGURE 2.10.1-13 LOCATION OF CG. TRUNNIONS. SADDLE. AND IMPACT LIMITERS
T I
C.G.
I
' ' I I I I I I I I
-1
i i1 4 4 4 1lf ~ f
I
°,ý.ýw
N

FRONT IMPACT LIMITER INERTIA t-Pli PF 2
Pr-
/ / / / /I
REAR IMPACT LIMITER INERTIAPo 11"'
Ps SADDLE REACTION FORCE
REACTION FORCE AT REAR TRUNNION
F FIGURE 2.10.1-14 IG VERTICAL DOWN SUPPORTED
BY TWO REAR TRUNNIONS AND FRONT SADDLE
(
ItCASK INERTIA
INTERNALS T I INERTIA t 10%i-
i- W
m 0
0
0O
\
ell
.i
11! I III . LI, I I
[/ / / -, - -//Z///////////
.\l\

(
(
C
INTERNALS INERTIA
.G.
, F CASK IN!
/It�K�K�K7K�7K77K7KIY3X Al'. T
PF I PF 2
FRONT IMPACT LIMITER REACTI
94.88"
RESULTANT FORCE
ERTIA
PR
REAR IMPACT LIMITER REACTION
0.36"
RESULTANT FORCEp Ny
FIGURE 2.10.1-15 SIDE DROP
LOAD DISTRIBUTION
m
0
(C
1
AA I
,
zzzzzzzzzzz4z

FRONT IMPACT LIMITER NORMAL INERTIA A'
/RESULTANT OF CASK INERTIA
/
IMPACT LIMITER
FIGURE 2.10.1-16 C.G. OVER BOTTOM CORNER DROP
LOAD DISTRIBUTIONREV. 0 4/99
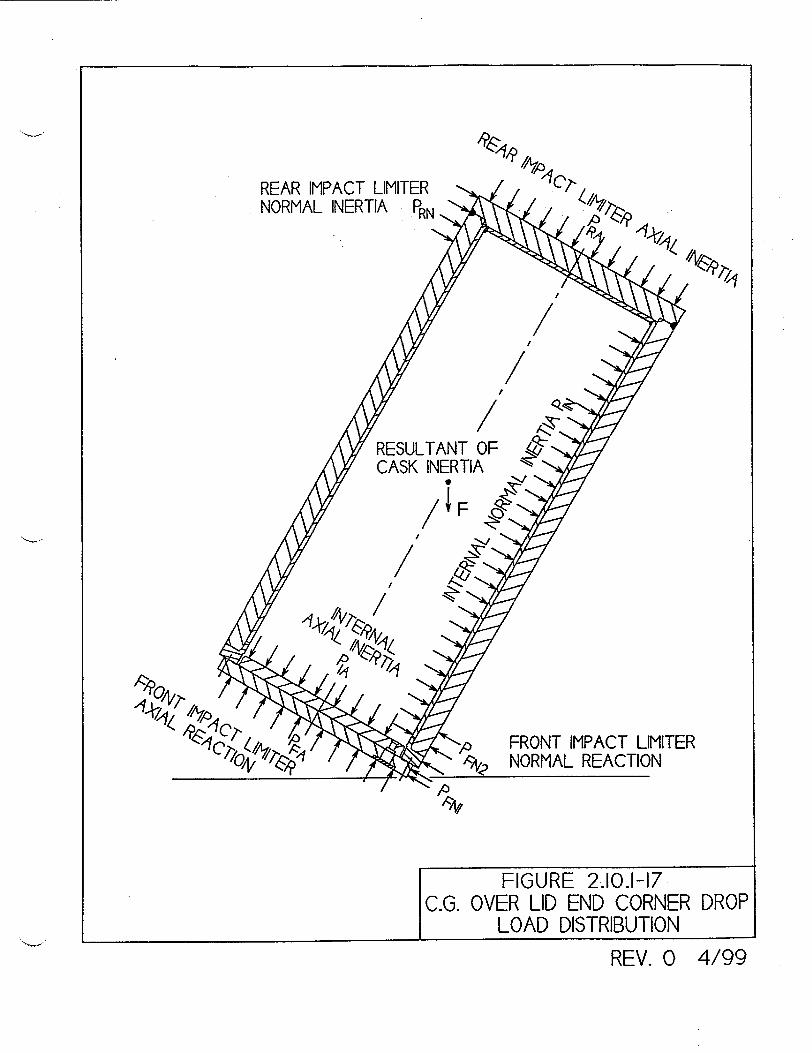
REAR IMPACT LIMITER NORMAL INERTIA PRN
RESULTANT OF CASK INERTIA
0
/
FRONT IMPACT LIMITER NORMAL REACTION
FIGURE 2.10.1-17 C.G. OVER LID END CORNER DROP
LOAD DISTRIBUTION
REV. 0 4/99
)Qrl

C.G.
NORMAL ACCELERATION
.+
ROTATIONAL ACCELERATION
93- 91 -19 (NOTE I)
C.G.
91 ' 92 2. 722 (NOTE I) "91 + 92 - 25.4
(NOTE I)
COMBINED ACCELERATION
NOTE I: TRANSVERSE 9 LOADS REPORTED IN TABLE 2.10.8-3
FIGURE 2.10.1-18 TRANSVERSE 9 LOAD COMBINATIONS
REV. 0 4/99
93
91 " v ý T ý ý ý ý ý


P8
Pti
70 m
0
4.. FIGURE 2.10.1-20 "o 150 SLAP DOWN (SECOND IMPACT AT LID END) 0o LOAD DISTRIBUTION
(

C C
(
F y
m X
0
FIGURE 2.10.1-21 15" SLAP DOWN (SECOND IMPACT AT LID END)
0o ROTATIONAL QUASISTATIC EQUILIBRIUM
((

B
FIGURE 2.10.1-22 STANDARD REPORTING
LOCATIONS FOR CASK BODY
REV. 0 4/99
"I

FIGURE 2.10.1-23 WELD STRESS LOCATIONS
REV. 0 4/99

6W x 1.15= 6 x 240,000 x 1.15 = 828,000 LBS. FTR= 2 2
p = 6 x 77,240 x 1.15 = 134.61 psi I x (35.5) 2 FIGURE 2.10.1-24
LIFTING: 6g
VERTICAL UP
REV. 0 4/99

TN 68 TRANSPORT PACKAGING
APPENDIX 2.10.2
TABLE OF CONTENTS
Page 2.10.2 LID BOLT ANALYSIS
2.10.2.1 Introduction ...................................................................................... 2.10.2-1 2.10.2.2 Bolt Load Calculations ..................................................................... 2.10.2-2 2.10.2.3 Load Combinations .......................................................................... 2.10.2-8 2.10.2.4 Bolt Stress Calculations ................................................................. 2.10.2-10 2.10.2.5 Analysis Results ............................................................................. 2.10.2-13 2.10.2.6 Fatigue Analysis ............................................................................. 2.10.2-14 2.10.2.7 Minimum Engagement Length for Bolt and Flange ...................... 2.10.2-19 2.10.2.8 Conclusions .................................................................................... 2.10.2-21 2.10.2.9 References ...................................................................................... 2.10.2-22
LIST OF TABLES
2.10.2-1 Design Parameters for Lid Bolt Analysis 2.10.2-2 Bolt Data 2.10.2-3 Allowable Stresses in Closure Bolts for Normal Conditions 2.10.2-4 Allowable Stresses in Closure Bolts for Accident Conditions
LIST OF FIGURES
2.10.2-1 TN-68 Cask Lid Closure Arrangement 2.10.2-2 TN-68 Cask Lid Bolt
Rev. 0 4/992.10.2-i

THIS PAGE IS INTENTIONALLY LEFT BLANK.
Rev. 0 4/99

APPENDIX 2.10.2
LID BOLT ANALYSIS
2.10.2.1 Introduction
This section evaluates the ability of the cask closure to maintain a leak tight seal under normal and accident conditions. Also evaluated in this section, are the bolt thread and internal thread stresses, and lid bolt fatigue. The stress analysis is performed in accordance with NUREG/CR6007"').
The TN-68 cask lid closure arrangement is shown in Figure 2.10.2-1. The 5.0 inch thick lid is bolted directly to the end of the containment vessel flange by 48 high strength alloy steel 1.875 inch diameter bolts. Close fitting alignment pins ensure that the lid is centered in the vessel.
The lid bolt is shown in Figure 2.10.2-2. The bolt material is SA-540 Gr. B24 class 1 which has a minimum yield strength of 150 ksi at room temperature.
The following ways to minimize bolt forces and bolt failures for shipping casks are taken directly from with NUREG/CR-6007•'), page xiii. All of the following design methods are employed in the TN-68 closure system.
"* Protect closure lid from direct impact to minimize bolt forces generated by free drops. (use impact limiters)
"* Use materials with similar thermal properties for the closure bolts, the lid, and the cask wall to minimize the bolt forces generated by fire accident
"* Apply sufficiently large bolt preload to minimize fatigue and loosening of the bolts by vibration.
"* Lubricate bolt threads to reduce required preload torque and to increase the predictability of the achieved preload.
* Use closure lid design which minimizes the prying actions of applied loads.
"* When choosing a bolt preload, pay special attention to the interactions between the preload and thermal load and between the preload and the prying action.
Rev. 0 4/992.10.2-1
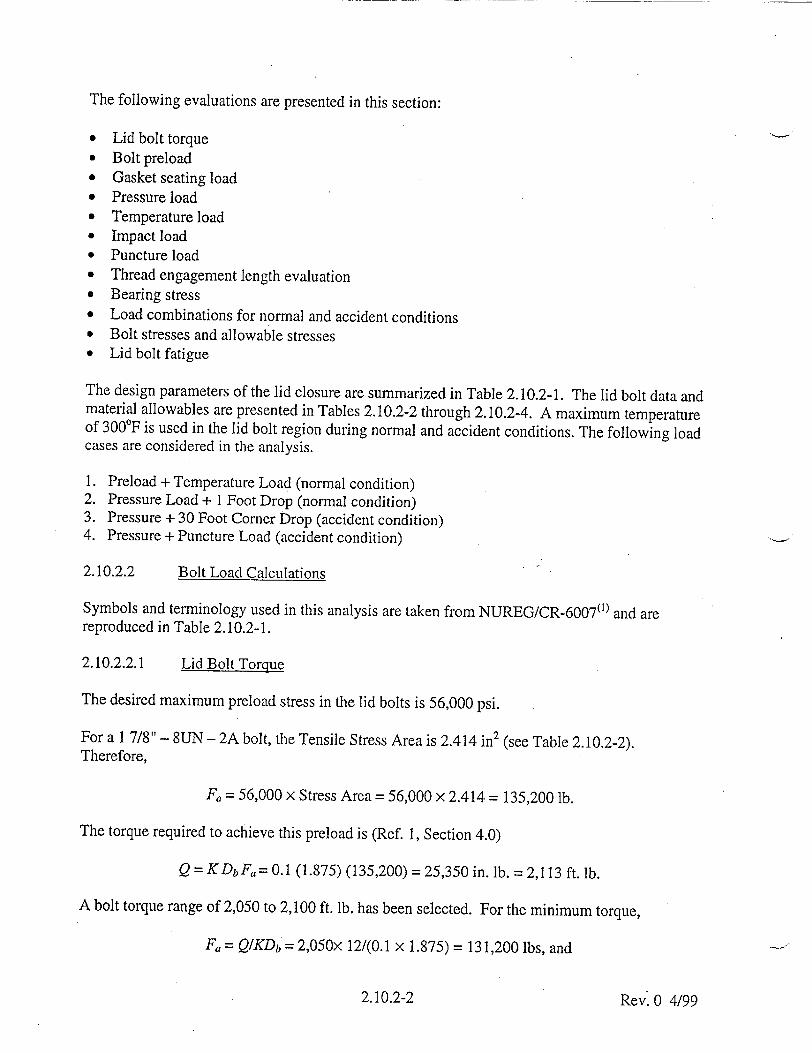
The following evaluations are presented in this section:
"* Lid bolt torque "* Bolt preload "* Gasket seating load "* Pressure load "* Temperature load "* Impact load "* Puncture load "* Thread engagement length evaluation "* Bearing stress "* Load combinations for normal and accident conditions "• Bolt stresses and allowable stresses "* Lid bolt fatigue
The design parameters of the lid closure are summarized in Table 2.10.2-1. The lid bolt data and material allowables are presented in Tables 2.10.2-2 through 2.10.2-4. A maximum temperature of 300'F is used in the lid bolt region during normal and accident conditions. The following load cases are considered in the analysis.
1. Preload + Temperature Load (normal condition) 2. Pressure Load + 1 Foot Drop (normal condition) 3. Pressure + 30 Foot Comer Drop (accident condition) 4. Pressure + Puncture Load (accident condition)
2.10.2.2 Bolt Load Calculations
Symbols and terminology used in this analysis are taken from NUREG/CR-6007(1 ) and are reproduced in Table 2.10.2-1.
2.10.2.2.1 Lid Bolt Torque
The desired maximum preload stress in the lid bolts is 56,000 psi.
For a 1 7/8" - 8UN -2A bolt, the Tensile Stress Area is 2.414 in2 (see Table 2.10.2-2). Therefore,
F, = 56,000 x Stress Area = 56,000 x 2.414 = 135,200 lb.
The torque required to achieve this preload is (Ref. 1, Section 4.0)
Q = KDbF0 = 0.1 (1.875) (135,200) = 25,350 in. lb. = 2,113 ft. lb.
A bolt torque range of 2,050 to 2,100 ft. lb. has been selected. For the minimum torque,
F, = QIKDb = 2,050x 12/(0.1 x 1.875) = 131,200 Ibs, and
Rev: 0 4/992.10.2-2
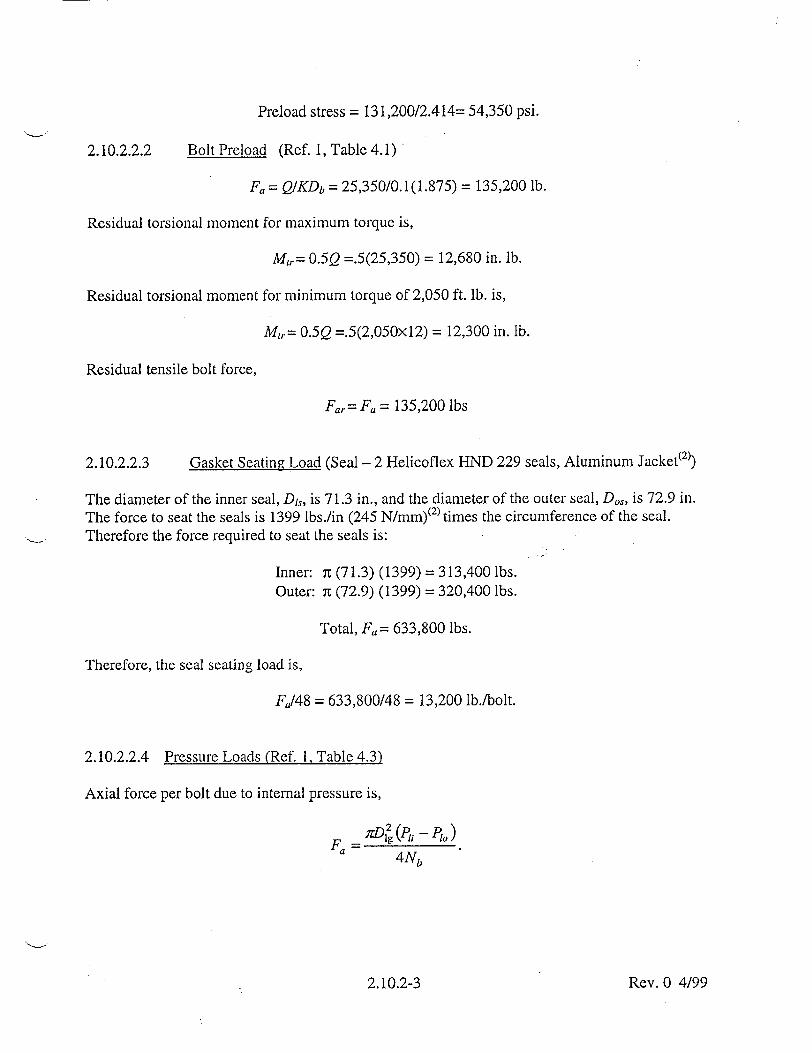
Preload stress = 131,200/2.414= 54,350 psi.
2.10.2.2.2 Bolt Preload (Ref. 1, Table 4.1)
Fa = QIKDb = 25,350/0.1(1.875) = 135,200 lb.
Residual torsional moment for maximum torque is,
Mtr= 0.5Q =.5(25,350) = 12,680 in. lb.
Residual torsional moment for minimum torque of 2,050 ft. lb. is,
Mtr= 0.5Q =.5(2,050x12) = 12,300 in. lb.
Residual tensile bolt force,
Far= Fa = 135,200 lbs
2.10.2.2.3 Gasket Seating Load (Seal - 2 Helicoflex HND 229 seals, Aluminum Jacket(2•)
The diameter of the inner seal, D1 s, is 71.3 in., and the diameter of the outer seal, Ds, is 72.9 in. The force to seat the seals is 1399 lbs./in (245 N/mm)(2) times the circumference of the seal. Therefore the force required to seat the seals is:
Inner: 7c (71.3) (1399) = 313,400 lbs. Outer: nt (72.9) (1399) = 320,400 lbs.
Total, Fa = 633,800 lbs.
Therefore, the seal seating load is,
FaI48 = 633,800/48 = 13,200 lb.ibolt.
2.10.2.2.4 Pressure Loads (Ref. 1, Table 4.3)
Axial force per bolt due to internal pressure is,
Fa 4 Nb
Rev. 0 4/992.10.2-3
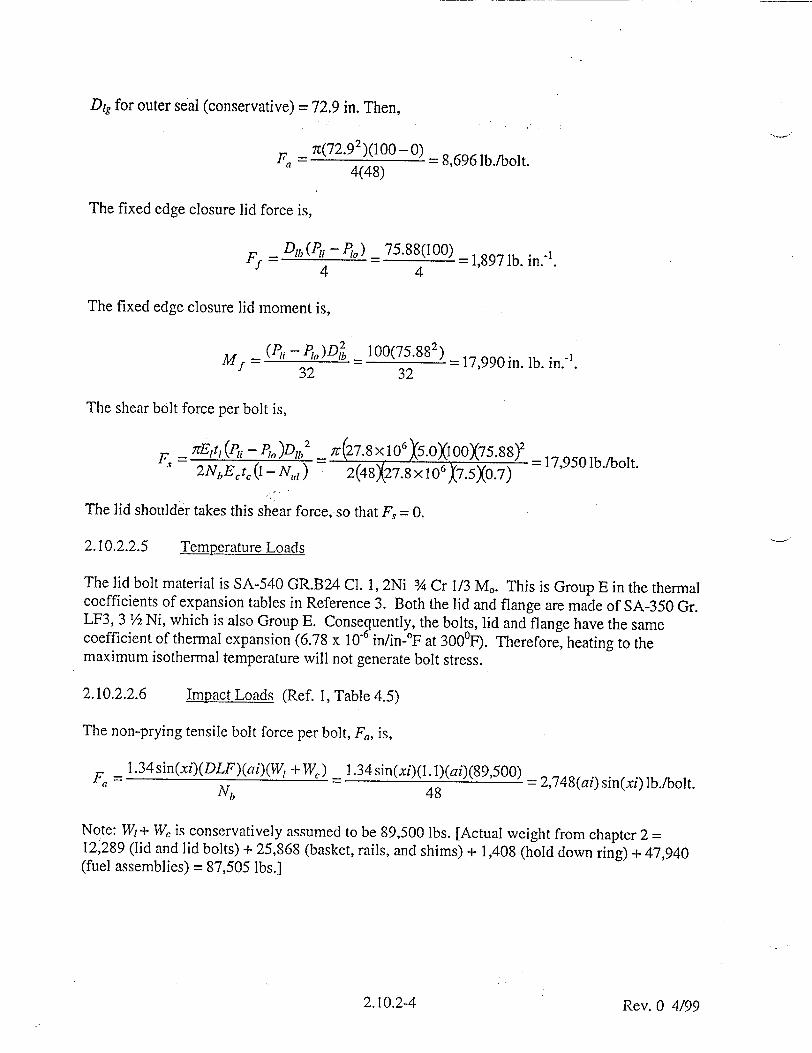
Dig for outer seal (conservative) = 72.9 in. Then,
7-(72.9 2 )(100-0) 4(48) 8,696 lb./bolt.
The fixed edge closure lid force is,
FZ =ODIb (Pli - PIo) _ 75.88(100) = 1,897 lb. in.-. 4 4
The fixed edge closure lid moment is,
My - (P1 i- PIo)D 1 ,b - 100(75.882) = 17,990in. lb. in.32 32 1
The shear bolt force per bolt is,
7.rE It, (Pi- Po =)D11 , •r(27.8x 10⁶ ý5.0X100X75.88)2 17,950 lb./bolt.
2NbEctc(1-NN,,) 2(48X27.8 x 106 X7.5X0.7)
The lid shoulder takes this shear force, so that F, = 0.
2.10.2.2.5 Temperature Loads
The lid bolt material is SA-540 GR.B24 Cl. 1, 2Ni ¾ Cr 1/3 M,. This is Group E in the thermal coefficients of expansion tables in Reference 3. Both the lid and flange are made of SA-350 Gr. LF3, 3 ½ Ni, which is also Group E. Consetuently, the bolts, lid and flange have the same coefficient of thermal expansion (6.78 x 10- in/in-0 F at 3000F). Therefore, heating to the maximum isothermal temperature will not generate bolt stress.
2.10.2.2.6 Impact Loads (Ref. I, Table 4.5)
The non-prying tensile bolt force per bolt, F,, is,
F = 1.34 sin(xi)(DLF)(ai)(W, + W,) _ 1.34 sin(xi)(1.1)(ai)(89,500) = 2,748 Nb= 48748(ai) sin(xi) lb./bolt. N!, 48
Note: W,+ W, is conservatively assumed to be 89,500 lbs. [Actual weight from chapter 2 = 12,289 (lid and lid bolts) + 25,868 (basket, rails, and shims) + 1,408 (hold down ring) + 47,940 (fuel assemblies) = 87,505 lbs.]
Rev. 0 4/992.10.2-4

The shear bolt force is,
, = cos(xi)(ai)(W1 ) - 12,100(ai) cos(xi) - 252. 1(ai) cos(xi) lb./bolt. Nb 48
The lid shoulder during normal and accident condition drops takes shear force. Therefore,
F,=0.
The fixed-edge closure lid force, Ff, is,
1.34 sin(xi)(DLF)(ai)(W1 + W) 1.34 sin(xi)(1.1)(ai)(89,500) - 553.4 sin(xi)(ai) lb./bolt. Ff = Dlb ;- (75.88)
The fixed-edge closure lid moment, Mf, is,
= 1.34 sin(xi)(DLF)(ai)(Wj + W,) _ 1.34 sin(xi)(1.1)(ai)(89,500) = 5,249 sin(xi)(ai) lb./bolt. 81z 8;z
Normal Condition Loads
Since the bolts are protected by the impact limiter during a 90' end drop, the worst case scenario is taken to be roughly a 600 CG over comer drop. From the impact limiter 1 foot normal condition analysis, Section 2.10.8.5, the maximum g load for a 1 foot 60' CG over comer drop is 5.39 g's (5 g vertical, 2 g transverse, Appendix 2.10.8, Table 2.10.8-11). However, for the lid bolt analysis, the following normal condition loading is conservatively assumed.
ai = 6 gs, and xi = 60'
Therefore,
Fa = 2,748x6xsin(60°) = 14,280 lb./bolt, F, = 0 lb./bolt,
Ff= 553.4x6xsin(60°) = 2,876 lb./bolt, and Mf = 5,249x6xsin(60°) = 27,280 lb./bolt.
Accident Condition Loads
The g load resulting from a 30 foot, 60" CG over comer drop is 35.47 gs (33 g vertical, 13 g transverse, Appendix 2.10.8, Table 2.10.8-13). The accident condition g load for lid bolt analysis is conservatively increased to the following value.
ai = 50 gs, and xi = 60'
Rev. 0 4/992.10.2-5
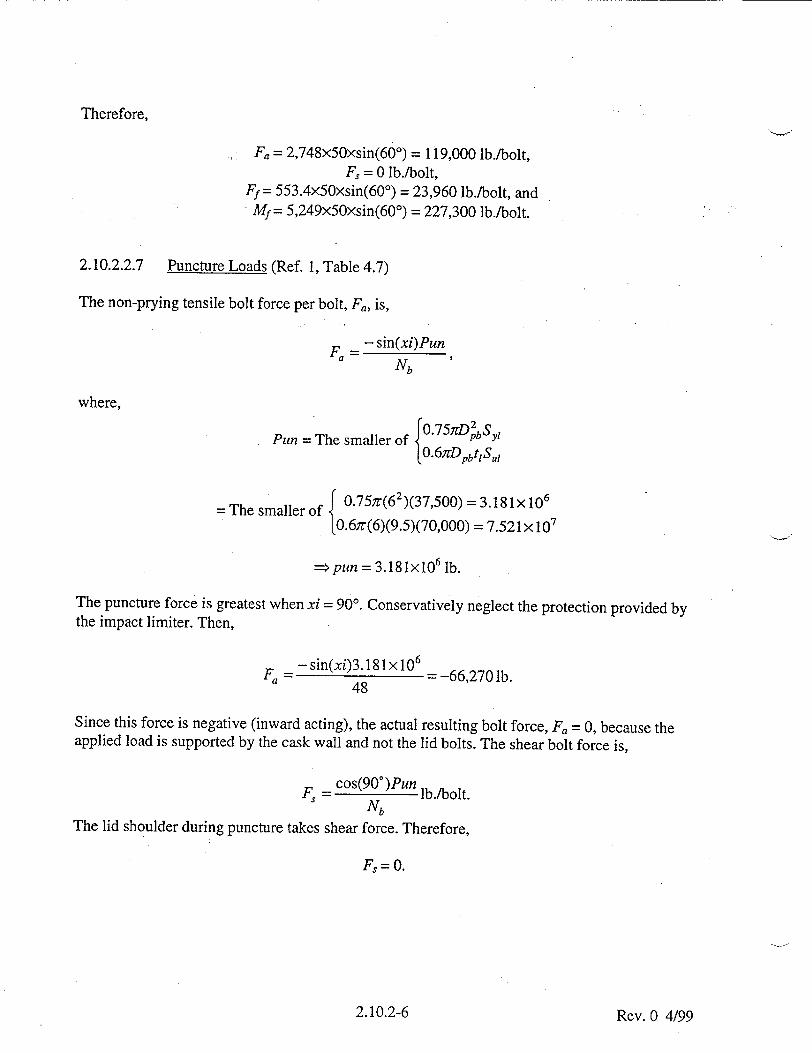
Therefore,
Fa = 2,748x5Oxsin(60') = 119,000 lb./bolt, F, = 0 lb./bolt,
Ff = 553.4x50xsin(60°) = 23,960 lb./bolt, and Mfy= 5,249x5Oxsin(60°) = 227,300 lb./bolt.
2.10.2.2.7 Puncture Loads (Ref. 1, Table 4.7)
The non-prying tensile bolt force per bolt, F,, is,
-sin(xi)Pun Nb
where,
Pun = The smaller of pbttl
LO.677D pAtSuI
T l 0.75zr(6 2)(37,500) = 3.181X 10⁶
-The smaller of 0.67r(6)(9.5)(70,000) = 7.521 x 107
=>pun = 3.18tx10 6 lb.
The puncture force is greatest when xi = 90'. Conservatively neglect the protection provided by the impact limiter. Then,
- sin(xi)3.181 x 10⁶ F, 48 _ 66,270 lb.
48
Since this force is negative (inward acting), the actual resulting bolt force, Fa = 0, because the applied load is supported by the cask wall and not the lid bolts. The shear bolt force is,
cos(90°)Pun lb.bolt. Nb
The lid shoulder during puncture takes shear force. Therefore,
Fs =0.
Rev. 0 4/992.10.2-6
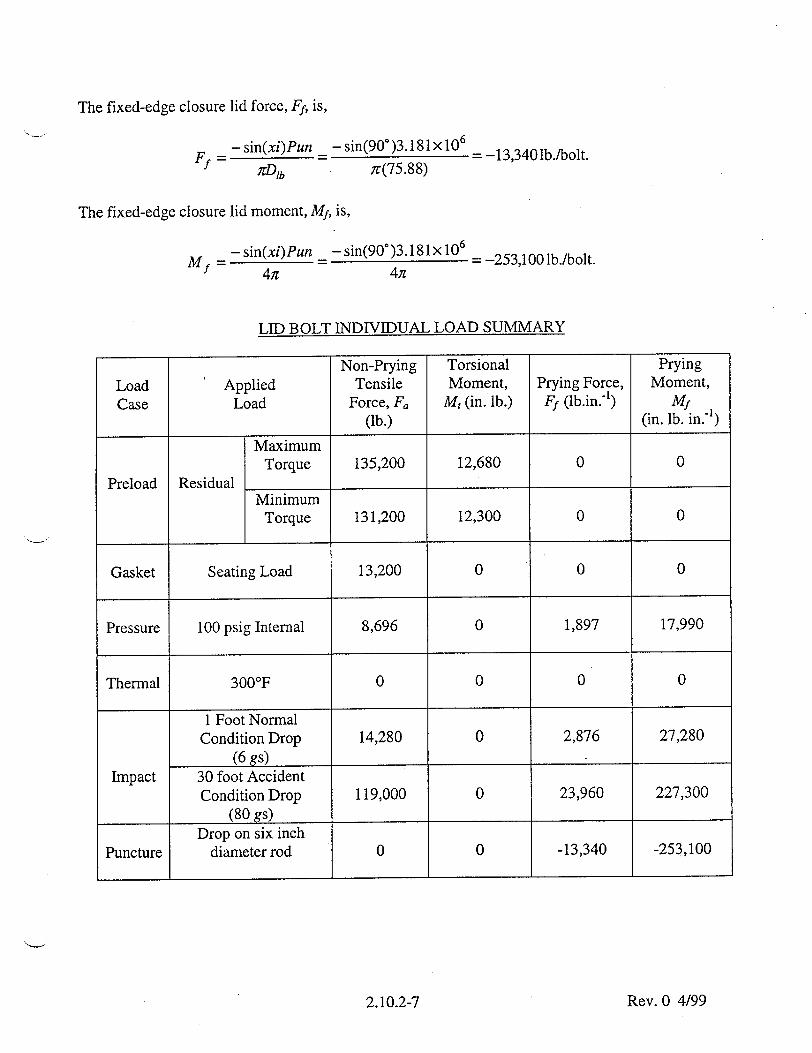
The fixed-edge closure lid force, Ff, is,
- sin(xi)Pun - sin(900)3.181 x 10⁶ Ff = D7•, 7(75.88) =
The fixed-edge closure lid moment, Mf, is,
Mf sin(xi)Pun sin(90°)3.181 x 10'= -253,100 lb./bolt. 4)z 4)z
ITD BOLT INDIVIDUAL LOAD SUMMARY
Non-Prying Torsional Prying Load Applied Tensile Moment, Prying Force, Moment, Case Load Force, Fa M, (in. lb.) Ff (lb.in.-1) Mf
(lb.) (in. lb. in.1 )
Maximum Torque 135,200 12,680 0 0
Preload Residual Minimum
Torque 131,200 12,300 0 0
Gasket Seating Load 13,200 0 0 0
Pressure 100 psig Internal 8,696 0 1,897 17,990
Thermal 300°F 0 0 0 0
1 Foot Normal Condition Drop 14,280 0 2,876 27,280
(6 gs) Impact 30 foot Accident
Condition Drop 119,000 0 23,960 227,300 (80 gs)
Drop on six inch Puncture diameter rod 0 0 -13,340 -253,100
Rev. 0 4/992.10.2-7
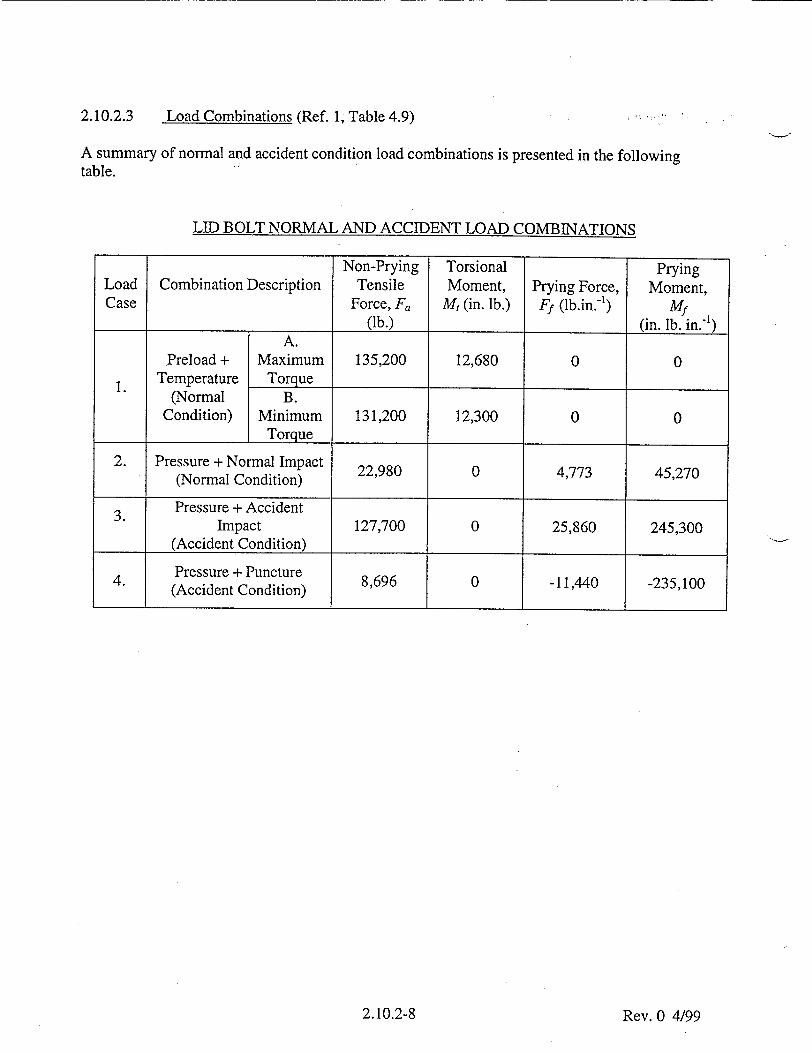
2.10.2.3 Load Combinations (Ref. 1, Table 4.9)
A summary of normal and accident condition load combinations is presented in the following table.
LTD BOlT NORMAl AND ACCIDENT LOAD COMBINATIONS
Rev. 0 4/99
Non-Prying Torsional Prying Load Combination Description Tensile Moment, Prying Force, Moment, Case Force, Fa M, (in. lb.) Ff (lb.in.")) Mf
(lb.) (in. lb. in.-') A.
Preload + Maximum 135,200 12,680 0 0 1. Temperature Torque
(Normal B. Condition) Minimum 131,200 12,300 0 0
Torque
2. Pressure + Normal Impact 22,980 0 4,773 45,270 (Normal Condition) Pressure + Accident
Impact 127,700 0 25,860 245,300
(Accident Condition)
Pressure + Puncture (Accident Condition) 8,696 0 -11,440 -235,100
2.10.2-8
LID BOLT NORMAI

Additional Prviny Bolt Force
Since the prying forces applied in load case 4 (pressure + puncture) acts inward, normal to the cask lid, an additional prying bolt force, F,,p, is generated (Ref. 1, Table 2.1). No additional force is generated for the outward loadings however (load cases 1, 2, and 3), because of the gap between the lid and flange at the outer edge. Fap is calculated in the following way.
c1+c2
where,
C1= 1, Ca 2 3(O Db)2 =-NI + (D.
75.7 8 {.27.8 x 106 (9.53) + (79.88- 70)(27.8 x 10⁶)(7.5)3- 5.0
9.88 - 75.88Y 1-0.3 75.88 (48)(1.8752 )(27.8 x 10⁶)
= 6.320,
"B is the non-prying tensile bolt force, and P is the bolt preload. Since F, - 0, F, < P, and therefore B = P. Parameters B, P, Ff, and Mf are quantities per unit length of bolt circle. For the applied inward force,
F"Nb (135,200)(48) P =B = 70 - -r7.8 27,220 lb. in.
Mflb )(75.88)
Mf -- (-235,l00)(48) - -47,3501lb. in.-', and Ff= 0 lb. in."'. ,r(75.88)
Therefore,
2(-47,350)
Fap =48 1+6.320
= 34,530 lb./bolt.
It is observed that the additional tensile bolt force due to prying for the puncture is less than the accident impact force. The puncture is therefore not critical for bolt stress evaluation.
Rev. 0 4/992.10.2-9
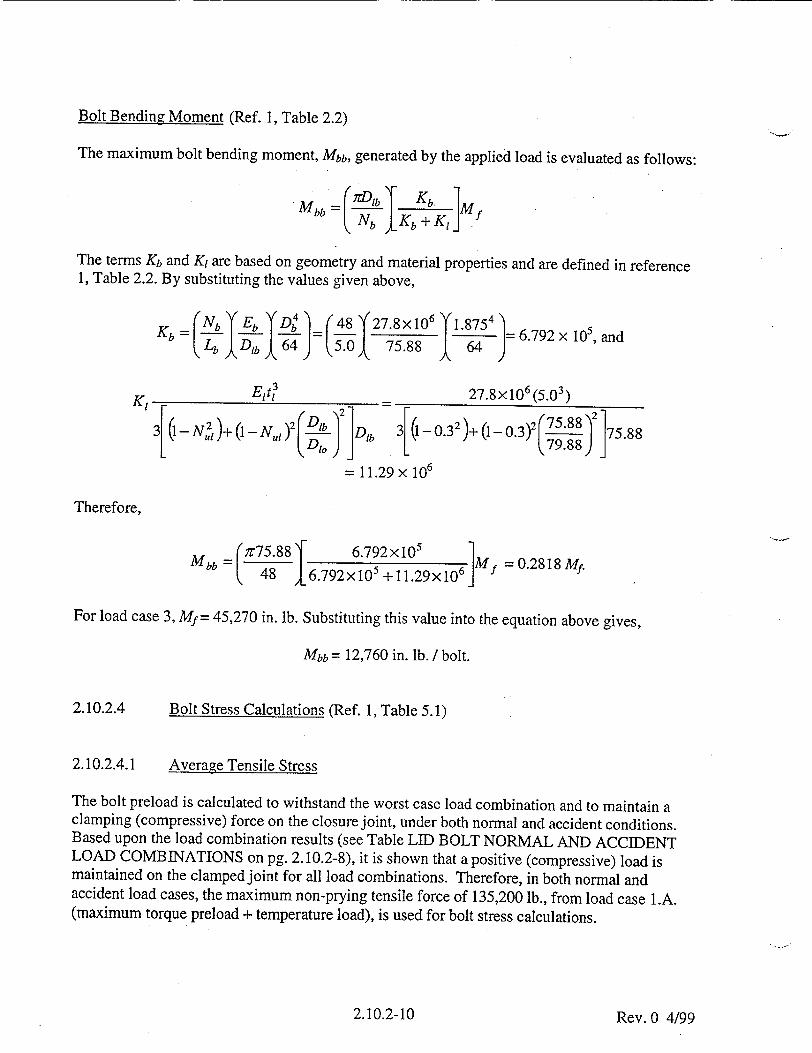
Bolt Bending Moment (Ref. 1, Table 2.2)
The maximum bolt bending moment, Mbb, generated by the applied load is evaluated as follows:
Mb D- (rtb Kb1 Mbb •,Nb I-Kb+ K, MMf
The terms Kb and K, are based on geometry and material properties and are defined in reference 1, Table 2.2. By substituting the values given above,
.(Nb Eb I = 1 48 27.8x 10⁶ .18754 4- 6.792 x W05, and ~Lb*ýDib )64) (,5.0,J 75.88 * 64)
K Ett3_ 27.8x 10⁶ (5.03)
31(1 - N )2 (i-; ) i JD23 3[( 1-0.3 2)+ (1 - 0.3y (75.88 )375.88
= 11.29 x 10⁶
Therefore,
Mb =ri75.88 6.792X101 106Mf=021 f Mbb , - 16.792x10 5 +11.29x10 6
For load case 3, Mf= 45,270 in. lb. Substituting this value into the equation above gives,
Mbb = 12,760 in. lb. / bolt.
2.10.2.4 Bolt Stress Calculations (Ref. 1, Table 5.1)
2.10.2.4.1 Average. Tensile Stress
The bolt preload is calculated to withstand the worst case load combination and to maintain a clamping (compressive) force on the closure joint, under both normal and accident conditions. Based upon the load combination results (see Table LID BOLT NORMAL AND ACCIDENT LOAD COMBINATIONS on pg. 2.10.2-8), it is shown that a positive (compressive) load is maintained on the clamped joint for all load combinations. Therefore, in both normal and accident load cases, the maximum non-prying tensile force of 135,200 lb., from load case 1.A. (maximum torque preload + temperature load), is used for bolt stress calculations.
2.10.2-10 i,, n Areax'•..•T. V --rlJJ
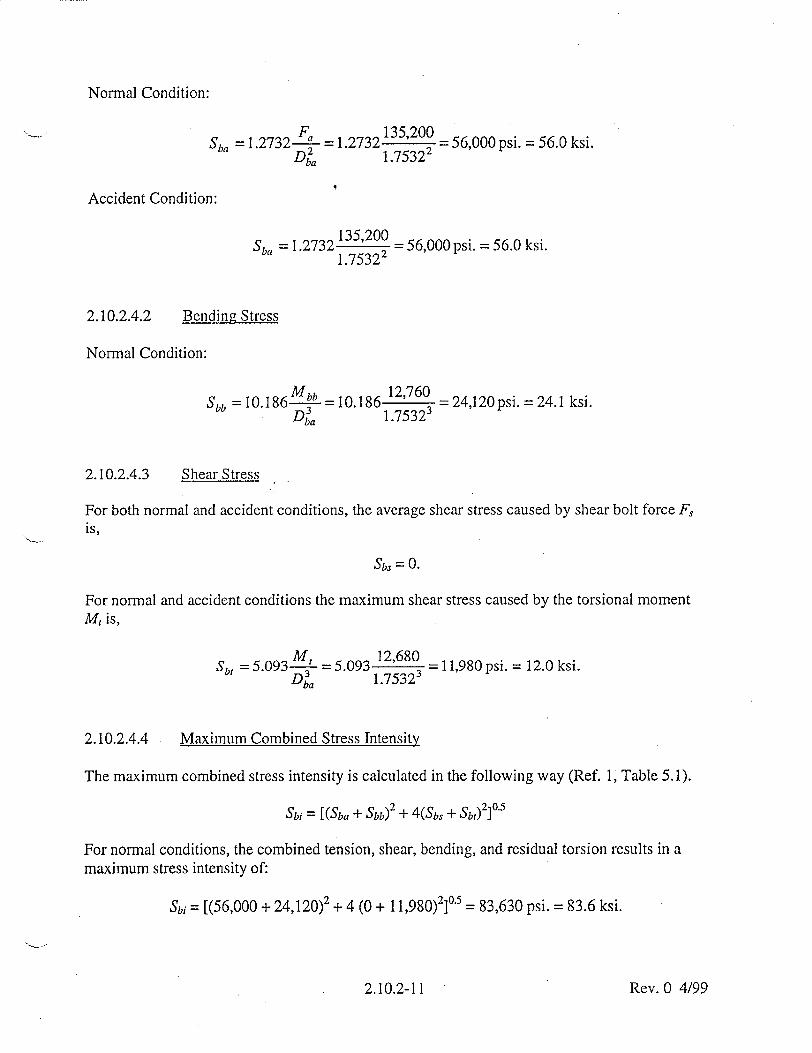
Normal Condition:
/F 135,200 Sba = 1.2732- = 1.27323 - 56,000 psi. = 56.0 ksi.
Db, 1.75322
Accident Condition:
135,200 Sb,1 = 1.2732 -56,000 psi. = 56.0 ksi.
2.10.2.4.2 Bending Stress
Normal Condition:
Sbb = 10. 18 6 Mbb = 10.186 12,760 _ 24,120psi.= 24.1 ksi. Dia 1.7532s
2.10.2.4.3 Shear Stress
For both normal and accident conditions, the average shear stress caused by shear bolt force F, is,
Sb = 0.
For normal and accident conditions the maximum shear stress caused by the torsional moment M, is,
M_ 12,680 Sb, = 5.093 = 5.093 1.7532 3 11,980 psi. = 12.0 ksi.
Dba 1.75323
2.10.2.4.4 Maximum Combined Stress Intensity
The maximum combined stress intensity is calculated in the following way (Ref. 1, Table 5.1).
Sbi = [(Sb, + Sbb) 2 + 4(Sb, + Sb,) 2]05
For normal conditions, the combined tension, shear, bending, and residual torsion results in a maximum stress intensity of:
Sbi = [(56,000 + 24,120)2 + 4 (0 + 11,980)2]o.5 = 83,630 psi. = 83.6 ksi.
Rev. 0 4/992.10.2-11

2.10.2.4.5 Stress Ratios
In order to meet the stress ratio requirement, the following relationship must hold for both normal and accident conditions.
R 2 2+R2 < 1
Where R, is the ratio of average tensile stress to allowable average tensile stress, and R, is the ratio of average shear stress to allowable average shear stress.
For normal conditions:
Rt = 56,000/92,400 = 0.606,
R, = 11,980/55,400 = 0.216,
Rt2 + R,2 = (0.606)2 + (0.216)2 = 0.414 < 1.
For accident conditions:
R= 56,000/115,500 = 0.485,
R= 11,980/69,300 = 0.173,
R,2 +R, 2 = (0.485)2 + (0.173)2 = 0.265 < 1.
2.10.2.4.6 Bearing Stress (Under Bolt Head)
The maximum axial force is 135,2001b. A bolt head corresponding to 2 1/4" diameter bolt is used for 1 7/8" diameter shank due to higher bearing load during transport. The total bearing area under the 2 1/4" Hex bolt head is 6.45 in.2 The bearing stress is,
Bearing Stress = 135,200/6.45 = 20,960 psi. = 21.0 ksi.
The allowable bearing; stress on the lid is taken to be the yield stress of the lid material at 300' F. The lid may be manufactured out of SA-350 GR. LF3 or SA-203 GR. E. The yield stress of SA350 GR. LF3 is less than that of SA-203 GR. E (33.2 ksi. < 35.4 ksi.). Therefore the allowable stress is taken to be 33.2 ksi., which is the lesser of the two materials.
Rev. 0 4/992.10.2-12

2.10.2.5 Analysis Results
A summary of the bolt stresses calculated above is presented in the following table:
SUMMARY OF STRESSES AND ALLOWABLES
The calculated bolt stresses are all less than the specified allowable stresses.
Rev. 0 4/99
Normal Condition Accident Condition Stress Type
Stress Allowable Stress Allowable
Average Tensile 56.0 92.4 56.0 115.5
(ksi.)
Shear (ksi) 12.0 55.4 12.0 69.3
Combined S(ksi) 83.6 124.7 Not Required(')
Interaction E.Q. Rt' +R,2 < 1 0.414 1 0.265 1
Bearing (ksi) Allowable (ksi) 21.0 33.2 Not Required~')
(Sy of lid material)
SUMMARY OF STRESSES AND
2.10.2-13

2.10.2.6 Fatigue Analysis
The purpose of the fatigue analysis is to show quantitatively that the fatigue damage to the bolts during normal transport conditions is acceptable. This is done by determining the fatigue damage factor for each normal transport event. For this analysis it is assumed that the bolts are replaced after 150 round trip shipments. The total cumulative damage or fatigue usage for all events was conservatively determined by adding the usage factors for the individual events. The sum of the individual usage factors was checked to make certain that for the 150 round trip shipments of the TN-68 cask, the total usage factor was less than one. The following sequence of events was assumed for the fatigue evaluation.
1. Operating preload 2. Test pressure 3. Road vibration / shock 4. Pressure and temperature fluctuations 5. 1 foot normal condition drop
Since the bolt preload stress applied to the TN-68 cask lid bolts is higher than all of the other normal and accident condition loads, the stress in the bolt will never exceed the bolt preload stress. Consequently, the application and removal of preload is the only real cyclic loading that occurs in the lid bolts. The following analysis is therefore very conservative since it assumes that the damage factor is the sum of all of the individual event damage factors, and not simply the damage factor for bolt preload.
2.10.2.6.1 Operating Preload
Assuming that the bolts are replaced after 150 round trips, the number of preload cycles is two times the number trips or 300 cycles.
The maximum tensile stress due to bolt preload is 56,000 psi (Section 2.10.2.4.1), and the maximum shear stress due to residual bolt torsion is 11,980 psi (Section 2.10.2.4.3). The corresponding stress intensity is then
S.I. = 56,0002 + 4(11,9802) = 60,910 psi.
2.10.2.6.2 Test Pressure
The proof test, according to reference 11, is 1.25 x Design Pressure = 125 psi, and will only be performed once. The test pressure loads are calculated using the pressure loads computed in Section 2.10.2.2.4.
Fa = 8,696xl.25 = 10,870 psi., Fs = Oxl.25 = 0 psi,
Ff= 1,897xl.25 = 2,371 psi., and Mf= 17,990x1.25 = 22,490 psi.
Rev. 0 4/992.10.2-14
The lid bolt diameter is 1.7532 in. Therefore the stress intensity due to the test pressure load is, F7 10,870 Sa=1.2732F. = 1.2732 10 0= 4,503psi.,
Dbaa 1.75322
Sbb = 10.186 Mbb = 10.186 0.2818(22,490) = 11,980 psi,, Dba 1.75323
Since internal pressure causes no bolt torsion, and all shear loads are taken by the lid shoulder,
Sb, = 0, and Sbt = 0.
S.L = Sbi = [(Sba + Sbb) 2 + 4 (Sbs + Sbt)2]°5 = [(4,503 + 11,980)2 + 4(0)2]0.5 = 16,480 psi.
2.10.2.6.3 Vibration / Shock
Since the TN-68 Cask may be shipped either by truck or by rail car, the shock loading for both cases will be considered.
Truck Shock
Truck shock input was obtained from ANSI N 14.23(5 ). This standard specifies shock loads that correspond to normal transport over rough roads or minor accidents such as backing into a loading dock. Since the TN-68 cask will be transported on interstate highways or major good roads, the shock loads will not be applied continuously to the normal transport mode for the package. The fatigue calculation assumes an average trip of 600 miles in 12 hours.
Assume the driver stops and leaves the interstate every 4 hours and assume that one shock could be experienced during each of these stops. The return trip package behavior is assumed to be the same as the "loaded" trip even though the cargo is no longer present. Therefore shock loading occurs 3 (shocks per trip) x 2 (round trip) x 150 shipments = 900 cycles.
Reference 3 specifies a peak shock loading of 2.3 gs in the longitudinal direction. The weight of the lid, lid bolts, and cask internals is conservatively assumed to be 89,500 lbs. [Actual weight (specified in Table 2-6) = 12,289 lb. (lid and lid bolts) + 25,868 lb. (basket, rails, and shims) + 1,408 lb. (hold down ring) + 47,940 lb. (fuel assemblies) = 87,505 lb.] The bolt force due to shock is,
(89,500 lb)(2.3 gs) / (48 bolts)(2.414 in2 per bolt) = 1,777 psi.
Rev. 0 4/992.10.2-15

Rail Car Shock
Again, assume 150 round trip shipments, averaging 600 miles each way. Reference 6 reports that there are roughly 9 shock cycles per 100 miles of rail car transport. Therefore the total number of cycles is 600 (miles) x 2 (round trip) x 150 (shipments) x 0.09 (Shocks per mile) = 16,200 cycles.
Reference 6 specifies a peak shock loading of 4.7 g's in the longitudinal direction for rail car transport. Consequently, the bolt force due to rail car shock is
(89,500 lb)(4.7 gs) / (48 bolts)(2.414 in2 per bolt) = 3,630 psi.
Vibration
Since vibration accelerations are higher on a truck than on a rail car, the truck vibration loads are considered bounding. According to ANSI N14.23(5 ), the peak vibration load at the bed of a truck in the longitudinal direction is 0.3 g's. This results in a stress of 232 psi, which is negligible for a high strength bolt.
2.10.2.6.4 Pressure and Temperature Fluctuations
The lid bolt material is SA-540 GR. B24 CL. 1, 2Ni ½/2Cr 1/3Mo, which is group E in the coefficients of thermal expansion tables in reference 4. The lid and flange are both made of SA-350 Gr. LF3, 3½/2Ni, which is also group E. Therefore the lid bolts and all of the materials it contacts have the same coefficient of thermal expansion (6.78xi0 6 in. in.-:' OF @ 300OF). Consequently thermal load will cause no stress in the lid bolts.
The pressure fluctuation is conservatively assumed to be the maximum operating pressure, 100 psi, which is far greater that the actual operating pressure. Since the stress intensity in the lid bolts is linearly proportional to the internal / external pressure difference, the stress intensity due to a 100 psi. internal load is,
16,480 psi. x I =psi. -13,190 psi. 125psi.
The pressure fluctuation is assumed to occur once per round trip, since there is no cargo, and therefore no pressurization, during the return trip. So the total number of cycles of pressure' fluctuation is 150.
Rev. 0 4/992.10.2-16

2.10.2.6.5 1 Foot Normal Condition Drop
"The normal condition drop consists of a 1 foot drop in an orientation that results in the most damage. For the side drop the resulting shear load is taken entirely by the lid / flange interface. For the end drop, the load is transferred to the cask body via the impact limiters, protecting the bolts. Therefore the worst case scenario is taken to be roughly a 600 CG over comer drop. The
normal condition impact loads calculated in Section 2.10.2.2.6 are,
Fa = 14,280 lb./bolt, F, = 0 lb./bolt,
Ff = 2,876 lb./bolt, and Mf = 27,280 lb./bolt.
Mbb = 0.2818 Mf.
The lid bolt diameter is 1.7532 in. Therefore, from reference 1, we get the following stresses.
Sb0 = 1.2732F-- = 1.2732 14,280 = 5,915psi, D a 1.75322
bb =10. 18 6 Mb-b -=10. 18 6 0.2818(27,280) -14,530 psi, D • 1.7532 2
Since internal pressure causes no bolt torsion, and all shear loads are taken by the lid shoulder,
Sbs = 0, and Sb = 0.
S.1. = Sbi = [(Sba + Sbb) 2 + 4 (Sbs + Sbt)2]0 5 = [(5,915 + 14,530)2 + 4(0)2]0.5 = 20,450 psi.
Conservatively assume that the cask is dropped once per shipment, resulting in 150 normal condition drops before the lid bolts are changed.
Rev. 0 4/992.10.2-17
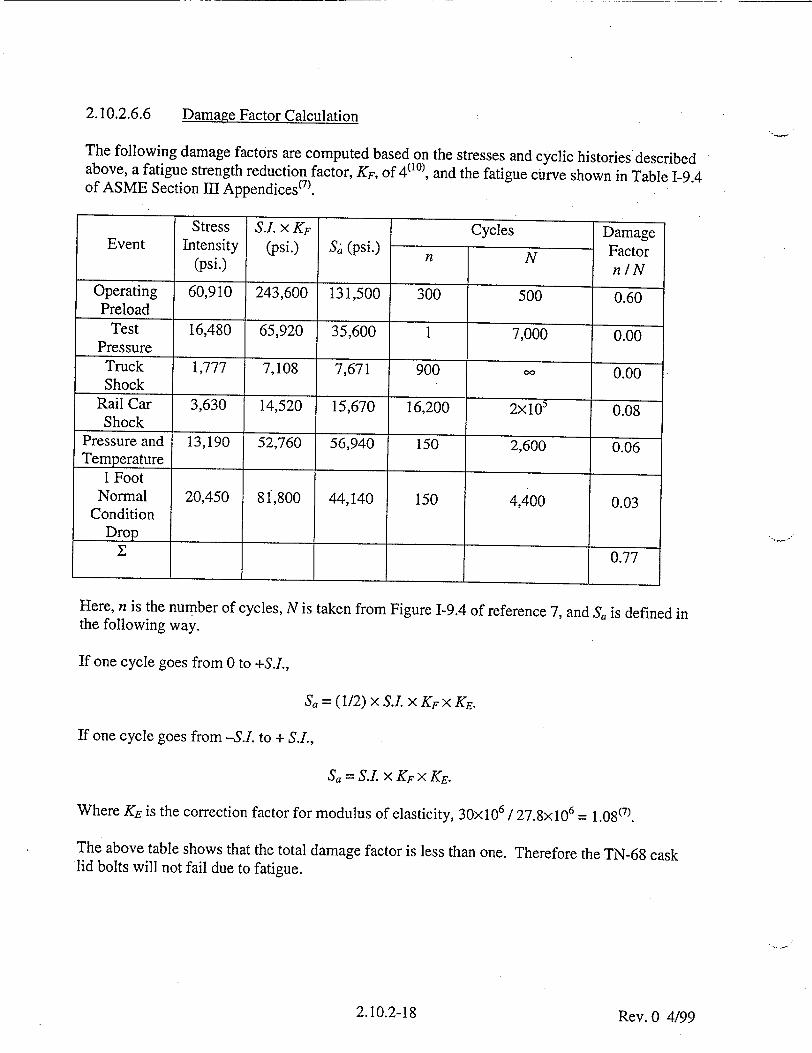
2.10.2.6.6 Damage Factor Calculation
The following damage factors are computed based on the stresses and cyclic histories described above, a fatigue strength reduction factor, KF, of 4(10), and the fatigue curve shown in Table 1-9.4 of ASME Section III Appendices(7 ).
Stress S.L x KF Cycles Damage Event Intensity (psi.) Sa (psi.) Factor
(psi.) n N
Operating 60,910 243,600 131,500 300 500 0.60 Preload
Test 16,480 65,920 35,600 1 7,000 0.00 Pressure
Truck 1,77-7 7,108 7,671 900 0 0.00 Shock
Rail Car 3,630 14,520 15,670 16,200 2x10 0.08 Shock
Pressure and 13,190 52,760 56,940 150 2,600 0.06 Temperature
1 Foot Normal 20,450 81,800 44,140 150 4,400 0.03
Condition Drop
Y_ 0.77
Here, n is the number of cycles, N is taken from Figure 1-9.4 of reference 7, and Sa is defined in the following way.
If one cycle goes from 0 to +S.L,
Sa = (1/2) x S. X KF x KE.
If one cycle goes from -S.L to + S.L,
Sa = S.L x KF x KE.
Where KE is the correction factor for modulus of elasticity, 30x10 6 / 27.8x 10⁶ 1.08 (7).
The above table shows that the total damage factor is less than one. Therefore the TN-68 cask lid bolts will not fail due to fatigue.
Rev. 0 4/992.10.2-18

Minimum Engagement Length for Bolt and Flange
For a 1%- 8UN - 2A bolt, the material is SA - 540 GR. B24 CL. 1, with
S, = 165 ksi, and Sy = 150 ksi (at room temperature)
The flange material is SA - 350 GR. LF3, with
S, = 70 ksi, and Sy = 37.5 ksi (at room temperature)
The minimum engagement length, Le, for the bolt and flange is (Ref. 4, Page 1149),
L, 2A, 3.146K,,.[! +.57735n(E~min -K a
Where,
A, = tensile stress area = 2.414 in.2 , n = number of threads per inch = 8, K ,,= maximum minor diameter of internal threads = 1.765 in., Esai,, = minimum pitch diameter of external threads = 1.7838 in., ---Dmi= minimum major diameter of external threads = 1.8577 in. (Ref. 4, p. 1294)
Substituting the values given above,
Le = 2(2.414) = 1.484 in. 3.146(l.765)[2 +.57735(8)(1.7838-1.765)]
A correction factor to account for different bolt and mating hole materials, J, is computed in the following way.
J = An x SWe. (Ref. 4, p. 1294)
Where, Se is the tensile strength of the external thread material, and Si is the tensile strength of the internal thread material.
As = shear area of external threads = 3.1416 nL, K,,ma [ 1/(2n) + .57735 (Es r- Kn - ,)]
An = shear area of internal threads = 3.1416 nLe Ds mi, [ 1/(2n) + .57735(Dsi., - E,, ,,)]
Rev. 0 4/99
2.10.2.7
2.10.2-19

For the bolt / Helicoil insert connection:
E.,mo = maximum pitch diameter of internal threads = 1.8038 in.(Ref. 4, p. 1294).
Therefore,
S= 3.1416(8)(l.484)(l.765)[1/(2x8) + .57735 (1.7838 - 1.765)] = 4.829 in.2
A, = 3.1416(8)(1.484)(1.8577)[1/(2x8) + .57735 (1.8577 - 1.8038)] = 6.487 in.2
So,
4.829(165.0)0614
6.487(200.0)
Since the tensile strength of the internal threads (Helicoil insert 1 7/8" -8 (4190-30 CN), Ref. 9) is 200 ksi, which is higher than the bolt material tensile strength (165 ksi), the reduction factor, J, decreases the required engagement length. Consequently, the reduction factor is removed from this analysis for conservatism. Therefore, the minimum required engagement lengthbetween bolt and insert, Q = Le = 1484 in.
The actual minimum engagement length = 2.79 in. > 1.484 in.
For bolt / flange connection:
Since the threaded insert has a very high tensile strength (200 ksi.), it does not bound the required engagement length. The following analysis computes the required engagement length based on the interaction between the bolt and the flange, canceling out the effect of the high strength insert.
Since the tap used on the flange for the 1 7/8" -8, 4190-30 CN helicoil insert is a standard 2" 8 pitch tap (Ref. 8), A, for the flange internal threads is calculated as follows.
Dmmrin = 2.000 in., and E, , = 1.9264 in. (Ref. 4)
A= 3.1416(8)(1.484)(2.000)[1/(2x8) + .57735 (2.000 - 1.9264)] = 7.8319 in.2
Therefore,
= 4.829(165.0) 1 45 7.8319(70.0) 3,and
Q = Le J= (1.484)(1.453) = 2.157 in.
The actual minimum engagement length = 2.79 in. > 2.157 in.
Rev. 0 4/992.10.2-20
2.10.2.8 Conclusions
1. Bolt stresses meet the acceptance criteria of NUREG/CR-6007 "Stress Analysis of Closure Bolts for Shipping Casks".
2. A positive (compressive) load is maintained during normal and accident condition loads since bolt preload is higher than all applied loads.
3. If the TN-68 cask lid bolts are replaced after every 150 round trip shipments, they will not fail due to fatigue during transport.
4. The bolt, insert, and flange thread engagement length is acceptable.
Rev. 0 4/992.10.2-21

2.10.2.9 References
1. Stress Analysis of Closure Bolts for Shipping Cask, NUREG/CR-6007, 1992.
2. High Performance Sealing, Metal Seals Helicoflex Catalog, Helicoflex Co., Boonton, N.J., ET 507 E 5930, Catalog Reference HEL 1.
3. American Society of Mechanical Engineers, ASME Boiler and Pressure Vessel Code, Section Hi, Part D, 1995 with 1996 addenda.
4. Machinery Handbook, 21st Ed, Industrial Press, 1979.
5. Draft American Standard Design Basis for Resistance to Shock and Vibration of Radioactive Material Packages Greater than One Ton in Truck Transport, ANSI N14.23,
6. Shock and Vibration Environments for Large Shipping Containers on Rail Cars and Trucks, NUREG 766510.
7. American Society of Mechanical Engineers, ASME Boiler and Pressure Vessel Code Section III, Division 1, Appendix, 1995 with 1996 addenda.
8. Helicoil Catalog, Heli-Coil 8-Pitch Inserts, Bulletin 913B.
9. Design Criteria for the Structural Analysis of Shipping Cask Containment Vessels, U. S. Nuclear Regulatory Commission, Regulatory Guide 7.6, Revision 1, March 1978.
10. Design Criteria for the Structural Analysis of Shipping Cask Containment Vessels, U. S. Nuclear Regulatory Commission, Regulatory Guide 7.6, Revision 1, March 1978.
11. American Society of Mechanical Engineers, ASME Boiler and Pressure Vessel Code Section III, Division 1, Subsection NB 6220, 1995 with 1996 addenda.
Rev. 0 4/992.10.2-22

TABLE 2.10.2-1
DESIGN PARAMETERS FOR LID BOLT ANALYSIS
* Db Nominal diameter of closure bolt; 1.875 in.
* K Nut factor for empirical relation between the applied torque and achieved preload,
used 0.1 for neolube
* Q Applied torque for the preload (in.-lb.)
* Dib Closure lid diameter at bolt circle, 75.88 in.
* Dig Closure lid diameter at the seal (outer) = 72.90 in.
E, Young's modulus of cask flange material, 27.8 x 10⁶ psi.
E1 Young's modulus of lid material, 27.8 x 10⁶ psi.
0 Nb Total number of closure bolts, 48 * N.l Poisson's ratio of closure lid, 0.3 * Pei Inside pressure of cask, 100 psig. * Dio Closure lid diameter at outer edge, 79.88 in.
* Pli Pressure inside the closure lid, 100 psig.
* tc Thickness of cask wall, 6.0 + 1.5 = 7.5 in.
* ti Thickness of lid, 9.5/5.0 in. * lb Thermal coefficient of expansion, bolt material, 6.27 x 10.6 at R.T., 6.78 x 10⁻⁶
in. in.-' OF' at 300-F 0 lc Thermal coefficient of expansion, cask 6.27 x 10⁻⁶ at R.T., 6.78 x 10⁻⁶
in. in.-' OF at 300°F * 11 Thermal coefficient of expansion, lid 6.27 x 10⁻⁶ R.T., 6.78 x 10⁻⁶ in. in."' OF' at
300OF * Eb Young's modulus of bolt material, 27.8 x 10⁶ psi.
* ai Maximum rigid-body impact acceleration (g) of the cask
* DLF Dynamic load factor to account for any difference between the rigid body
acceleration and the acceleration of the contents and closure lid = 1.1
& Wc weight of contents = 46,920 (fuel) + 30,320(basket)** = 77,240 lbs.
& W, weight of lid = 12,074 lbs., say 12,100 lbs.
0 Wc+W, 77,240 + 12,074 = 89,314 lbs., say 89,500 lbs.
* xi Impact angle between the cask axis and target surface
* Sy1 Yield strength of closure lid material, 37,500 psi.
* S.1 Ultimate strength of closure lid material, 70,000 psi.
* Syb Yield strength of bolt material (see Table 2.10.2-3)
* Sub Ultimate strength of bolt material (see Table 2.10.2-4)
* P1, Pressure outside the lid * Lb Bolt length between the top and bottom surfaces of closure, 5.0 in.
* Pun Maximum impact force that can be generated by the puncture bar during a normal
impact * Dpb Puncture bar diameter, 6 inches as per 10 CFR 71.73 (c) (3)
** Conservatively using higher basket weight for lid bolt analysis.
Rev. 0 4/99

TABLE 2.10.2-2
BOLT DATA (Ref. 1, Table 5.1)
Bolt: 1 7/8".- UN8 - 2A
N: no of threads per inch =8
P: Pitch = 1/8 .125 in.
Db: Nominal Diameter = 1.875 in.
Db,,: Bolt diameter for stress calculations = Db - .9743p = 1.875 - .9743 (.125) = 1.7532 in
Stress Area = 7c/4 (1.753) 2 = 2.414 in2
Rev. 0 4/99
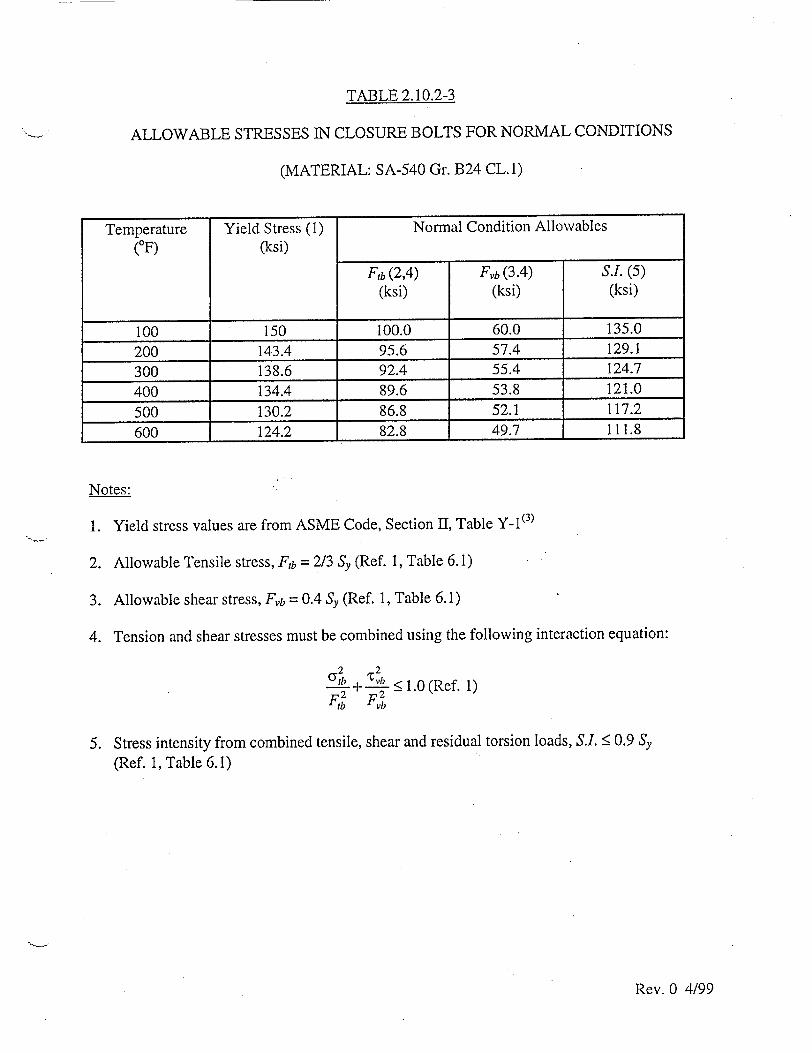
TABLE 2.10.2-3
ALLOWABLE STRESSES IN CLOSURE BOLTS FOR NORMAL CONDITIONS
(MATERIAL: SA-540 Gr. B24 CL.1)
Temperature Yield Stress (1) Normal Condition Allowables (OF) (ksi)
Ftb (2,4) Fb (3.4) S.L (5) (ksi) (ksi) (ksi)
100 150 100.0 60.0 135.0
200 143.4 95.6 57.4 129.1
300 138.6 92.4 55.4 124.7
400 134.4 89.6 53.8 121.0
500 130.2 86.8 52.1 117.2
600 124.2 82.8 49.7 111.8
Notes:
1. Yield stress values are from ASME Code, Section II, Table y-1(3)
2. Allowable Tensile stress, Fib = 2/3 Sy (Ref. 1, Table 6.1)
3. Allowable shear stress, Fvb = 0.4 Sy (Ref. 1, Table 6.1)
4. Tension and shear stresses must be combined using the following interaction equation:
2 2 - + <' 1.0 (Ref. 1)
5. Stress intensity from combined tensile, shear and residual torsion loads, S.I. < 0.9 Sy
(Ref. 1, Table 6.1)
Rev. 0 4/99
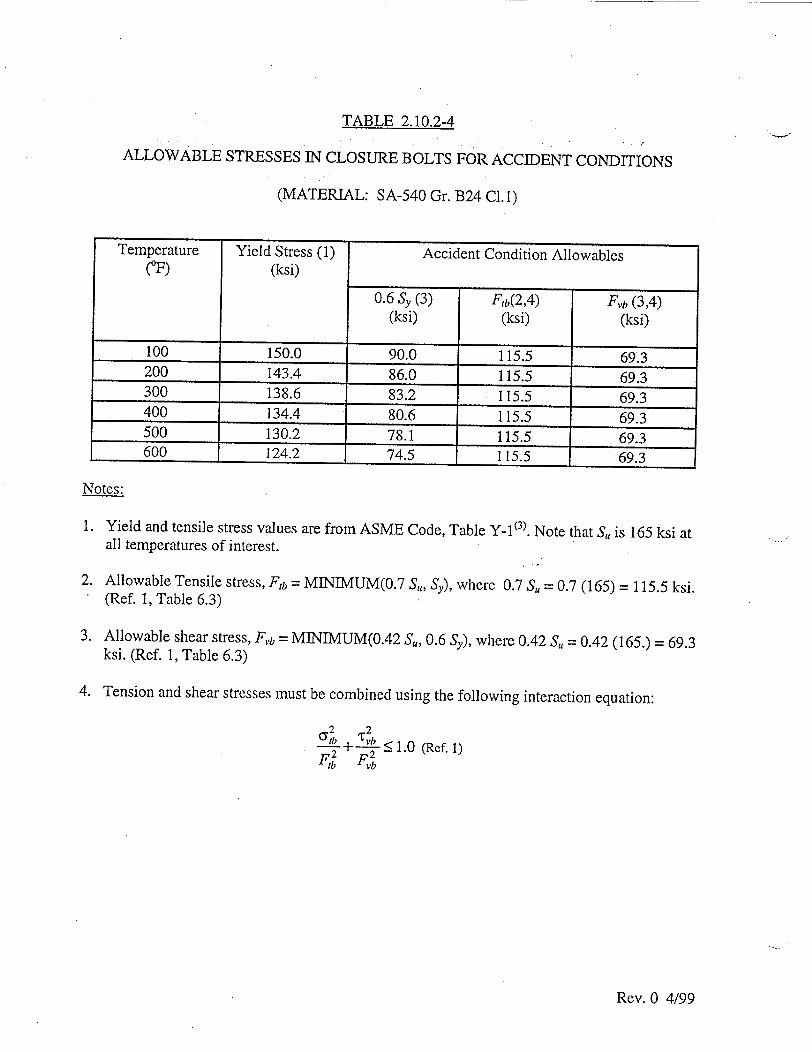
TABLE 2.10.2-4
ALLOWABLE STRESSES IN CLOSURE BOLTS FOR ACCIDENT CONDITIONS
(MATERIAL: SA-540 Gr. B24 Cl.1)
Temperature Yield Stress (1) Accident Condition Allowables (OF) (ksi)
0.6 Sy (3) Fib(2,4) Fb (3,4) (ksi) (ksi) (ksi)
100 150.0 90.0 115.5 69.3 200 143.4 86.0 115.5 69.3 300 138.6 83.2 115.5 69.3 400 134.4 80.6 115.5 69.3 500 130.2 78.1 115.5 69.3 600 124.2 74.5 115.5 69.3
Notes:
1. Yield and tensile stress values are from ASME Code, Table Y- 1 (3). Note that S, is 165 ksi at all temperatures of interest.
2. Allowable Tensile stress, Fb = MINIMUM(0.7 S,,, S,), where 0.7 S,, = 0.7 (165) = 115.5 ksi. (Ref. 1, Table 6.3)
3. Allowable shear stress, Fr,, = MINIMUM(0.42 S,, 0.6 S.), where 0.42 S, = 0.42 (165.) = 69.3 ksi. (Ref. 1, Table 6.3)
4. Tension and shear stresses must be combined using the following interaction equation:
2 2
I tb vb
Rev. 0 4/99

REV. 0 4/99
FIGURE 2.10.2-1 TN-68 CASK LID CLOSURE ARRANGEMENT

FIGURE 2.10.2-2 TN-68 CASK LID BOLT
REV. 0 4/99

TN 68 TRANSPORT PACKAGING
APPENDIX 2.10.3
TABLE OF CONTENTS
Page
2.10.3 STRUCTURAL EVALUATION OF THE OUTER SHELL
2.10.3.1 Introduction ...................................................................................... 2.10.3-1
2.10.3.2 D escription ....................................................................................... 2.10.3-1
2.10.3.3 M aterials Input D ata ......................................................................... 2.10.3-1
2.10.3.4 A pplied Loads .................................................................................. 2.10.3-1
2.10.3.5 M ethod of A nalysis .......................................................................... 2.10.3-2
2.10.3.6 R esults .............................................................................................. 2.10.3-5
2.10.3.7 R eferences ........................................................................................ 2.10.3-6
LIST OF FIGURES
2.10.3-1 Cask Outer Shell and Connection with Cask Body 2.10.3-2 Finite Element Model Outer Shell 2.10.3-3 Finite Element Model Bottom Comer 2.10.3-4 Finite Element Model Top Comer 2.10.3-5 Internal Pressure (25 psi.) 2.10.3-6 25 psi. & 3g Down (Cask Vertical) 2.10.3-7 25 psi. & 15g Down (Cask Vertical) 2.10.3-8 25 psi. + 5.4g Down & lOg Forward Inertia Load 2.10.3-9 25 psi. & lOg Backward Inertia Load 2.10.3-10 25 psi. & 35g Down Inertia Load
Rev. 0 4/992.10.3 -i

THIS PAGE IS INTENTIONALLY LEFT BLANK.
Rev. 0 4/99

APPENDIX 2.10.3
"STRUCTURAL EVALUATION OF THE OUTER SHELL
2.10.3.1 Introduction
This section presents the structural analysis of the outer shell of the TN-68 package. The outer shell consists of a cylindrical shell section and closure plates at each end which connect the cylinder to the cask body. The normal loads acting on the outer shell are due to internal and external pressure, normal handling/tiedown loads and 1 foot end/side drops. Maximum membrane plus bending stress intensities due to the pressure difference, handling/tiedown loads and 1 foot end/side drop loads are determined. These stresses are compared to the allowable stress limits in Chapter 2 to assure that the design criteria are met.
2.10.3.2 Description
The outer shell is constructed from low-alloy carbon steel and is welded to the outer surface of the cask body gamma shielding. The cylindrical shell section and the closure plates are 0.75 in. thick. Pertinent dimensions are shown in Fig. 2.10.3-1 and Drawing 972-71-2.
2.10.3.3 Materials Input Data
The outer shell cylindrical section and closure plates are SA-516 Gr. 70. The material properties "are taken from the ASME(1) Code, Section II, Part D. The yield strength of the material is also obtained from the code at a temperature of 250'F.
2.10.3.4 Applied Loads
It is assumed that a pressure of 25 psi may be applied to the inside or outside of the outer shell. This bounding assumption envelopes the actual expected pressures described in Chapter 2.
The handling loads acting on the outer shell are a result of lifting. The weight or inertia g load can include all of the weights of the outer shell, neutron resin shield, and aluminum containers. The most severe Normal Service (Design and Level A) Condition load is assumed 3 G inertia load in the vertical lifting orientation, 1 foot end drop and side drop. The shell is also analyzed for 2/5/10 G tiedown loads when the cask is oriented horizontally to ensure it is not damaged during transportation.
* Cask in the Vertical Orientation - Stress due to 25 psi pressure - Stress due to 25 psi pressure and 3G inertia load (lifting) - Stress due to 25 psi pressure and 1 foot end drop (15G)
Rev. 0 4/992.10.3-1

Cask in the Horizontal Orientation - Stress due to 25 psi pressure - Stress due to 25 psi pressure, 2G vertical, 5Glateral accelerations and lOG
longitudinal forward acceleration - Stress due to 25 psi pressure, 2G vertical, 5G lateral accelerations and lOG
longitudinal backward acceleration - Stress due to 25 psi pressure and 1 foot side drop (35G)
2.10.3.5 Method of Analysis
ANSYS Model
A finite element model is built for the structural analysis of the outer shell and closure plates. The outer shell and closure plates are modeled with ANSYS(2) Plane 42 elements. The element used is an axisymmetric element. Double nodes are created at weld locations. The partial penetration welds are simulated by coupling the nodes where welds exist. In finite element model for pressure run, the entire ½ inch cylinder thickness was conservatively reduced to 0.375 inch to simulate the longitudinal partial penetration weld. The basic geometry of the outer shell and weld sizes used for analysis are shown in Figure 2.10.3-1. The finite element model is shown in Figures 2.10.3-2, -3, and -4.
Cask in the Vertical Orientation
0 Stresses due to 25 psi Pressure
An external pressure of 25 psi will not induce any load or stress in the outer shell since it is in contact with and supported by the resin filled aluminum containers.
An internal pressure of 25 psi is used as the maximum pressure acting in the inner surface of the outer shell as shown on Figure 2.10.3-5. The maximum stress intensity for this load case is 4.5 ksi.
• Stress due to 25 psi pressure and 3G inertia load (lifting - cask in the vertical orientation)
The weight of the resin and aluminum containers is modeled as an additional pressure on the bottom inner surface as shown on Figure 2.10.3-6. The effect of the outer shell dead weight is accounted for by using a 3G gravitational load in the longitudinal direction. The maximum stress intensity for this load case is 9.1 ksi.
* Stress due to 25 psi pressure and 1 foot end drop (15G) (cask in the vertical orientation)
The weight of the resin and aluminum containers is modeled as an additional pressure on the bottom inner surface as shown on Figure 2.10.3-7. The effect of the outer shell dead weight is accounted for by using a 15G gravitational load in the longitudinal direction. The maximum stress intensity for this load case is 27.7 ksi.
Rev. 0 4/992.10.3-2
Cask in the Horizontal Orientation
* Stresses due to 25 psi Pressure
The stress due to 25 psi internal pressure is the same in both horizontal and vertical orientations (4.5 ksi).
* Stress due to 25 psi pressure, 2G vertical, 5G lateral accelerations, and lOG longitudinal
forward acceleration (shown in Figure 2.10.3-8)
Again, the stress due to 25 psi internal pressure is 4.5 ksi.
The vertical and lateral accelerations are combined such that, g = (2.02 + 5.02)1/2 = 5.4G. When calculating the stress due to a 5.4G inertia load, it is conservatively assumed that the weight of the outer shell, resin, and aluminum containers is uniformly distributed over the 160 in. length and over a 600 arc only. Therefore, the equivalent pressure applied to the outer shell is:
Weight of outer shell: 11.2 kips Weight of resin: 13.9 kips Weight of alum. Containers: 2.5 kips
Ptrsvcrsc = (11.2 + 13.9 + 2.5)(5.4)(1000)(360)/(7rt)(96.5)(160)(60) = 18.4 psi
For the loading due to 1OG longitudinal forward acceleration, the weight of the resin and "aluminum boxes is modeled as an additional pressure on the forward (lid side) inner surface of the outer shell.
Weight of resin: 13.9 kips Weight of alum. Containers: 2.5 kips Plongitudinal = (13.9 + 2.5)(10)(1000)/(7t)(48.25' - 42.25 2) = 97 psi
The effect of the outer shell dead weight is accounted for by using a lOG gravitational load in the longitudinal direction. The maximum stress intensity for this load case is 28.3 ksi.
* Stress due to 25 psi pressure, 2G vertical, 5G lateral accelerations, and lOG longitudinal backward acceleration (shown in Figure 2.10.3-9)
The loading due to 25 psi internal pressure, 2G vertical, and 5G lateral is the same as it is in the previous case.
For the loading due to lOG longitudinal backward acceleration, the weight of the resin and aluminum boxes is modeled as an additional pressure on the forward (rear side) inner surface of the outer shell.
Rev. 0 4/992.10.3-3

Weight of resin: 13.9 kips Weight of alum. Containers: 2.5 kips Pequipment = (1:3.9 + 2.5)(10)(1000)/(it)(48.252 - 42.252) = 97 psi
The effect of the outer shell dead weight is accounted for by using a lOG gravitational load in the longitudinal direction. The maximum stress intensity for this load case is 24.4 ksi.
* Stress due to 25 psi and 1 foot side drop (35G)
The loading scheme applied to the model to simulate a 1 foot side drop is depicted in figure 2.10.3.10.
The stress due to 25 psi internal pressure is the same in both horizontal and vertical orientations (4.5 ksi). When calculating the stress due to a 35G inertia load, it is conservatively assumed that the weight of the outer shell, resin, and aluminum containers is uniformly distributed over the 160 in. length and over a 60' arc only. Therefore, the equivalent pressure applied to the outer shell is:
Weight of outer shell: 11.2 kips Weight of resin: 13.9 kips Weight of alum. Containers: 2.5 kips
Pequipment = (11.2 + 13.9 + 2.5)(35)(1000)(360)/(7t)(96.5)(160)(60) 119.5 psi
An internal pressure of 25 psi and additional 119.5 psi pressure acting in the inner surface of the outer shell is applied in this load. The stress results from this additional 119.5 psi load is approximated by an internal pressure and applied on the full 360' inner surface of the outer shell. Therefore, the stress due to the this 35G inertia load can be ratioed from the 25 psi internal pressure case and is:
(T = 4.5 (119.5)/25 = 21.51 ksi
The total stress intensity is (4.5 ksi + 21.51 ksi) 26.01 ksi.
Rev. 0 4/992.10.3-4

Summary of the Maximum Stress Intensities
Based on the above calculations the stress intensities are summarized in the following table:
2.10.3.6 Analysis Results
All the above calculated maximum stress intensities are less than the allowable stress of 33.75 ksi (1.5 Smn, SA-516, Gr. 70 at 250 0F).
Rev. 0 4/99
Loading Stress Intensities
25 psi Internal Pressure 4.5 ksi 25 psi + 3G Down 9.1 ksi
(Cask in Vertical Orientation) 25 psi + 15G Down 27.7 ksi (Vertical End Drop)
25 psi + 2G vertical and 5G Lateral + lOG Longitudinal (Forward) 28.3 ksi
(Cask in Horizontal Orientation) 25 psi + 2G vertical and 5G Lateral +
lOG Longitudinal (Backward) 24.4 ksi (Cask in Horizontal Orientation)
25 psi + 35G Down 26.0 ksi (Side Drop)
2.10.3-5

2.10.3.7 References
1. ASME Code, Section II, Part D, 1995 including 1996 addenda.
2. ANSYS Engineering Analysis System, Users Manual for ANSYS Revision 5.2, 1995.
Rev. 0 4/992.10.3-6

REV. 0 .4/99

1_'I X,See Figure 2.10.3-4 for details
See Figure 2.10.3-3 for details
TN-68 OUTER SHELL, FINITE ELEMENT MODEL
FIGURE 2.10.3-2 FINITE ELEMENT MODEL
OUTER SHELL REV. 0 4/99

REV. 0 4/99

-4 "1 11 11 cc
r"
rM
I-.€
"I. I
1 1
Simulation of weld connecting outer shell and closure.plate by coupling nodes at this locations
FIGURE 2.10.:3-4 FINITE ELEMENT MODEL
TOP CORNER
REV. 0 4/99

REV. 0 4/99

FRONT/ TOP END
p - 25 psi
p - 2 5 + 2 9 - 5 4 p s i -\
ACCELERATION
REAR/ BOTTOM END
p - (2.5 + 13.9) x 3 x 1000/ (48.252- 42.252)w;1w 29 psi
FIGURE 2.10.3-6 25 psi & 39 DOWN (CASK VERTICAL) i
REV. 0 4/99

FIGURE 2.10.3-7 25 psi & 159 DOWN (CASK VERTICAL)
REV. 0 4/99

REV. 0 4/99

FIGURE 2.10.3-9 25 psi & lOg
BACKWARD INERTIA LOAD REV. 0 4/99

FIGURE 2.10.3-10 25 psi & 359 DOWN
INERTIA LOAD REV. 0 4/99

TN 68 TRANSPORT PACKAGING
APPENDIX 2.10.4
TABLE OF CONTENTS
Page
FRACTURE TOUGHNESS EVALUATION OF TN-68 CASK
Introduction ...................................................................................... 2.10.4-1
Fracture Toughness Evaluation of Containment Boundary ............. 2.10.4-1 Fracture Toughness Evaluation of the Gamma Shield ..................... 2.10.4-1
R eferences ...................................................................................... 2.10.4-11
LIST OF FIGURES
Locations of Fracture Toughness Evaluations (TN-68 Gamma Shield) Charpy V-Notch Test Results for SA-266 Class 2
Rev. 0 4/99
2.10.4
2.10.4.1 2.10.4.2 2.10.4.3 2.10.4.4
2.10.4-1 2.10.4-2
2.10.4-i

THIS PAGE IS INTENTIONALLY LEFT BLANK.
Rev. 0 4/99

APPENDIX 2.10.4
"FRACTURE TOUGHNESS EVALUATION OF TN-68 CASK
2.10.4.1 Introduction
This appendix documents the fracture toughness requirements of the TN-68 containment
boundary and also calculates the allowable flaw sizes of the gamma shield and welds. The
results of the flaw sizes can be used to develop an appropriate inspection program and to select
an appropriate technique to properly inspect the cask. It can also be used as an initial screening
criteria to disposition any indications that are detected during inspection.
2.10.4.2 Fracture Toughness Evaluation of Containment Boundary
The TN-68 containment boundary material is a ferritic steel and is therefore subject to fracture
toughness requirements in order to assure ductile behavior at the lowest service temperature (LST) of -20'F. The containment boundary materials (including lid bolts) are selected to meet
the fracture toughness criteria of ASME Code Section Ill, Division 3(1), Subsection WB. The
cask shell and bottom plate are 1.5 inches thick, the flange is 7.5 inches thick, and the lid plate is
5 inches thick. Therefore, by interpolating between values provided in Table WB-2331.2-1 of
the Section III, Subsection WB (Para. WB-2300), the nil ductility transition temperatures (TNDT)
of the containment boundary materials are:
Shell and bottom plates: -80'F
Flange: -133 0F
Lid plate: -126 0F
In addition to determining the nil ductility transition temperature, charpy v-notch testing is
performed at a temperature no greater than 60'F above the TNDT. The acceptance criteria is that
the material exhibit at least 35 mils lateral expansion and not less than 50 ft-lbs absorbed energy.
This testing is sufficient to ensure that the containment boundary materials will not be
susceptible to brittle fracture at -20°F.
The fracture toughness requirements of the lid bolts meet the criteria of ASME Code, Section III,
Division 3, Subsection WB (Para. WB-2333). Charpy v-notch testing is performed at -20'F.
The acceptance criteria is that the material exhibit at least 25 mils lateral expansion (Table W\VB2333-1).
2.10.4.3 Fracture Toughness Evaluation of the Gamma Shield
The gamma shield shell is forged from SA-266 Class 2 material. The bottom shield plate is
constructed from either SA-105 forging or SA-516 Grade 70 plate material, and the top shield
plate (plate welded to the bottom of the lid) is constructed from either SA-266 Class 2 material, or SA-516 Grade 70 material. The main function of the gamma shield is to provide shielding. It
is not part of the containment, and its shielding properties are not temperature dependent.
Rev. 0 4/992.10.4-1

Preliminary charpy test data of the samematerial (SA-266) from a similarly sized shield shell has been provided by one of the material manufacturers for the shield shell, and the results are tabulated below.
Charov V-Notch Test - Results for SA-266 Class 2
Temperature Specimen No. Absorbed Energy (ft-lbs) Avg. of 3 specimens
00C (32-F) V1 63 V2 60
-10°C (14°F) V3 56 V4 50
-20°C (-4°F) V5 45 V6 40
-30 0C (-22-F) V7 18 V8 20
-400 C (-40°F) V9 17 V10 10
The TN-68 package is designed for an ambient temperature of -20'F. As can be seen from the materials testing, even at temperatures as low as -20'F the gamma shielding has relatively good charpy impact properties. It is unlikely that the gamma shield would reach -20'F, since the heat load of the fuel would keep the cask temperatures elevated.
The shielding material is not part of the containment boundary and it is unlikely that the gamma shield would reach -20'F. A fracture of the gamma shield will have no safety implications. However, Transnuclear has performed a fracture mechanics evaluation of the TN-68 package gamma shield based on a service temperature of -20'F. The work includes the following:
* Methodology * Loadings * Material fracture toughness * Fracture toughness criteria * Primary stress criteria * Allowable flaw size calculations * Conclusions * NDE Inspection Plan
Rev. 0 4/992.10.4-2

Methodology
The allowable flaw sizes were determined using linear elastic fracture mechanics (LEFM)
methodology from Section XI of ASME(2) Code (1989). Flaws in the welds, if they occur, are
welding defects, rather than initiated cracks. There is not an active mechanism for crack
initiation and growth at any of the weld locations. Thus, the calculated allowable flaw sizes can
be used for screening the gamma shield during fabrication.
Loadings
The following table lists the maximum membrane and bending stresses at the gamma shield
under normal and accident conditions. Figure 2.10.4-1 shows the selected locations on the
gamma shield numbered 1 through 6 for fracture toughness analysis. These locations were
selected to be representative of the stress distribution in the gamma shield with special attention
given to areas subject to high stresses and weld locations. The maximum stress may occur at a
different location for different load combinations (bolt preload, pressure, temperature, lifting
load, fabrication, end drop, CG over comer drops, side drop and slap down drop).
Rev. 0 4/992.10.4-3
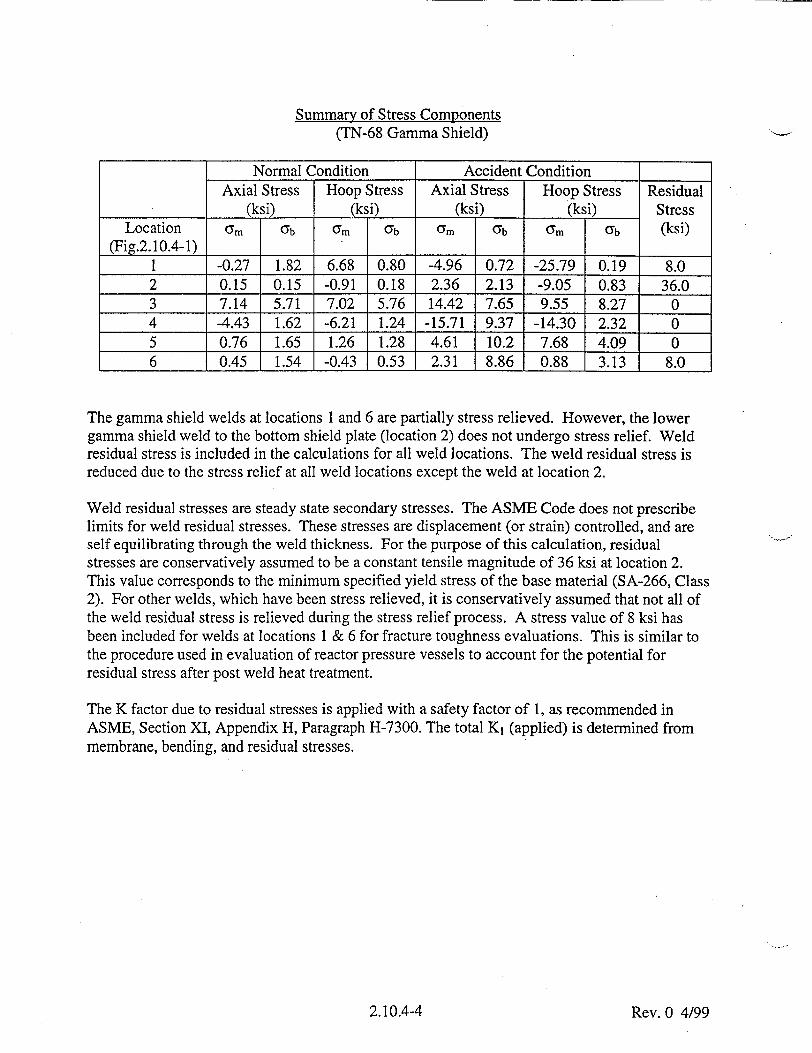
Summary of Stress Components (TN-68 Gamma Shield)
Normal Condition Accident Condition Axial Stress Hoop Stress Axial Stress Hoop Stress Residual
(ksi) (ksi) (ksi) (ksi) Stress Location am Ub am 'b am ab am ab (ksi)
(Fig.2.10.4-1) 1 -0.27 1.82 6.68 0.80 -4.96 0.72 -25.79 0.19 8.0 2 0.15 0.15 -0.91 0.18 2.36 2.13 -9.05 0.83 36.0 3 7.14 5.71 7.02 5.76 14.42 7.65 9.55 8.27 0 4 -4.43 1.62 -6.21 1.24 -15.71 9.37 -14.30 2.32 0 5 0.76 1.65 1.26 1.28 4.61 10.2 7.68 4.09 0 6 0.45 1.54 -0.43 0.53 2.31 8.86 0.88 3.13 8.0
The gamma shield welds at locations 1 and 6 are partially stress relieved. However, the lower gamma shield weld to the bottom shield plate (location 2) does not undergo stress relief. Weld residual stress is included in the calculations for all weld locations. The weld residual stress is reduced due to the stress relief at all weld locations except the weld at location 2.
Weld residual stresses are steady state secondary stresses. The ASME Code does not prescribe limits for weld residual stresses. These stresses are displacement (or strain) controlled, and are self equilibrating through the weld thickness. For the purpose of this calculation, residual stresses are conservatively assumed to be a constant tensile magnitude of 36 ksi at location 2. This value corresponds to the minimum specified yield stress of the base material (SA-266, Class 2). For other welds, 'which have been stress relieved, it is conservatively assumed that not all of the weld residual stress is relieved during the stress relief process. A stress value of 8 ksi has been included for welds at locations 1 & 6 for fracture toughness evaluations. This is similar to the procedure used in evaluation of reactor pressure vessels to account for the potential for residual stress after post weld heat treatment.
The K factor due to residual stresses is applied with a safety factor of 1, as recommended in ASME, Section XI, Appendix H, Paragraph H-7300. The total K1 (applied) is determined from membrane, bending, and residual stresses.
Rev. 0 4/992.10.4-4
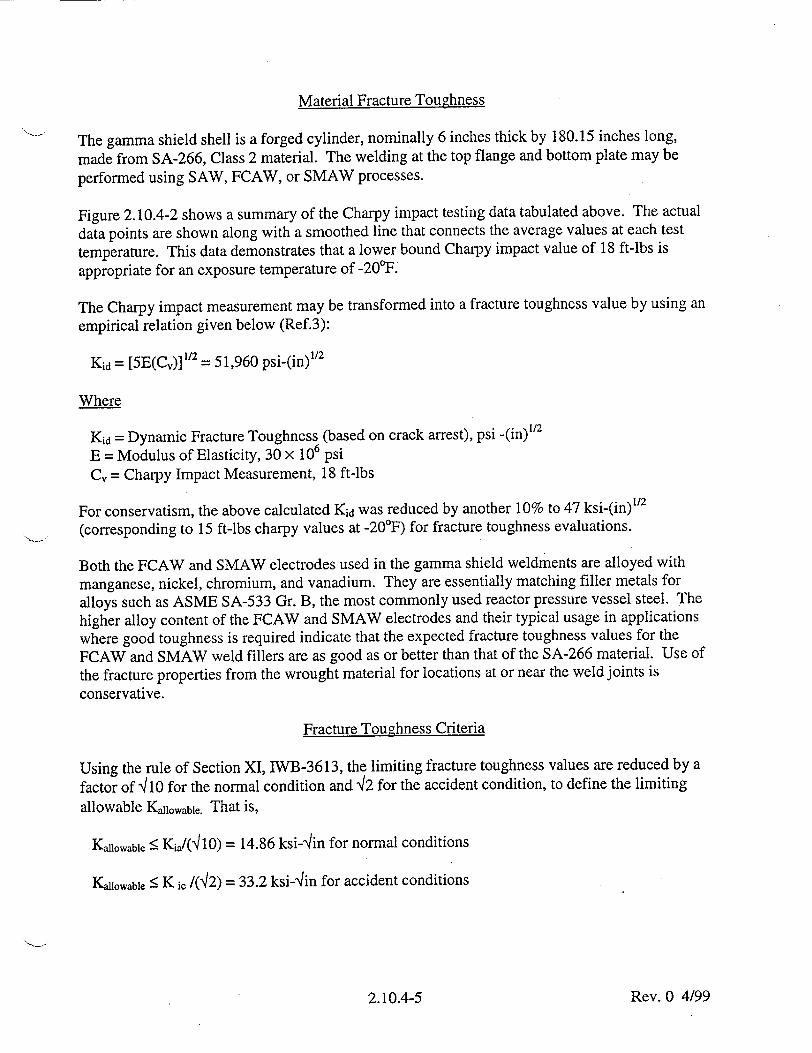
Material Fracture Toughness
"The gamma shield shell is a forged cylinder, nominally 6 inches thick by 180.15 inches long,
made from SA-266, Class 2 material. The welding at the top flange and bottom plate may be
performed using SAW, FCAW, or SMAW processes.
Figure 2.10.4-2 shows a summary of the Charpy impact testing data tabulated above. The actual
data points are shown along with a smoothed line that connects the average values at each test
temperature. This data demonstrates that a lower bound Charpy impact value of 18 ft-lbs is
appropriate for an exposure temperature of -20'F.
The Charpy impact measurement may be transformed into a fracture toughness value by using an
empirical relation given below (Ref.3):
Kid = [5E(Cv)]" 2 = 51,960 psi-(in)112
Where
Kid = Dynamic Fracture Toughness (based on crack arrest), psi -(in)12
E = Modulus of Elasticity, 30 x 106 psi Cv = Charpy Impact Measurement, 18 ft-lbs
For conservatism, the above calculated Kid was reduced by another 10% to 47 ksi-(in)1 2
(corresponding to 15 ft-lbs charpy values at -20'F) for fracture toughness evaluations.
Both the FCAW and SMAW electrodes used in the gamma shield weldments are alloyed with
manganese, nickel, chromium, and vanadium. They are essentially matching filler metals for alloys such as ASME SA-533 Gr. B, the most commonly used reactor pressure vessel steel. The higher alloy content of the FCAW and SMAW electrodes and their typical usage in applications where good toughness is required indicate that the expected fracture toughness values for the
FCAW and SMAW weld fillers are as good as or better than that of the SA-266 material. Use of the fracture properties from the wrought material for locations at or near the weld joints is conservative.
Fracture Toughness Criteria
Using the rule of Section XI, IWB-3613, the limiting fracture toughness values are reduced by a
factor of 4110 for the normal condition and 42 for the accident condition, to define the limiting
allowable Kallowable. That is,
Kallowable < Kia/(4 10) = 14.86 ksi-qin for normal conditions
Kanlowable < K ic /(2) = 33.2 ksi-4in for accident conditions
Rev. 0 4/992.10.4-5
Where:
Kia - the available fracture toughness based on crack arrest
K ic = the available fracture toughness based on crack initiation
The Kid value (47 ksi-in" 2) calculated above is the available fracture toughness based on crack arrest for the corresponding crack tip temperature and is conservatively used for the following normal and accident condition fracture toughness evaluations.
Primary Stress Criteria
ASME Section XI, IWB-3610 requires that any flaw evaluation include verification that the primary stress limits of ASME Code Section III continue to be met for the flawed component. The following formula is used which conservatively assumes that the available cross section is equal to the original thickness minus the allowable flaw depth.
a., = t(l - S/San)
Where:
awI = allowable flaw depth based on ASME Code Section III limits
t = original local thickness S = maximum calculated local stress intensity S~al = allowable stress intensity per ASME Section III.
All stresses are considered to be pure tensile membrane stresses. The stresses increase linearly with decreasing wall thickness.
Allowable Flaw Size Calculation
Using the above load definitions and fracture toughness values, a series of allowable flaw size calculations was performed using the method from ASME Section XI, Article A-3000, "Method for K, Determination". The total applied stress intensity Ki (applied) is determined from the membrane, bending, and residual stresses as:
K1 (applied - normal) = K, (membrane) + K, (bending) + KI/410 (residual)
K1 (applied - accident) = K, (membrane) + K, (bending) + KI/42 (residual)
The K1 due to residual stresses is applied with a safety factor of 1, as recommended in ASME Section XI, Appendix H, Paragraph H-7300.
Rev. 0 4/992.10.4-6

- Surface Flaws
For purpose of analysis, the postulated surface flaws are oriented in both the axial and
circumferential directions. The results of the surface flaw size calculations are shown in the
following table.
- Subsurface Flaws
The above discussion addressed the determination of allowable flaw sizes for flaws that are
connected to the surface of the shield shell. The shell or weld could also contain subsurface
defects.
An evaluation of allowable subsurface defects was performed using the same linear elastic
fracture mechanics (LEFM) techniques as described above for surface defects. For this case, a
center cracked panel (CCP) model was used to evaluate an assumed flaw length. The flaw must
be sufficiently embedded such that treatment as a subsurface flaw is justified. In general, if a
flaw is closer to the surface than 0.4 of its half-depth, it must be considered a surface flaw.
The results of the subsurface flaw size calculations are shown in the following table.
Rev. 0 4/992.10.4-7

Allowable Surface Flaws Denth (inches)(TN-68 Gamma Shield)
Location Normal Condition Accident Condition I to Axial -L to Hoop ±I to Axial I- to Hoop
Stress Stress Stress Stress. 1 -- 0.25 ....
(0.33) (0.33) (0.35) (0.35) 2 0..30 0.41 0.23 0.56
(1.16) (1.16) (1.13) (1.13)
3 0.40 0.41 0.63 1.05 (3.60) (3.60) (4.20) (4.20)
4...... -
(5.18) (5.18) (3.56) (3.56) 5 -- 2.25 1.63 1.64
(3.85) (3.85) (2.79) (2.79) 6 0.37 -- 0.37 -
(0.58) (0.58) (0.31) (0.31)
Allowable Sub-Surface Flaws (Embedded) Depth (inches) (TN-68 Gamma Shield)
Location Normal Condition Accident Condition 2- to Axial I- to Hoop _1 to Axial IL to Hoop
Stress Stress Stress Stress 1 -- 0.40 ....
(0.33) (0.33) (0.35) (0.35) 2 0.56 0.64 0.48 0.92
(1.16) (1.16) (1.13) (1.13) 3 1.38 1.40 1.72 2.58
(3.60) (3.60) (4.20) (4.20) 4...... -
(5.18) (5.18) (3.56) (3.56) 5 4.00 3.94 2.26 3.00
(3.85) (3.85) (2.79) (2.79) 6 0.68 -- 0.60 -
(0.58) (0.58) (0.31) (0.31) Note: 1. "--" Indicates that the allowable flaw depth is not limited by fracture mechanics calculation. 2. "( )" Indicates the allowable flaw depth determined by primary stress criteria 3. The actual maximum allowable flaw size is limited by the smaller of the allowable flaw size
limited by fracture mechanics or primary stress criteria.
Rev. 0 4/992.10.4-8
Specific conservatisms included in the above analysis are listed below:
"* All factors of safety on applied stress required by ASME Section XI are included in the evaluation.
"* Weld residual stresses are treated as constant tensile stresses normal to the flaw orientation. Flaws are assumed to be long (infinitely long or full circumference)
"* Lower bound material properties are used.
Conclusions
The gamma shield is not part of the containment boundary. Cracks postulated in the gamma shield will not propagate into the containment boundary due to the geometry of the cask. If the gamma shield were to fracture along the length or around the circumference or around the weld between the gamma shield and top flange, there is no credible mechanism that would result in the gamma shielding separating from the containment vessel. The top shield plate is welded to the lid and is captured by the containment vessel. Therefore, if the weld were to completely fail, the shield plate would still remain inside the confinement boundary and would not lose its shielding capability. Therefore, even if a fracture were to occur in the gamma shield shell or the weld between the gamma shield and top flange or top shield plate or weld between top shield plate and lid, there would be no safety significance, since containment would be maintained, and shielding would remain in place. The one exception is in the region of the weld of the gamma shield shell to the bottom plate. In this region, if the weld were to completely fail, the bottom plate could become detached and have an impact on the shielding capability of the cask.
NDE Inspection Plan
The results of the fracture toughness analysis show that the flaws in the gamma shield shell and top and bottom shield plates which would result in unstable crack growth or brittle fracture are larger than those generally observed in forged steel and plate components. No special examination requirements on the gamma shield shell, top and bottom shield plates are required.
The flaw sizes in the welds that could result in brittle fracture at -20'F will be detected by NDE methods and repaired. If the welds at locations 1 and 6 were to completely fail, there would be no compromise to safety. Therefore, only PT or MT of the final surface is specified.
If the bottom plate weld fails, the bottom plate could become detached and have an impact on the shielding capability of the cask. The minimum allowable flaw sizes for surface and subsurface are 0.23 in. and 0.48 in., respectively. Therefore, the following NDE will be used to ensure that defects of the minimum flaw sizes calculated are detected and repaired prior to use.
Rev. 0 4/992.10.4-9

* PT or MT at weld preparation surfaces (base metal) * PT or MT at root pass 0 PT or MT for each 0.375 inches of weld a PT or MT at final surface
The liquid penetrant or magnetic particle method will be in accordance with Section V, Article 6 of ASME(4 Code.
Rev. 0 4/992.10.4-10

2.10.4.4 References
1. ASME Section III, Division 3, Containment Systems and Transport Packagings for Spent Nuclear Fuel and High Level Radioactive Waste, 1998.
2. ASME Code Section XI, Welding and Brazing Qualifications, 1989.
3. NUREG/CR-1815, Recommendations for Protecting Against Failure by Brittle Fracture in
Ferritic Steel Shipping Containers up to Four Inches Thick.
4. ASME Code Section V, Nondestructive Examination, 1995 with 1996 addenda.
Rev. 0 4/992.10.4-11

THIS PAGE IS INTENTIONALLY LEFT BLANK.
Rev. 0 4/99
FIGURE 2.10.4-I LOCATIONS OF FRACTURE TOUGHNESS EVALUATIONS (TN-68 GAMMA SHIELD)
REV. 0 4/99

Figure 2.10.4-2 Charpy V-Notch Test Results for SA-266 Class 2
70
60
40
w 30
S-n.0..•'-.
-40 -30 -20 -10 0 10 20 30
Test Temperature, F
Rev. 0 4/99