TMDL Development for the Shenandoah River PCB … · objective of the Shenandoah River PCB TMDL is...
89
FINAL REPORT Development of Shenandoah River PCB TMDL U.S. Environmental Protection Agency Region 3 1650 Arch Street Philadelphia, PA 19103 Virginia Department of Environmental Quality 629 Main Street Richmond, Virginia 23219 September, 2001
Transcript of TMDL Development for the Shenandoah River PCB … · objective of the Shenandoah River PCB TMDL is...
FINAL REPORT
Development of Shenandoah River PCB TMDL
U.S. Environmental Protection AgencyRegion 3
1650 Arch StreetPhiladelphia, PA 19103
Virginia Department of Environmental Quality 629 Main Street
Richmond, Virginia 23219
September, 2001
Development of Shenandoah River PCB TMDL
i
Executive Summary
Several segments of the Shenandoah River are identified on Virginia’s 1998 303(d) TMDL Priority Listand Report as impaired due to fish consumption advisories issued by the Virginia Department of Health. The Shenandoah River is listed on West Virginia’s 1998 Section 303(d) TMDL Priority List and Reportdue to fish consumption advisories as well. Section 303(d) of the Clean Water Act requires states todevelop Total Maximum Daily Loads (TMDL) for waters not meeting water quality standards. Theobjective of the Shenandoah River PCB TMDL is to achieve water quality standards for polychlorinatedbiphenyls (PCBs) in the waterbody. The TMDL development process quantitatively assesses theimpairment factors so that states can establish water quality-based controls to reduce pollution from bothpoint and nonpoint sources, and to restore and protect the quality of their water resources.
Virginia water quality criteria for PCBs is based on individual Aroclors concentrations although the in-stream field data are measured as total PCBs. A total PCBs criteria was calculated to allow a basis ofcomparison to the in-stream total PCBs concentration. The calculated Virginia total PCBs water qualitycriteria of 0.55 ng/L was estimated based on a weight percent of each homolog group of themanufactured Aroclors 1221, 1232, 1016, 1242, 1248,1254, 1260 (GE, 1999). Appendix G containsdetailed information about the calculations. Total PCBs concentration and Aroclor concentration follow aproportional relationship of 0.55 ng/L of total PCBs for each 0.44 ng/L Aroclor. The following total PCBwater column concentrations must be met: 0.044 ng/L in the West Virginia portions of the ShenandoahRiver and 0.55 ng/L in the Virginia portions of the river.
The existing PCB data for the Shenandoah River document conditions at or near Avtex Fibers, Inc. Mostof the data, based on Aroclor analyses, indicate a failure to detect PCBs in either sediment or surfacewater. Additional sampling data were therefore warranted to gain a better understanding of the pollutantloading to the stream. A sampling event was conducted from April 26 through April 29, 2001, to support amore in-depth assessment of the spatial variation of PCBs in the Shenandoah watershed and to identifyadditional potential PCB sources.
The sampling event resulted in two water column samples with total PCBs values above the typicaldetection limit of 1 ng/L for EPA analytical Method 1681. Effluent from the Avtex wastewater treatmentplant (WWTP) and contributions from the Warren County Landfill showed values of 28.2 ng/L and 1.49ng/L, respectively. Most of the reported lab values were very close to the lab blank, indicating that thesevalues might be minimal (and outside the detection range). Based on these results, the two major potentialsources of PCB contamination have been identified as Avtex Fibers, Inc., and the Warren CountyLandfill.
Based on the data availability for the river, a one-dimensional, steady-state, plug-flow system wasdeveloped to represent the linkage between PCB sources in the Shenandoah watershed and the in-streamresponse. The Shenandoah River was segmented into a series of plug-flow reactors (defined along theentire length of the impaired segment) to simulate a steady-state distribution of PCBs. This approach was
Development of Shenandoah PCB TMDL
ii
necessary to accurately account for the water balance between each segment and the impact of pointsources and tributaries to the main stem of the Shenandoah River. Each of the plug-flow reactors defineda mass balance for PCBs for the sediment-water system. PCBs in the water column and sediment layerswere computed as concentration profiles with respect to distance.
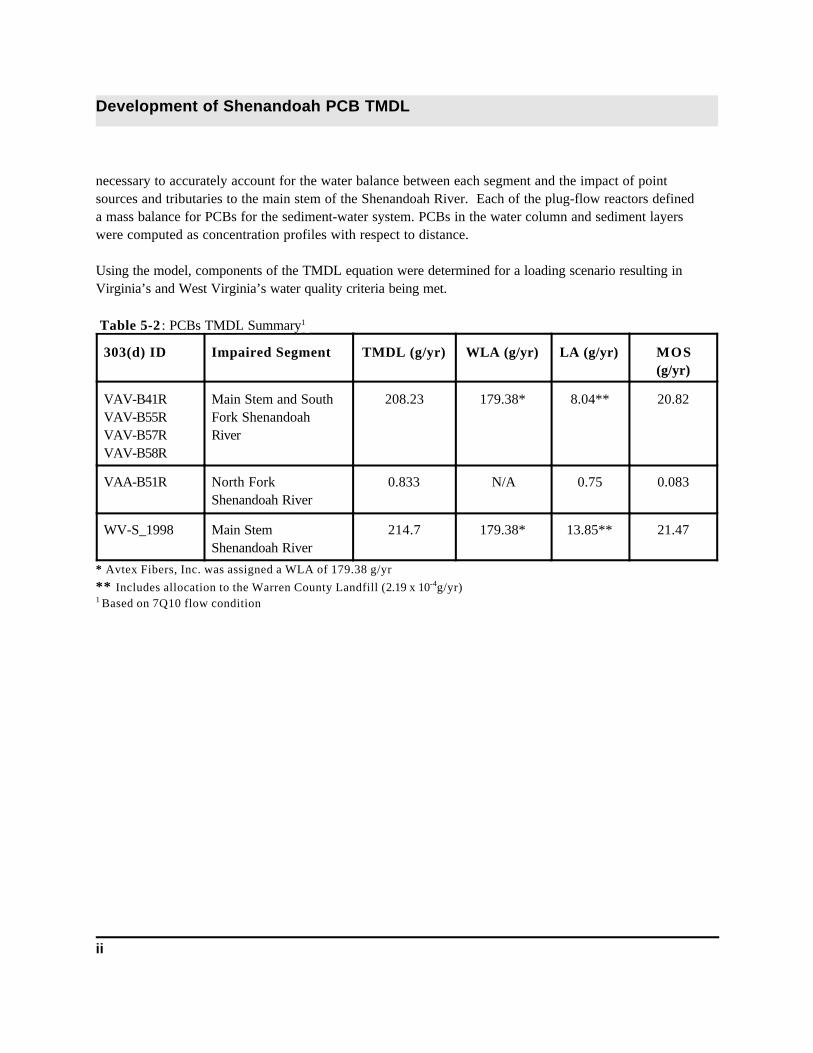
Using the model, components of the TMDL equation were determined for a loading scenario resulting inVirginia’s and West Virginia’s water quality criteria being met.
Table 5-2 : PCBs TMDL Summary1
303(d) ID Impaired Segment TMDL (g/yr) WLA (g/yr) LA (g/yr) MOS(g/yr)
VAV-B41RVAV-B55RVAV-B57RVAV-B58R
Main Stem and SouthFork ShenandoahRiver
208.23 179.38* 8.04** 20.82
VAA-B51R North ForkShenandoah River
0.833 N/A 0.75 0.083
WV-S_1998 Main Stem Shenandoah River
214.7 179.38* 13.85** 21.47
* Avtex Fibers, Inc. was assigned a WLA of 179.38 g/yr
** Includes allocation to the Warren County Landfill (2.19 x 10⁻⁴g/yr)1 Based on 7Q10 flow condition
Development of Shenandoah River PCB TMDL
iii
Contents
Executive Summary . . . . . . . . . . . . . . . . . . . . . . . . . . . . . . . . . . . . . . . . . . . . . . . . . . . . . . . . . . . . i Contents . . . . . . . . . . . . . . . . . . . . . . . . . . . . . . . . . . . . . . . . . . . . . . . . . . . . . . . . . . . . . . . . . . . . iii Figures . . . . . . . . . . . . . . . . . . . . . . . . . . . . . . . . . . . . . . . . . . . . . . . . . . . . . . . . . . . . . . . . . . . . .v Tables . . . . . . . . . . . . . . . . . . . . . . . . . . . . . . . . . . . . . . . . . . . . . . . . . . . . . . . . . . . . . . . . . . . . . . vi
Section 1: Background Information1.1. Problem Statement . . . . . . . . . . . . . . . . . . . . . . . . . . . . . . . . . . . . . . . . . . . . . . . . . . . 1-1 1.2. Polychlorinated Biphenyls . . . . . . . . . . . . . . . . . . . . . . . . . . . . . . . . . . . . . . . . . . . . . . . 1-3 1.3. Description of Physical Setting . . . . . . . . . . . . . . . . . . . . . . . . . . . . . . . . . . . . . . . . . . . 1-3 1.4. Discussion of 303(d) Listings . . . . . . . . . . . . . . . . . . . . . . . . . . . . . . . . . . . . . . . . . . . . 1-5 1.5. Applicable Water Quality Criteria . . . . . . . . . . . . . . . . . . . . . . . . . . . . . . . . . . . . . . . . . . 1-9
1.5.1. Designated Uses . . . . . . . . . . . . . . . . . . . . . . . . . . . . . . . . . . . . . . . . . . . . . 1-10 1.5.2. Virginia Water Quality Standards . . . . . . . . . . . . . . . . . . . . . . . . . . . . . . . . . 1-10 1.5.3. West Virginia Water Quality Standards . . . . . . . . . . . . . . . . . . . . . . . . . . . . . 1-11 1.5.4. Interpreting State Water Quality Standards and FDA Criteria . . . . . . . . . . . . . . 1-11
Section 2: Data Assessment2.1. Stream Flow Data . . . . . . . . . . . . . . . . . . . . . . . . . . . . . . . . . . . . . . . . . . . . . . . . . . . . 2-1 2.2. Water Quality Data . . . . . . . . . . . . . . . . . . . . . . . . . . . . . . . . . . . . . . . . . . . . . . . . . . . 2-4
2.2.1. Water Column Data . . . . . . . . . . . . . . . . . . . . . . . . . . . . . . . . . . . . . . . . . . . 2-5 2.2.2. Fish Tissue Data . . . . . . . . . . . . . . . . . . . . . . . . . . . . . . . . . . . . . . . . . . . . . . 2-9 2.2.3. Sediment Data . . . . . . . . . . . . . . . . . . . . . . . . . . . . . . . . . . . . . . . . . . . . . . 2-10 2.2.4. Clam Tissue Data . . . . . . . . . . . . . . . . . . . . . . . . . . . . . . . . . . . . . . . . . . . . 2-10
Section 3: Source Assessment 3.1. Nonpoint Source Analysis . . . . . . . . . . . . . . . . . . . . . . . . . . . . . . . . . . . . . . . . . . . . . . 3-1
3.1.1. Washoff from Land Surfaces . . . . . . . . . . . . . . . . . . . . . . . . . . . . . . . . . . . . . 3-1 3.1.2. Streambed Sediments . . . . . . . . . . . . . . . . . . . . . . . . . . . . . . . . . . . . . . . . . . 3-2
3.2. Point Source Analysis . . . . . . . . . . . . . . . . . . . . . . . . . . . . . . . . . . . . . . . . . . . . . . . . . 3-4 3.2.1. Avtex Fibers, Inc . . . . . . . . . . . . . . . . . . . . . . . . . . . . . . . . . . . . . . . . . . . . . 3-4 3.2.1.1. Site Description . . . . . . . . . . . . . . . . . . . . . . . . . . . . . . . . . . . . . . . . . . . . . 3-4 3.2.1.2. Corporate History . . . . . . . . . . . . . . . . . . . . . . . . . . . . . . . . . . . . . . . . . . . 3-4 3.2.1.3. History of PCBs Contamination . . . . . . . . . . . . . . . . . . . . . . . . . . . . . . . . . . 3-5 3.2.1.4. Site Remediation . . . . . . . . . . . . . . . . . . . . . . . . . . . . . . . . . . . . . . . . . . . . 3-6 3.2.2. Toxic Substance Control Act . . . . . . . . . . . . . . . . . . . . . . . . . . . . . . . . . . . . . 3-9 3.2.3. Resource Conservation and Recovery Act . . . . . . . . . . . . . . . . . . . . . . . . . . . . 3-9 3.2.4. Comprehensive Environmental Response, Compensation, and
Liability Act . . . . . . . . . . . . . . . . . . . . . . . . . . . . . . . . . . . . . . . . . . . . . 3-10 3.2.5. EPA Permit Compliance Systems and Industrial Facility Discharges . . . . . . . . . 3-11

Development of Shenandoah River PCB TMDL
iv
Section 4: Supplemental PCB Sampling in Shenandoah River4.1. Sampling Event . . . . . . . . . . . . . . . . . . . . . . . . . . . . . . . . . . . . . . . . . . . . . . . . . . . . . . 4-2 4.2. Preliminary Unvalidated Total PCBs Results . . . . . . . . . . . . . . . . . . . . . . . . . . . . . . . . . . 4-4
Section 5: Technical Approach5.1. Source Response Linkage . . . . . . . . . . . . . . . . . . . . . . . . . . . . . . . . . . . . . . . . . . . . . . . 5-1
5.1.1. Model Development . . . . . . . . . . . . . . . . . . . . . . . . . . . . . . . . . . . . . . . . . . . 5-1 5.1.2. Source Representation . . . . . . . . . . . . . . . . . . . . . . . . . . . . . . . . . . . . . . . . . 5-3 5.1.3. Analytical Assumption . . . . . . . . . . . . . . . . . . . . . . . . . . . . . . . . . . . . . . . . . 5-3
5.2. TMDL Calculations . . . . . . . . . . . . . . . . . . . . . . . . . . . . . . . . . . . . . . . . . . . . . . . . . . 5-4 5.2.1. Wasteload Allocations . . . . . . . . . . . . . . . . . . . . . . . . . . . . . . . . . . . . . . . . . . 5-6 5.2.2. Load Allocation . . . . . . . . . . . . . . . . . . . . . . . . . . . . . . . . . . . . . . . . . . . . . . 5-6 5.2.3. Margin of Safety . . . . . . . . . . . . . . . . . . . . . . . . . . . . . . . . . . . . . . . . . . . . . 5-6
5.3. Seasonal Variations . . . . . . . . . . . . . . . . . . . . . . . . . . . . . . . . . . . . . . . . . . . . . . . . . . . 5-6 5.4. Fish Advisory Criteria and TMDL Endpoint . . . . . . . . . . . . . . . . . . . . . . . . . . . . . . . . . . 5-7
Section 6: Reasonable Assurances . . . . . . . . . . . . . . . . . . . . . . . . . . . . . . . . . . . . . . . . . . . . . . 6-1 Section 7: Public Participation . . . . . . . . . . . . . . . . . . . . . . . . . . . . . . . . . . . . . . . . . . . . . . . . . . . . .. . 6-2
References . . . . . . . . . . . . . . . . . . . . . . . . . . . . . . . . . . . . . . . . . . . . . . . . . . . . . . . . . . . . . . . . R-1
Appendices
Appendix A-1: USGS Gauge Flow Data . . . . . . . . . . . . . . . . . . . . . . . . . . . . . . . . . . . . . . . . . . . . . . A-1Appendix A-2: Water Quality Data . . . . . . . . . . . . . . . . . . . . . . . . . . . . . . . . . . . . . . . . . . . . . . . . . . A-3Appendix B-1: RCRA Sites Information . . . . . . . . . . . . . . . . . . . . . . . . . . . . . . . . . . . . . . . . . . . . . . B-1Appendix B-2: CERCLA Sites Information . . . . . . . . . . . . . . . . . . . . . . . . . . . . . . . . . . . . . . . . . . . . B-3Appendix C: PCS-Industrial Facilities . . . . . . . . . . . . . . . . . . . . . . . . . . . . . . . . . . . . . . . . . . . . . . . . C-1Appendix D: Quality Assurance Program Plan . . . . . . . . . . . . . . . . . . . . . . . . . . . . . . . . . . . . . . . . . . D-1Appendix E: Shenandoah Sampling Event Photographs . . . . . . . . . . . . . . . . . . . . . . . . . . . . . . . . . . . . E-1Appendix F: Plug Flow Reactor Model . . . . . . . . . . . . . . . . . . . . . . . . . . . . . . . . . . . . . . . . . . . . . . F-1

Development of Shenandoah River PCB TMDL
v
Figures
Figure 1-1: Location of Shenandoah River Watershed . . . . . . . . . . . . . . . . . . . . . . . . . . . . . . . . . . . . 1-2 Figure 1-2: Land Use Distribution in the Shenandoah River Watershed . . . . . . . . . . . . . . . . . . . . . . . . . 1-4 Figure 1-3: Fish Tissue FDA Exceedances . . . . . . . . . . . . . . . . . . . . . . . . . . . . . . . . . . . . . . . . . . . . 1-9 Figure 2-1:Water Quality Monitoring and Flow Gauge Stations . . . . . . . . . . . . . . . . . . . . . . . . . . . . . . 2-2 Figure 2-2: Sediment Sampling Locations from Multiple Agencies . . . . . . . . . . . . . . . . . . . . . . . . . . . . 2-6 Figure 2-3: Detected PCBs in Water Column Samples . . . . . . . . . . . . . . . . . . . . . . . . . . . . . . . . . . . . 2-7 Figure 2-4: Clam and Fish Sampling Locations from Multiple Agencies . . . . . . . . . . . . . . . . . . . . . . . . 2-8 Figure 2-5: Total PCBs Concentrations in Fish Tissue . . . . . . . . . . . . . . . . . . . . . . . . . . . . . . . . . . . . 2-9 Figure 2-6: Total PCBs Concentrations in Sediments . . . . . . . . . . . . . . . . . . . . . . . . . . . . . . . . . . . . 2-10 Figure 3-1: Water Sediment Interaction . . . . . . . . . . . . . . . . . . . . . . . . . . . . . . . . . . . . . . . . . . . . . . 3-3 Figure 3-2: PCS and IFD Facilities in the Shenandoah River Basin . . . . . . . . . . . . . . . . . . . . . . . . . . . 3-13 Figure 4-1: Sampling Site Location Map . . . . . . . . . . . . . . . . . . . . . . . . . . . . . . . . . . . . . . . . . . . . . . 4-2 Figure 5-1: Plug-Flow Reactor Representation of the Shenandoah River . . . . . . . . . . . . . . . . . . . . . . . . 5-2 Figure 5-2: Processes and Interaction Represented in the Plug-Flow Reactor Model . . . . . . . . . . . . . . . 5-2 Figure 5-3: Total Modeled PCBs in Water Column Along the Length of the
Shenandoah River . . . . . . . . . . . . . . . . . . . . . . . . . . . . . . . . . . . . . . . . . . . . . . . . . 5-5

Development of Shenandoah River PCB TMDL
vi
Tables
Table 1-1: 303(d) Impaired Segment Listings . . . . . . . . . . . . . . . . . . . . . . . . . . . . . . . . . . . . . . . . . . 1-1 Table 1-2: Land Use Distribution . . . . . . . . . . . . . . . . . . . . . . . . . . . . . . . . . . . . . . . . . . . . . . . . . . . 1-3 Table 1-3: Percent Land Use Distribution by Subbasin and Land Type . . . . . . . . . . . . . . . . . . . . . . . . . 1-5 Table 1-4: Analysis of FDA Exceedances in the Shenandoah River . . . . . . . . . . . . . . . . . . . . . . . . . . . 1-7 Table 1-5: Virginia State Water Control Board Water Quality Data, Fish-Type . . . . . . . . . . . . . . . . . . . . 1-8 Table 1-6: Applicable Virginia Water Quality Criteria . . . . . . . . . . . . . . . . . . . . . . . . . . . . . . . . . . . . 1-10 Table 1-7: Applicable West Virginia Water Quality Criteria . . . . . . . . . . . . . . . . . . . . . . . . . . . . . . . . 1-11 Table 1-8: Mass Conversion Table . . . . . . . . . . . . . . . . . . . . . . . . . . . . . . . . . . . . . . . . . . . . . . . . . 1-12 Table 1-9: Water Quality Criteria for Total PCBs . . . . . . . . . . . . . . . . . . . . . . . . . . . . . . . . . . . . . . . 1-12 Table 2-1: Inventory of Data and Information for the Shenandoah River Watershed . . . . . . . . . . . . . . . 2-1 Table 2-2: Statistical Summary of Key USGS Stations in the Shenandoah River Watershed . . . . . . . . . . 2-3 Table 2-3: Seasonal Flow Analysis at USGS 1631000 . . . . . . . . . . . . . . . . . . . . . . . . . . . . . . . . . . . . . 2-4 Table 2-4: In-stream Water Quality Overview . . . . . . . . . . . . . . . . . . . . . . . . . . . . . . . . . . . . . . . . . . 2-5 Table 2-5: Detectable Water Column Data . . . . . . . . . . . . . . . . . . . . . . . . . . . . . . . . . . . . . . . . . . . . . 2-5 Table 2-6: Superfund Data, Clams-Type . . . . . . . . . . . . . . . . . . . . . . . . . . . . . . . . . . . . . . . . . . . . 2-10 Table 3-1: RCRA Facilities . . . . . . . . . . . . . . . . . . . . . . . . . . . . . . . . . . . . . . . . . . . . . . . . . . . . . . 3-10 Table 3-2: CERCLA Sites . . . . . . . . . . . . . . . . . . . . . . . . . . . . . . . . . . . . . . . . . . . . . . . . . . . . . . . 3-11 Table 4-1: Summary of Samples Collected During Sampling Event April 26-29, 2001 . . . . . . . . . . . . . . 4-3 Table 4-2: Total PCBs Concentration Data (UNVALIDATED) . . . . . . . . . . . . . . . . . . . . . . . . . . . . . . . 4-4 Table 5-1: Total PCBs Discharge Characteristics in the Shenandoah River . . . . . . . . . . . . . . . . . . . . . . 5-3 Table 5-2: PCB TMDL Summary . . . . . . . . . . . . . . . . . . . . . . . . . . . . . . . . . . . . . . . . . . . . . . . . . . . 5-5 Table 5-3: Total PCBs Water Quality Criteria . . . . . . . . . . . . . . . . . . . . . . . . . . . . . . . . . . . . . . . . . . . 5-7 Table 5-4: Total PCBs in Fish Tissue vs. Sediment . . . . . . . . . . . . . . . . . . . . . . . . . . . . . . . . . . . . . . 5-8

Development of Shenandoah River PCB TMDL
1-1
Section 1: Background Information
1.1. Problem Statement
The Shenandoah River drains 1,957,690 acres of land which is predominantly forest. The headwaters ofthe River are in the Appalachian and Shenandoah Mountains and drain north-northeast before mergingnear Front Royal, Virginia and flowing into the Potomac River in West Virginia. The maximum elevationin the basin is approximately 3,350 feet in the Appalachian Mountains; the minimum elevation, 300 feet,occurs at the confluence with the Potomac River. The Shenandoah River basin encompasses threesubbasins or 8-digit U.S. Geological Survey (USGS) Hydrologic Unit Codes (Figure 1-1):• HUC 02070005 South Fork of the Shenandoah River (S.F. Shenandoah River)• HUC 02070006 North Fork of the Shenandoah River (N.F. Shenandoah River)• HUC 02070007 Shenandoah River
Several segments of the Shenandoah River are identified on Virginia’s 1998 Section 303(d) TMDLPriority List and Report as impaired due to fish consumption advisories issued by the Virginia Departmentof Health. The Shenandoah River is listed on West Virginia’s 1998 Section 303(d) TMDL Priority Listand Report due to fish consumption advisories as well. The first listed stream segment is located between the towns of Front Royal and Berryville, Virginia. The segment is 36.45 miles in length, beginningat the Rt. 619 bridge over the S.F. Shenandoah River in Front Royal and ending at the Virginia/WestVirginia state line. The second segment is 5.33 miles in length, beginning at the Passage Creek confluencewith the N.F. Shenandoah River and ending at the N.F. Shenandoah River’s confluence with the S.F.Shenandoah River in Front Royal. The third segment is 19.45 miles long and runs from the West Virginialine to the Shenandoah River’s confluence with the Potomac River. Table 1-1 lists the impaired segmentsin the Shenandoah River basin. The impaired segments encompass Jefferson, Clarke and Warrencounties. Figure 1-1 shows the location of the listed segments.
Section 303(d) of the Clean Water Act requires states to develop Total Maximum Daily Loads (TMDLs)for waters that do not meet water quality standards. The objective of the Shenandoah PCB TMDL is toachieve water quality standards for polychlorinated biphenyls (PCBs) in the waterbody. The TMDLdevelopment process quantitatively assesses the impairment factors so that states can establish waterquality-based controls to reduce pollution from both point and nonpoint sources and to restore and protectthe quality of their water resources.
Table 1-1: 303(d) Impaired Segment Listings303 ID Branches Miles Description
WV-S-1998 Main Stem 19.45 VA State Line to Potomac River
VAV-B41RMain Stem and South Fork 36.45 Rte 619 to VA State LineVAV-B55R
VAV-B57R
VAV-B58R
VAV-B51R North Fork 5.33 Passage Creek to confluence
Sources: Virginia Department of Environmental Quality and West Virginia Department of Environmental Protection.

Development of Shenandoah River PCB TMDL
1-2
Figure 1-1: Location of Shenandoah River Watershed
Development of Shenandoah River PCB TMDL
1-3
1.2. Polychlorinated biphenyls
Polychlorinated biphenyls (PCBs) consist of 209 related chemical compounds that were manufacturedand sold as mixtures under various trade names, including Aroclor, Phenoclor, Clophen, and Kenechlor(GE, 1999). They were used from approximately the 1940s through the 1970s. Because they possessexcellent dielectric and flame resistant properties, PCBs were extensively used as heat transfer fluids,hydraulic fluids, flame retardants, and dielectric fluids. These same properties cause PCBs to accumulatein the fatty tissue of biota and bioaccumulate in the food chain. Concerns regarding potential human healtheffects led to cessation of PCB production and use in the United States in the 1970s.
Each of the 209 possible PCB compounds (called congeners) consists of two phenyl groups and chlorineatoms (chlorination). Individual PCB congeners differ in the number and position of the chlorine atoms. PCBs were manufactured and sold in the United States under the Aroclor trade name (GE, 1999) andseveral Aroclor products were manufactured. The five principal compounds were Aroclor 1221, 1242,1016, 1254, and 1260. These products differed in their degree of chlorination.
1.3. Description of Physical Setting
The Shenandoah River, the North Fork of the Shenandoah River, the South Fork of the ShenandoahRiver, and the South Fork of the Shenandoah headwaters are included in the Reach File 1 streamnetwork, which is based on 1:500,000 resolution maps.
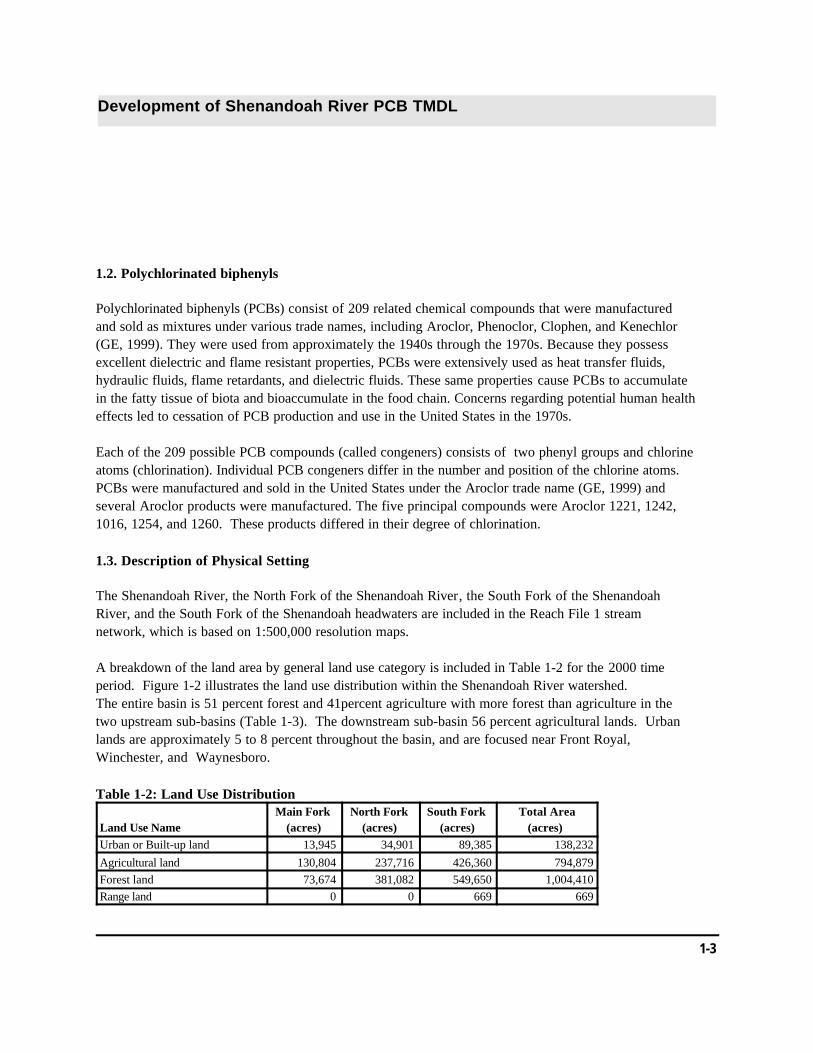
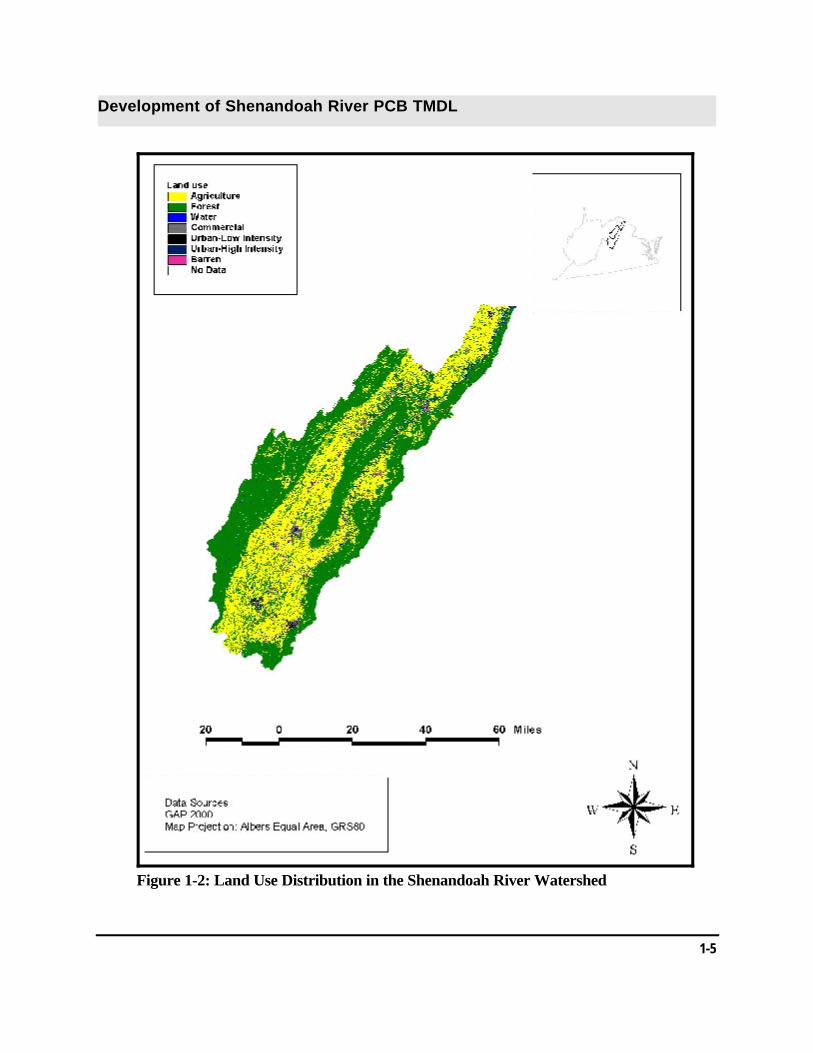
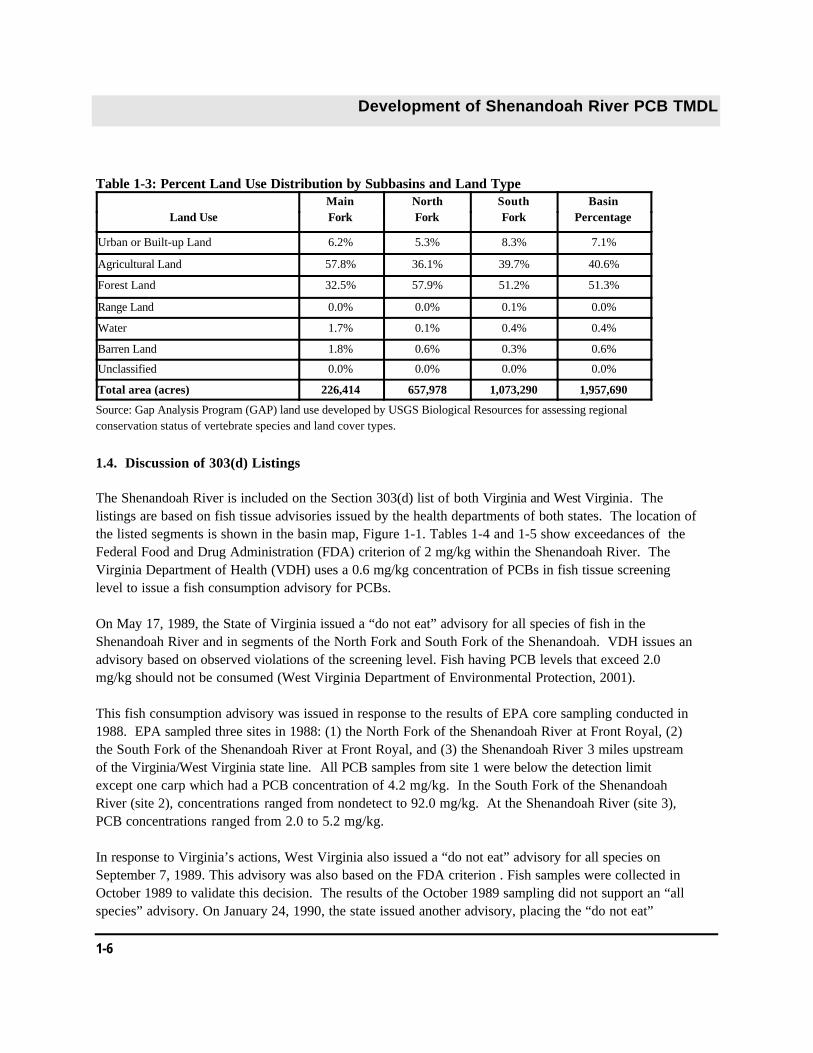
A breakdown of the land area by general land use category is included in Table 1-2 for the 2000 timeperiod. Figure 1-2 illustrates the land use distribution within the Shenandoah River watershed.The entire basin is 51 percent forest and 41percent agriculture with more forest than agriculture in thetwo upstream sub-basins (Table 1-3). The downstream sub-basin 56 percent agricultural lands. Urbanlands are approximately 5 to 8 percent throughout the basin, and are focused near Front Royal,Winchester, and Waynesboro.
Table 1-2: Land Use Distribution
Land Use NameMain Fork
(acres)North Fork
(acres)South Fork
(acres)Total Area
(acres) Urban or Built-up land 13,945 34,901 89,385 138,232
Agricultural land 130,804 237,716 426,360 794,879Forest land 73,674 381,082 549,650 1,004,410Range land 0 0 669 669

Development of Shenandoah River PCB TMDL
1-4
Water 3,938 413 3,805 8,156
Barren land 4,049 3,859 3,414 11,322Unclassified 4 7 9 20Total 226,414 657,978 1,073,290 1,957,690
Note: These land use data are based on a 100-m2 resolution.Source: Gap Analysis Program (GAP) land use developed by USGS Biological Resources for assessing regionalconservation status of vertebrate species and land cover types.
Development of Shenandoah River PCB TMDL
1-5
Figure 1-2: Land Use Distribution in the Shenandoah River Watershed
Development of Shenandoah River PCB TMDL
1-6
Table 1-3: Percent Land Use Distribution by Subbasins and Land Type
Land Use MainFork
NorthFork
SouthFork
BasinPercentage
Urban or Built-up Land 6.2% 5.3% 8.3% 7.1%
Agricultural Land 57.8% 36.1% 39.7% 40.6%
Forest Land 32.5% 57.9% 51.2% 51.3%
Range Land 0.0% 0.0% 0.1% 0.0%
Water 1.7% 0.1% 0.4% 0.4%
Barren Land 1.8% 0.6% 0.3% 0.6%
Unclassified 0.0% 0.0% 0.0% 0.0%
Total area (acres) 226,414 657,978 1,073,290 1,957,690
Source: Gap Analysis Program (GAP) land use developed by USGS Biological Resources for assessing regionalconservation status of vertebrate species and land cover types.
1.4. Discussion of 303(d) Listings
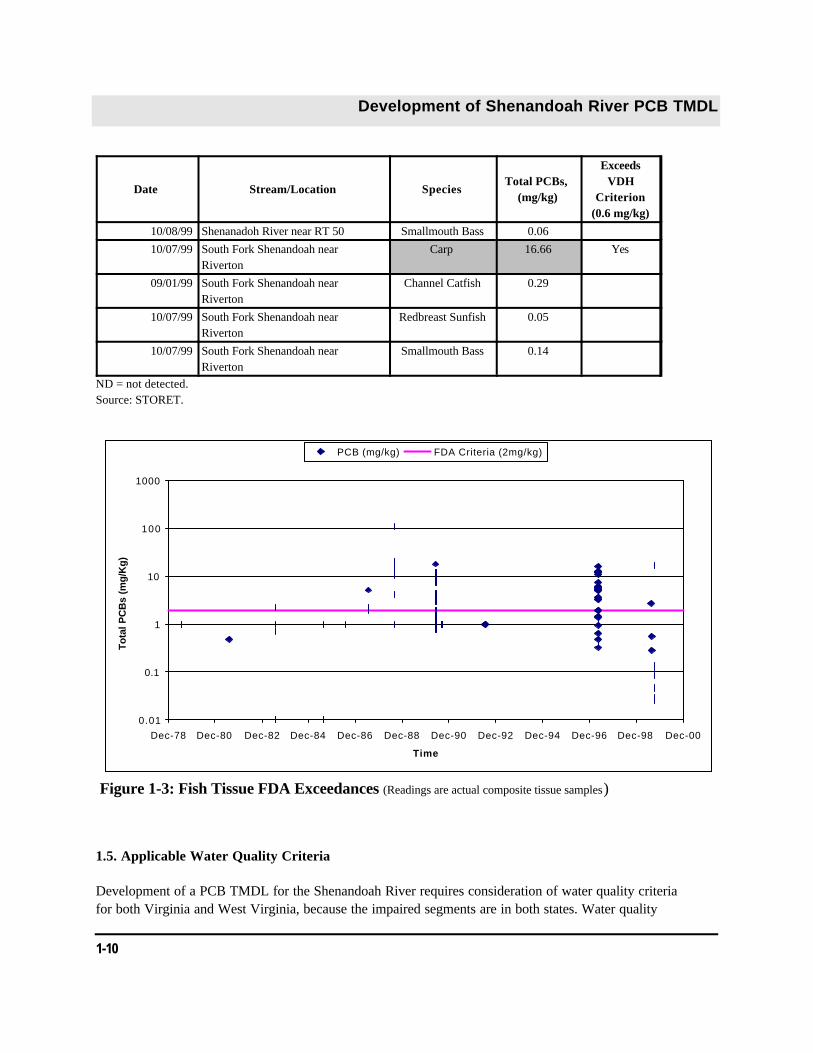
The Shenandoah River is included on the Section 303(d) list of both Virginia and West Virginia. Thelistings are based on fish tissue advisories issued by the health departments of both states. The location ofthe listed segments is shown in the basin map, Figure 1-1. Tables 1-4 and 1-5 show exceedances of theFederal Food and Drug Administration (FDA) criterion of 2 mg/kg within the Shenandoah River. TheVirginia Department of Health (VDH) uses a 0.6 mg/kg concentration of PCBs in fish tissue screeninglevel to issue a fish consumption advisory for PCBs.
On May 17, 1989, the State of Virginia issued a “do not eat” advisory for all species of fish in theShenandoah River and in segments of the North Fork and South Fork of the Shenandoah. VDH issues anadvisory based on observed violations of the screening level. Fish having PCB levels that exceed 2.0mg/kg should not be consumed (West Virginia Department of Environmental Protection, 2001).
This fish consumption advisory was issued in response to the results of EPA core sampling conducted in1988. EPA sampled three sites in 1988: (1) the North Fork of the Shenandoah River at Front Royal, (2)the South Fork of the Shenandoah River at Front Royal, and (3) the Shenandoah River 3 miles upstreamof the Virginia/West Virginia state line. All PCB samples from site 1 were below the detection limitexcept one carp which had a PCB concentration of 4.2 mg/kg. In the South Fork of the ShenandoahRiver (site 2), concentrations ranged from nondetect to 92.0 mg/kg. At the Shenandoah River (site 3),PCB concentrations ranged from 2.0 to 5.2 mg/kg.
In response to Virginia’s actions, West Virginia also issued a “do not eat” advisory for all species onSeptember 7, 1989. This advisory was also based on the FDA criterion . Fish samples were collected inOctober 1989 to validate this decision. The results of the October 1989 sampling did not support an “allspecies” advisory. On January 24, 1990, the state issued another advisory, placing the “do not eat”
Development of Shenandoah River PCB TMDL
1-7
advisory on catfish, carp, and suckers only. The “do not eat” advisory has remained in place until thepresent time.
In September 2000, the West Virginia Fish Consumption Advisory Technical Committee was created byGovernor’s Executive Order. One objective of this committee is to apply the newly developed risk-basedprotocols presented in the “West Virginia Sportfish Consumption Advisory Guide” (Warnick, 2000) to newand existing fish tissue data. Risk-based advisories recommend consumers eat fewer meals of fishcontaining PCB concentrations that are below the FDA level. Due to impending TMDL development, thecommittee assigned a higher priority to the re-evaluation of Shenandoah River fish tissue data. Advisorylanguage is currently being developed and a formal advisory update is planned for July 2001. Thisadvisory, which is based on data collected in 1989 and 1993, will reinforce the existing “do not eat”
advisory for catfish, carp, and suckers and recommend limiting meals of all other species to one meal permonth.
On October 16, 1989, the Virginia Water Control Board identified the source of the PCB contamination inthe Shenandoah River as Avtex Fibers, Inc. The Environmental Reporter (vol. 20, no.29, November 17,1989) announced that Virginia officials had revoked Avtex's water discharge permit, effective November9, 1989. The state also sued Avtex for extensive permit violations. The company agreed to pay morethan $17 million in fines for violation of its water discharge permit. On November 11, 1989, Avtex Fibersshut down the plant following this action. Since 1989 emergency actions, including removal and disposal ofPCB contaminated soils, have taken place. The site was placed on EPA’s National Priority List (NPL) in1986, where it remains today.
Figure 1-3 plots the fish tissue sample data against the FDA fish advisory criterion. Samples were takenwithin the Shenandoah watershed, and the data show that the high exceedances occurred in the late1980s.

Development of Shenandoah River PCB TMDL
1-8
Table 1-4: Analysis of FDA Exceedances in the Shenandoah River
DATE Stream Location Species
TotalPCBs
(mg/kg)
ExceedsFDA
Criterion (2 mg/kg)
10/11/89 Shenandoah River Meyerstown Bluegill 0.29 No
10/11/89 Shenandoah River Meyerstown Channel Catfish 5.4 Yes
10/11/89 Shenandoah River Meyerstown Golden Redhorse Sucker 11.8 Yes
10/11/89 Shenandoah River Meyerstown Pumpkinseed 0.56 No
10/11/89 Shenandoah River Meyerstown Redbreast Sunfish 0.78 No
10/11/89 Shenandoah River Meyerstown Smallmouth Bass 0.93 No
10/11/89 Shenandoah River Millville Bluegill 0.41 No
10/11/89 Shenandoah River Millville Channel Catfish 4.3 Yes
10/11/89 Shenandoah River Millville Golden Redhorse Sucker 3.8 Yes
10/11/89 Shenandoah River Millville Pumpkinseed 0.46 No
10/11/89 Shenandoah River Millville Redbreast Sunfish 0.46 No
10/11/89 Shenandoah River Millville Smallmouth Bass 0.56 No
10/28/93 Shenandoah River Millville Bluegill 0.190 No
10/28/93 Shenandoah River Millville Channel Catfish 4.015 Yes
10/28/93 Shenandoah River Millville Golden Redhorse Sucker 4.890 Yes
10/28/93 Shenandoah River Millville Pumpkinseed 0.114 No
10/28/93 Shenandoah River Millville Redbreast Sunfish 0.196 No
10/28/93 Shenandoah River Millville Smallmouth Bass 0.344 No
10/28/93 Shenandoah River Meyerstown Channel Catfish 11.74 Yes
10/28/93 Shenandoah River Meyerstown Golden Redhorse Sucker 5.44 Yes
10/28/93 Shenandoah River Meyerstown Redbreast Sunfish 0.238 No
10/28/93 Shenandoah River Meyerstown Smallmouth Bass 0.419 NoSource: West Virginia Department of Environmental Protection.

Development of Shenandoah River PCB TMDL
1-9
Table 1-5: Virginia State Water Control Board Water Quality Data Fish-Type
Date Stream/Location SpeciesTotal PCBs,
(mg/kg)
ExceedsVDH
Criterion(0.6 mg/kg)
07/24/79 Shenandoah River ND
08/04/81 Shenandoah River 0.50
07/27/83 Shenandoah River 2.30 Yes
08/13/85 Shenandoah River ND
07/16/86 Shenandoah River ND
08/18/88 Shenandoah River ND
07/26/79 Shenandoah River ND
07/28/83 Shenandoah River ND
08/14/85 Shenandoah River ND
08/18/88 Shenandoah River 4.20 Yes
09/12/90 Shenandoah River ND
09/12/90 Shenandoah River ND
09/13/90 Shenandoah River ND
07/16/87 Shenandoah River 5.20 Yes
06/05/90 Shenandoah River 4.40 Yes
07/16/92 Shenandoah River ND
06/05/90 Shenandoah River 7.50 Yes
06/06/90 Shenandoah River 9.70 Yes
07/14/92 Shenandoah River ND
06/06/90 Shenandoah River 18.00 Yes
08/17/88 Shenandoah River 12.00 Yes
07/26/79 Shenandoah River ND
07/28/83 Shenandoah River ND
08/14/85 Shenandoah River ND
08/16/88 Shenandoah River 21.00 Yes
08/17/88 Shenandoah River 110.00 Yes
06/06/90 Shenandoah River 50.00 Yes
07/14/92 Shenandoah River ND
07/16/92 Shenandoah River ND
10/08/99 Shenandoah River near RT 7 White Sucker 0.03
08/17/99 Shenandoah River near RT 7 Channel Catfish 2.07 Yes
10/06/99 Shenandoah River near RT 7 Redbreast Sunfish 0.05
10/06/99 Shenandoah River near RT 7 Smallmouth Bass 0.12
10/08/99 Shenandoah River near RT 50 White Sucker 0.06
08/27/99 Shenanadoh River near RT 50 Channel Catfish 0.56 Yes
10/08/99 Shenandoah River near RT 50 Redbreast Sunfish 0.03
Development of Shenandoah River PCB TMDL
Date Stream/Location SpeciesTotal PCBs,
(mg/kg)
ExceedsVDH
Criterion(0.6 mg/kg)
1-10
0.01
0.1
1
10
100
1000
Dec-78 Dec-80 Dec-82 Dec-84 Dec-86 Dec-88 Dec-90 Dec-92 Dec-94 Dec-96 Dec-98 Dec-00
Time
To
tal P
CB
s (m
g/K
g)
PCB (mg/kg) FDA Criteria (2mg/kg)
Figure 1-3: Fish Tissue FDA Exceedances (Readings are actual composite tissue samples)
10/08/99 Shenanadoh River near RT 50 Smallmouth Bass 0.06
10/07/99 South Fork Shenandoah nearRiverton
Carp 16.66 Yes
09/01/99 South Fork Shenandoah nearRiverton
Channel Catfish 0.29
10/07/99 South Fork Shenandoah nearRiverton
Redbreast Sunfish 0.05
10/07/99 South Fork Shenandoah nearRiverton
Smallmouth Bass 0.14
ND = not detected.Source: STORET.
1.5. Applicable Water Quality Criteria
Development of a PCB TMDL for the Shenandoah River requires consideration of water quality criteriafor both Virginia and West Virginia, because the impaired segments are in both states. Water quality
Development of Shenandoah River PCB TMDL
1-11
criteria are based on designated uses and vary from one state to the next. The water quality criteria mustbe met in both states to meet the TMDL requirements. Based on the existing criteria, reductions in PCBlevels above what are necessary to meet the criteria in Virginia are required for the Shenandoah River tocomply with the West Virginia criteria.
1.5.1. Designated Uses
Virginia: All waters in Virginia have the designated uses of contact recreation, propagation of fish andgame, and production of edible and marketable natural resources such as fish (9 VAC 25-260-10).Additional uses apply to several river sections that are used as a water supply source. The South Fork ofthe Shenandoah River upstream of the impaired section and the main stem of the Shenandoah River from5 miles upstream of the Berryville raw water intake to the Virginia/West Virginia state line are designatedfor water supply.
West Virginia: West Virginia water quality criteria state designated uses of propagation of fish and otheraquatic life and contact recreation (46-1-6). Additional uses apply to a portion of the Shenandoah Rivernear Charlestown (which is designated as Class A: Water Supply, Public).
1.5.2. Virginia Water Quality Standards
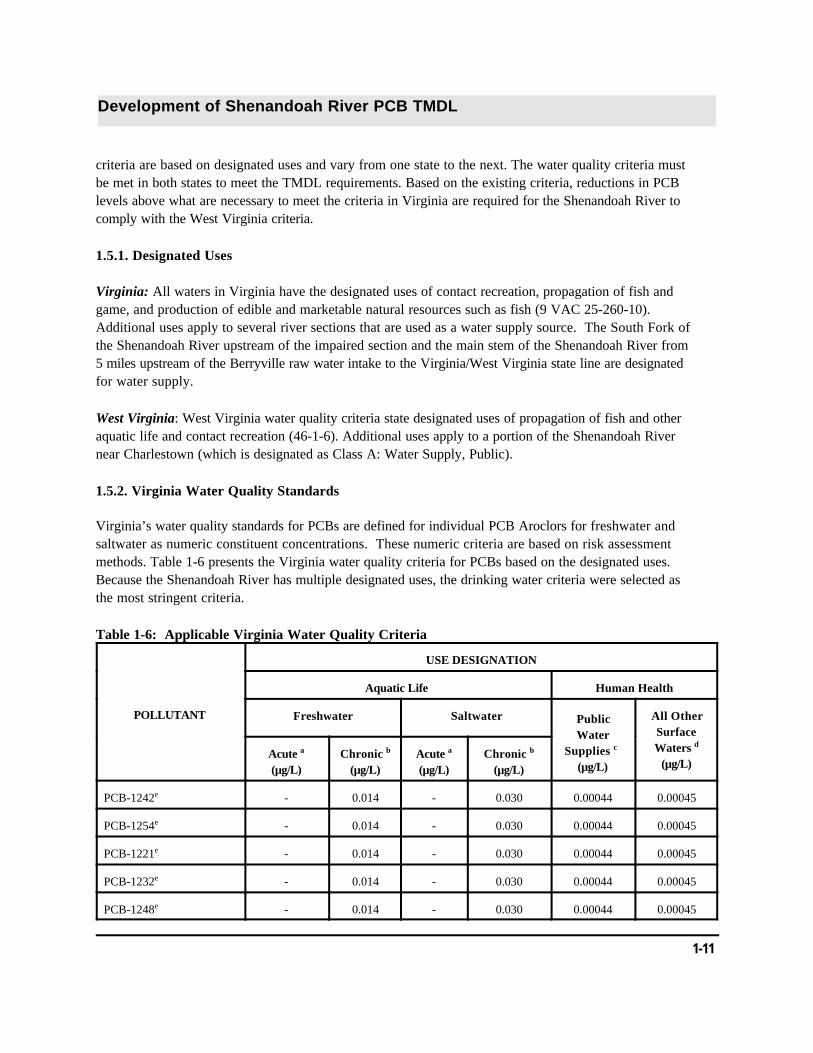
Virginia’s water quality standards for PCBs are defined for individual PCB Aroclors for freshwater andsaltwater as numeric constituent concentrations. These numeric criteria are based on risk assessmentmethods. Table 1-6 presents the Virginia water quality criteria for PCBs based on the designated uses.Because the Shenandoah River has multiple designated uses, the drinking water criteria were selected asthe most stringent criteria.
Table 1-6: Applicable Virginia Water Quality Criteria
POLLUTANT
USE DESIGNATION
Aquatic Life Human Health
Freshwater Saltwater PublicWater
Supplies c (µg/L)
All OtherSurfaceWaters d
(µg/L)Acute a
(µg/L)Chronic b
(µg/L)Acute a
(µg/L)Chronic b
(µg/L)
PCB-1242e - 0.014 - 0.030 0.00044 0.00045
PCB-1254e - 0.014 - 0.030 0.00044 0.00045
PCB-1221e - 0.014 - 0.030 0.00044 0.00045
PCB-1232e - 0.014 - 0.030 0.00044 0.00045
PCB-1248e - 0.014 - 0.030 0.00044 0.00045

Development of Shenandoah River PCB TMDL
1-12
PCB-1260e - 0.014 - 0.030 0.00044 0.00045
PCB-1016e - 0.014 - 0.030 0.00044 0.00045a One hour average concentration not to be exceeded more than once every 3 years on the average.b Four-day average concentration not to be exceeded more than once every 3 years on the average.c Not to exceed.d Unless otherwise noted, these criteria have been calculated to protect human health from toxic effects through fishconsumption.e Known as suspected carcinogen. Human health standards are for a risk level of 10-5. Source: Virginia State Water Control Board, 1997.
1.5.3. West Virginia Water Quality Standards
West Virginia’s Requirements Governing Water Quality Standards (West Virginia SOS, 2000) defineswater quality criteria for surface waters as a numeric constituent concentration or a narrative statementrepresenting a quality of water that supports a designated use or uses of the waterbody. Total PCBs aregiven numeric criteria under the aquatic life and the human health designation categories based on riskassessment methods (Table 1-7).
Table 1-7: Applicable West Virginia Water Quality Criteria
POLLUTANT
USE DESIGNATION
Aquatic Life Human HealthAll
OtherUses
B1, B4 B2C c A d
Acutea Chronicb Acutea Chronicb
PCBe, Total (ng/L) - 14.0 - 14.0 0.045 0.044 0.045a One hour average concentration not to be exceeded more than once every 3 years on the average.b Four-day average concentration not to be exceeded more than once every 3 years on the average.c Unless otherwise noted, these criteria have been calculated to protect human health from toxic effects through fishconsumption.d Unless otherwise noted, these criteria have been calculated to protect human health from toxic effects throughdrinking water and fish consumption.e Known or suspected carcinogen. Human health standards are for a risk level of 10-6. Source: West Virginia SOS, 2000; B1 = warm water fishery streams, B4 = wetlands, B2 = trout waters, A = watersupply, public
1.5.4. Interpreting State Water Quality Standards and FDA Criteria
There are both fish tissue and water column criteria for PCBs. FDA advisory criteria are based solely onfish tissue concentrations whereas state criteria are based on water column and fish tissue concentrations.No sediment criteria have been identified.
Development of Shenandoah River PCB TMDL
1-13
Both Virginia’s and West Virginia’s water column standards are based on risk assessment methods. Virginia’s standard uses a 1:105 risk versus the 1:106 risk used by West Virginia. The West Virginiastandard for Total PCBs is 0.044 ng/L, and the Virginia water column criterion for each PCB Arochlor is0.44 ng/L.
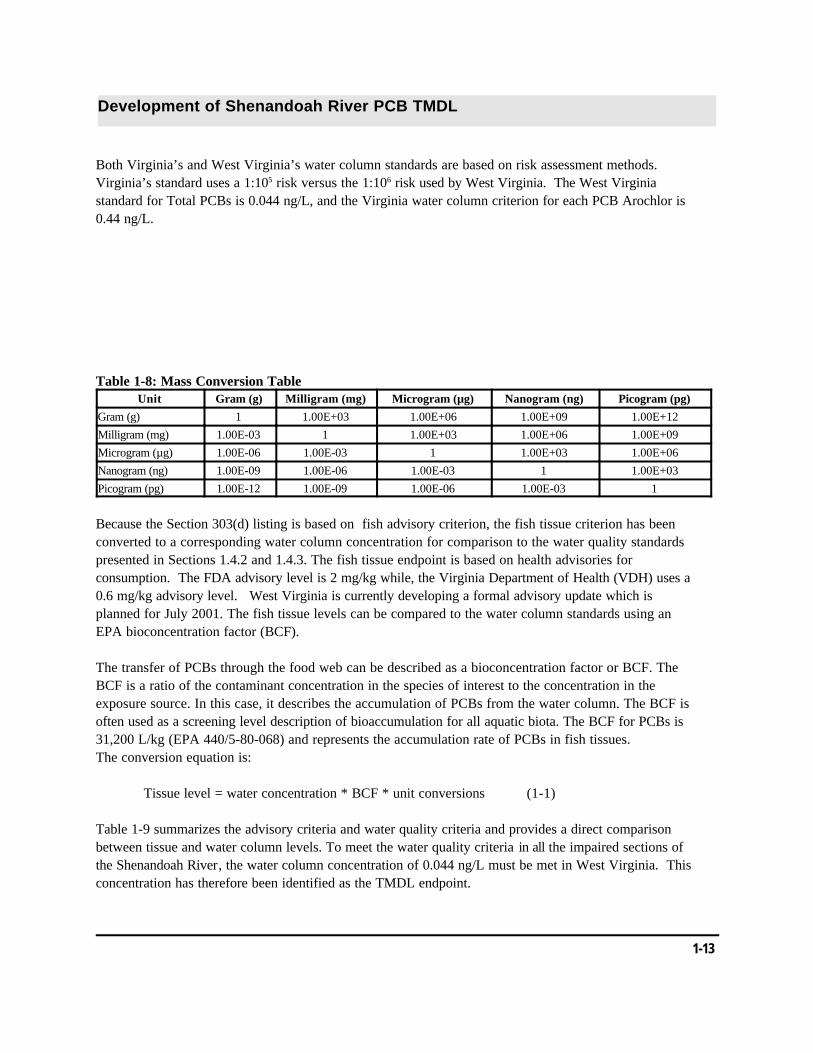
Table 1-8: Mass Conversion TableUnit Gram (g) Milligram (mg) Microgram (µg) Nanogram (ng) Picogram (pg)
Gram (g) 1 1.00E+03 1.00E+06 1.00E+09 1.00E+12
Milligram (mg) 1.00E-03 1 1.00E+03 1.00E+06 1.00E+09
Microgram (µg) 1.00E-06 1.00E-03 1 1.00E+03 1.00E+06
Nanogram (ng) 1.00E-09 1.00E-06 1.00E-03 1 1.00E+03
Picogram (pg) 1.00E-12 1.00E-09 1.00E-06 1.00E-03 1
Because the Section 303(d) listing is based on fish advisory criterion, the fish tissue criterion has beenconverted to a corresponding water column concentration for comparison to the water quality standardspresented in Sections 1.4.2 and 1.4.3. The fish tissue endpoint is based on health advisories forconsumption. The FDA advisory level is 2 mg/kg while, the Virginia Department of Health (VDH) uses a0.6 mg/kg advisory level. West Virginia is currently developing a formal advisory update which isplanned for July 2001. The fish tissue levels can be compared to the water column standards using anEPA bioconcentration factor (BCF).
The transfer of PCBs through the food web can be described as a bioconcentration factor or BCF. TheBCF is a ratio of the contaminant concentration in the species of interest to the concentration in theexposure source. In this case, it describes the accumulation of PCBs from the water column. The BCF isoften used as a screening level description of bioaccumulation for all aquatic biota. The BCF for PCBs is31,200 L/kg (EPA 440/5-80-068) and represents the accumulation rate of PCBs in fish tissues.The conversion equation is:
Tissue level = water concentration * BCF * unit conversions (1-1)
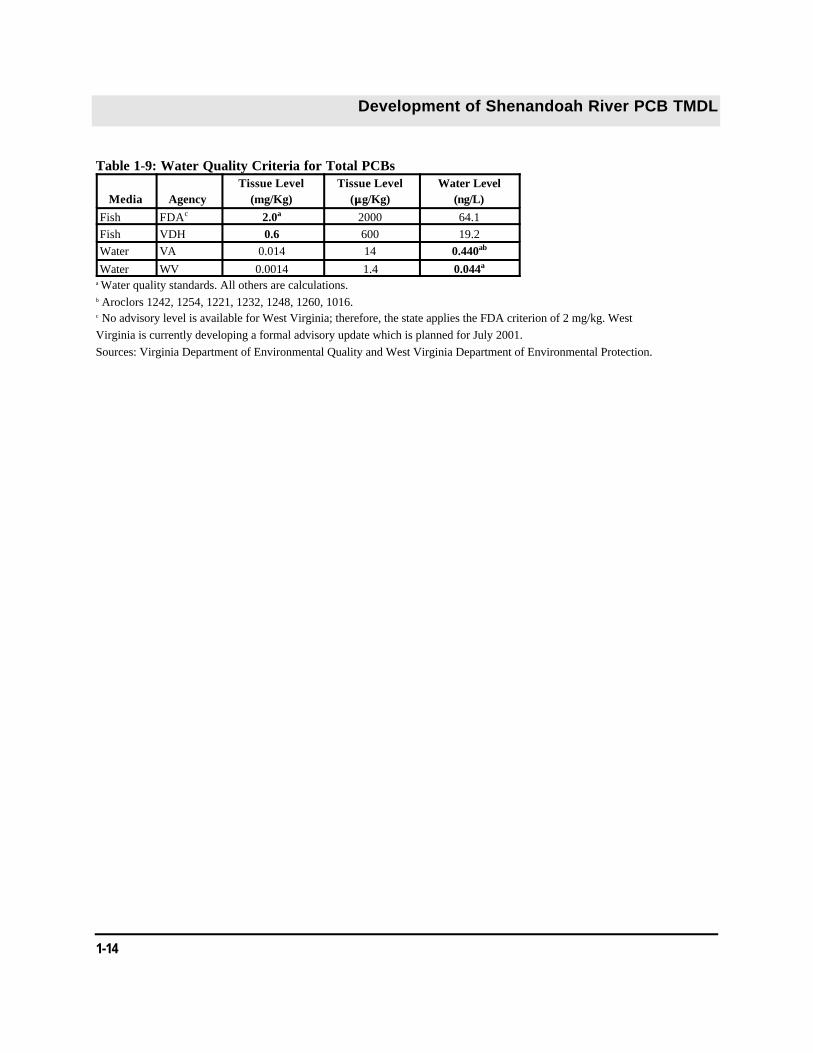
Table 1-9 summarizes the advisory criteria and water quality criteria and provides a direct comparisonbetween tissue and water column levels. To meet the water quality criteria in all the impaired sections ofthe Shenandoah River, the water column concentration of 0.044 ng/L must be met in West Virginia. Thisconcentration has therefore been identified as the TMDL endpoint.
Development of Shenandoah River PCB TMDL
1-14
Table 1-9: Water Quality Criteria for Total PCBs
Media AgencyTissue Level
(mg/Kg)Tissue Level
(::g/Kg)Water Level
(ng/L)
Fish FDAc 2.0a 2000 64.1Fish VDH 0.6 600 19.2Water VA 0.014 14 0.440ab
Water WV 0.0014 1.4 0.044a
a Water quality standards. All others are calculations.b Aroclors 1242, 1254, 1221, 1232, 1248, 1260, 1016.c No advisory level is available for West Virginia; therefore, the state applies the FDA criterion of 2 mg/kg. WestVirginia is currently developing a formal advisory update which is planned for July 2001. Sources: Virginia Department of Environmental Quality and West Virginia Department of Environmental Protection.

Development of Shenandoah River PCB TMDL
2-1
Section 2: Data Assessment
This section identifies and examines available data to characterize the Shenandoah River and itswatershed. A wide range of data and information was used in the development of the Shenandoah PCBTMDL. The categories of data used include physiographic data that describe the physical conditions ofthe watershed, environmental monitoring data that identify potential pollutant sources and theircontribution, and in-stream water quality monitoring data.
Table 2-1: Inventory of Data and Information for the Shenandoah River Watershed
Data Category Description Data Source(s)
WatershedPhysiographicData
Land Use (MRLCa, GAPb) WVDEP, VADEQ
Stream Reach Coverage (RF1, RF3) U.S. EPA BASINS
Weather Information National Climatic Data Center
EnvironmentalMonitoring Data
NPDES Data WVDEP, VADEQ
Discharge Monitoring Report Data WVDEP, VADEQ
303(d) Listed Waters WVDEP, VADEQ
Water Quality Monitoring Data EPA STORET, Superfund,VASWCB, USGS, WVDEP
a Multi-resolution Land Characteristics (MRLC) land use developed by consortium of EPA, USGS, Dept of Interior and NOAAb Gap Analysis Program (GAP) land use developed by USGS Biological Resources for assessing regional conservation status of vertebrate species and land cover types.
2.1. Stream Flow Data
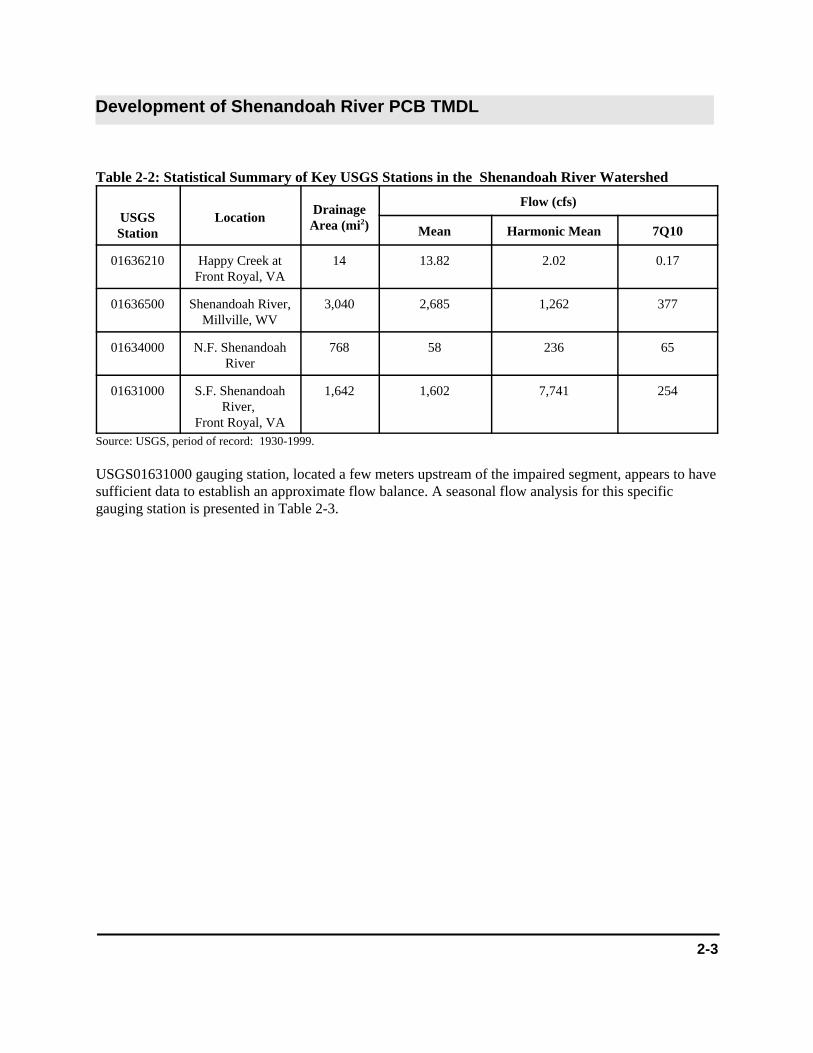
A search of the USGS Web Site for historical daily flows for the Shenandoah River found 34 stationswith flows. Long-term daily flows for the Shenandoah River are available from October 1930 throughSeptember 1999 at several gauging stations including USGS01631000 (Table 2-2), which is locatedupstream of the impaired segments. An additional 23 stations with peak flow data were found. AppendixA-1 contains a list of all the USGS stations in the watershed. Figure 2-1 shows the gauging stations.

Development of Shenandoah River PCB TMDL
2-2
Figure 2-1: Water Quality Monitoring and Flow Gauge Stations
Development of Shenandoah River PCB TMDL
2-3
Table 2-2: Statistical Summary of Key USGS Stations in the Shenandoah River Watershed
USGSStation
LocationDrainage
Area (mi2)
Flow (cfs)
Mean Harmonic Mean 7Q10
01636210 Happy Creek atFront Royal, VA
14 13.82 2.02 0.17
01636500 Shenandoah River,Millville, WV
3,040 2,685 1,262 377
01634000 N.F. ShenandoahRiver
768 58 236 65
01631000 S.F. ShenandoahRiver,
Front Royal, VA
1,642 1,602 7,741 254
Source: USGS, period of record: 1930-1999.
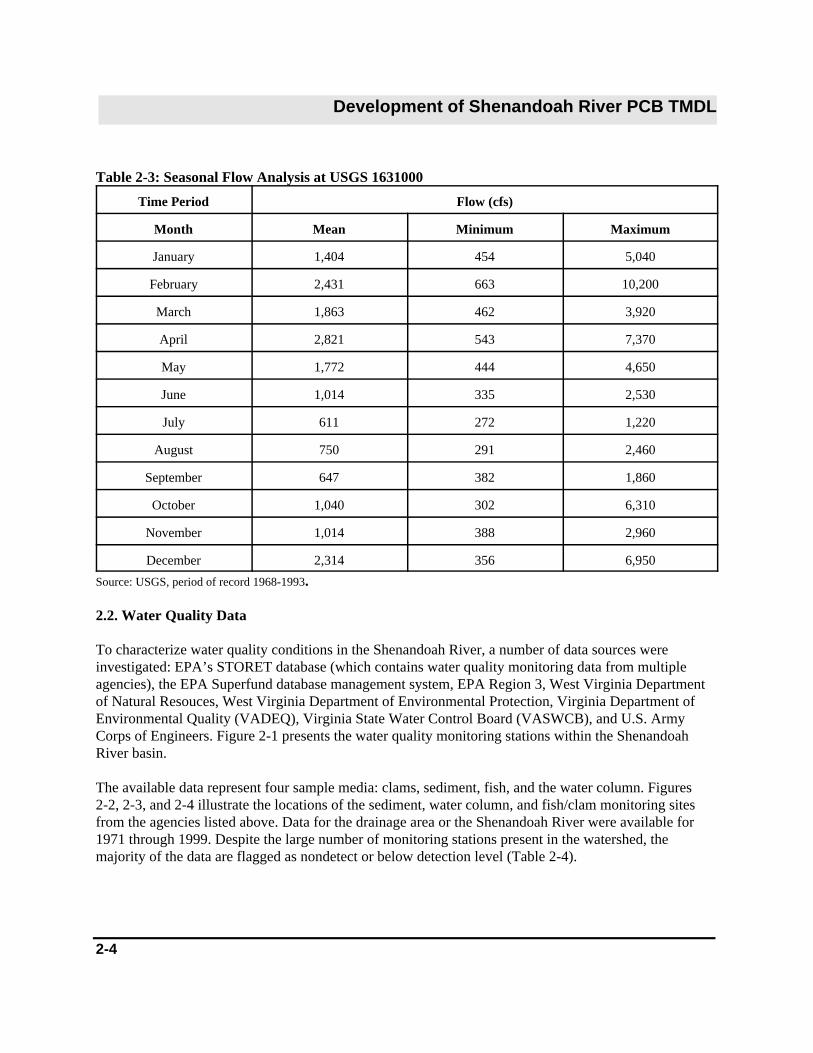
USGS01631000 gauging station, located a few meters upstream of the impaired segment, appears to havesufficient data to establish an approximate flow balance. A seasonal flow analysis for this specificgauging station is presented in Table 2-3.
Development of Shenandoah River PCB TMDL
2-4
Table 2-3: Seasonal Flow Analysis at USGS 1631000
Time Period Flow (cfs)
Month Mean Minimum Maximum
January 1,404 454 5,040
February 2,431 663 10,200
March 1,863 462 3,920
April 2,821 543 7,370
May 1,772 444 4,650
June 1,014 335 2,530
July 611 272 1,220
August 750 291 2,460
September 647 382 1,860
October 1,040 302 6,310
November 1,014 388 2,960
December 2,314 356 6,950
Source: USGS, period of record 1968-1993.
2.2. Water Quality Data
To characterize water quality conditions in the Shenandoah River, a number of data sources wereinvestigated: EPA’s STORET database (which contains water quality monitoring data from multipleagencies), the EPA Superfund database management system, EPA Region 3, West Virginia Departmentof Natural Resouces, West Virginia Department of Environmental Protection, Virginia Department ofEnvironmental Quality (VADEQ), Virginia State Water Control Board (VASWCB), and U.S. ArmyCorps of Engineers. Figure 2-1 presents the water quality monitoring stations within the ShenandoahRiver basin.
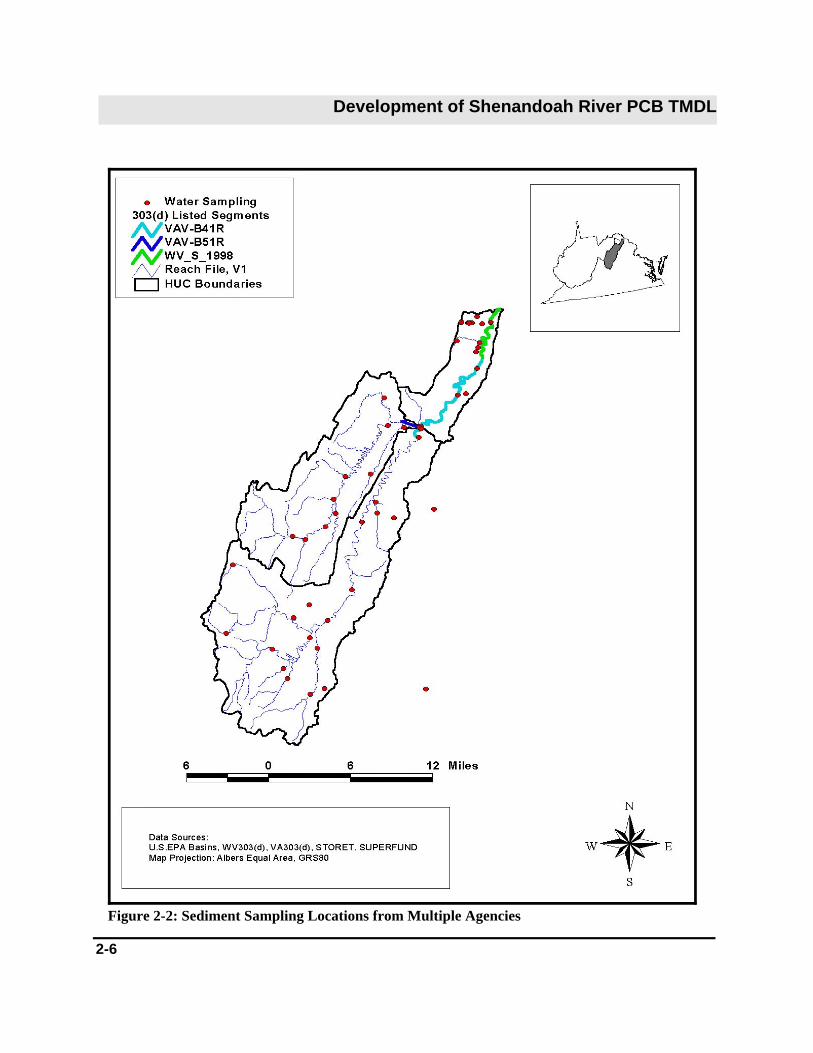
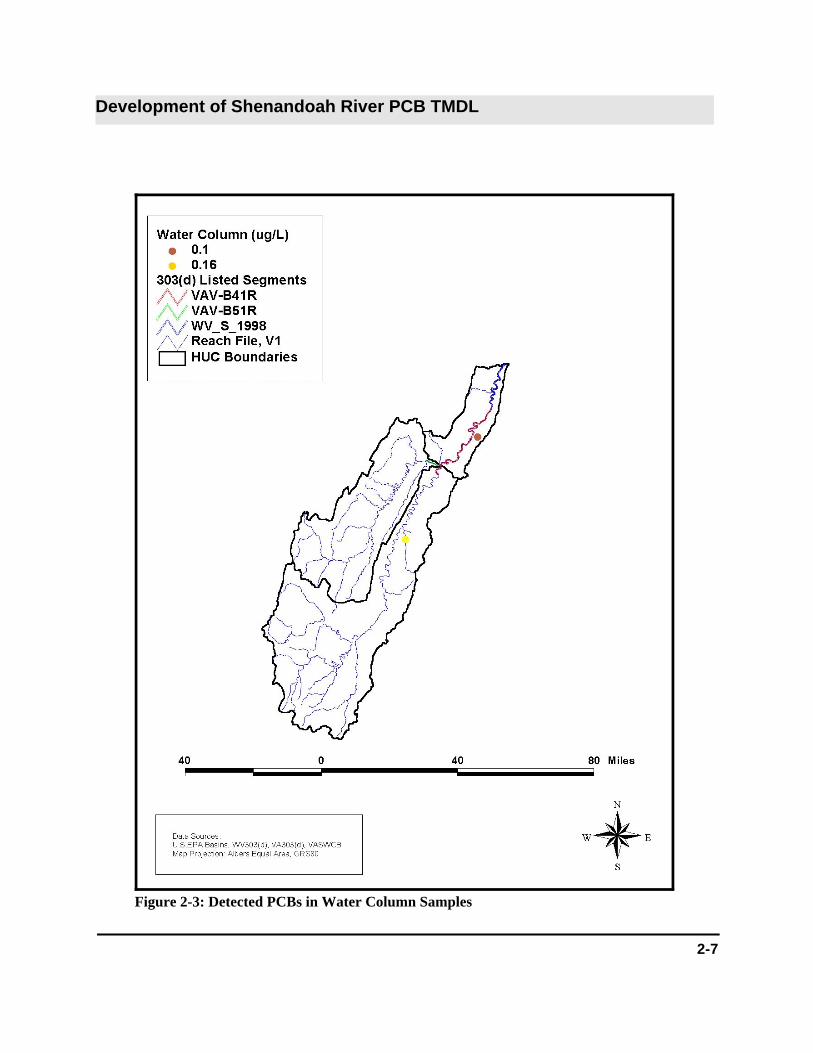
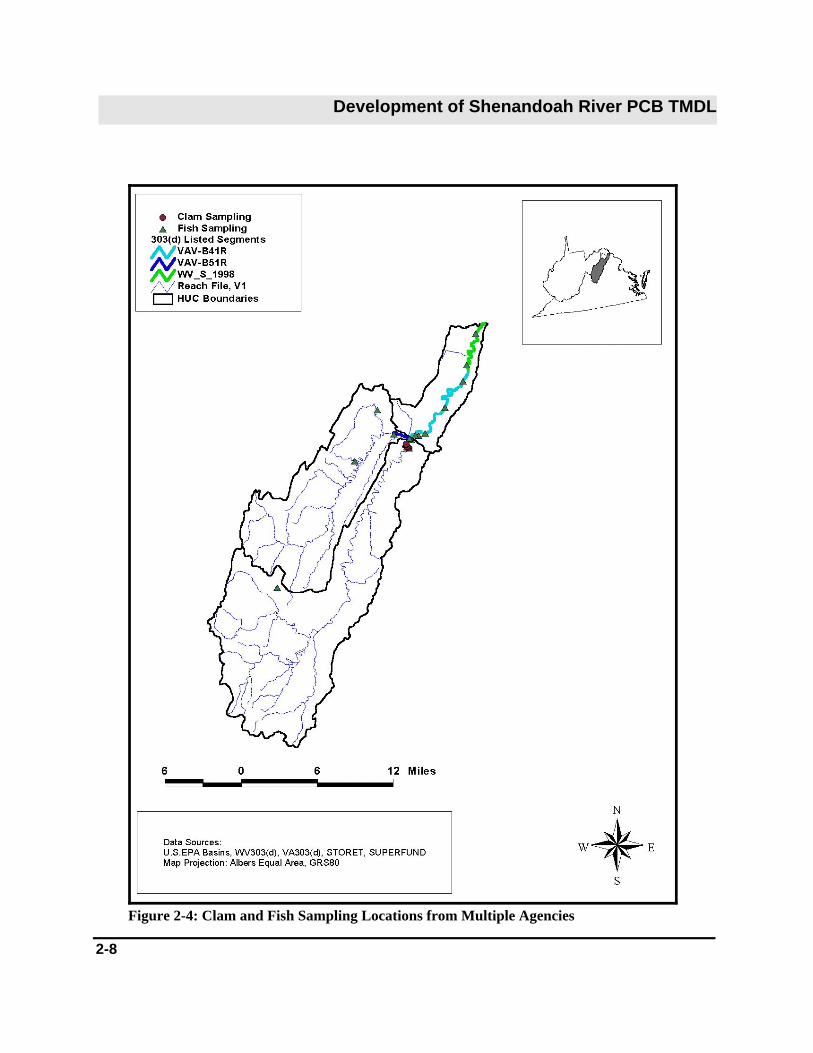
The available data represent four sample media: clams, sediment, fish, and the water column. Figures 2-2, 2-3, and 2-4 illustrate the locations of the sediment, water column, and fish/clam monitoring sitesfrom the agencies listed above. Data for the drainage area or the Shenandoah River were available for1971 through 1999. Despite the large number of monitoring stations present in the watershed, themajority of the data are flagged as nondetect or below detection level (Table 2-4).

Development of Shenandoah River PCB TMDL
2-5
Table 2-4: In-stream Water Quality Overview
Sample Type No.Samples
below detection limit(%)
above detection limit(%)
Detection Limit
Water 160 99 1 0.02-0.1 Fg/L
Sediment 490 97 3 1-1000 Fg/L
Fish Tissue 889 64 36 0.1-4.89 mg/Kg
2.2.1. Water Column Data
Ninety-nine percent of water column samples are nondetects or below detection levels. The laboratorydetection limits were higher than both the West Virginia total PCB water quality criterion of 0.044 ng/Land the Virginia Aroclor water quality criterion of 0.44 ng/L. Therefore, the data may not have recordedviolations of the water quality criteria.
Available data for samples above detection levels are very sparse, both spatially and temporally (Table 2-5, Figure 2-5). Appendix A-2 contains a detailed summary of available data, showing the spatial andtemporal variability, and is presented in by source and media.
Table 2-5: Detectable Water Column Data
Station Location Date Total PCBs(FFg/L)
Total PCBs(ng/L)
1BHKS006.23 Route 675 Bridge in Luray 06/06/1971 0.16 160
1BSHN038.27 Route 50 Bridge 05/02/1971 0.10 100Note: Aroclor Water Quality Criteria 0.44ng/L.Source: Virginia State Water Control Board.
The level of detectable PCBs in the water column are roughly 230 times greater than the Virginia Aroclorcriterion of 0.44 ng/L. No water column samples with detectable PCB level were found in the WestVirginia sites.
Development of Shenandoah River PCB TMDL
2-6
Figure 2-2: Sediment Sampling Locations from Multiple Agencies
Development of Shenandoah River PCB TMDL
2-7
Figure 2-3: Detected PCBs in Water Column Samples
Development of Shenandoah River PCB TMDL
2-8
Figure 2-4: Clam and Fish Sampling Locations from Multiple Agencies
Development of Shenandoah River PCB TMDL
2-9
0.01
0.1
1
10
100
1000
Dec-78 Dec-80 Dec-82 Dec-84 Dec-86 Dec-88 Dec-90 Dec-92 Dec-94 Dec-96 Dec-98 Dec-00
To
tal P
CB
s (m
g/K
g)
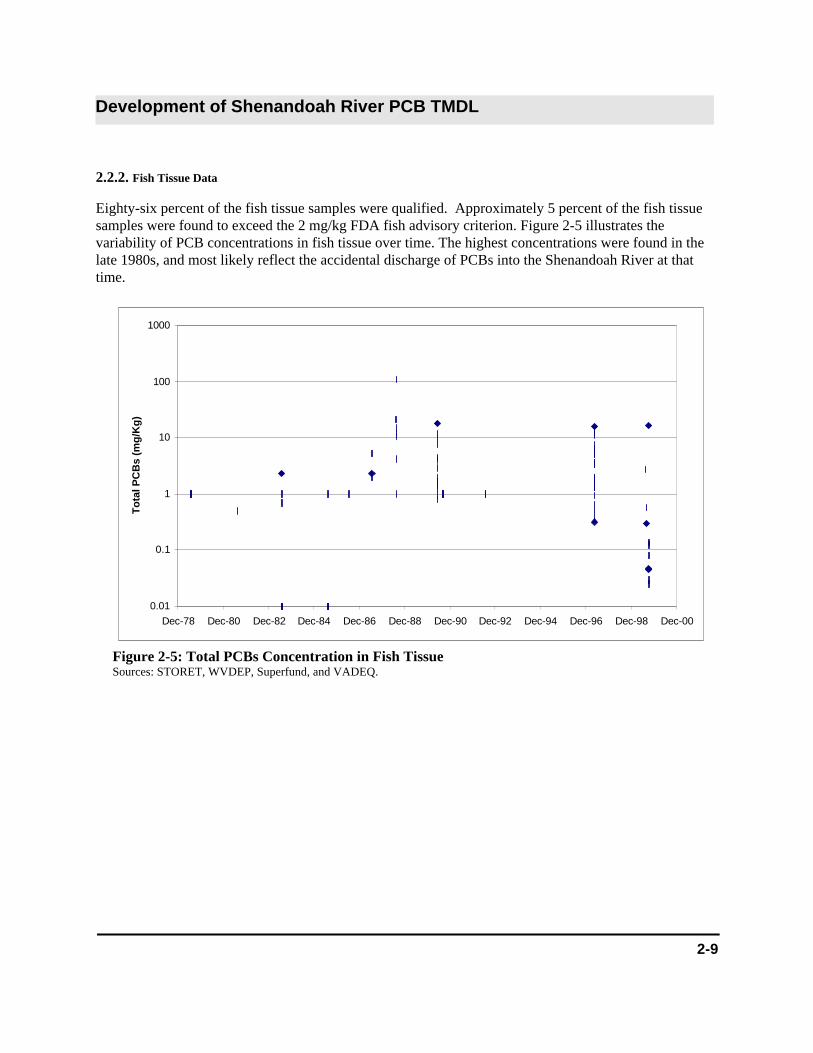
Figure 2-5: Total PCBs Concentration in Fish TissueSources: STORET, WVDEP, Superfund, and VADEQ.
2.2.2. Fish Tissue Data
Eighty-six percent of the fish tissue samples were qualified. Approximately 5 percent of the fish tissuesamples were found to exceed the 2 mg/kg FDA fish advisory criterion. Figure 2-5 illustrates thevariability of PCB concentrations in fish tissue over time. The highest concentrations were found in thelate 1980s, and most likely reflect the accidental discharge of PCBs into the Shenandoah River at thattime.
Development of Shenandoah River PCB TMDL
2-10
0
200
400
600
800
1000
1200
Jan-89 Jan-90 Jan-91 Jan-92 Dec-92 Dec-93 Dec-94 Dec-95 Dec-96 Dec-97
To
tal P
CB
s (u
g/K
g)
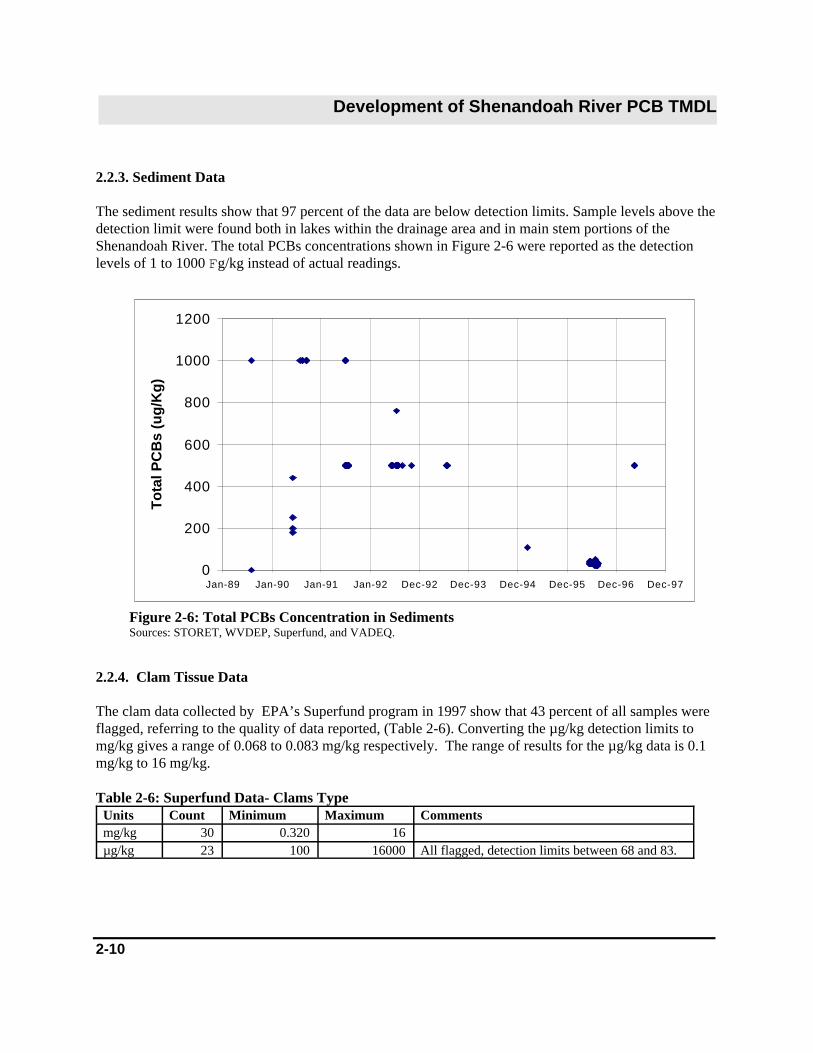
Figure 2-6: Total PCBs Concentration in SedimentsSources: STORET, WVDEP, Superfund, and VADEQ.
2.2.3. Sediment Data
The sediment results show that 97 percent of the data are below detection limits. Sample levels above thedetection limit were found both in lakes within the drainage area and in main stem portions of theShenandoah River. The total PCBs concentrations shown in Figure 2-6 were reported as the detectionlevels of 1 to 1000 Fg/kg instead of actual readings.
2.2.4. Clam Tissue Data
The clam data collected by EPA’s Superfund program in 1997 show that 43 percent of all samples wereflagged, referring to the quality of data reported, (Table 2-6). Converting the µg/kg detection limits tomg/kg gives a range of 0.068 to 0.083 mg/kg respectively. The range of results for the µg/kg data is 0.1mg/kg to 16 mg/kg.
Table 2-6: Superfund Data- Clams TypeUnits Count Minimum Maximum Commentsmg/kg 30 0.320 16µg/kg 23 100 16000 All flagged, detection limits between 68 and 83.
Development of Shenandoah River PCB TMDL
2-11
As discussed earlier, most of the monitoring data were reported as nondetects because of the detectionlimits. Because there were so few actual readings, particularly in the water column, an additionalsampling event took place in April 2001 to better quantify source contributions and the variability ofPCBs throughout different media in the Shenandoah River watershed. The goal of this effort wasto collect more samples using a lower detection level with a more complex analytical method.Multimedia samples (clams, water, and sediments) were collected at several locations within theShenandoah River. Section 4 provides more detail regarding the sampling event and the additional PCBdata.
Development of Shenandoah River PCB TMDL
3-1
Section 3: Source Assessment
This section identifies and examines the potential nonpoint and point sources of PCBs in the Shenandoah Riverwatershed. A wide range of information was accessed to identify potential PCB sources and to characterizecontributions, including monitoring data, Resource Conservation and Recovery Act (RCRA) database,Comprehensive Environmental Response, Compensation, and Liability Act (CERCLA) database, ToxicSubstance Control Act (TSCA) database, and Permit Compliance System database. This section is presented in two subsections - nonpoint source analysis and point sources analysis.
Polychlorinated biphenyls are synthetic compounds that are primarily found in electrical transformers. In1976 manufacturing of PCBs was prohibited and strict tracking was instituted (GE, 1999). Although it isnow illegal to manufacture, distribute, or use PCBs, these synthetic oils were used for many years asinsulating fluids in electrical transformers and in other products such as cutting oils (GE, 1999). Historically,PCBs have been introduced into the environment through discharges from point sources and through spillsand releases. Although point source contributions are now controlled, historical nonpoint sources may exist;for example, refuse sites and abandoned facilities.
Once in a waterbody, PCBs become associated with solid particles and typically enter sediments (WisconsinDNR, 1997). PCBs are very resistant to breakdown and thus remain in river and lake sediments for manyyears.
3.1. Nonpoint Source Analysis
Nonpoint source loading of pollutants results from the transport of pollutants into receiving waters vialandscape runoff processes, including overland and subsurface flow. Nonpoint sources of PCBs can begrouped most appropriately into nonpoint source media: washoff from land surfaces, and streambedsediments.
3.1.1. Washoff from Land surfaces
There are no natural sources of PCBs; however, PCBs can be found in many environments as a result offires, historical spills, and airborne transportation of contaminated dust (atmospheric deposition). Usually,these PCB concentrations are well below EPA’s action level of 1 ppm in soils.
Because PCBs are generally found in cooling oils, the affinity of PCBs for water is very low (USGS, 1995). PCBs have a high sorption factor for solids and fatty animal tissue. In the case of a fire, for example, PCBscan sorb onto smoke and ash particles and be scattered by the wind. PCBs from spills tend to remain in thearea adjacent to the spill by sorbing to soil particles. These contaminated soils can then be transportedthrough precipitation and overland flow to stream systems. This report incorporates the PCB concentrationfrom surface lands into the streambed sediments concentration. Additional sampling in the Shenandoah Rivermight help identify additional nonpoint sources.
Based on the sampling data, it appears as though the Warren County Landfill on Catlet Mountain Road inFront Royal, Virginia may be a source of PCBs to the Shenandoah River. The sampling data will beforwarded to EPA’s Hazardous Site Cleanup Division, the Town of Front Royal, and Warren County forfurther assessment. EPA has requested records from both the County and Township on the closure of thisfacility.

Development of Shenandoah River PCB TMDL
3-2
3.1.2. Streambed Sediments
When PCBs spill and sorb onto the soil, there is a potential for stream contamination when precipitation washes the contaminated soil into the stream. The affinity of PCBs for soil would limit the effectiveness ofgroundwater seepage as a mode of transport. Discharges of PCBs directly into the stream can also result insediment and stream bank contamination. The PCBs in discharges sorb onto the soils on the stream banksand onto the sediments downstream of the discharge point. Stream bank erosion deposits the contaminatedsoils in the streambed.
Contaminated streambed sediments are available for consumption by the aquatic biota (through dissolvedparticles or resuspended particles), are transported downstream, or are buried under additional sediments. The transport can result in the sediment being flushed out of the system or being trapped behind downstreamdams. Existing PCB projects such as the Hudson River project in New York and the Housatonic River projectin Massachusetts have found that historical discharges have resulted in sediment contamination and that thecontaminated soils tend to collect in slow river stretches or reservoirs (GE, 1999). The contaminated soilsremain there until they are dredged or dislodged by storms. Figure 3-1 illustrates the interaction among PCBs,sediments, and the water column.

Development of Shenandoah River PCB TMDL
4-1
Section 4: Supplemental PCB Sampling in Shenandoah River
The existing PCB data for the Shenandoah River documented conditions at or near Avtex Fibers, Inc.Most of the existing data, based on Aroclor analyses, failed to indicate the detection of PCBs in eithersediment or surface water. Additional sampling data were therefore warranted, to gain a betterunderstanding of the pollutant loading to the stream.
A sampling event was conducted from April 26 through April 29, 2001, to support a more in-depthassessment of the spatial variation of PCBs in the Shenandoah watershed and to identify additionalpotential sources. The objectives of the additional sampling were as follows:
1. Determine the magnitude and extent of PCB contamination in the Shenandoah River.2. Identify current hot spots and potential sources of the PCB impairment in the Shenandoah River.3. Investigate historical point sources of PCBs (Avtex Fibers, Inc.).4. Develop water/fish and water/sediment ratios, because historical readings were above detection. 5. Identify correlations between the water column, sediments, and biota data. In most cases where
multi-media samples were collected, detection limits for one or more media resulted in levels belowthe detection limit. By collecting simultaneous samples of the various media, PCB concentrationratios can be determined for water versus fish, water versus sediment, and fish versus sedimentconcentrations.
The sampling stations listed in Table 4-1 were selected based on the 1997 Superfund sampling locations,STORET stations, and recommendations made through the public participation process. In addition tospatial comparison, the 12 sites presented in Figure 4-1 permit temporal comparison to existing data. Thesampling sites cover the South Fork of the Shenandoah River below the former Avtex facility to the mainstem of the Shenandoah River below the Potomac Edison dam near Warren, with one sample from theNorth Fork of the Shenandoah River upstream of its mouth, a sample from Happy Creek just upstream ofits mouth, a sample from Dog Run just upstream of its mouth, and one sample from the impoundment nearMillville Dam (West Virginia). To obtain the lower detection limits needed for this study, EPA Method1668A, which analyzes all 209 PCB congeners, was used.
Refer to Appendix D- for detailed information about the Quality Assurance Project Plan (QAPP) for theShenandoah River PCB TMDL sampling event. The QAPP provides general descriptions of the workperformed to collect and analyze the samples, health and safety considerations, standard operatingprocedures, laboratory qualifications, and data validation requirements.
Development of Shenandoah River PCB TMDL
4-2
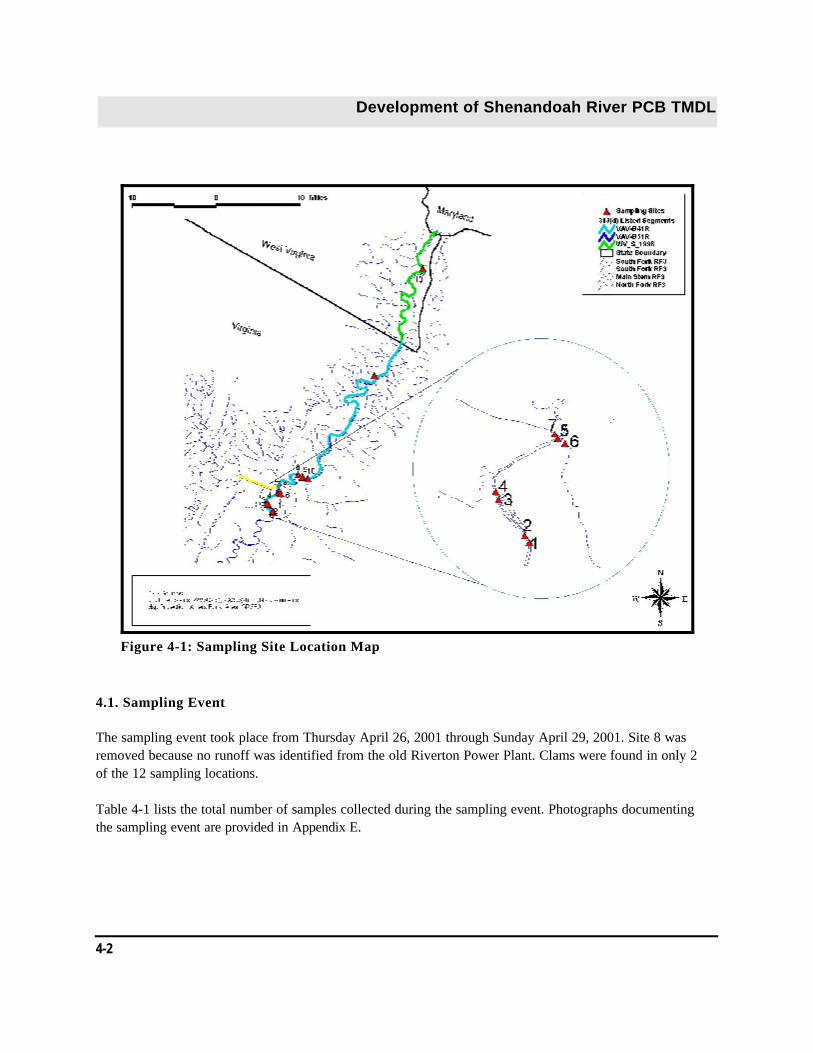
Figure 4-1: Sampling Site Location Map
4.1. Sampling Event
The sampling event took place from Thursday April 26, 2001 through Sunday April 29, 2001. Site 8 wasremoved because no runoff was identified from the old Riverton Power Plant. Clams were found in only 2of the 12 sampling locations.
Table 4-1 lists the total number of samples collected during the sampling event. Photographs documentingthe sampling event are provided in Appendix E.
Development of Shenandoah River PCB TMDL
4-3
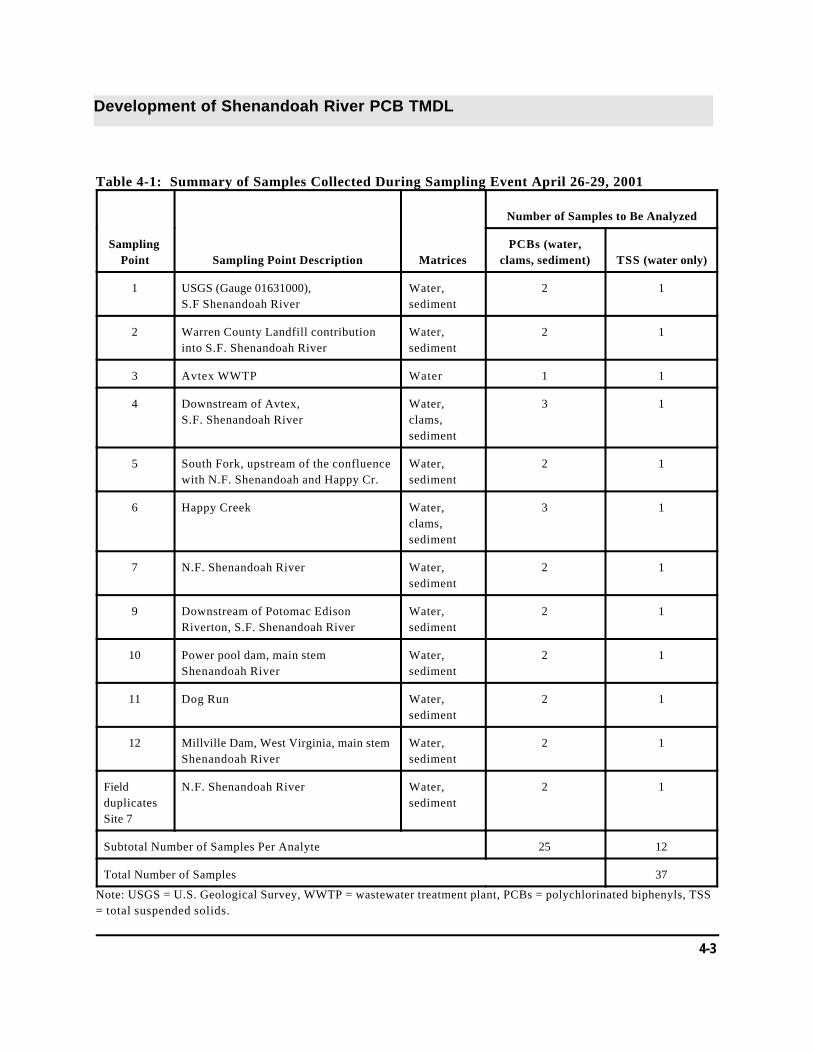
Table 4-1: Summary of Samples Collected During Sampling Event April 26-29, 2001
SamplingPoint Sampling Point Description Matrices
Number of Samples to Be Analyzed
PCBs (water,clams, sediment) TSS (water only)
1 USGS (Gauge 01631000), S.F Shenandoah River
Water, sediment
2 1
2 Warren County Landfill contributioninto S.F. Shenandoah River
Water,sediment
2 1
3 Avtex WWTP Water 1 1
4 Downstream of Avtex, S.F. Shenandoah River
Water,clams,sediment
3 1
5 South Fork, upstream of the confluencewith N.F. Shenandoah and Happy Cr.
Water, sediment
2 1
6 Happy Creek Water,clams,sediment
3 1
7 N.F. Shenandoah River Water, sediment
2 1
9 Downstream of Potomac EdisonRiverton, S.F. Shenandoah River
Water, sediment
2 1
10 Power pool dam, main stemShenandoah River
Water, sediment
2 1
11 Dog Run Water, sediment
2 1
12 Millville Dam, West Virginia, main stemShenandoah River
Water, sediment
2 1
FieldduplicatesSite 7
N.F. Shenandoah River Water, sediment
2 1
Subtotal Number of Samples Per Analyte 25 12
Total Number of Samples 37
Note: USGS = U.S. Geological Survey, WWTP = wastewater treatment plant, PCBs = polychlorinated biphenyls, TSS= total suspended solids.
Development of Shenandoah River PCB TMDL
4-4
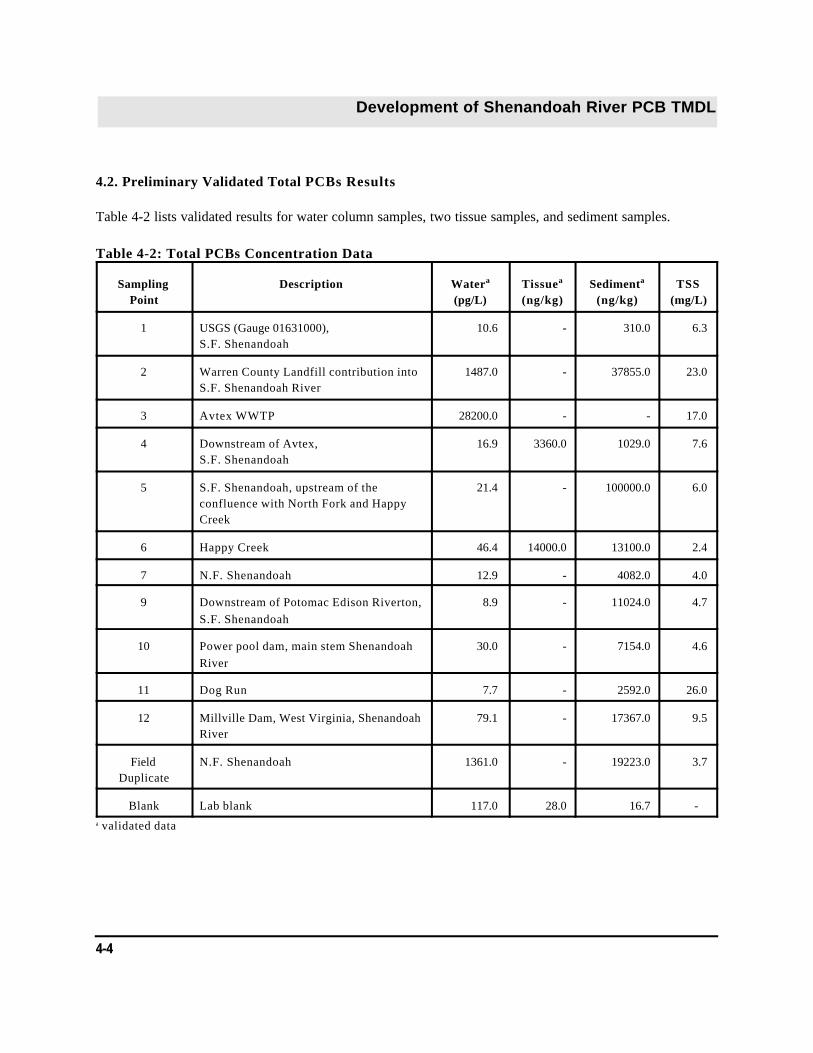
4.2. Preliminary Validated Total PCBs Results
Table 4-2 lists validated results for water column samples, two tissue samples, and sediment samples.
Table 4-2: Total PCBs Concentration Data
SamplingPoint
Description Watera
(pg/L)Tissuea
(ng/kg)Sedimenta
(ng/kg)TSS
(mg/L)
1 USGS (Gauge 01631000), S.F. Shenandoah
10.6 - 310.0 6.3
2 Warren County Landfill contribution intoS.F. Shenandoah River
1487.0 - 37855.0 23.0
3 Avtex WWTP 28200.0 - - 17.0
4 Downstream of Avtex, S.F. Shenandoah
16.9 3360.0 1029.0 7.6
5 S.F. Shenandoah, upstream of theconfluence with North Fork and HappyCreek
21.4 - 100000.0 6.0
6 Happy Creek 46.4 14000.0 13100.0 2.4
7 N.F. Shenandoah 12.9 - 4082.0 4.0
9 Downstream of Potomac Edison Riverton,S.F. Shenandoah
8.9 - 11024.0 4.7
10 Power pool dam, main stem ShenandoahRiver
30.0 - 7154.0 4.6
11 Dog Run 7.7 - 2592.0 26.0
12 Millville Dam, West Virginia, ShenandoahRiver
79.1 - 17367.0 9.5
FieldDuplicate
N.F. Shenandoah 1361.0 - 19223.0 3.7
Blank Lab blank 117.0 28.0 16.7 -a validated data

Development of Shenandoah River PCB TMDL
5-1
Section 5: TMDL Technical Approach
This section of the document outlines the approach used to determine the TMDL for PCBs for theShenandoah River. The approach utilizes available information on the hydrology of the river system, PCBdata from a recent sampling event, and information on the fate and transport of PCBs in a river.
5.1. Source-Response Linkage
5.1.1. Model Development
In order to represent the linkage between source contributions and in-stream response for the ShenandoahRiver, an analytical model was developed. The model was developed to represent a simplified massbalance for the system, i.e. simulate input and transfer of PCBs in the river. A mass balance is aconvenient way of defining what occurs within the Shenandoah River as a function of time.
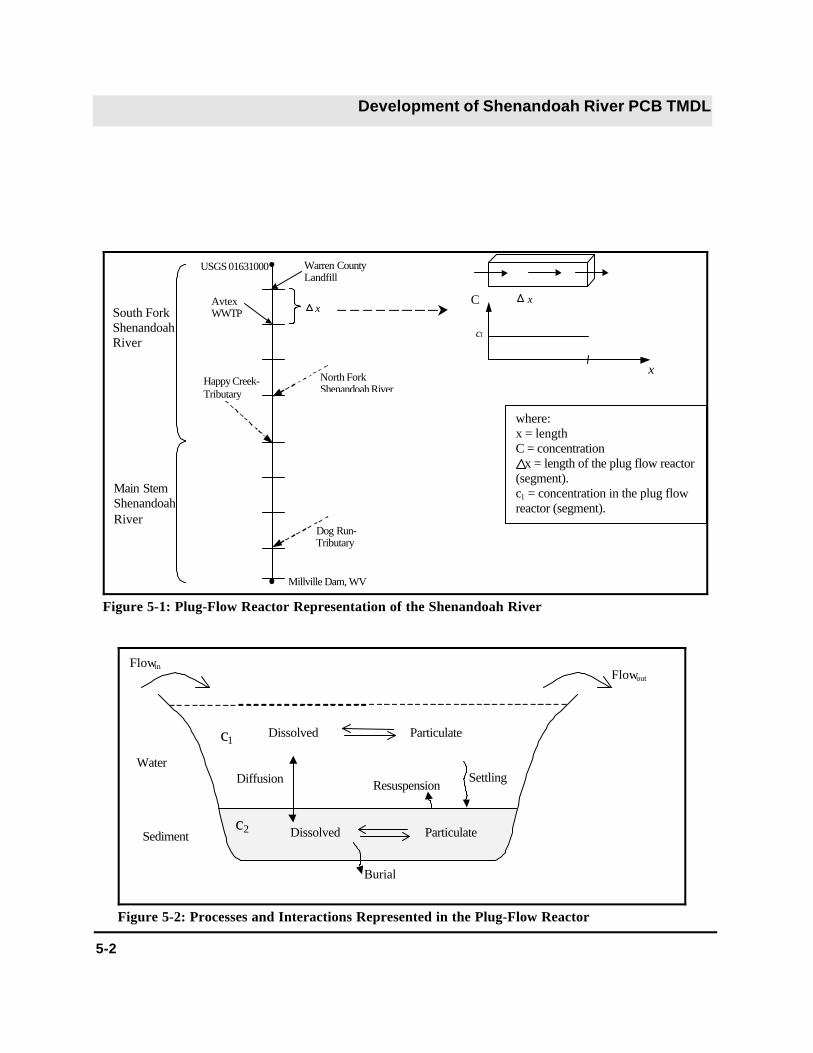
The predictive model constructed represents the Shenandoah River as a series of plug-flow reactors. Thistype of representation is suitable for flowing waters in which advection dominates, such as theShenandoah River. A “plug” of a conservative pollutant, such as PCBs, introduced at one end will remainintact as it passes through the reactor. Pollutants are discharged out of the reactor in the same sequencethat they enter the reactor. The river was segmented into a series of reactors along the length of theimpaired segment (S.F. Shenandoah, N.F. Shenandoah, and Mainstem Shenandoah River), in order tosimulate the distribution of PCBs (Figure 5-1). This was necessary to accurately account for the waterbalance between each segment and the impact of point sources and tributaries on the mainstem of theShenandoah River. The model represents the segmented systems in one dimension (longitudinal) under asteady-state condition. For TMDL development purposes, the steady-state condition represented the“critical condition.” An additional component was added to the plug-flow model to simulate the burial ofPCBs with respect to time in the last segment, located by Millville Dam, WV. This approach allows for abetter representation of the flow and physical properties by Millville Dam, WV.
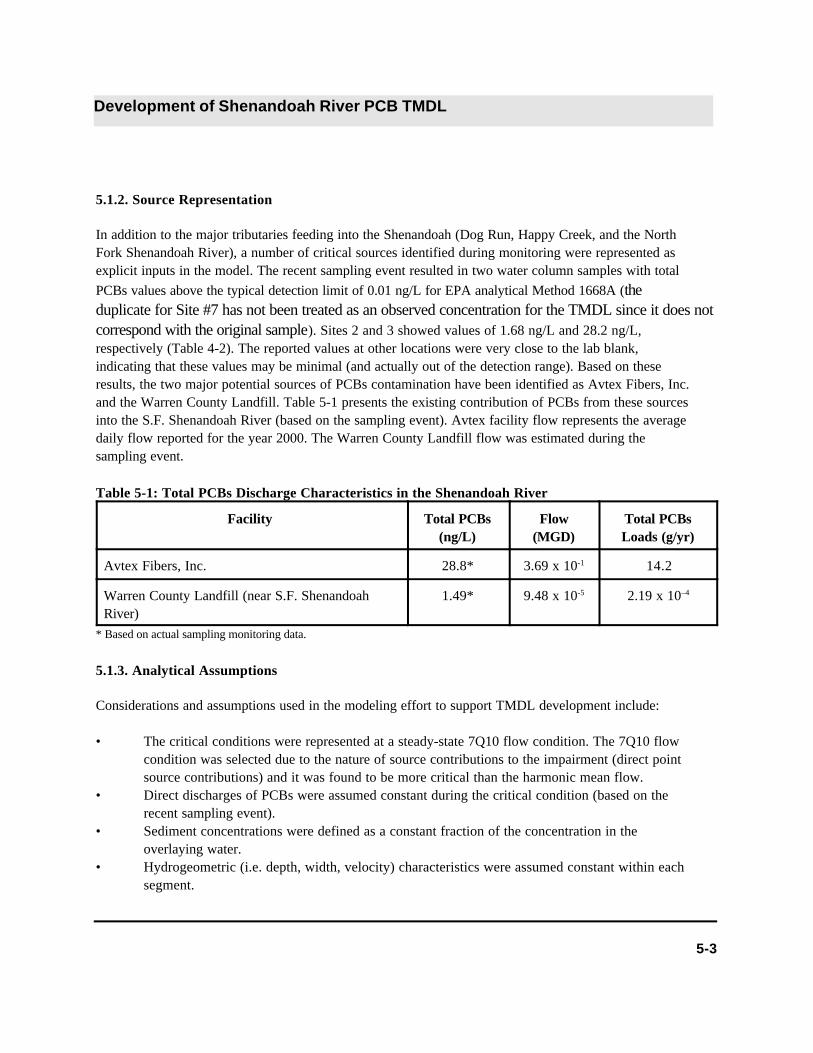
Each of the plug-flow reactors defines a mass balance for PCBs distributed between sediment and water(Figure 5-2). PCBs are partitioned into dissolved and particulate fractions in both the water and sedimentlayers. Mechanisms such as burial and resuspension act on both components, while diffusion actsselectively on the dissolved fraction. PCBs in the water column and sediment layers are computed asconcentration profiles with respect to distance. Using upstream boundary conditions at USGS gaugestation 01631000 and tributaries entering the main-stem of Shenandoah River and known values fordiscrete contributions to the river,the water column concentration of PCBs can be calculated. At eachconfluence where there is a point source or tributary, a mass balance of the load just upstream and theload from the point source or tributary is performed to determine the change in concentration. Thisconcentration is then used as the initial concentration for the next segment. Governing equationrepresenting the plug-flow reactor model are provided in Appendix F.
Development of Shenandoah River PCB TMDL
5-2
Sediment
Water
ParticulateDissolved
Flowout
Settling
ParticulateDissolved
c1
c2
ResuspensionDiffusion
Burial
Flowin
Figure 5-2: Processes and Interactions Represented in the Plug-Flow Reactor
c1
C
x
x
USGS 01631000 Warren CountyLandfill
AvtexWWTP
North ForkShenandoah River
Happy Creek-Tributary
Millville Dam, WV
Dog Run-Tributary
xSouth ForkShenandoahRiver
Main StemShenandoahRiver
where:x = lengthC = concentration x = length of the plug flow reactor(segment).c1 = concentration in the plug flowreactor (segment).
Figure 5-1: Plug-Flow Reactor Representation of the Shenandoah River
Development of Shenandoah River PCB TMDL
5-3
5.1.2. Source Representation
In addition to the major tributaries feeding into the Shenandoah (Dog Run, Happy Creek, and the NorthFork Shenandoah River), a number of critical sources identified during monitoring were represented asexplicit inputs in the model. The recent sampling event resulted in two water column samples with totalPCBs values above the typical detection limit of 0.01 ng/L for EPA analytical Method 1668A (theduplicate for Site #7 has not been treated as an observed concentration for the TMDL since it does notcorrespond with the original sample). Sites 2 and 3 showed values of 1.68 ng/L and 28.2 ng/L,respectively (Table 4-2). The reported values at other locations were very close to the lab blank,indicating that these values may be minimal (and actually out of the detection range). Based on theseresults, the two major potential sources of PCBs contamination have been identified as Avtex Fibers, Inc.and the Warren County Landfill. Table 5-1 presents the existing contribution of PCBs from these sourcesinto the S.F. Shenandoah River (based on the sampling event). Avtex facility flow represents the averagedaily flow reported for the year 2000. The Warren County Landfill flow was estimated during thesampling event.
Table 5-1: Total PCBs Discharge Characteristics in the Shenandoah River
Facility Total PCBs(ng/L)
Flow(MGD)
Total PCBsLoads (g/yr)
Avtex Fibers, Inc. 28.8* 3.69 x 10-1 14.2
Warren County Landfill (near S.F. ShenandoahRiver)
1.49* 9.48 x 10-5 2.19 x 10⁻⁴
* Based on actual sampling monitoring data.
5.1.3. Analytical Assumptions
Considerations and assumptions used in the modeling effort to support TMDL development include:
• The critical conditions were represented at a steady-state 7Q10 flow condition. The 7Q10 flowcondition was selected due to the nature of source contributions to the impairment (direct pointsource contributions) and it was found to be more critical than the harmonic mean flow.
• Direct discharges of PCBs were assumed constant during the critical condition (based on therecent sampling event).
• Sediment concentrations were defined as a constant fraction of the concentration in theoverlaying water.
• Hydrogeometric (i.e. depth, width, velocity) characteristics were assumed constant within eachsegment.
Development of Shenandoah River PCB TMDL
5-4
• Sediments do not move horizontally (no advection).• PCB decomposition rates were assumed to be zero.• Volatilization and atmospheric deposition of PCBs were not explicitly modeled.• Bio-accumulation interactions between organisms were not explicitly modeled (refer to Section
5.4).• The burial rate was also assumed to be negligible due to the free flowing nature of the river.
However, burial rates were considered in the last segment, located by Millville Dam, WV tobetter represent flow and physical properties by Millville Dam, WV.
• The diffusion rate was calculated using an average molecular weight (>250 gmole) for highmolecular weight PCBs (Aroclor 1016, 1242, 1248, 1254 and 1260).
• The fraction of particulate concentration changes with distance, incorporating the TSS resultsfrom the sampling event.
The plug-flow model applies analytical solutions to estimate the PCBs concentration profile in theShenandoah River. PCBs sampling data were used as input to the model rather than for calibrationpurposes. The plug-flow model used in the TMDL development does not provide a completerepresentation of sediment transport and dynamics in the stream. Insufficient data are available to fullycharacterize and simulate sediment dynamics.
As stated earlier, in the plug-flow model, the burial rate is considered to be negligible in the free flowingsections of the Shenandoah River. In the free flowing sections, sediment is being transported downstreamto Millville Dam, West Virginia. The dam area was modeled as a lake to take into account deposition andsettling with respect to time. Therefore, the free flowing sections are transporting the sediments toMillville Dam where burial (deposition) is taking place. This approach allows for a better representationof the flow and physical properties by Millville Dam, WV.
5.2. TMDL Calculations
The goal of the model application was to determine allowable source contributions which meet the waterquality criteria in both Virginia and West Virginia. Boundary conditions and source inputs were adjustedto achieve in-stream water column concentrations of PCBs that meet the TMDL target of 0.044 ng/L inWest Virginia and 0.55 ng/L in Virginia.
Because the Virginia water quality criteria for PCBs is based on individual Aroclors, a total PCBs criteriawas calculated to allow basis of comparison to the in-stream total PCBs concentration. The Virginia totalPCBs water quality criteria of 0.55 ng/L was estimated based on a weight percent of each homolog groupwith the manufactured Aroclors 1221, 1232, 1016, 1242, 1248,1254, 1260 (GE, 1999). The Aroclors andtotal PCBs concentration follows a proportional relationship, equating to 0.55 ng/L of total PCBs for each0.44 ng/L Aroclor.
Development of Shenandoah River PCB TMDL
5-5
0.01
0.10
1.00
0 10 20 30 40 50 60
Distance Downstream (miles)*
Tota
l PCB
s (ng
/l)
Total PCBs (ng/L) VA Criteria (ng/l) WV Criteria (ng/l)
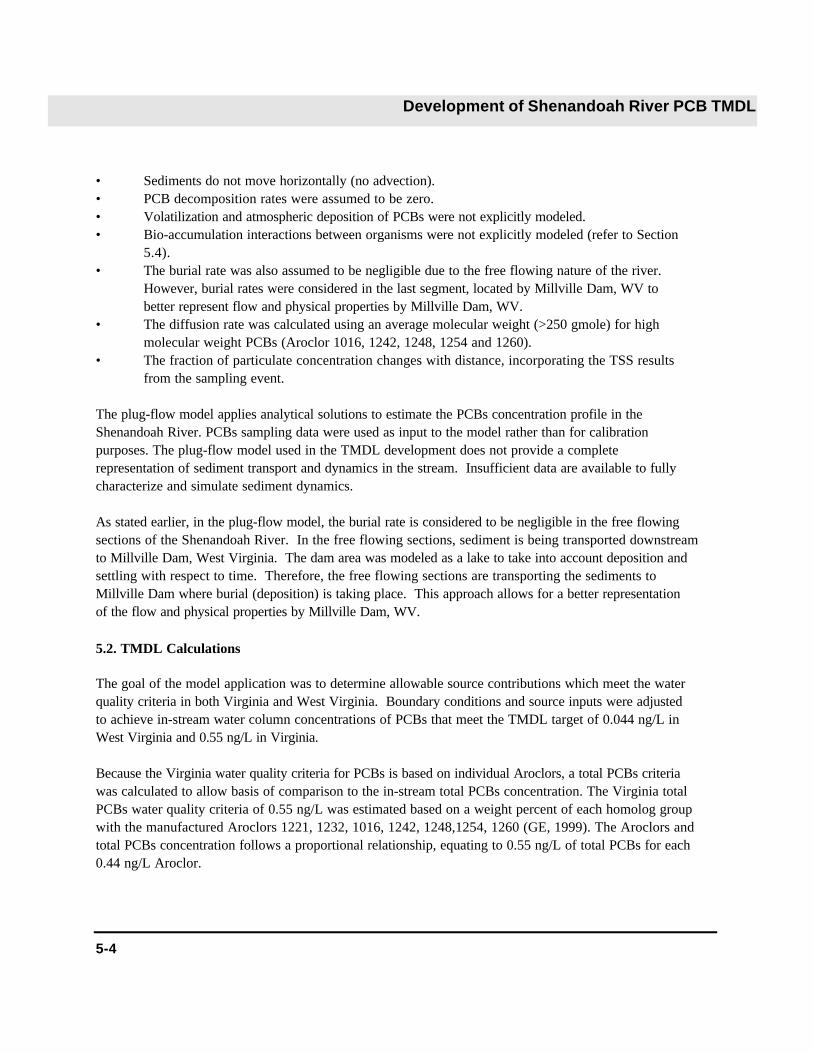
Figure 5-3: Total Modeled PCBs in the Water Column Along the Length of theShenandoah River* Zero miles represent the USGS location
Figure 5-3 presents the model results for a successful TMDL allocation scenario. In-stream PCBsconcentrations (water column) meet water quality criteria in both states. Source allocations for thisscenario are presented in Table 5-2 and described in subsequent sections.
Table 5-2: PCBs TMDL Summary1
303(d) ID Impaired Segment TMDL (g/yr) WLA (g/yr) LA (g/yr) MOS(g/yr)
VAV-B41RVAV-B55RVAV-B57RVAV-B58R
Main Stem and SouthFork ShenandoahRiver
208.23 179.38* 8.04** 20.82

Development of Shenandoah River PCB TMDL
5-6
VAA-B51R North ForkShenandoah River
0.833 N/A 0.75 0.083
WV-S_1998 Main Stem Shenandoah River
214.7 179.38* 13.85** 21.47
1 Based on 7Q10 flow condition* Avtex Fibers, Inc. was assigned a WLA of 179.38 g/yr
** Includes allocation to the Warren County Landfill (2.19 x 10⁻⁴g/yr)Note: WLA and LA were assigned based on the assimilative capacity of the Shenandoah River.
5.2.1. Waste Load Allocations (WLAs)
The waste load allocations contain the allowable loadings from existing and/or future point sources. Theonly known point source facility discharging PCBs into the Shenandoah River, Avtex Fibers, Inc. wasmodeled as discharging to the stream during a 7Q10 flow at 0.0160 cubic meters per second (based onyear 2000 annual flow). The model determined that, based on the assimilative capacity of the ShenandoahRiver, a waste load allocation of 0.200 ug/L would allow for the attainment of water quality standards inboth Virginia and West Virginia. The annual allocation for the Avtex facility is 179.38 g/yr which wasdetermined by multiplying the allowable concentration (200 ug/L) by the annual flow. Method 8082 is theapproved sampling methodology for PCBs at Avtex. The detection limit for this method is 0.5 ug/L. TheTMDL requests that EPA and FMC conduct an evaluation of PCB analysis and treatment technologiesduring EPA’s 5-year review.
Upon the completion of the remediation project, EPA does not expect the site to be a source of PCBsand has therefore assigned a Load Allocation of zero to the site. However, the WLA will betransferred to the Margin of Safety to account for any uncertainty in the loadings.
5.2.2. Load Allocations (LAs)
The load allocation is the amount of PCBs contributed to the waterbody by nonpoint sources. Nonpointsource contributions of PCBs to the Shenandoah River include runoff from contaminated locations,atmospheric deposition, and historically contaminated sediment within the stream or along the streambanks. Based on the sampling event, outflow from the Warren County Landfill was identified as anexplicit nonpoint source of PCBs, and an allocation was defined accordingly. PCBs contributionsassigned to all nonpoint sources (including unknown sources) were based on a concentration, at the USGSgauge station, of 0.0106 ng/L.
5.2.3. Margin of Safety
Development of Shenandoah River PCB TMDL
5-7
Margin of safety is intended to add a level of conservation to the analytical process to account for anyuncertainty. The Margin of safety may be implicit, built into the modeling process, or explicit, taken as apercentage of the wasteload allocation, load allocation or TMDL. A ten percent explicit margin of safetywas applied to account for uncertainty in this TMDL.
5.3. Seasonal Variations
A TMDL must consider seasonal variation in the derivation of the allocation. Selection of the criticalcondition (7Q10 low flow) involved assessment of potential source contributions under a variety ofhydrologic regimes (low, mean, and high flow conditions). Based on available monitoring data, Avtex wasdetermined to contribute the greatest load of PCBs to the Shenandoah River. Under low flow conditions,dilution capacity is minimal, and potential contributions from Avtex would have the greatest impact.
5.4. Fish Advisory Criteria and TMDL Endpoint
This section discusses the impact of using the TMDL endpoint of 0.044ng/L for West Virginia and 0.55ng/L for Virginia versus the fish advisory criteria. While the TMDL endpoint (and thus the source-response linkage) is based on water column criteria, the impact of the TMDL allocations on fishadvisories must also be considered. Fish tissue samples can be converted to water column concentrations using accepted approaches fordirect comparison to the water column criteria. EPA’s Bioconcentration Factor (BCF) is typicallyemployed in this type of conversion. The BCF for PCBs is 31,200 L/Kg (EPA 440/5-80-068), andrepresents the accumulation rate of PCBs in fish tissues.
The conversion equation is:
Tissue Level = Water concentration * BCF * unit conversions
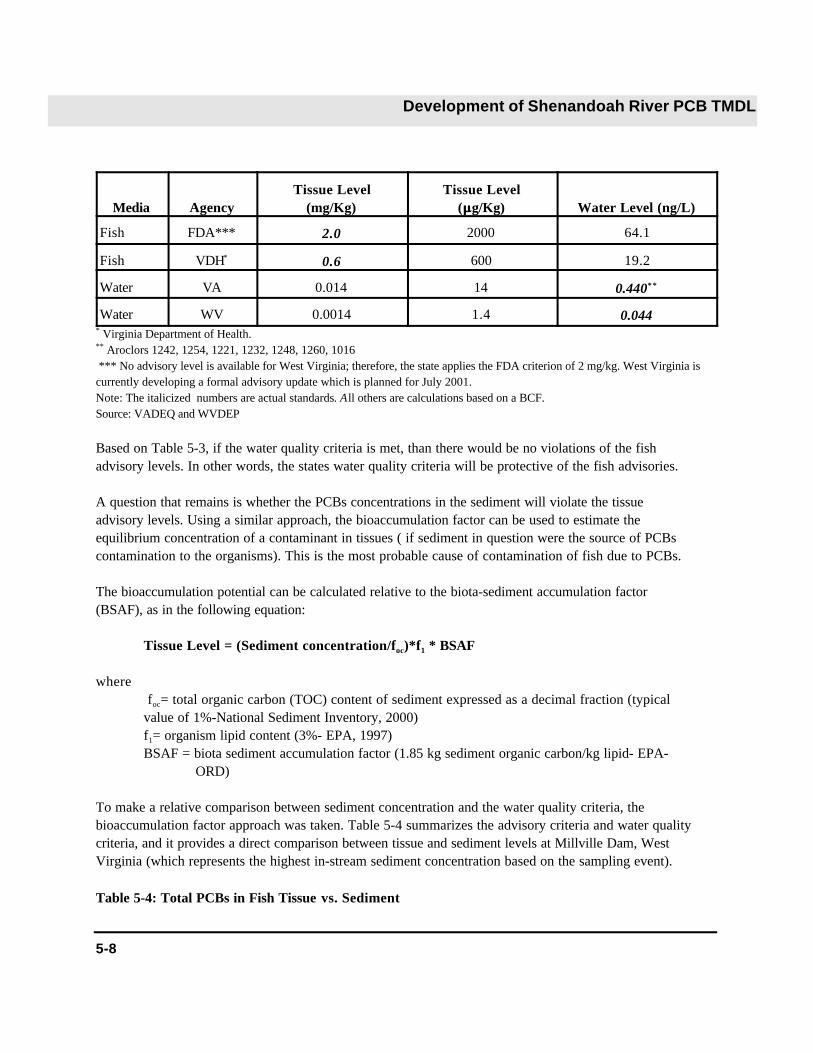
Table 5-3 summarizes the advisory criteria and water quality criteria and provides a direct comparisonbetween tissue and water column levels. In order to meet water quality criteria at all locations on theimpaired rivers in West Virginia and Virginia, the water column concentration of 0.044 ng/L must be metin West Virginia. Table 5-2 implies that both West Virginia and Virginia water column criteria are morestringent than the FDA or VDH, thus protective of the advisory criteria.
Table 5-3: Total PCBs Water Quality Criteria
Development of Shenandoah River PCB TMDL
5-8
Media AgencyTissue Level
(mg/Kg)Tissue Level
(::g/Kg) Water Level (ng/L)
Fish FDA*** 2.0 2000 64.1
Fish VDH* 0.6 600 19.2
Water VA 0.014 14 0.440**
Water WV 0.0014 1.4 0.044* Virginia Department of Health.** Aroclors 1242, 1254, 1221, 1232, 1248, 1260, 1016 *** No advisory level is available for West Virginia; therefore, the state applies the FDA criterion of 2 mg/kg. West Virginia iscurrently developing a formal advisory update which is planned for July 2001. Note: The italicized numbers are actual standards. All others are calculations based on a BCF. Source: VADEQ and WVDEP
Based on Table 5-3, if the water quality criteria is met, than there would be no violations of the fishadvisory levels. In other words, the states water quality criteria will be protective of the fish advisories.
A question that remains is whether the PCBs concentrations in the sediment will violate the tissueadvisory levels. Using a similar approach, the bioaccumulation factor can be used to estimate theequilibrium concentration of a contaminant in tissues ( if sediment in question were the source of PCBscontamination to the organisms). This is the most probable cause of contamination of fish due to PCBs.
The bioaccumulation potential can be calculated relative to the biota-sediment accumulation factor(BSAF), as in the following equation:
Tissue Level = (Sediment concentration/foc)*f1 * BSAF
where foc= total organic carbon (TOC) content of sediment expressed as a decimal fraction (typicalvalue of 1%-National Sediment Inventory, 2000)f1= organism lipid content (3%- EPA, 1997)BSAF = biota sediment accumulation factor (1.85 kg sediment organic carbon/kg lipid- EPA- ORD)
To make a relative comparison between sediment concentration and the water quality criteria, thebioaccumulation factor approach was taken. Table 5-4 summarizes the advisory criteria and water qualitycriteria, and it provides a direct comparison between tissue and sediment levels at Millville Dam, WestVirginia (which represents the highest in-stream sediment concentration based on the sampling event).
Table 5-4: Total PCBs in Fish Tissue vs. Sediment

Development of Shenandoah River PCB TMDL
5-9
Media AgencyTissue Level
(mg/Kg)Tissue Level
(::g/Kg) Sediment Level (mg/Kg)
Fish FDA 2.0 2000 0.360
Fish VDH* 0.6 600 0.108
Sediment - 0.555 555 0.1**
Sediment - 0.0965 96.5 0.0174***
* Virginia Department of Health.** Sediment concentration at Site #5, South Fork Shenandoah,VA (validated data)*** Sediment concentration at Millville Dam, WV (validated data) *** No advisory level is available for West Virginia; therefore, the state applies the FDA criterion of 2 mg/kg. West Virginia iscurrently developing a formal advisory update which is planned for July 2001. Note: The italicized numbers are actual standards. All others are calculations based on a BSAF.Source: VADEQ and WVDEP.
The estimated tissue levels listed in Table 5-3, indicate that the highest observed PCBs sedimentconcentration would not violate the tissue advisory levels.
Development of Shenandoah River PCB TMDL
6-1
Section 6: Reasonable Assurances
Reasonable assurance is one of the eight regulatory requirements of a TMDL. The purpose of thisSection is to provide a reasonable assurance that the Shenandoah River PCB TMDL targets can be met. Under the Consent Decree between the United States and FMC (effective 21 October 2001), severalremedial and removal actions are taking place at Avtex site. One of these actions, plans to shutdown anddemolish the Avtex WWTP., which in the future will ensure no discharges of PCBs in the ShenandoahRiver.
In the plug-flow model, burial rates are considered negligible because of the flowing water characteristicsof the Shenandoah River. The main stem of the Shenandoah was divided into segments as illustrated inFigure 5-1. However, the last segment was modified to simulate a lake model, to represent the pool byMillville Dam. In this area, burial was considered and therefore natural attenuation will take place.
Natural attenuation is usually considered to be an appropriate action alternative to ensure that the TMDLtargets are met and water quality standards are achieved. Natural attenuation approach involves allowingnatural processes such as burial an flushing of sediment during high flow events to decrease the in-streamsediment levels of PCBs. The alternative option, mechanical or vacuum dredging, is not currently justifiedas a viable approach given the possible habitat destruction, resuspension of PCBs, and high cost involved. It is suggested that in order to assess the progress made towards achieving the Shenandoah River PCBTMDL, monitoring of fish tissue should be continued. It is recommended that an increase in thefrequency of monitoring will provide better feedback on maintaining the TMDL goal.

Development of Shenandoah River PCB TMDL
6-2
Section 7.0: Public Participation
There were two public meetings held in Front Royal, Virginia to discuss the development of thisTMDL. The meetings were held on February 15, 2001 and July 17, 2001 at the Warren CountyGovernment Center. The meetings were public noticed in the Virginia Register on January 27, 2001and June 18, 2001. There was also a 45-day public comment period from July 2, 2001 to August 15,2001. WVDEP put the TMDL out for public comment on July 2, 2001 in The Journal. A publicnotice also went out in the Sheperdstown Chronicle and the Jefferson Advocate on July 06, 2001 andJuly 05, 2001 respectively. WVDEP issued a press release for the first public meeting on February 01,2001.
Development of Shenandoah PCB TMDL
R-1
References
Burns, N. M. and Rosa, F. 1980. “In Situ Measurement of the Settling Velocity of Organic CarbonParticles and 10 Species of Phytoplankton”. Limnol. Oceanogr. 25:855-864
Chapra, S. C. 1997. Surface Water-Quality Modeling. McGraw Hill Publication.
Chawarzenbach. R.P., Gschwend, P.M., and Imboden, D. M. 1993. Environmental Organic Chemistry. John Wiley & Sons, Inc., New York, NY.
Gannett Fleming, Inc. 1993. Final Work Plan, Avtex Fibers Site, Warren County, Virginia. EPAContract Number 68-W8-0037. Superfund Data Management System Document 135739.
General Electric. 1999. PCBs in the Upper Hudson River PCBs, Vol. 1 Historical Perspective and ModelOverview. Albany, NY.
Thomann, R. V. and Mueller, J. A. 1987. Principles of Surface Water Quality Modeling and Control. Harper International Edition
Thomann, R. V., and D. M. Di Toro, 1983. Physico Chemical Model of Toxic Substances in the GreatLakes, J. Great Lakes Res. 9(4):474-496
TSCA15 U.S.C. s/s 2601 et seq. (1976)
U.S. EPA. 2001. http://www.epa.gov/region5/defs/html/tsca.htm
U.S. EPA. 2001. http://www.epa.gov/region5/defs/html/cercla.htm
U.S. EPA. 2001. http://www.epa.gov/region5/defs/html/rcra.htm
U.S. EPA .2000. National Sediment Quality Survey. EPA/OW/OST/SASD.
U.S. EPA. 1995. Technical Guidance Manual for Developing Total Maximum Daily Loads. Officeof Water. EPA 823-B-95-007.
U.S. EPA. 1997. The Incidence and Severity of Sediment Contamination in Surface Waters of theUnited States, Volume 1: National Sediment Quality Survey. EPA 823-R-97-006.
U.S. EPA. 1980. Ambient Water Quality Criteria for PCBs. EPA 440/5-80-068
Development of Shenandoah River PCB TMDL
R-2
U.S. EPA. Technical Guidance Manual for Perfoming Waste Load Allocations: Book II Streams andRivers - Chapter 3 – Toxic Substances Impact. U.S. Environmental Protection Agency, Office ofWater, Regulations and Standards, Monitoring and Data Support Division, Washington, D.C. June1984.
USGS. 1995. Distribution and Transport of PCBs and Associated Particulates in the HaytonMillpond, South Branch Manitowoc River, Wisconsin. Report 99-4101.
Virginia State Water Control Board. 1989. A Summary of Studies of PCB Contamination in the NorthFork, South Fork, and Mainstem Shenandoah River.
Virginia State Water Control Board. 1997. Water Quality Standards. 9VAC 25-260-5 et seq. StatutoryAuthority: 62.1-44.15 )3a) of the Code of Virginia.
West Virginia Environmental Quality Board. 2000. Requirements Governing Water Quality Standards.46CSRI Legislative Rule.
Weston. 1989. Storm Sewer Compliance Investigation Report, Avtex Fibers, Incorporate. Roy F. Weston Inc. West Chester, PA.
Wetzel, R. G. 1983. Limnology. 2d ed. Sunders, Philadelphia
Wisonsin DNR. 1997. Polychlorinated Biphenyl (PCB) Contaminated Sediment in the Low FoxRiver. PUBL-WT-482-97.
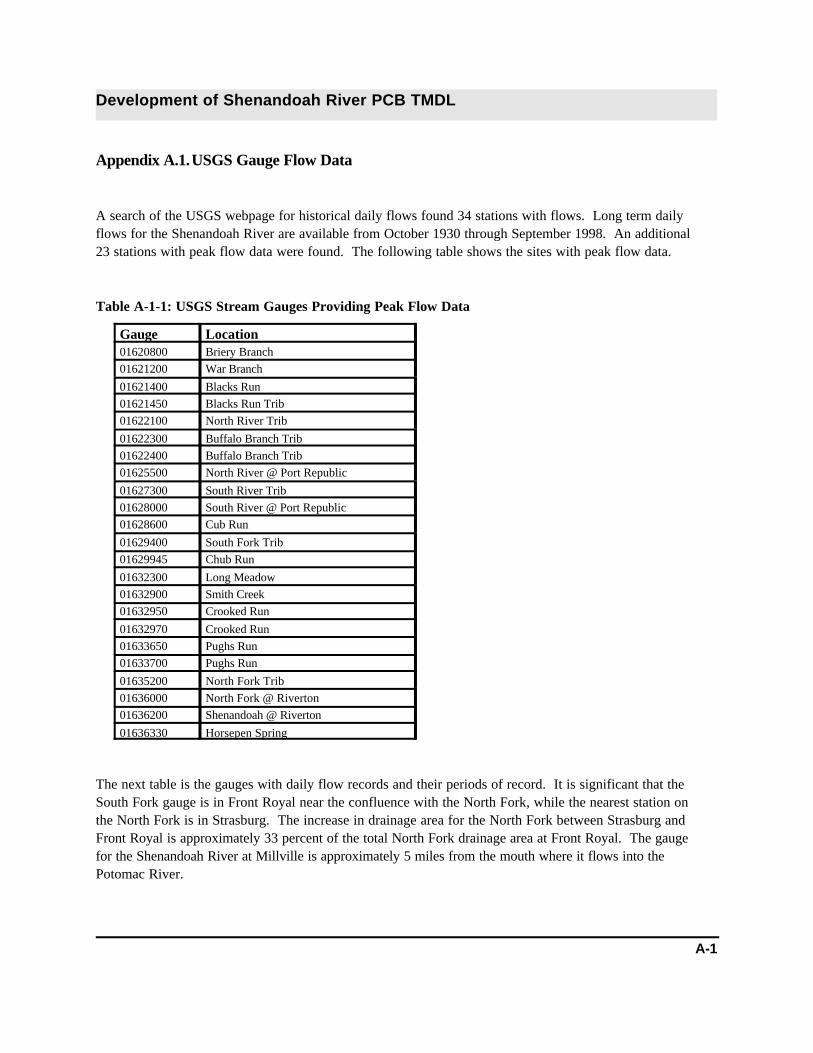
Development of Shenandoah River PCB TMDL
A-1
Appendix A.1.USGS Gauge Flow Data
A search of the USGS webpage for historical daily flows found 34 stations with flows. Long term dailyflows for the Shenandoah River are available from October 1930 through September 1998. An additional23 stations with peak flow data were found. The following table shows the sites with peak flow data.
Table A-1-1: USGS Stream Gauges Providing Peak Flow Data
Gauge Location01620800 Briery Branch01621200 War Branch
01621400 Blacks Run01621450 Blacks Run Trib01622100 North River Trib
01622300 Buffalo Branch Trib01622400 Buffalo Branch Trib01625500 North River @ Port Republic
01627300 South River Trib01628000 South River @ Port Republic01628600 Cub Run
01629400 South Fork Trib01629945 Chub Run
01632300 Long Meadow01632900 Smith Creek01632950 Crooked Run
01632970 Crooked Run01633650 Pughs Run01633700 Pughs Run
01635200 North Fork Trib01636000 North Fork @ Riverton01636200 Shenandoah @ Riverton
01636330 Horsepen Spring
The next table is the gauges with daily flow records and their periods of record. It is significant that theSouth Fork gauge is in Front Royal near the confluence with the North Fork, while the nearest station onthe North Fork is in Strasburg. The increase in drainage area for the North Fork between Strasburg andFront Royal is approximately 33 percent of the total North Fork drainage area at Front Royal. The gaugefor the Shenandoah River at Millville is approximately 5 miles from the mouth where it flows into thePotomac River.

Development of Shenandoah River PCB TMDL
A-2
Table A-1-2: USGS Stream Gauges Providing Daily Flow Data
Gauge Name Drainage (square miles) Start Stop01620500 North River near Stokesville 17.2 10/01/1946 09/30/199901621000 Dry River 72.6 08/30/1946 09/30/194801621050 Muddy Creek 14.2 04/13/1973 09/30/1999
01621470 Blacks Run 19.4 02/18/1999 09/30/199901622000 North River @ Burketown 379 06/01/1926 10/31/1972
05/23/1975 09/30/1999
01623000 Bell Creek near Staunton 0.61 10/01/1948 09/30/195501623500 Bell Creek @ Staunton 3.80 10/01/1948 09/30/1955
01624000 Bell Creek near Franks Mill 9.60 10/01/1948 09/30/195601624300 Middle River near Verona 178 10/01/1967 01/09/198701624800 Christians Creek 70.1 10/01/1967 10/06/1997
01625000 Middle River @ Grottoes 375 10/01/1927 09/30/199501625900 Back Creek 41.2 05/01/1974 09/30/197701626000 South River near Waynesboro 127 10/01/1952 09/30/1999
01626500 South River @ Waynesboro 133 10/01/2028 09/30/195201626850 South River near Dooms 149 04/23/1974 12/10/199601627500 South River @ Harriston 212 02/15/1925 09/30/1951
10/01/1968 09/30/199901628060 White Oak Run 1.94 10/01/1979 09/30/1996
01628150 Deep Run 1.17 10/01/1979 09/30/198201628500 South Fork @ Lynnwood 1084 10/01/1930 09/30/199901629500 South Fork @ Luray 1377 04/01/1925 09/30/1930
10/01/1938 09/30/195106/01/1979 09/30/1999
01631000 South Fork @ Front Royal 1642 10/01/1930 09/30/1999
01632000 North Fork @ Cootes Store 210 04/01/1925 09/30/199901632082 Linville Creek 45.5 08/09/1985 09/30/199901633000 North Fork @ Mount Jackson 506 10/01/1943 09/30/1999
01633500 Stony Creek 79.4 04/01/1947 09/30/195601634000 North Fork @ Strasburg 768 04/01/1925 09/30/199901634500 Cedar Creek 103 10/01/1937 09/30/1999
01635360 Mill Run 1.17 11/18/1982 08/17/198810/01/1988 05/30/1990
01635365 Shelter Run 0.14 09/02/1982 11/15/198410/01/1985 05/12/198607/15/1986 04/15/1990
01635500 Passage Creek 87.8 04/01/1932 09/30/199901636210 Happy Creek 14.0 10/01/1948 10/19/197701636451 Long Marsh 16.1 04/21/1988 03/28/1989
05/03/1989 06/21/198901636462 Bullskin Run 22.2 04/21/1988 07/14/198901636500 Shenandoah @ Millville 3040 04/01/1895 03/31/1909
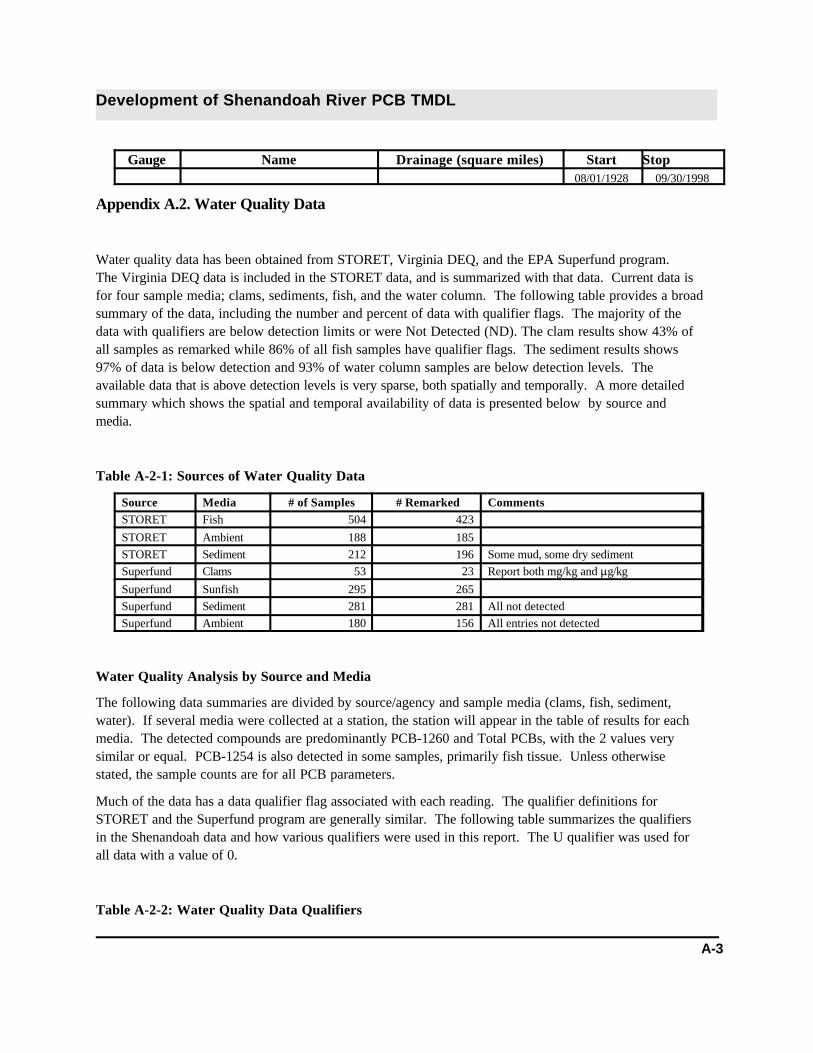
Development of Shenandoah River PCB TMDL
Gauge Name Drainage (square miles) Start Stop
A-3
08/01/1928 09/30/1998
Appendix A.2. Water Quality Data
Water quality data has been obtained from STORET, Virginia DEQ, and the EPA Superfund program. The Virginia DEQ data is included in the STORET data, and is summarized with that data. Current data isfor four sample media; clams, sediments, fish, and the water column. The following table provides a broadsummary of the data, including the number and percent of data with qualifier flags. The majority of thedata with qualifiers are below detection limits or were Not Detected (ND). The clam results show 43% ofall samples as remarked while 86% of all fish samples have qualifier flags. The sediment results shows97% of data is below detection and 93% of water column samples are below detection levels. Theavailable data that is above detection levels is very sparse, both spatially and temporally. A more detailedsummary which shows the spatial and temporal availability of data is presented below by source andmedia.
Table A-2-1: Sources of Water Quality Data
Source Media # of Samples # Remarked CommentsSTORET Fish 504 423
STORET Ambient 188 185STORET Sediment 212 196 Some mud, some dry sedimentSuperfund Clams 53 23 Report both mg/kg and :g/kg
Superfund Sunfish 295 265Superfund Sediment 281 281 All not detectedSuperfund Ambient 180 156 All entries not detected
Water Quality Analysis by Source and Media
The following data summaries are divided by source/agency and sample media (clams, fish, sediment,water). If several media were collected at a station, the station will appear in the table of results for eachmedia. The detected compounds are predominantly PCB-1260 and Total PCBs, with the 2 values verysimilar or equal. PCB-1254 is also detected in some samples, primarily fish tissue. Unless otherwisestated, the sample counts are for all PCB parameters.
Much of the data has a data qualifier flag associated with each reading. The qualifier definitions forSTORET and the Superfund program are generally similar. The following table summarizes the qualifiersin the Shenandoah data and how various qualifiers were used in this report. The U qualifier was used forall data with a value of 0.
Table A-2-2: Water Quality Data Qualifiers

Development of Shenandoah River PCB TMDL
A-4
Superfund STORET Report Definition
J J J Estimated values
K K K Below detection level
M U Present, but not quantified
R R Rejected for gross QC problems
U U U Not detected (ND)
UJ U Estimated value for ND
UL U ND, greater than value shown
W W Weathered for PCB analysis
WJ W Estimated value, weathered for PCB analysis
Superfund Data
Sample Type: Clams
Date: 05/13/97
Table A-2-3: Superfund Data for Clams
Units Count Minimum Maximum Comments
mg/kg 30 0.320 16
:g/kg 23 100 16000 All flagged W. Detection limits between 68 and 83.
Converting the :g/kg detection limits to mg/kg gives a range of 0.068 to 0.083 mg/kg respectively. Therange of results for the :g/kg data is 0.1 mg/kg to 16 mg/kg. If the W flag does not require special datainterpretation, the two sets of results could be combined.
Sample Type: Fish
Date: 05/13/97
Table A-2-4: Superfund Data for Fish
Units Count Minimum Maximum Comments
mg/kg 25 2 9.3
mg/kg 164 ND ND Detection limit of 1
:g/kg 5 97 500
:g/kg 6 21 48 Estimated values
:g/kg 28 ND ND Detection of 110 to 1000
:g/kg 67 37 9600 Detection of 67 to 130

Development of Shenandoah River PCB TMDL
A-5
Sample Type: Sediment
Dates: 09/23/93, 05/13/97
Table A-2-5: Superfund Data for Sediment
Units Count Minimum Maximum Comments
mg/kg 3 ND ND All U, detection of 2 or 2.9
:g/kg 278 ND ND All U, detection between 30 and 760
Sample Type: Water
Dates: 09/23/93, 05/13/97
Table A-2-6: Superfund Data for Water
Units Count Minimum Maximum Comments
mg/L 25 ND ND All U, detection of 0.0001
:g/L 155 ND ND All U, detection of 0.3 or 0.5
The 0.3 :g/L detection level is 680 times greater than the Virginia standard and 6800 times greater thanthe West Virginia standard.
STORET Data
USEPA Region 3
Sample Type: Water
Table A-2-7: STORET Data for Water
Station Date Count Minimum Maximum Comments
Front Royal 01/10/79 7 ND ND One sample, 7 parameters, allND
Waynesboro 05/01/79 7 ND ND One sample, 7 parameters, allND
The 0.1 :g/L detection limit used is 230 times greater than the Virginia standard and 2300 times greaterthan the West Virginia standard.
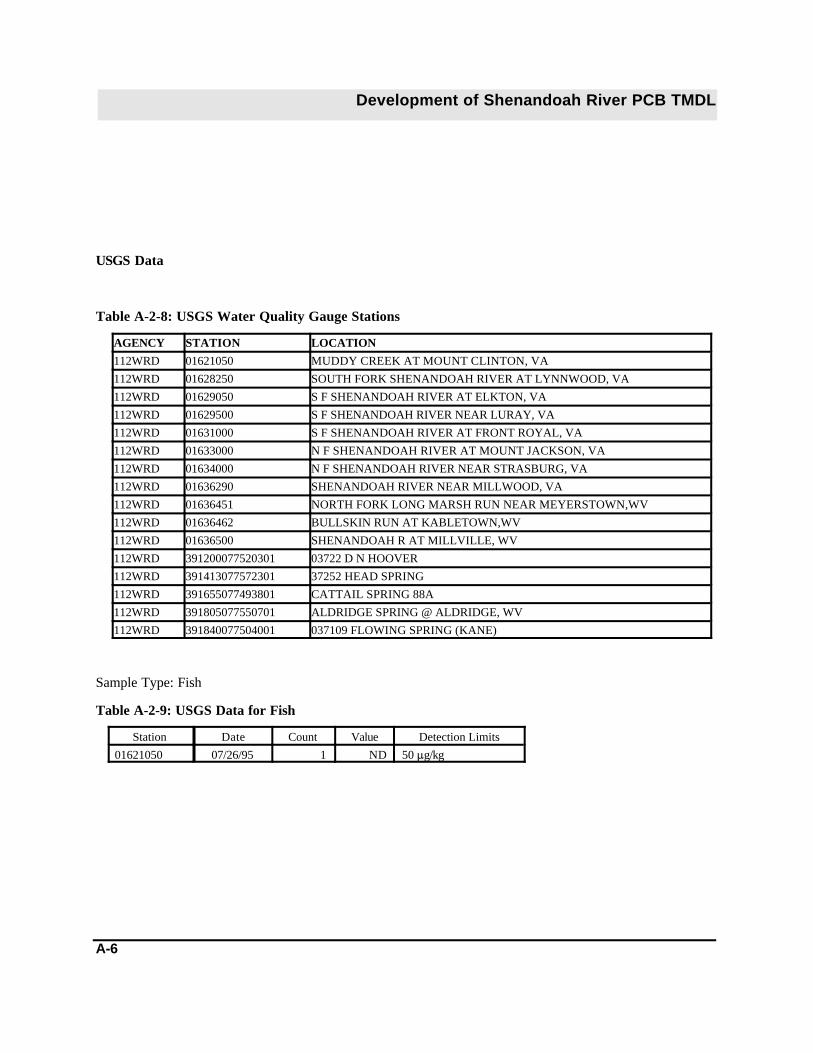
Development of Shenandoah River PCB TMDL
A-6
USGS Data
Table A-2-8: USGS Water Quality Gauge Stations
AGENCY STATION LOCATION
112WRD 01621050 MUDDY CREEK AT MOUNT CLINTON, VA
112WRD 01628250 SOUTH FORK SHENANDOAH RIVER AT LYNNWOOD, VA
112WRD 01629050 S F SHENANDOAH RIVER AT ELKTON, VA
112WRD 01629500 S F SHENANDOAH RIVER NEAR LURAY, VA
112WRD 01631000 S F SHENANDOAH RIVER AT FRONT ROYAL, VA
112WRD 01633000 N F SHENANDOAH RIVER AT MOUNT JACKSON, VA
112WRD 01634000 N F SHENANDOAH RIVER NEAR STRASBURG, VA
112WRD 01636290 SHENANDOAH RIVER NEAR MILLWOOD, VA
112WRD 01636451 NORTH FORK LONG MARSH RUN NEAR MEYERSTOWN,WV
112WRD 01636462 BULLSKIN RUN AT KABLETOWN,WV
112WRD 01636500 SHENANDOAH R AT MILLVILLE, WV
112WRD 391200077520301 03722 D N HOOVER
112WRD 391413077572301 37252 HEAD SPRING
112WRD 391655077493801 CATTAIL SPRING 88A
112WRD 391805077550701 ALDRIDGE SPRING @ ALDRIDGE, WV
112WRD 391840077504001 037109 FLOWING SPRING (KANE)
Sample Type: Fish
Table A-2-9: USGS Data for Fish
Station Date Count Value Detection Limits
01621050 07/26/95 1 ND 50 :g/kg
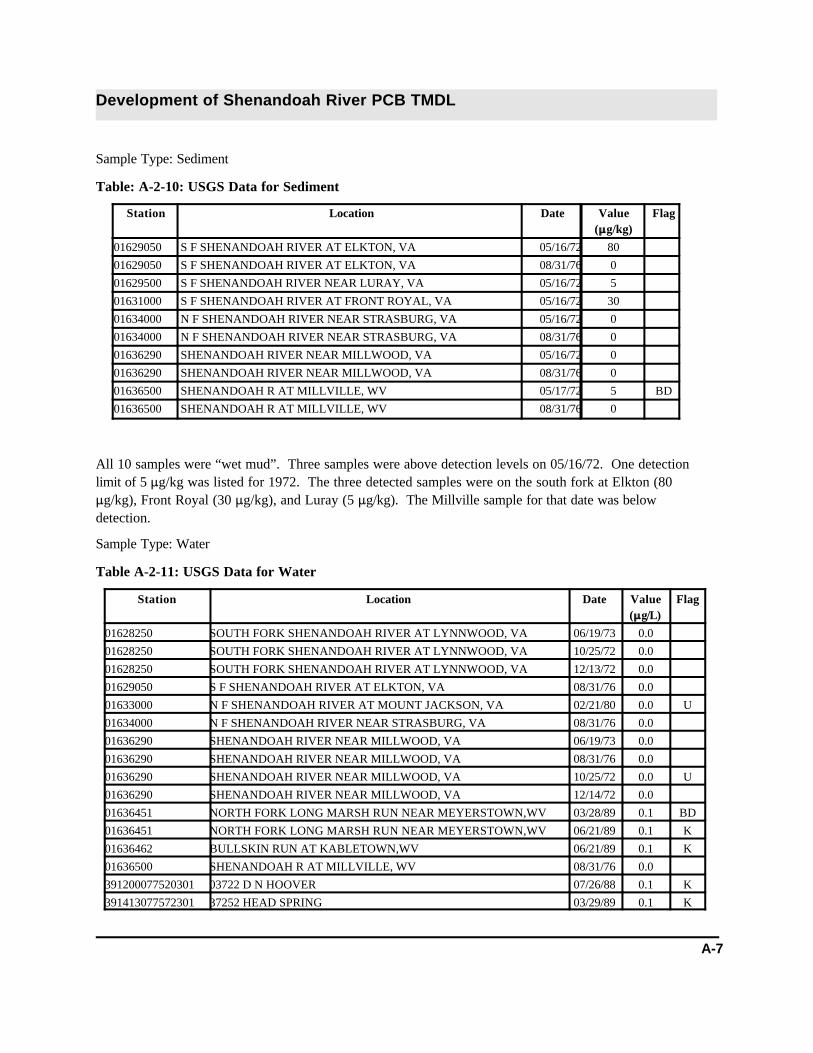
Development of Shenandoah River PCB TMDL
A-7
Sample Type: Sediment
Table: A-2-10: USGS Data for Sediment
Station Location Date Value(::g/kg)
Flag
01629050 S F SHENANDOAH RIVER AT ELKTON, VA 05/16/72 80
01629050 S F SHENANDOAH RIVER AT ELKTON, VA 08/31/76 0
01629500 S F SHENANDOAH RIVER NEAR LURAY, VA 05/16/72 5
01631000 S F SHENANDOAH RIVER AT FRONT ROYAL, VA 05/16/72 30
01634000 N F SHENANDOAH RIVER NEAR STRASBURG, VA 05/16/72 0
01634000 N F SHENANDOAH RIVER NEAR STRASBURG, VA 08/31/76 0
01636290 SHENANDOAH RIVER NEAR MILLWOOD, VA 05/16/72 0
01636290 SHENANDOAH RIVER NEAR MILLWOOD, VA 08/31/76 0
01636500 SHENANDOAH R AT MILLVILLE, WV 05/17/72 5 BD
01636500 SHENANDOAH R AT MILLVILLE, WV 08/31/76 0
All 10 samples were “wet mud”. Three samples were above detection levels on 05/16/72. One detectionlimit of 5 :g/kg was listed for 1972. The three detected samples were on the south fork at Elkton (80:g/kg), Front Royal (30 :g/kg), and Luray (5 :g/kg). The Millville sample for that date was belowdetection.
Sample Type: Water
Table A-2-11: USGS Data for Water
Station Location Date Value(::g/L)
Flag
01628250 SOUTH FORK SHENANDOAH RIVER AT LYNNWOOD, VA 06/19/73 0.0
01628250 SOUTH FORK SHENANDOAH RIVER AT LYNNWOOD, VA 10/25/72 0.0
01628250 SOUTH FORK SHENANDOAH RIVER AT LYNNWOOD, VA 12/13/72 0.0
01629050 S F SHENANDOAH RIVER AT ELKTON, VA 08/31/76 0.0
01633000 N F SHENANDOAH RIVER AT MOUNT JACKSON, VA 02/21/80 0.0 U
01634000 N F SHENANDOAH RIVER NEAR STRASBURG, VA 08/31/76 0.0
01636290 SHENANDOAH RIVER NEAR MILLWOOD, VA 06/19/73 0.0
01636290 SHENANDOAH RIVER NEAR MILLWOOD, VA 08/31/76 0.0
01636290 SHENANDOAH RIVER NEAR MILLWOOD, VA 10/25/72 0.0 U
01636290 SHENANDOAH RIVER NEAR MILLWOOD, VA 12/14/72 0.0
01636451 NORTH FORK LONG MARSH RUN NEAR MEYERSTOWN,WV 03/28/89 0.1 BD
01636451 NORTH FORK LONG MARSH RUN NEAR MEYERSTOWN,WV 06/21/89 0.1 K
01636462 BULLSKIN RUN AT KABLETOWN,WV 06/21/89 0.1 K
01636500 SHENANDOAH R AT MILLVILLE, WV 08/31/76 0.0
391200077520301 03722 D N HOOVER 07/26/88 0.1 K
391413077572301 37252 HEAD SPRING 03/29/89 0.1 K
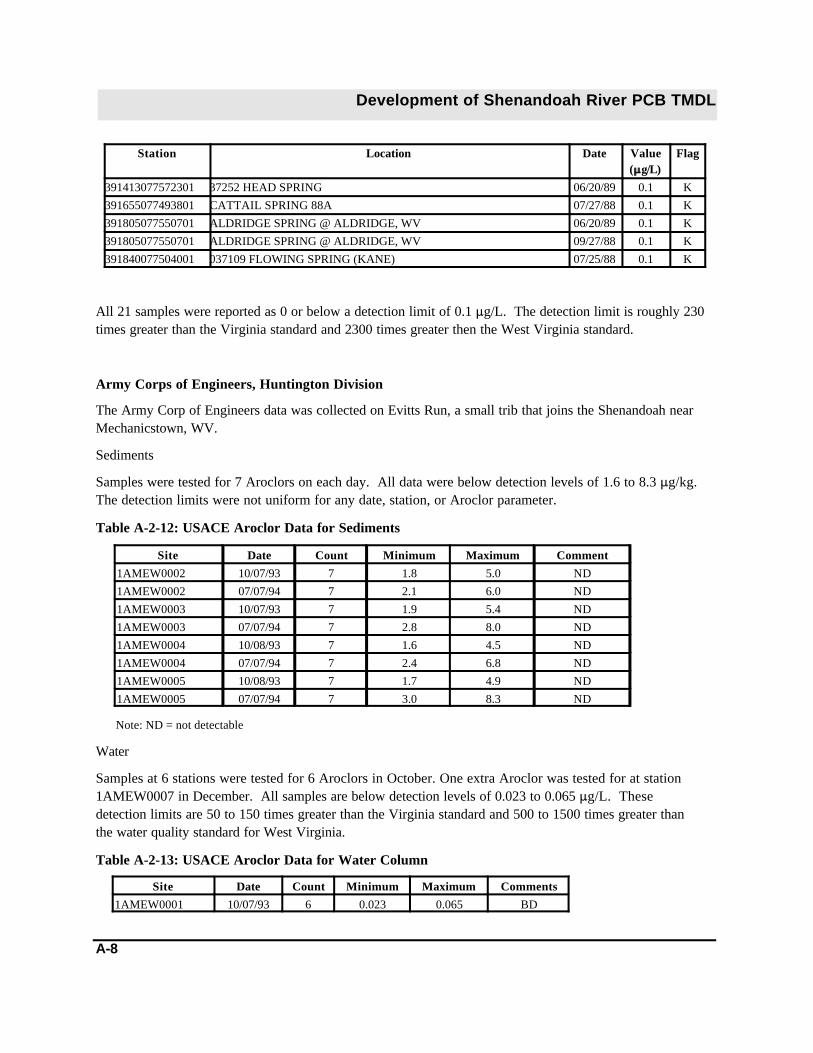
Development of Shenandoah River PCB TMDL
Station Location Date Value(::g/L)
Flag
A-8
391413077572301 37252 HEAD SPRING 06/20/89 0.1 K
391655077493801 CATTAIL SPRING 88A 07/27/88 0.1 K
391805077550701 ALDRIDGE SPRING @ ALDRIDGE, WV 06/20/89 0.1 K
391805077550701 ALDRIDGE SPRING @ ALDRIDGE, WV 09/27/88 0.1 K
391840077504001 037109 FLOWING SPRING (KANE) 07/25/88 0.1 K
All 21 samples were reported as 0 or below a detection limit of 0.1 :g/L. The detection limit is roughly 230times greater than the Virginia standard and 2300 times greater then the West Virginia standard.
Army Corps of Engineers, Huntington Division
The Army Corp of Engineers data was collected on Evitts Run, a small trib that joins the Shenandoah nearMechanicstown, WV.
Sediments
Samples were tested for 7 Aroclors on each day. All data were below detection levels of 1.6 to 8.3 :g/kg. The detection limits were not uniform for any date, station, or Aroclor parameter.
Table A-2-12: USACE Aroclor Data for Sediments
Site Date Count Minimum Maximum Comment
1AMEW0002 10/07/93 7 1.8 5.0 ND
1AMEW0002 07/07/94 7 2.1 6.0 ND
1AMEW0003 10/07/93 7 1.9 5.4 ND
1AMEW0003 07/07/94 7 2.8 8.0 ND
1AMEW0004 10/08/93 7 1.6 4.5 ND
1AMEW0004 07/07/94 7 2.4 6.8 ND
1AMEW0005 10/08/93 7 1.7 4.9 ND
1AMEW0005 07/07/94 7 3.0 8.3 ND
Note: ND = not detectable
Water
Samples at 6 stations were tested for 6 Aroclors in October. One extra Aroclor was tested for at station1AMEW0007 in December. All samples are below detection levels of 0.023 to 0.065 :g/L. Thesedetection limits are 50 to 150 times greater than the Virginia standard and 500 to 1500 times greater thanthe water quality standard for West Virginia.
Table A-2-13: USACE Aroclor Data for Water Column
Site Date Count Minimum Maximum Comments
1AMEW0001 10/07/93 6 0.023 0.065 BD

Development of Shenandoah River PCB TMDL
Site Date Count Minimum Maximum Comments
A-9
1AMEW0002 10/07/93 6 0.023 0.065 BD
1AMEW0003 10/07/93 6 0.023 0.065 BD
1AMEW0004 10/07/93 6 0.023 0.065 BD
1AMEW0005 10/07/93 6 0.023 0.065 BD
1AMEW0007 12/17/93 7 0.023 0.065 BD
West Virginia DNR Sediment and Tissue
Sample Type: Fish Tissue
Table A-2-14: WVDNR Data for Fish Tissue
Site Date Count Minimum Maximum Comments
Meyerstown 10/15/81 4 0.05 0.05 BD
Meyerstown 10/17/83 4 0.00 0.25 2 entries as (0)
Meyerstown 09/27/84 5 0.00 0.13 3 entries as (0)
Meyerstown 10/11/89 48 0.00 11.80 6 samples, 6 of 8 tests (0)
Meyerstown 10/28/93 8 0.24 11.74 4 samples for total and 1260
Millville 09/01/78 16 0.00 0.50 2 samples, 5 of 8 tests (0)
Millville 10/11/89 48 0.00 4.30 6 samples, 6 of 8 tests (0)
Millville 10/28/93 12 0.11 4.89 6 samples for total and 1260
Data Summary:
For Meyerstown
• 41 of 69 samples reported as 0
• 2 samples for PCB-1254 on 10/15/81 reported as :g/kg were below 0.05 detection limit
• 2 samples for PCB-1260 on 10/15/81 reported as mg/kg were below 0.05 detection limit
• 24 samples reported as fish tissue wet weight in mg/kg
< Values for the 24 samples were between 0.13 and 11.8mg/kg.
< The 9/27/84, 10/11/89, and 10/28/93 samples showed a wide variation in concentration.
< The samples above detection were tested for total PCBs and aroclor 1260.
< The PCB-1260 and total PCB values were very similar for a given date and time.
For Millville
• 46 of 76 samples reported as 0
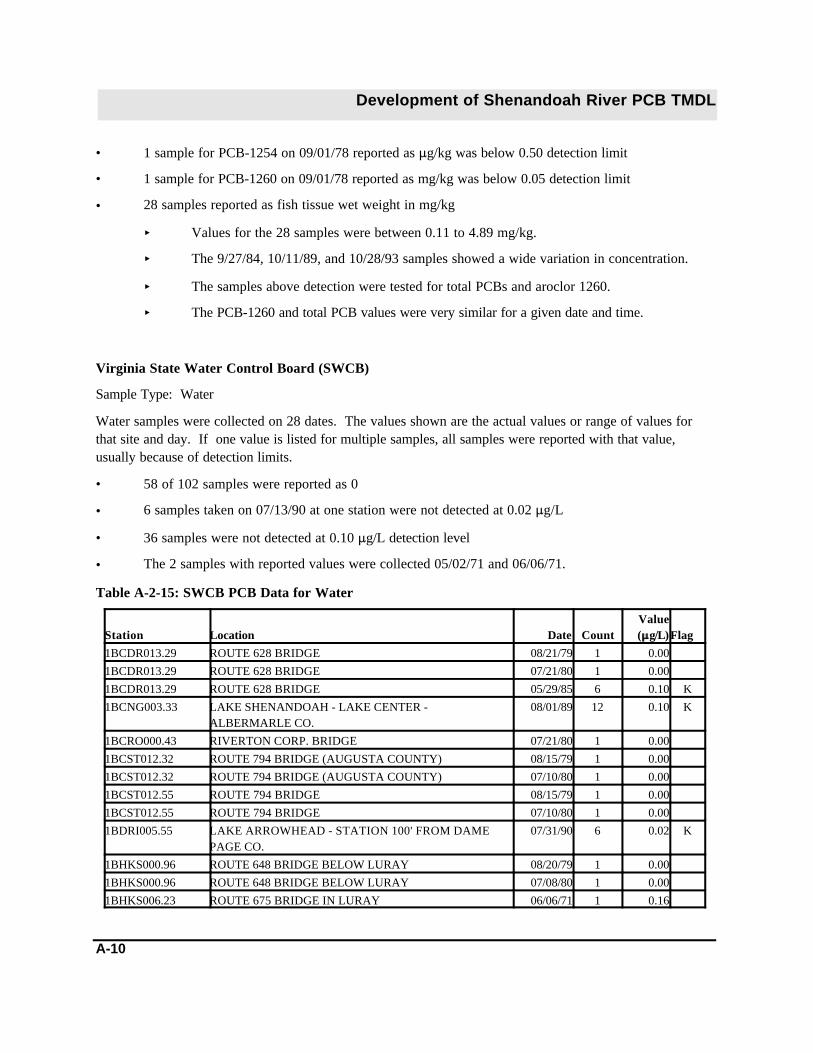
Development of Shenandoah River PCB TMDL
A-10
• 1 sample for PCB-1254 on 09/01/78 reported as :g/kg was below 0.50 detection limit
• 1 sample for PCB-1260 on 09/01/78 reported as mg/kg was below 0.05 detection limit
• 28 samples reported as fish tissue wet weight in mg/kg
< Values for the 28 samples were between 0.11 to 4.89 mg/kg.
< The 9/27/84, 10/11/89, and 10/28/93 samples showed a wide variation in concentration.
< The samples above detection were tested for total PCBs and aroclor 1260.
< The PCB-1260 and total PCB values were very similar for a given date and time.
Virginia State Water Control Board (SWCB)
Sample Type: Water
Water samples were collected on 28 dates. The values shown are the actual values or range of values forthat site and day. If one value is listed for multiple samples, all samples were reported with that value,usually because of detection limits.
• 58 of 102 samples were reported as 0
• 6 samples taken on 07/13/90 at one station were not detected at 0.02 :g/L
• 36 samples were not detected at 0.10 :g/L detection level
• The 2 samples with reported values were collected 05/02/71 and 06/06/71.
Table A-2-15: SWCB PCB Data for Water
Station Location Date CountValue(::g/L)Flag
1BCDR013.29 ROUTE 628 BRIDGE 08/21/79 1 0.00
1BCDR013.29 ROUTE 628 BRIDGE 07/21/80 1 0.00
1BCDR013.29 ROUTE 628 BRIDGE 05/29/85 6 0.10 K
1BCNG003.33 LAKE SHENANDOAH - LAKE CENTER -ALBERMARLE CO.
08/01/89 12 0.10 K
1BCRO000.43 RIVERTON CORP. BRIDGE 07/21/80 1 0.00
1BCST012.32 ROUTE 794 BRIDGE (AUGUSTA COUNTY) 08/15/79 1 0.00
1BCST012.32 ROUTE 794 BRIDGE (AUGUSTA COUNTY) 07/10/80 1 0.00
1BCST012.55 ROUTE 794 BRIDGE 08/15/79 1 0.00
1BCST012.55 ROUTE 794 BRIDGE 07/10/80 1 0.00
1BDRI005.55 LAKE ARROWHEAD - STATION 100' FROM DAMEPAGE CO.
07/31/90 6 0.02 K
1BHKS000.96 ROUTE 648 BRIDGE BELOW LURAY 08/20/79 1 0.00
1BHKS000.96 ROUTE 648 BRIDGE BELOW LURAY 07/08/80 1 0.00
1BHKS006.23 ROUTE 675 BRIDGE IN LURAY 06/06/71 1 0.16

Development of Shenandoah River PCB TMDL
Station Location Date CountValue(::g/L)Flag
A-11
1BLEW002.91 APPROX. 0.3 MILES BELOW RT. 275 BRIDGE 07/10/80 1 0.00
1BLNV000.21 DOWNSTREAM OF RT. 257 BRIDGE 04/23/78 1 0.00
1BLNV000.21 DOWNSTREAM OF RT. 257 BRIDGE 08/06/79 1 0.00
1BLNV000.21 DOWNSTREAM OF RT. 257 BRIDGE 07/01/80 1 0.00
1BMDL001.83 ROUTE 769 BRIDGE 08/15/79 1 0.00
1BMDL001.83 ROUTE 769 BRIDGE 07/10/80 1 0.00
1BMDL036.08 ROUTE 742 BRIDGE 08/15/79 1 0.00
1BMDL036.08 ROUTE 742 BRIDGE 07/10/80 1 0.00
1BNFS000.57 APPROX. 0.1 MILE BELOW RT. 340/522 BRIDGE 08/21/79 1 0.00
1BNFS000.57 APPROX. 0.1 MILE BELOW RT. 340/522 BRIDGE 07/21/80 1 0.00
1BNFS000.57 APPROX. 0.1 MILE BELOW RT. 340/522 BRIDGE 05/29/85 6 0.10 K
1BNFS010.34 RT. 55 BRIDGE WARREN/SHENANDOAH COUNTY 08/21/79 1 0.00
1BNFS010.34 RT. 55 BRIDGE WARREN/SHENANDOAH COUNTY 07/21/80 1 0.00
1BNFS070.67 ROUTE 698 BRIDGE 04/23/79 1 0.00
1BNFS070.67 ROUTE 698 BRIDGE 08/06/79 1 0.00
1BNFS070.67 ROUTE 698 BRIDGE 07/01/80 1 0.00
1BNFS081.42 RT. 617/953 BRIDGE, W OF NEW MARKET 04/23/79 1 0.00
1BNFS081.42 RT. 617/953 BRIDGE, W OF NEW MARKET 08/06/79 1 0.00
1BNFS081.42 RT. 617/953 BRIDGE, W OF NEW MARKET 07/01/80 1 0.00
1BNFS093.53 ROUTE 259 BRIDGE 04/23/79 1 0.00
1BNFS093.53 ROUTE 259 BRIDGE 08/06/79 1 0.00
1BNFS093.53 ROUTE 259 BRIDGE 07/01/80 1 0.00
1BNTH014.08 RT. 693 AT QUARRY DOWNSTREAM FROM GAGINGSTATION
09/27/79 1 0.00
1BNTH014.08 RT. 693 AT QUARRY DOWNSTREAM FROM GAGINGSTATION
07/10/80 1 0.00
1BNTH045.36 STATION A1 - NEAR THE DAM - AUGUSTACOUNTY
06/21/88 6 0.10 K
1BPSG001.36 RT. 55 BRIDGE 08/21/79 1 0.00
1BPSG001.36 RT. 55 BRIDGE 07/21/80 1 0.00
1BSHN022.63 RT. 7 BRIDGE, CASTLEMANS FERRY BRIDGE 08/30/79 1 0.00
1BSHN022.63 RT. 7 BRIDGE, CASTLEMANS FERRY BRIDGE 07/14/80 1 0.00
1BSHN038.27 RT. 50 BRIDGE 05/02/71 1 0.10
1BSKD003.18 STATION A1 - NEAR THE DAM - ROCKINGHAMCOUNTY
06/28/88 6 0.10 K
1BSMT004.60 RT. 620 BRIDGE 04/23/79 1 0.00
1BSMT004.60 RT. 620 BRIDGE 08/06/79 1 0.00
1BSMT004.60 RT. 620 BRIDGE 07/01/80 1 0.00
1BSSF000.58 APPROX. 0.4 MILE BELOW RT340/522 BRIDGE 08/20/79 1 0.00
1BSSF000.58 APPROX. 0.4 MILE BELOW RT340/522 BRIDGE 07/08/80 1 0.00
1BSSF003.56 RT. 619 BRIDGE AT GAGING STATION 08/20/79 1 0.00
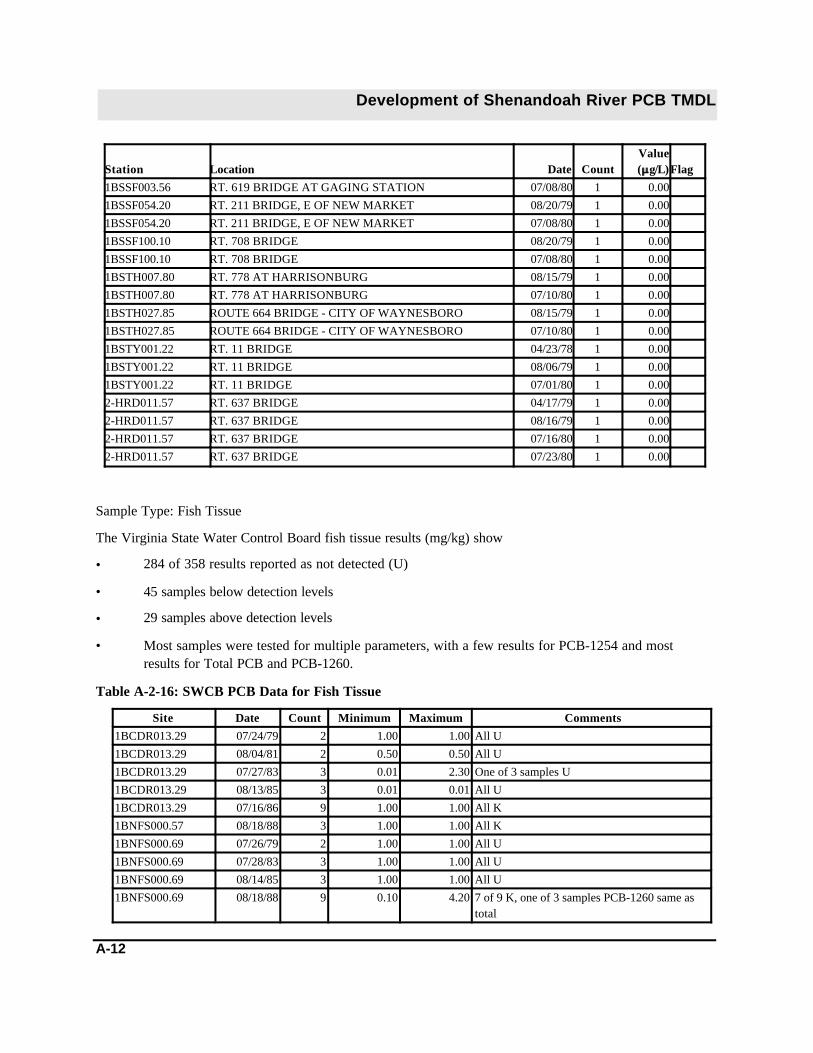
Development of Shenandoah River PCB TMDL
Station Location Date CountValue(::g/L)Flag
A-12
1BSSF003.56 RT. 619 BRIDGE AT GAGING STATION 07/08/80 1 0.00
1BSSF054.20 RT. 211 BRIDGE, E OF NEW MARKET 08/20/79 1 0.00
1BSSF054.20 RT. 211 BRIDGE, E OF NEW MARKET 07/08/80 1 0.00
1BSSF100.10 RT. 708 BRIDGE 08/20/79 1 0.00
1BSSF100.10 RT. 708 BRIDGE 07/08/80 1 0.00
1BSTH007.80 RT. 778 AT HARRISONBURG 08/15/79 1 0.00
1BSTH007.80 RT. 778 AT HARRISONBURG 07/10/80 1 0.00
1BSTH027.85 ROUTE 664 BRIDGE - CITY OF WAYNESBORO 08/15/79 1 0.00
1BSTH027.85 ROUTE 664 BRIDGE - CITY OF WAYNESBORO 07/10/80 1 0.00
1BSTY001.22 RT. 11 BRIDGE 04/23/78 1 0.00
1BSTY001.22 RT. 11 BRIDGE 08/06/79 1 0.00
1BSTY001.22 RT. 11 BRIDGE 07/01/80 1 0.00
2-HRD011.57 RT. 637 BRIDGE 04/17/79 1 0.00
2-HRD011.57 RT. 637 BRIDGE 08/16/79 1 0.00
2-HRD011.57 RT. 637 BRIDGE 07/16/80 1 0.00
2-HRD011.57 RT. 637 BRIDGE 07/23/80 1 0.00
Sample Type: Fish Tissue
The Virginia State Water Control Board fish tissue results (mg/kg) show
• 284 of 358 results reported as not detected (U)
• 45 samples below detection levels
• 29 samples above detection levels
• Most samples were tested for multiple parameters, with a few results for PCB-1254 and mostresults for Total PCB and PCB-1260.
Table A-2-16: SWCB PCB Data for Fish Tissue
Site Date Count Minimum Maximum Comments
1BCDR013.29 07/24/79 2 1.00 1.00 All U
1BCDR013.29 08/04/81 2 0.50 0.50 All U
1BCDR013.29 07/27/83 3 0.01 2.30 One of 3 samples U
1BCDR013.29 08/13/85 3 0.01 0.01 All U
1BCDR013.29 07/16/86 9 1.00 1.00 All K
1BNFS000.57 08/18/88 3 1.00 1.00 All K
1BNFS000.69 07/26/79 2 1.00 1.00 All U
1BNFS000.69 07/28/83 3 1.00 1.00 All U
1BNFS000.69 08/14/85 3 1.00 1.00 All U
1BNFS000.69 08/18/88 9 0.10 4.20 7 of 9 K, one of 3 samples PCB-1260 same astotal

Development of Shenandoah River PCB TMDL
Site Date Count Minimum Maximum Comments
A-13
1BNFS000.69 09/12/90 9 1.00 1.00 All U
1BNFS005.33 09/12/90 25 1.00 1.00 All U
1BNFS037.89 09/13/90 27 1.00 1.00 All U
1BSHN022.63 07/16/87 9 1.00 5.20 3 samples, 3 tests, PCB-1260 same as total,PCB-1254 was ND
1BSHN022.63 06/05/90 27 0.50 4.40 All U
1BSHN022.63 07/16/92 26 1.00 1.00 All U
1BSHN038.48 06/05/90 27 0.50 7.50 All U
1BSHN048.00 06/06/90 27 0.50 9.70 All U
1BSHN052.03 07/14/92 18 1.00 1.00 All U
1BSHN053.02 06/06/90 27 0.50 18.00 All U
1BSSF000.19 08/17/88 3 2.40 12.00 1 sample 3 tests
1BSSF000.58 07/26/79 4 1.00 1.00 All U
1BSSF000.58 07/28/83 3 0.01 0.01 All U
1BSSF000.58 08/14/85 3 0.01 0.01 All U
1BSSF000.58 08/16/88 3 3.00 21.00 1 sample 3 tests
1BSSF000.58 08/17/88 9 1.00 110.00 3 samples, 3 tests, PCB-1254 ND 2 of 3
1BSSF000.58 06/06/90 27 0.50 50.00 3 samples, 9 tests, 7 tests all ND
1BSSF000.58 07/14/92 18 1.00 1.00 All U
1BSSF003.50 07/16/92 27 1.00 1.00 All U
The 13 stations for the fish tissue data are as follows:
Table A-2-17: SWCB Stations Recording Fish Tissue Data
Agency Station Location
21VASWCB 1BCDR013.29 ROUTE 628 BRIDGE
21VASWCB 1BNFS000.57 APPROX. 0.1 MILE BELOW RT. 340/522 BRIDGE
21VASWCB 1BNFS000.69 UPSTREAM FROM DAM
21VASWCB 1BNFS005.33 AT CONFLUENCE OF PASSAGE CREEK
21VASWCB 1BNFS037.89 ROUTE 663 BRIDGE
21VASWCB 1BSHN022.63 RT. 7 BRIDGE, CASTLEMANS FERRY BRIDGE
21VASWCB 1BSHN038.48 AT RT. 17.50 BRIDGE
21VASWCB 1BSHN048.00 RT. 624 BRIDGE
21VASWCB 1BSHN052.03 POWER POOL (WARREN CO)
21VASWCB 1BSHN053.02 DOWNSTREAM OF FRONT ROYAL COUNTRY CLUB
21VASWCB 1BSSF000.19 APPROX. 0.4 MILE BELOW RT340/522 BRIDGE
21VASWCB 1BSSF000.58 APPROX. 0.4 MILE BELOW RT340/522 BRIDGE
21VASWCB 1BSSF003.50 DGIF BOAT LAUNCH LURAY AVE - WARREN COUNTY
Sample Type: Sediment

Development of Shenandoah River PCB TMDL
A-14
• Sediments were collected on 45 dates and at 90 stations
• The combination results in 143 station/date combinations
• 133 of 146 samples were below detection or reported as 0
• 6 of the 13 samples above the detection limits were reported at 500 :g/kg
• 7 of the 13 samples above the detection limits were reported at 1000 :g/kg
• Detection limits for all samples ranged between 20 :g/kg in 1996 to 1000 :g/kg in 1988
• The majority of the samples above detection limits were collected in July 1991
The table below shows the data for the stations where samples above the detection limit were found.
Table A-2-18: SWCB Stations With Samples Above Detection Limit
Station Location DateValue
(::g/kg) Flag
1BCNG003.33 LAKE SHENANDOAH - LAKE CENTER - ALBERMARLECO.
08/01/89 1000.0 K
1BCNG003.33 LAKE SHENANDOAH - LAKE CENTER - ALBERMARLECO.
08/01/89 1000.00
1BCRO000.43 RIVERTON CORP. BRIDGE 07/23/91 500.00
1BCRO000.43 RIVERTON CORP. BRIDGE 07/25/96 30.00 U
1BCST012.32 ROUTE 794 BRIDGE (AUGUSTA COUNTY) 07/01/91 1000.00
1BDRI005.55 LAKE ARROWHEAD - STATION 100' FROM DAME PAGECO.
07/31/90 1000.00
1BDUR003.36 ROUTE 752 BRIDGE 07/02/91 1000.00
1BMDD000.40 ROUTE 737 BRIDGE 07/02/91 1000.00
1BMDD000.40 ROUTE 737 BRIDGE 06/18/96 30.00 U
1BMDD005.15 ROUTE 875 BRIDGE 07/02/91 1000.00
1BNFS000.57 APPROX. 0.1 MILE BELOW RT. 340/522 BRIDGE 07/23/91 500.00
1BNFS000.57 APPROX. 0.1 MILE BELOW RT. 340/522 BRIDGE 07/24/96 30.00 U
1BSHN022.63 RT. 7 BRIDGE, CASTLEMANS FERRY BRIDGE 06/05/90 180.00 U
1BSHN022.63 RT. 7 BRIDGE, CASTLEMANS FERRY BRIDGE 07/23/91 500.00
1BSHN022.63 RT. 7 BRIDGE, CASTLEMANS FERRY BRIDGE 07/16/92 500.00 U
1BSHN022.63 RT. 7 BRIDGE, CASTLEMANS FERRY BRIDGE 07/24/96 30.00 U
1BSHN048.00 RT. 624 BRIDGE 06/06/90 250.00 U
1BSHN048.00 RT. 624 BRIDGE 07/23/91 500.00
1BSHN048.00 RT. 624 BRIDGE 07/24/96 30.00 U
1BSSF000.19 APPROX. 0.4 MILE BELOW RT340/522 BRIDGE 07/23/91 500.00
1BSSF000.19 APPROX. 0.4 MILE BELOW RT340/522 BRIDGE 07/24/96 30.00 U
1BSTH027.85 ROUTE 664 BRIDGE - CITY OF WAYNESBORO 07/01/91 1000.00
1BSTH027.85 ROUTE 664 BRIDGE - CITY OF WAYNESBORO 07/22/96 20.00 U
2-HRD011.57 RT. 637 BRIDGE 07/24/91 500.00
2-HRD011.57 RT. 637 BRIDGE 08/19/96 30.00 U

Development of Shenandoah River PCB TMDL
A-15
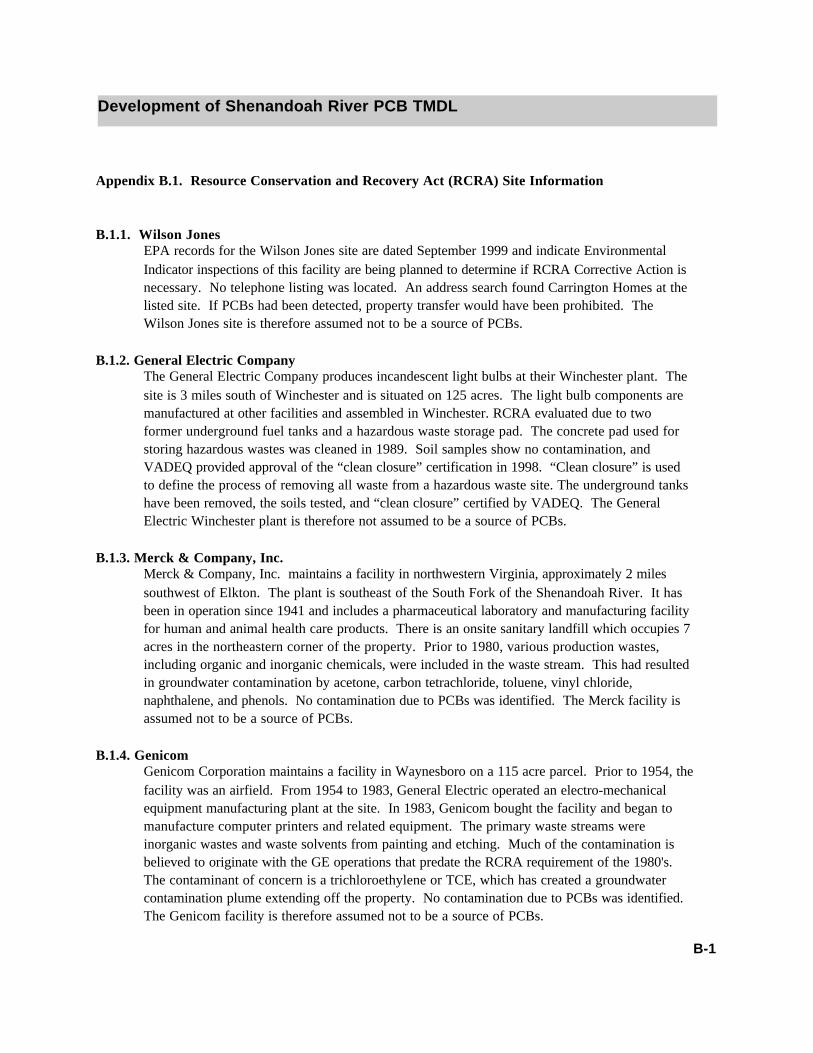
Development of Shenandoah River PCB TMDL
B-1
Appendix B.1. Resource Conservation and Recovery Act (RCRA) Site Information
B.1.1. Wilson JonesEPA records for the Wilson Jones site are dated September 1999 and indicate EnvironmentalIndicator inspections of this facility are being planned to determine if RCRA Corrective Action isnecessary. No telephone listing was located. An address search found Carrington Homes at thelisted site. If PCBs had been detected, property transfer would have been prohibited. TheWilson Jones site is therefore assumed not to be a source of PCBs.
B.1.2. General Electric CompanyThe General Electric Company produces incandescent light bulbs at their Winchester plant. Thesite is 3 miles south of Winchester and is situated on 125 acres. The light bulb components aremanufactured at other facilities and assembled in Winchester. RCRA evaluated due to twoformer underground fuel tanks and a hazardous waste storage pad. The concrete pad used forstoring hazardous wastes was cleaned in 1989. Soil samples show no contamination, andVADEQ provided approval of the “clean closure” certification in 1998. “Clean closure” is usedto define the process of removing all waste from a hazardous waste site. The underground tankshave been removed, the soils tested, and “clean closure” certified by VADEQ. The GeneralElectric Winchester plant is therefore not assumed to be a source of PCBs.
B.1.3. Merck & Company, Inc.Merck & Company, Inc. maintains a facility in northwestern Virginia, approximately 2 milessouthwest of Elkton. The plant is southeast of the South Fork of the Shenandoah River. It hasbeen in operation since 1941 and includes a pharmaceutical laboratory and manufacturing facilityfor human and animal health care products. There is an onsite sanitary landfill which occupies 7acres in the northeastern corner of the property. Prior to 1980, various production wastes,including organic and inorganic chemicals, were included in the waste stream. This had resultedin groundwater contamination by acetone, carbon tetrachloride, toluene, vinyl chloride,naphthalene, and phenols. No contamination due to PCBs was identified. The Merck facility isassumed not to be a source of PCBs.
B.1.4. GenicomGenicom Corporation maintains a facility in Waynesboro on a 115 acre parcel. Prior to 1954, thefacility was an airfield. From 1954 to 1983, General Electric operated an electro-mechanicalequipment manufacturing plant at the site. In 1983, Genicom bought the facility and began tomanufacture computer printers and related equipment. The primary waste streams wereinorganic wastes and waste solvents from painting and etching. Much of the contamination isbelieved to originate with the GE operations that predate the RCRA requirement of the 1980's. The contaminant of concern is a trichloroethylene or TCE, which has created a groundwatercontamination plume extending off the property. No contamination due to PCBs was identified. The Genicom facility is therefore assumed not to be a source of PCBs.

Development of Shenandoah River PCB TMDL
B-2
B.1.5. Wagner ElectricWagner Electric, which is listed as Federal Mogul Friction Products on the Region 3 RCRISsystem, is involved in the manufacturing of automotive products including brake linings. No directdischarges to the surface water exist, but there are releases to the sewer, air, and land. TheEnvirofacts report for the facility lists asbestos, metals, and solvents as the waste streams. Thesolvents listed were methyl ethyl ketone, phenol, and toluene. Based on this information, there isno reason to include this facility in the list of possible PCB sources in the Shenandoah watershed.
B.1.6. DuPont De NemoursDuPont De Nemours maintains a facility in Waynesboro that produces manmade organic fabrics,synthetic resins, and plastics materials. The facility began manufacturing acetate yarn in 1929and continued until 1990. Current production products include Lycra and BCF Nylon. The 177acre site is in the southeastern portion of Waynesboro, in an industrial zone. There areapproximately twenty Solid Waste Management Units on the site. The Envirofacts reportsavailable on the Web include the NPDES monitoring requirements. The monitoring requirementsinclude numerous organic chemicals. The RCRA website lists volatile organic compounds, semi-volatile organic compounds, and mercury as the main pollutants of concern for the site. Based onthis information, there is no reason to include the DuPont facility as a source of PCBs.

Development of Shenandoah River PCB TMDL
B-3
Appendix B.2. CERCLA Sites Information
B.2.1. BFI Kwik Klean Sanitary Landfill The BFI Kwik Klean sanitary landfill is an inactive 15-acre landfill located in Berryville, Virginia. The site is located on Route 612 off of Route 7 and was active from 1969 - 1981. The sitereceived both residential and industrial wastes. It was cited in the past for discharging leachateinto local surface waters. The facility was partially capped upon closure. Soils, streams,discharge springs and seeps were sampled as part of the 1985 Site Inspection.
Waste types received at the landfill from 1969 through 1972 are unknown and records do notexist. BFI purchased the facility in 1972, and from that point on, records were maintained. From1972 - 1980, 70 percent of the waste received was from residential sources (Warren andFrederick Counties). The remainder of the waste consisted of commercial wastes from CapitolRecords and Rubber Maid, asbestos from Abex Corp. (brake manufacturer), carbon disulfide (abyproduct generated by Visco during rayon production), and municipal sewage sludge fromSeneca sludge.
The site operated under State Landfill permit #197. VA SWCB issued a no discharge certificate(IW-ND-537) in 1976, because of leachate being discharged to an unnamed tributary on site. The certificate was revoked in 1981 when VA SWCB sampling revealed the problem wasaddressed.
A stream which originates onsite from a spring, flows through the site, discharging into a sedimentpond. The pond discharges to the Shenandoah River. Sediment and aqueous samples were takenfrom the spring, the leachate, the culvert into the pond, and the culvert outlet for the pond. NoPCBs were detected in these samples. Hexanone, 4-methyl-2-petanone, isophorone, acetone,Trichloroethylene (TCE), 2-methylphenol, 2,4-dimethylphenol, benzyl alcohol, ethylbenzene,toluene, carbon disulfide were all detected at levels below a health concern. No metals weredetected at levels that would pose a health concern. It was deemed that no further action waswarranted (NFRAP).
B.2.2. Stauffer Chemical CompanyThe Stauffer Chemical Company site is a former carbon disulfide manufacturing plant,approximately 26 acres in size, located in Bentonville, Warren County, Virginia. The site islocated at the end of Bubb Lane approximately 0.2 miles southeast of the intersection of Route340 and 613. It consists of a 13-acre storage and production area and a 13-acre brick dump andacid pond. The acid pond was constructed after production ceased and received runoff from thebrick dump and production area. Also there are two 5,000 square foot carbon disulfide pits.
The facility operated from 1945-1957 as a carbon disulfide manufacturing plant. It produced 40tons per day of carbon disulfide and 20 tons per day of sodium hydrosulfide (by-product). Raw
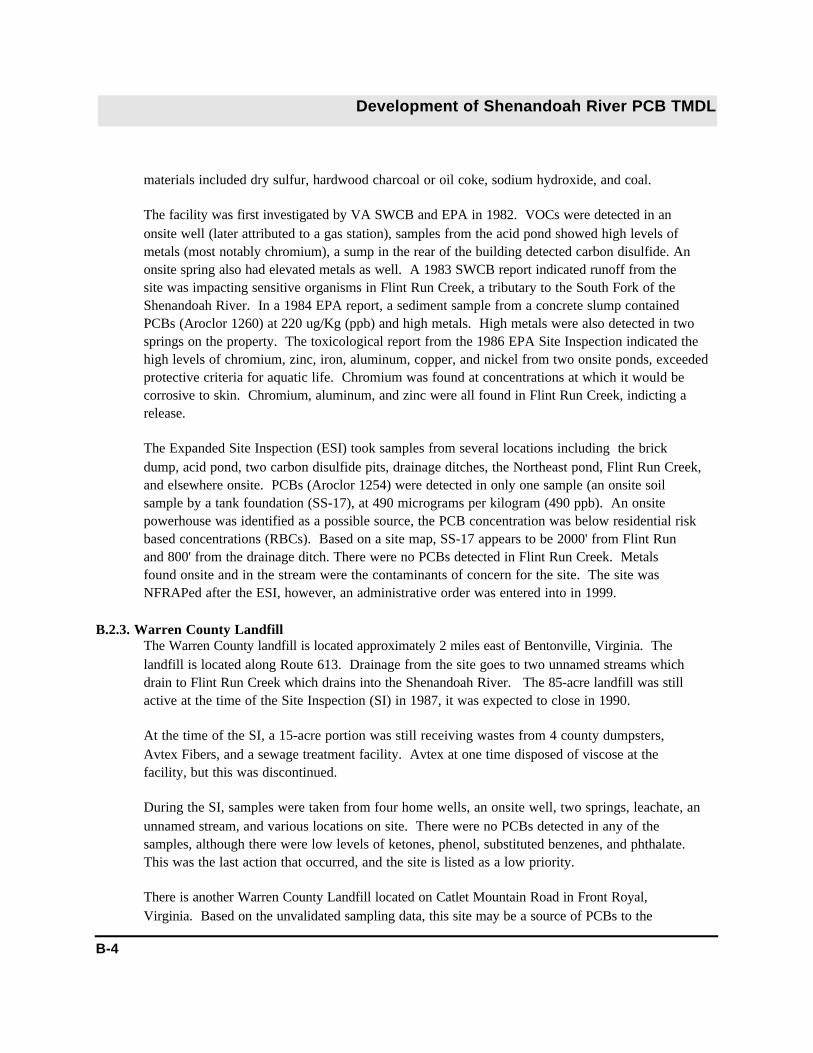
Development of Shenandoah River PCB TMDL
B-4
materials included dry sulfur, hardwood charcoal or oil coke, sodium hydroxide, and coal.
The facility was first investigated by VA SWCB and EPA in 1982. VOCs were detected in anonsite well (later attributed to a gas station), samples from the acid pond showed high levels ofmetals (most notably chromium), a sump in the rear of the building detected carbon disulfide. Anonsite spring also had elevated metals as well. A 1983 SWCB report indicated runoff from thesite was impacting sensitive organisms in Flint Run Creek, a tributary to the South Fork of theShenandoah River. In a 1984 EPA report, a sediment sample from a concrete slump containedPCBs (Aroclor 1260) at 220 ug/Kg (ppb) and high metals. High metals were also detected in twosprings on the property. The toxicological report from the 1986 EPA Site Inspection indicated thehigh levels of chromium, zinc, iron, aluminum, copper, and nickel from two onsite ponds, exceededprotective criteria for aquatic life. Chromium was found at concentrations at which it would becorrosive to skin. Chromium, aluminum, and zinc were all found in Flint Run Creek, indicting arelease.
The Expanded Site Inspection (ESI) took samples from several locations including the brickdump, acid pond, two carbon disulfide pits, drainage ditches, the Northeast pond, Flint Run Creek,and elsewhere onsite. PCBs (Aroclor 1254) were detected in only one sample (an onsite soilsample by a tank foundation (SS-17), at 490 micrograms per kilogram (490 ppb). An onsitepowerhouse was identified as a possible source, the PCB concentration was below residential riskbased concentrations (RBCs). Based on a site map, SS-17 appears to be 2000' from Flint Runand 800' from the drainage ditch. There were no PCBs detected in Flint Run Creek. Metalsfound onsite and in the stream were the contaminants of concern for the site. The site wasNFRAPed after the ESI, however, an administrative order was entered into in 1999.
B.2.3. Warren County LandfillThe Warren County landfill is located approximately 2 miles east of Bentonville, Virginia. Thelandfill is located along Route 613. Drainage from the site goes to two unnamed streams whichdrain to Flint Run Creek which drains into the Shenandoah River. The 85-acre landfill was stillactive at the time of the Site Inspection (SI) in 1987, it was expected to close in 1990.
At the time of the SI, a 15-acre portion was still receiving wastes from 4 county dumpsters,Avtex Fibers, and a sewage treatment facility. Avtex at one time disposed of viscose at thefacility, but this was discontinued.
During the SI, samples were taken from four home wells, an onsite well, two springs, leachate, anunnamed stream, and various locations on site. There were no PCBs detected in any of thesamples, although there were low levels of ketones, phenol, substituted benzenes, and phthalate. This was the last action that occurred, and the site is listed as a low priority.
There is another Warren County Landfill located on Catlet Mountain Road in Front Royal,Virginia. Based on the unvalidated sampling data, this site may be a source of PCBs to the

Development of Shenandoah River PCB TMDL
B-5
Shenandoah River. This information has been furnished to EPA’s Hazardous Site CleanupDivision, the Town of Front Royal, and Warren County.
B.2.4. Racon Dump SiteIn August of 1992, four containers labeled “Racon-11" (trade name for trichlorofluoromethane)were found dumped along State Route 660 in Clarke County, Virginia. On May 3, 1993 theCommonwealth of Virginia contacted EPA about the situation and requested federal assistance toproperly sample, transport, and dispose of the four drums. One composite sample was sent outfor analysis, and it indicated the drums contained a high level (88.8%) of trichlorofluormethane. On November 15, 1993, the drums were transported to the manufacturer in Wichita, KS. No siteassessment actions have taken place.
B.2.5. Aspen Hills QuarryThe Aspen Hills Quarry is located on State Route 643, in Front Royal, Warren County, Virginiaand occupies a 65-acre tract of land. An integrated assessment was initiated by a citizen’s reportthat alleged dumping on the property. The complaint alleged that materials from the Avtex site,that were suspected of being hazardous or containing PCBs, were dumped in and on the quarryarea.
A multimedia sampling event was conducted on October 29, 1997. A total of 5 soil, 3 water, and3 sediment samples were collected and analyzed for volatile organics, semivolatile organics,pesticides and PCBs, and metals. All of the samples were collected from areas of suspectedcontamination with the goal of confirming the presence of hazardous substances. Iron was theonly contaminant detected above risk-based concentrations. There were no PCBs detected, andthe site was NFRAPed.
B.2.6. Allied CorporationAllied Corporation is located in Front Royal, Warren County, Virginia. Around 1944, AlliedCorporation bought the land from a farmer and began sulfuric acid production. The site had twoonsite landfills where process wastes were stored, an onsite containment pond (used to adjust thepH and temperature of non-contact cooling waters), an intermittent stream which discharged thewater in the containment pond to the Shenandoah River (this was a permitted discharge), twoadditional inactive holding ponds, and a compressor which was manufactured in 1944 (which wasused to unload sulfuric acid from rail cars).
As part of the 1988 Site Inspection, a total of seven samples were taken from the drainage ditch,onsite ponds, and the intermittent stream. There were elevated concentrations of several organicand inorganic compounds. PCBs (Aroclor 1254) were detected in two samples, one from theintermittent stream that discharges to the South Fork of the Shenandoah and the other in thecontainment pond, at 3.1 and 4.3 mg/L, respectively. The 1988 report states that “a concentrationof 0.79 ng/L in water could result in a PCB concentration in fish tissue that would pose a one-in-

Development of Shenandoah River PCB TMDL
B-6
one-million cancer risk if consumed regularly. This concentration could easily be exceeded inwater draining form the site given the sediment concentrations.”
B.2.7. Page County LandfilThe 25-acre Page County landfill is located on Eldon Yates Drive in Stanley, Page County,Virginia. The landfill began operating in 1973 and was still active at the time of the SiteInspection in 1988. At the time of the SI, the manager stated that the facility had never receivedhazardous or industrial wastes, accepting only municipal wastes. At the time of the 1988 SI ,thefacility consisted of a closed cell (vegetated mound), an active cell that was covered with 2 feetof clay daily (a separate mound), and an open pit. None of the cells are lined.
Stoney Run is located adjacent to the site approximately 0.25 miles from the western border. This stream meets the South Fork of the Shenandoah approximately 4 miles northwest of the site. There were no samples taken for either the Preliminary Assessment or Site Inspection. If thesite has only received municipal waste, the risk of PCB contamination is small. This site isassumed to not contain PCBs.
B.2.8. Virginia Oak TanneryVirginia Oak Tannery is located on Route 340 in Luray, Page County, Virginia. Virginia OakTannery produces finished leather for shoes and other leather goods. It historically was involvedin vegetable and mineral tanning of hides, which resulted in waste streams high in BOD, TSS, andchromium. The facility also used Direct Black 38, a dye which contains benzidine. Thedischarge from the facility’s waste treatment plant degraded the water quality of the receivingstream, Hawksbill Creek, causing two separate fish kills (8/70, 8/76) . Hawksbill Creek is atributary to the Shenandoah.
In 1980, a new owner took over the facility and the resulting waste streams were eliminated. Sludges from the process lagoons were de-watered and buried in an on-site landfill. The facilityshut down all tanning operations in 1980 and connected to the POTW. The site was NFRAPedafter an SI in 1982 Samples were taken from Hawksbill Creek as part of the SI. Based on areview of site files it appears as though only aqueous samples were analyzed. There were noPCBs detected as part of the sampling, although no sediment samples were taken. There wereelevated levels of Tetrachloroethylene (PCE) (in an onsite well) and some inorganics.
B.2.9. Chemstone Corporation Chemstone Corporation is located on Route 638 in Strassburg, Shenandoah County, Virginia. Chemstone operates a limestone quarry near Oranda in Northern Shenandoah County, Virginia.A small tributary flows into Cedar Creek, which flows into the North Fork of the Shenandoah. The facility operations began in the early 1900s.There is a disposal area in the northern section ofthe site for spillage and bag house dust. The site was NFRAPed after a Preliminary Assessment(PA) in 1987.
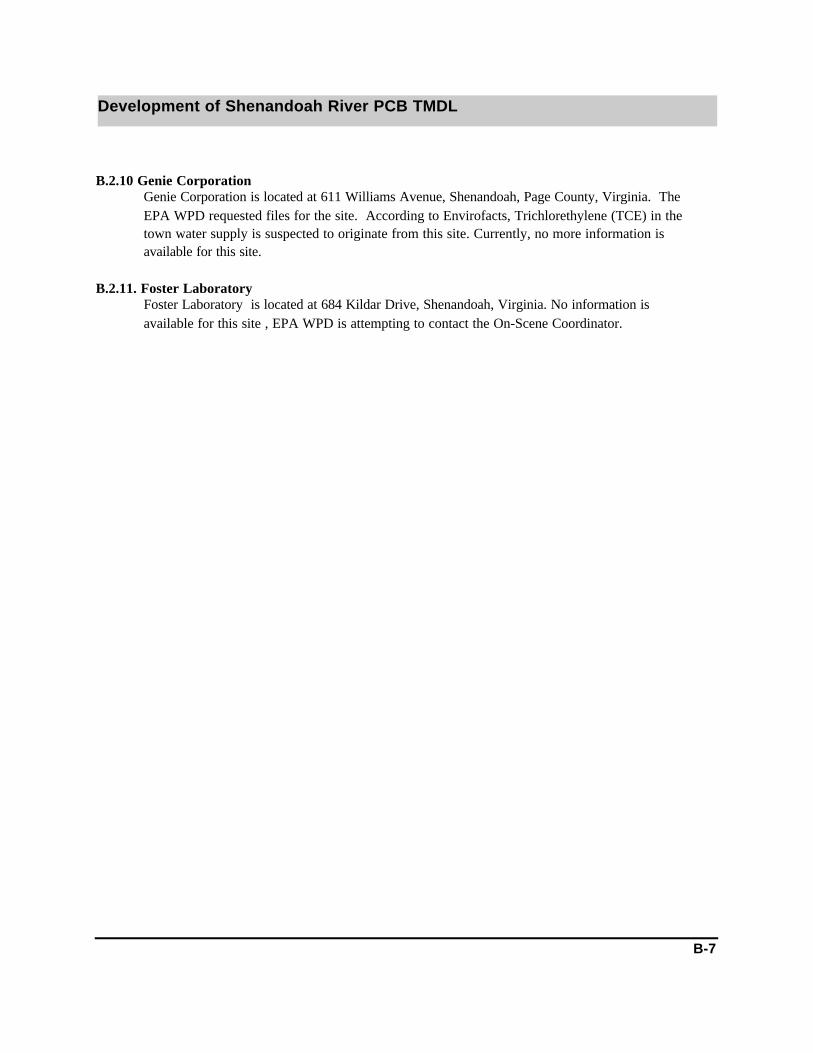
Development of Shenandoah River PCB TMDL
B-7
B.2.10 Genie Corporation Genie Corporation is located at 611 Williams Avenue, Shenandoah, Page County, Virginia. TheEPA WPD requested files for the site. According to Envirofacts, Trichlorethylene (TCE) in thetown water supply is suspected to originate from this site. Currently, no more information isavailable for this site.
B.2.11. Foster LaboratoryFoster Laboratory is located at 684 Kildar Drive, Shenandoah, Virginia. No information isavailable for this site , EPA WPD is attempting to contact the On-Scene Coordinator.

Development of Shenandoah River PCB TMDL
Appendix C - PCS - Industrial Facilities
C-1
NPDES FACILITY NAME CITY NAME RECEIVING WATERBODY
WV0005517REPUBLIC PAPERBOARDCOMPANY OF WV HALLTOWN
WV0022349 CHARLES TOWN, CITY OF CHARLES TOWN EVITTS RUN
WV0039136 Harpers Ferry-Bolivar PSD HARPERS FERRY SHENANDOAH RIVER
WV0088757 CHARLES TOWN RACES, INC. CHARLES TOWN FLOWING SPRINGS RUN
WV0103691DIXIE D. KILHAM HARPERS FERRYCAVERNS MHP
WV0105155 ALEX RAHMI UNIWEST STP CHARLES TOWN POTOMAC/SHENANDOAH
WV0087858 JEFFERSON CO. BD. OF EDUCATION
WV0100757JEFFERSON CO. BD. OFEDUCATIONBlue Ridge Elementary
WV0104370SYLVAN DEV. LTD., LIAB.CO.LOCUST HILL STP CHARLES TOWN EVITTS RUN
WV0085677SANITARY ASSOCIATES, INC.SHENDO, INC. CHARLES TOWN SHENANDOAH RIVER
WV0086452 Willow Springs PSC CHARLES TOWN CATTAIL RUN
WV0088013TUSCAWILLA UTILITIESTUSCAWILLA UTILITIES SUBD. CHARLES TOWN EVITTS RUN
VA0002160E. I. DUPONT DENEMOURS&CO-WAY WAYNESBORO SOUTH RVR
VA0023400COLD SPRINGS CORRECTIONALCENTG, COMM OF GREENVILLE SOUTH RIVER
VA0024732MASSANUTTEN PUBLIC SERVICESTPY HARRISONBURG
QUAIL RUN TO SOUTH FORKSHENANDOAH
VA0058726 HOWELL METAL COMPANY NEW MARKETNORTH FORK SHENANDOAHRIVER
VA0066877AGUSTA COUNTY SVCAUTH-STUARTS STAUNTON SOUTH RIVER
VA0071846 ENDLESS CAVERNS NEW MARKET SMITH CREEK
VA0073644 VALLEY SANITATION, INC. TOMS BROOKNORTH FORK SHENANDOAHRIVER
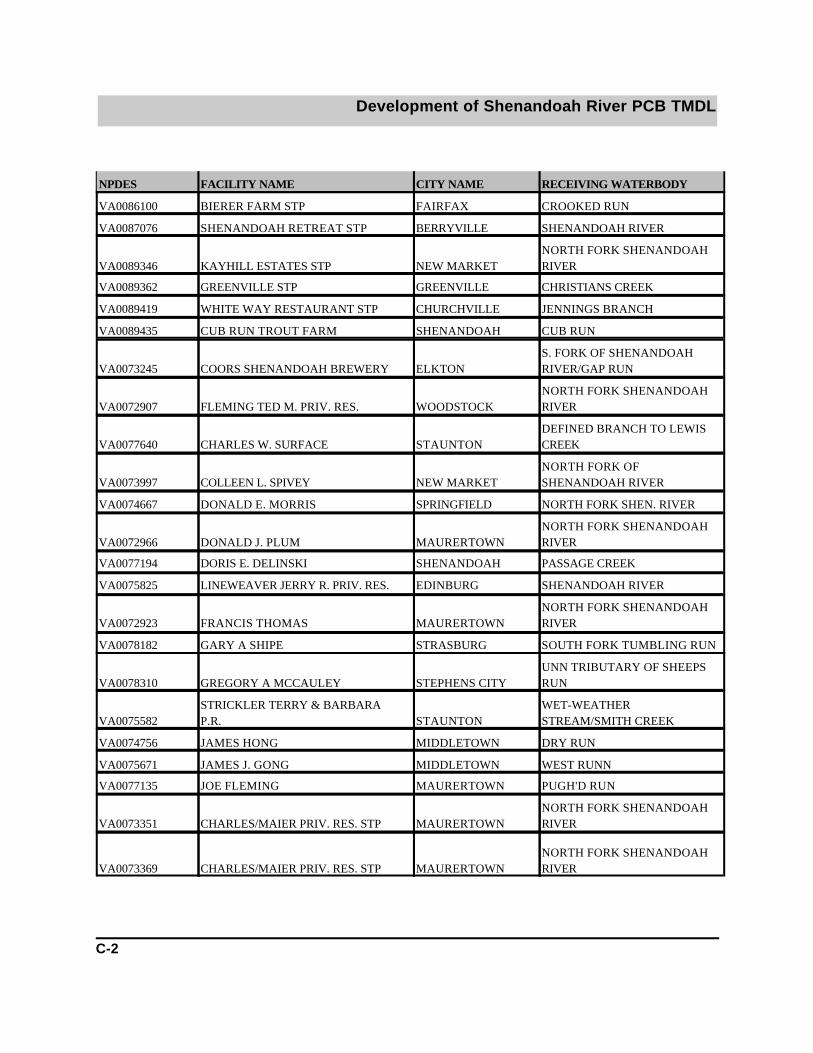
Development of Shenandoah River PCB TMDL
C-2
NPDES FACILITY NAME CITY NAME RECEIVING WATERBODY
VA0086100 BIERER FARM STP FAIRFAX CROOKED RUN
VA0087076 SHENANDOAH RETREAT STP BERRYVILLE SHENANDOAH RIVER
VA0089346 KAYHILL ESTATES STP NEW MARKETNORTH FORK SHENANDOAHRIVER
VA0089362 GREENVILLE STP GREENVILLE CHRISTIANS CREEK
VA0089419 WHITE WAY RESTAURANT STP CHURCHVILLE JENNINGS BRANCH
VA0089435 CUB RUN TROUT FARM SHENANDOAH CUB RUN
VA0073245 COORS SHENANDOAH BREWERY ELKTONS. FORK OF SHENANDOAHRIVER/GAP RUN
VA0072907 FLEMING TED M. PRIV. RES. WOODSTOCKNORTH FORK SHENANDOAHRIVER
VA0077640 CHARLES W. SURFACE STAUNTONDEFINED BRANCH TO LEWISCREEK
VA0073997 COLLEEN L. SPIVEY NEW MARKETNORTH FORK OFSHENANDOAH RIVER
VA0074667 DONALD E. MORRIS SPRINGFIELD NORTH FORK SHEN. RIVER
VA0072966 DONALD J. PLUM MAURERTOWNNORTH FORK SHENANDOAHRIVER
VA0077194 DORIS E. DELINSKI SHENANDOAH PASSAGE CREEK
VA0075825 LINEWEAVER JERRY R. PRIV. RES. EDINBURG SHENANDOAH RIVER
VA0072923 FRANCIS THOMAS MAURERTOWNNORTH FORK SHENANDOAHRIVER
VA0078182 GARY A SHIPE STRASBURG SOUTH FORK TUMBLING RUN
VA0078310 GREGORY A MCCAULEY STEPHENS CITYUNN TRIBUTARY OF SHEEPSRUN
VA0075582STRICKLER TERRY & BARBARAP.R. STAUNTON
WET-WEATHERSTREAM/SMITH CREEK
VA0074756 JAMES HONG MIDDLETOWN DRY RUN
VA0075671 JAMES J. GONG MIDDLETOWN WEST RUNN
VA0077135 JOE FLEMING MAURERTOWN PUGH'D RUN
VA0073351 CHARLES/MAIER PRIV. RES. STP MAURERTOWNNORTH FORK SHENANDOAHRIVER
VA0073369 CHARLES/MAIER PRIV. RES. STP MAURERTOWNNORTH FORK SHENANDOAHRIVER

Development of Shenandoah River PCB TMDL
Appendix C - PCS - Industrial Facilities
Development of Shenandoah River PCB TMDL
C-3
NPDES FACILITY NAME CITY NAME RECEIVING WATERBODY
VA0078271 KIM SMITH TOMS BROOKNORTH FORK SHENANDOAHRIVER
VA0074918 LAWRENCE CRISMAN SHENANDOAH PASSAGE CREEK
VA0075205 DELLINGER/PARSONS PRIV. RES. S SHENANDOAH PASSAGE CREEK
VA0078255 PAT MULLIGAN STEPHENS CITY DRAINAGE WAY TO POND
VA0077097 MOYA ALEJANDRO PRIV. RES. STP WOODSTOCKNORTH FORK SHENANDOAHRIVER
VA0077101 DELLINGER ROBIN VONDELL PRIV. WOODSTOCKNORTH FORK SHENANDOAHRIVER
VA0077143 TERRY O. TAYLOR PORT REPUBLIC TRIB TO DUCK RUN
VA0078379 WILLIAM FLOGAUS SHENANDOAHUNN TRIB TO S. FORKSHENANDOAH RIVE
VA0075817 WILLIAM J. FULCHER SHENANDOAH
VA0077038 GREEN HERBERT PRIV. RES. STP NEW MARKETNORTH FORK SHENANDOAHRIVER
VA0075591 SEYMOUR J. MARK PRIV. RES. S NEW MARKETWET-WEATHERSTREAM/SMITH CREEK
VA0074187 TIBBETTS RICHARD G. PRIV. RES. BASYE
VA0078107 DAN WEIR BENTONVILLEUNN TRIBUTARY OFSHENANDOAH RIVER
VA0075400 TAYLOR M. SMITH BRIDGEWATERTHORNY BR. THEN TO NORTHRIVER
VA0077631 CARL C. LEE BROADWAYPOSITIVE V-DITCH TOWARDWAR BRANCH
VA0074659 CARL ALLMAN DAYTON BRIERY BRANCH
VA0074748 LAM GINA V. PRIV. RES. STPROCKINGHAMCOUNTY
VA0075264 LAM GINA V. PRIV. RES. STP DAYTON DRY RIVER
VA0075281 LAM GINA V. PRIV. RES. STP DAYTON DRY RIVER
VA0075183 SKYLINE RESORT INC. FRONT ROYAL S. FORK/SHENANDOAH RIVER
VA0077941 BERNICE A BOWERS DAYTONUNN TRIBUTARY TO BRIERYCREEK
VA0073041 BETTY D. LAMBERT EDINBURGSTONEY CREEK NORTH FORKSHENANDOAH
VA0073482WELCH RALPH R. SR. & C. REILEYPR EDINBURG
POND ON APPLICANT'SPROPERTY

Development of Shenandoah River PCB TMDL
C-4
NPDES FACILITY NAME CITY NAME RECEIVING WATERBODY
VA0073491WELCH RALPH R. SR. & C. REILEYPR EDINBURG
POND ON APPLICANT'SPROPERTY
VA0075639 JOHN R. BRENEMAN EDINBURG SHEN RIVER (NORTH FOLK)
VA0076163 CREGER ROBERT L. PRIV. RES. EDINBURG FALLS RUN
VA0076911 SULLIVAN NANCY PRIV. RES. STP EDINBURG N/A
VA0078280 WILLIAM CHARLES HAMILTON EDINBURG FARM POND
VA0078638 MARY LOUISE MEADOWS ELKTONUNN TRIBUTARY TO BOONERUN
VA0075752 LIBERTY BAPTIST CHURCH_STPFREDERICKCOUNTY CROOKED RUN
VA0077186 DANIEL SETTLEFREDERICKCOUNTY
TRIBUTARY OF WRIGHT'SRUN
VA0076929 HARRY R. HILL FRONT ROYAL DRY RUN
VA0077950 GRANVILLE J PEARSON FRONT ROYAL CEBIN RUN
VA0078069RUGGLES DANIEL AND NANCYPRIV FRONT ROYAL SHENANDOAH RIVER
VA0078247 RICHARD A FURR FRONT ROYAL SHENANDOAH RIVER
VA0078352 JAMES O DONAHUE FRONT ROYALNORTH FORK SHENANDAHRIVER
VA0078671 REGINALD AND CAROLYN MAJORS FRONT ROYALUNN TRIB PASSAGE CR NFORK SHENAN
VA0072931 MCGAHEYSVILLE WTPHARRISONBURG &ROCKI
SOUTH FORK- SHENANDOAHRIVER
VA0073164 HAZEL K. BROWN LURAY PASS RUN
VA0078743 KENNETH M LOWE LURAY SHENANDOAH RIVER
VA0072770 STEPHEN N. LIVESAY MAURERTOWN PUGH'S RUN
VA0075965 CHARLES S. PARNELL MAURERTOWN
VA0078689 FRANK D SHAW MAURERTOWNNON DISCHARGING FARMPOND
VA0072958 HARRY A. DOWNARD MIDDLETOWN MOLLY BOOTH RUN
VA0075621 THOMAS THACKERMOUNTCRAWFORD
NORTH RIVER/UNNAMEDCREEK
VA0077992 MARK K. & GLENDA C. BUSTER PRIMOUNTCRAWFORD NORTH RIVER
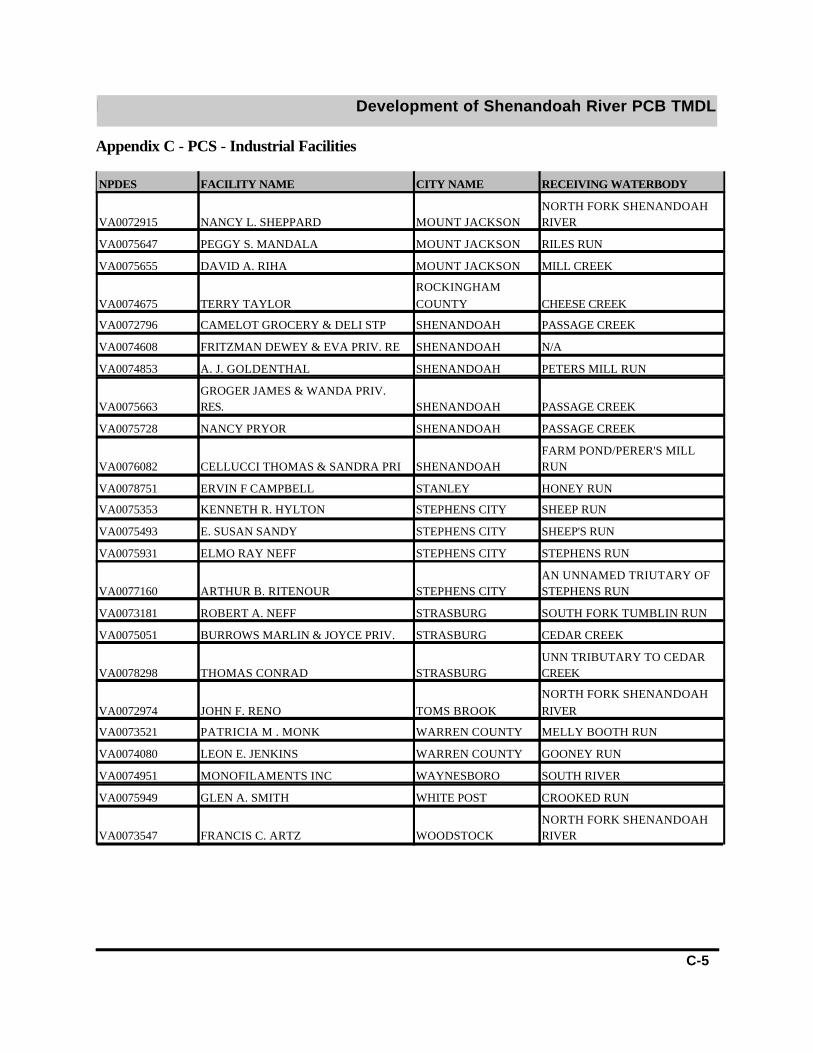
Development of Shenandoah River PCB TMDL
Appendix C - PCS - Industrial Facilities
Development of Shenandoah River PCB TMDL
C-5
NPDES FACILITY NAME CITY NAME RECEIVING WATERBODY
VA0072915 NANCY L. SHEPPARD MOUNT JACKSONNORTH FORK SHENANDOAHRIVER
VA0075647 PEGGY S. MANDALA MOUNT JACKSON RILES RUN
VA0075655 DAVID A. RIHA MOUNT JACKSON MILL CREEK
VA0074675 TERRY TAYLORROCKINGHAMCOUNTY CHEESE CREEK
VA0072796 CAMELOT GROCERY & DELI STP SHENANDOAH PASSAGE CREEK
VA0074608 FRITZMAN DEWEY & EVA PRIV. RE SHENANDOAH N/A
VA0074853 A. J. GOLDENTHAL SHENANDOAH PETERS MILL RUN
VA0075663GROGER JAMES & WANDA PRIV.RES. SHENANDOAH PASSAGE CREEK
VA0075728 NANCY PRYOR SHENANDOAH PASSAGE CREEK
VA0076082 CELLUCCI THOMAS & SANDRA PRI SHENANDOAHFARM POND/PERER'S MILLRUN
VA0078751 ERVIN F CAMPBELL STANLEY HONEY RUN
VA0075353 KENNETH R. HYLTON STEPHENS CITY SHEEP RUN
VA0075493 E. SUSAN SANDY STEPHENS CITY SHEEP'S RUN
VA0075931 ELMO RAY NEFF STEPHENS CITY STEPHENS RUN
VA0077160 ARTHUR B. RITENOUR STEPHENS CITYAN UNNAMED TRIUTARY OFSTEPHENS RUN
VA0073181 ROBERT A. NEFF STRASBURG SOUTH FORK TUMBLIN RUN
VA0075051 BURROWS MARLIN & JOYCE PRIV. STRASBURG CEDAR CREEK
VA0078298 THOMAS CONRAD STRASBURGUNN TRIBUTARY TO CEDARCREEK
VA0072974 JOHN F. RENO TOMS BROOKNORTH FORK SHENANDOAHRIVER
VA0073521 PATRICIA M . MONK WARREN COUNTY MELLY BOOTH RUN
VA0074080 LEON E. JENKINS WARREN COUNTY GOONEY RUN
VA0074951 MONOFILAMENTS INC WAYNESBORO SOUTH RIVER
VA0075949 GLEN A. SMITH WHITE POST CROOKED RUN
VA0073547 FRANCIS C. ARTZ WOODSTOCKNORTH FORK SHENANDOAHRIVER

Development of Shenandoah River PCB TMDL
C-6
NPDES FACILITY NAME CITY NAME RECEIVING WATERBODY
VA0075418 RALPH COFFMAN WOODSTOCK NARROW PASSAGE CREEK
VA0078361 MICHAEL T CODY WOODSTOCK NARROW PASSAGE CREEK
VA0078514 C THOMAS SOLLENBERGER WOODSTOCKUNN TRIB OF NARROWSPASSAGE CREEK
VA0078611 ALLEN R. HOLLAR WOODSTOCK FARM POND
VA0075892 ROBERT C. MARSETT PRIV. RES.
VA0075680HOWARD H. YOUNG RESIDENCESTP
VA0075868 A. OWEN SHIFFLETT PRIV. RES.
VA0001791 ROCCO QUALITY FODDS, INC. TIMBERVILLE N FORK SHNDOAH
VA0089061 WOODLAWN VILLAGE M.H. PARK WAYNESBORO MEADOW RUN
VA0089095 PIONEER TRAILER PARK STEPHENS CITY CROOKED RUN
VA0088994HARRISONBURG-NEW MARKETKOA BROADWAY WAR BRANCH
VA0083305 CAMP OVERLOOK STP KEEZLETOWN MOUNTAIN RUN
VA0086738SOUTH STATES CO-OP., INC.,AUGUSTA STAUNTON CHRISTIANS CREEK
VA0025151WAYNESBORO DEPT OFUTILITIES-STP WAYNESBORO
SOUTH RV SECTION 3SHENANDOAH RV
VA0025291
AUGUSTACTY.SER.AUTH-FISHERSVILLEREGL.STP STAUNTON CHRISTIANS CREEK
VA0062812 FRONT ROYAL, TOWN OF,STP FRONT ROYAL SHENANDOAH RIVER
VA0001864 AILEEN INC, EDINBURG N FORK SHNDOA R
VA0002402 GENICOM CORP. WAYNESBORO SOUTH RIVER
VA0073474 VIRGINIA METALCRAFTERS INC. WAYNESBORO ROCKFISH RUN
VA0001767REYNOLDS METALSCO.-GROTTOES AUGUSTA COUNTY SOUTH RIVER
VA0002313 WAMPLER FOODS-HINTONROCKINGHAMCOUNTY WAR BRANCH
VA0001961 WAMPLER-LONGACRE-ALMA PAGE COUNTY S FORK SHNDOAH

Development of Shenandoah River PCB TMDL
Appendix C - PCS - Industrial Facilities
Development of Shenandoah River PCB TMDL
C-7
NPDES FACILITY NAME CITY NAME RECEIVING WATERBODY
VA0002011ROCKINGHAM POULTRY,BROADWAY TIMBERVILLE N FORK SHNDOAH
VA0060640HARRISONBURG-ROCKINGHAMSEWER AUTH
ROCKINGHAMCOUNTY NORTH RIVER
VA0064793 CITY OF STAUNTON WWTP STAUNTON MIDDLE RIVER
VA0052621MEADOWGOLD DAIRY PRODUCTS,INC STRASBURG SHENANDOAH RIVER
VA0002178MERCK & CO INC STONEWALLPLANT ELKTON S FORK SHNDOAH

Development of Shenandoah River PCB TMDL
D-1
Appendix D: Quality Assurance Project Plan (QAPP)
Due to the voluminous nature of the Quality Assurance Project Plan (QAPP), a copy has notbeen attached to this document. If you would like a copy of this document, please contact EPA RegionIII’s Office of Watersheds program at 215-814-2310.

Development of Shenandoah River PCB TMDL
E-1
Appendix E: Shenandoah Sampling Event Photographs

Development of Shenandoah River PCB TMDL
E-2
Figure E-1: Shenandoah River, Sieving for Clams
Figure E-2: Dog Run, Collecting Water Samples
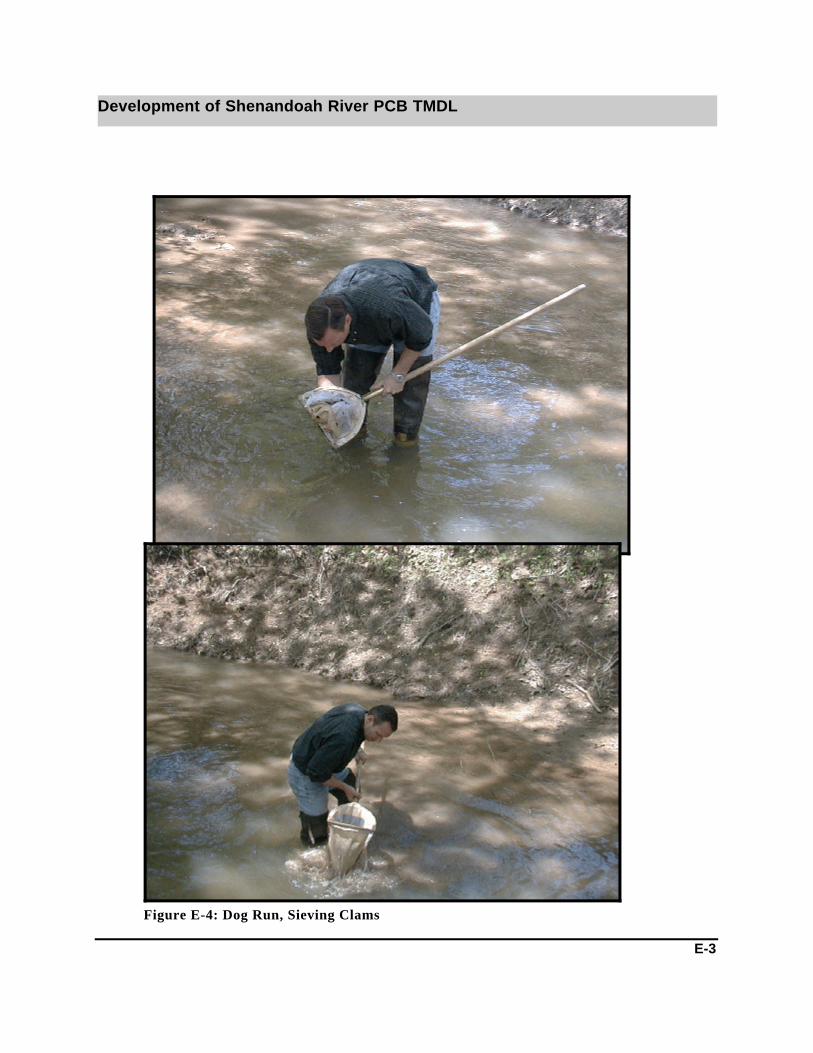
Development of Shenandoah River PCB TMDL
E-3
Figure E-3: Dog Run, Searching for Clams
Figure E-4: Dog Run, Sieving Clams
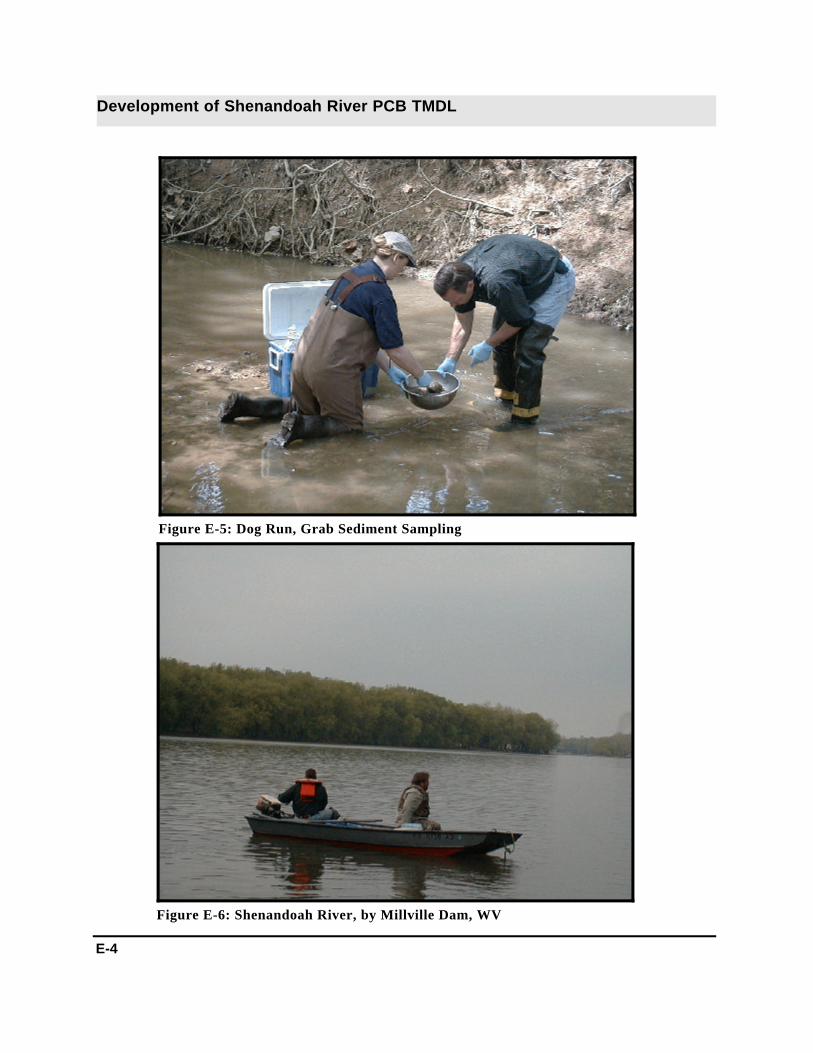
Development of Shenandoah River PCB TMDL
E-4
Figure E-5: Dog Run, Grab Sediment Sampling
Figure E-6: Shenandoah River, by Millville Dam, WV
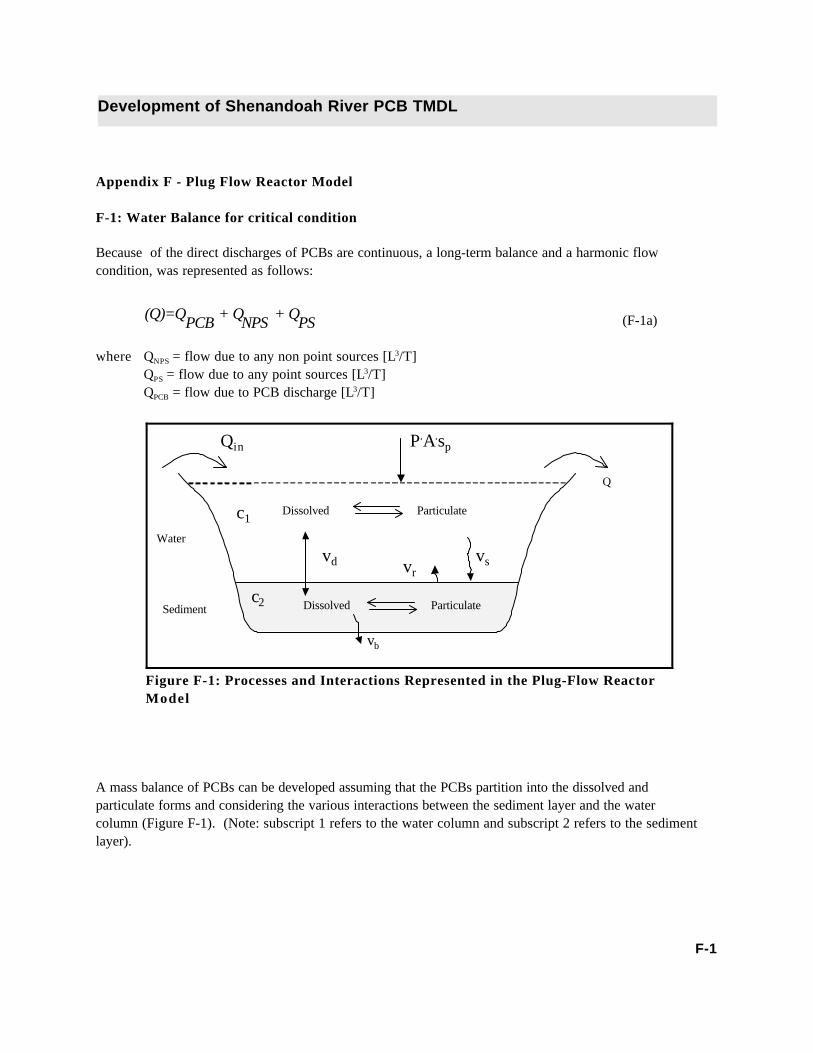
Development of Shenandoah River PCB TMDL
F-1
Sediment
Water
Particulate Dissolved
Q
vs
Particulate Dissolved
c1
c2
vr vd
vb
Qin P.A.sp
Figure F-1: Processes and Interactions Represented in the Plug-Flow ReactorModel
Appendix F - Plug Flow Reactor Model
F-1: Water Balance for critical condition
Because of the direct discharges of PCBs are continuous, a long-term balance and a harmonic flowcondition, was represented as follows:
(F-1a)(Q)=QPCB + QNPS + QPS
where QNPS = flow due to any non point sources [L3/T]QPS = flow due to any point sources [L3/T]QPCB = flow due to PCB discharge [L3/T]
A mass balance of PCBs can be developed assuming that the PCBs partition into the dissolved andparticulate forms and considering the various interactions between the sediment layer and the watercolumn (Figure F-1). (Note: subscript 1 refers to the water column and subscript 2 refers to the sedimentlayer).
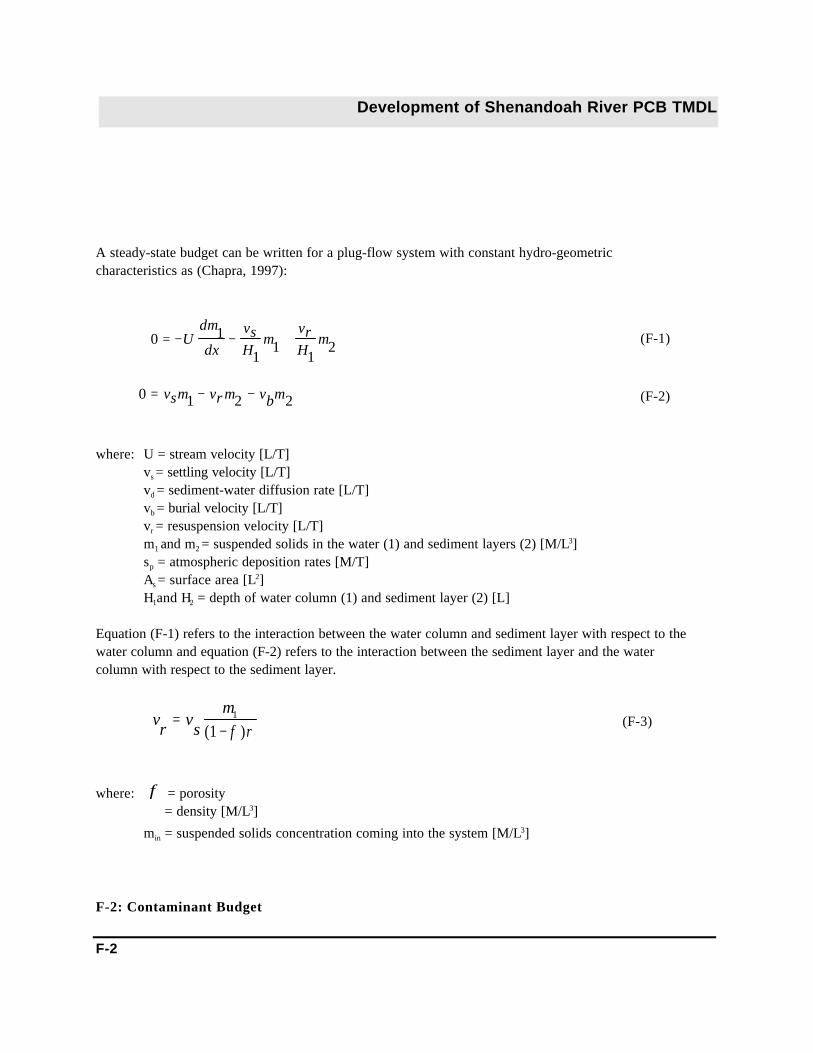
Development of Shenandoah River PCB TMDL
F-2
A steady-state budget can be written for a plug-flow system with constant hydro-geometriccharacteristics as (Chapra, 1997):
(F-1)0 1
11
12= − − +U
dm
dx
vsH
mvrH
m
(F-2)0 1 2 2= − −vsm vr m vbm
where: U = stream velocity [L/T]vs = settling velocity [L/T]vd = sediment-water diffusion rate [L/T]vb = burial velocity [L/T] vr = resuspension velocity [L/T]m1 and m2 = suspended solids in the water (1) and sediment layers (2) [M/L3]sp = atmospheric deposition rates [M/T]As = surface area [L2]H1and H2 = depth of water column (1) and sediment layer (2) [L]
Equation (F-1) refers to the interaction between the water column and sediment layer with respect to thewater column and equation (F-2) refers to the interaction between the sediment layer and the watercolumn with respect to the sediment layer.
(F-3)vr
vs
m=
−1
1( )φ ρ
where: = porosityφ = density [M/L3]
min = suspended solids concentration coming into the system [M/L3]
F-2: Contaminant Budget

Development of Shenandoah River PCB TMDL
F-3
Assuming a steady state, the contaminant budget can be written for a plug-flow system with constanthydro-geometric characteristics as (Chapra, 1997):
(F-4)0 11 1
11 1
11 1 2 2 2 2
12= − = − − + − +U
dc
dxk C
vv
HFd C
vs
HFp C
vd
Hd
Fd C Fd Cvr
HC( )
and for the bottom sediment as:
(F-5)0 1 1 1 1 2 2 2 2 2 2 2= + − − − −vsFp C vd Fd C Fd C k H C vrC vbC( )
where:
vs = settling velocity [L/T] (from literature Fox River, WDNR, 2000, suggests a typical value of 0.05-2.5 m/day)
Fp1= fraction of the total PCB that is in waterFd1 = fraction of total PCBs dissolved in waterFd2 = fraction of total PCBs dissolved in sedimentKd1 = PCB partitioning coefficient in water column (L3/M) Kd2 = PCB partitioning coefficient in sediment layer (L3/M) k1 and k2 = first order decomposition rate (1/T)vd = diffusive mixing velocity (L/T)M = mean PCB molecular weight
(F-6)
Fp1 =m1
1 + m1
KdK d
1
1
(F-7)Fd1 = 1
1+ Kd1m1
(F-8)Fd2 =1
+ Kd2 1-φ ( φ)ρ
(Di Toro et al., 1981) (F-9)vd M= −69 35 2 3. /φ
The water column partition coefficient (Kd1) for PCBs from literature ranges from 1 x 105.62 to 105.93 L/kg as reported in the Hudson River, NY 1999 analysis. Thomman and Mueller 1987 report a water columnpartition coefficient of 1 x 10⁵ to 106 L/kg and suggest that the sediment partition coefficient (Kd2) is

Development of Shenandoah River PCB TMDL
F-4
usually lower than the water column partition coefficient. Given a boundary condition of C1 = C1(0), and assuming that fraction of particulates are changing withdistance, Mills et al. (1985) provide the following solution for the water column concentration:
(F-10)C C e
Kd m e
vsxH U
Kd mvsxH U
1 1 0
1 11
1 1 11
=
+ − + −
( )
ln ln
Because the sediment bed does not advect downstream the concentration of total PCBs in the sedimentC2 can be calculated from equation F-5.
(F-11)C2 = C1
vs Fp1 + vd Fd1(vr + vb + k2H2 + v
d Fd2)
where k is a first order decompostion rate (1/T) (assumed to be zero) and H2 is the depth of the sedimentlayer. Equation F-11 establishes a direct relationship between the sediment and the overlying watercolumn concentration. Total PCBs concentration in terms of mass-specific sediment solids concentration (v2) in the sedimentlayer can be represented as:
(F-12)v2 = C1
vs Fp1 + vd Fd1- (v r + vb + k2H2 + vd Fd2 )(1 )φ ρ
Thus the water concentration follows a simple exponential decay and the sediment traces the identicalshape.