tm9a6.2.pdf - DIssolved Oxygen - USGS
44
U.S. Department of the Interior U.S. Geological Survey Techniques and Methods 9–A6.2 Supersedes USGS Techniques of Water-Resources Investigations, Book 9, Chapter A6.2, Version 3.0 Dissolved Oxygen Chapter 6.2 of Section A, National Field Manual for the Collection of Water-Quality Data Book 9, Handbooks for Water-Resources Investigations
Transcript of tm9a6.2.pdf - DIssolved Oxygen - USGS

U.S. Department of the InteriorU.S. Geological Survey
Techniques and Methods 9–A6.2Supersedes USGS Techniques of Water-Resources Investigations, Book 9, Chapter A6.2, Version 3.0
Dissolved Oxygen
Chapter 6.2 ofSection A, National Field Manual for the Collection of Water-Quality DataBook 9, Handbooks for Water-Resources Investigations

Cover: Accurate measurement of dissolved oxygen is essential in studies of aquatic ecosystems. Photograph by Gerolamo C. Casile, U.S. Geological Survey.

Dissolved Oxygen
By U.S. Geological Survey
Techniques and Methods 9–A6.2Supersedes USGS Techniques of Water-Resources Investigations, Book 9, Chapter A6.2, Version 3.0
U.S. Department of the InteriorU.S. Geological Survey
Chapter 6.2 ofSection A, National Field Manual for the Collection of Water-Quality DataBook 9, Handbooks for Water-Resources Investigations

U.S. Department of the InteriorDAVID BERNHARDT, Secretary
U.S. Geological SurveyJames F. Reilly II, Director
U.S. Geological Survey, Reston, Virginia First Release: April 1998, as Techniques of Water-Resources Investigations (TWRI), book 9, chapter A6.2, version 1.0Revised: May 2006, online as TWRI 9–A6.2, version 2.0Revised: June 2006, online as TWRI 9–A6.2, version 2.1Revised: September 2013, online as TWRI 9–A6.2, version 3.0Revised: October 2020, online as Techniques and Methods, book 9, chapter A6.2
For more information on the USGS—the Federal source for science about the Earth, its natural and living resources, natural hazards, and the environment—visit https://www.usgs.gov or call 1–888–ASK–USGS.
For an overview of USGS information products, including maps, imagery, and publications, visit https://store.usgs.gov.
Any use of trade, firm, or product names is for descriptive purposes only and does not imply endorsement by the U.S. Government.
Although this information product, for the most part, is in the public domain, it also may contain copyrighted materials as noted in the text. Permission to reproduce copyrighted items must be secured from the copyright owner.
Suggested citation:U.S. Geological Survey, 2020, Dissolved oxygen: U.S. Geological Survey Techniques and Methods, book 9, chap. A6.2, 33 p., https://doi.org/10.3133/tm9A6.2. [Supersedes USGS Techniques of Water-Resources Investigations, book 9, chap. A6.2, version 3.0.]
ISSN 2328-7055 (online)

iii
Contents
Abstract ...........................................................................................................................................................11.0 Introduction .............................................................................................................................................1
1.1 Overview of Dissolved Oxygen ....................................................................................................22.0 Optical (Luminescence) Sensor Method ............................................................................................3
2.1 Equipment and Field Preparations ..............................................................................................32.1.1 Equipment Description and Maintenance .....................................................................32.1.2 Field-Trip Preparations .....................................................................................................5
2.2 Calibration of Optical Sensors .....................................................................................................52.2.1 Correction for Atmospheric Pressure and Salinity ......................................................62.2.2 Selection of Calibration Method .....................................................................................72.2.3 Optical (Luminescence) DO Sensors—Calibration Procedures ...............................7
Procedure 1—Calibration in Air .......................................................................................8Variation of Procedure 1—Air Calibration with a Wet Towel ......................................8Procedure 2—Calibration with Air-Saturated Water ..................................................9
2.3 Measurement ...............................................................................................................................102.3.1 Surface Water ..................................................................................................................102.3.2 Groundwater.....................................................................................................................11
3.0 Spectrophotometric (Rhodazine D and Indigo Carmine) Methods ..............................................133.1 Equipment and Supplies .............................................................................................................143.2 Calibration and Interferences ...................................................................................................143.3 Measurement ...............................................................................................................................15
4.0 Reporting ................................................................................................................................................175.0 Correction Factors for Oxygen Solubility and Salinity ....................................................................17Acknowledgments .......................................................................................................................................18References Cited..........................................................................................................................................18Appendix 1. Example comparison between spectrophotometric and optical dissolved-oxygen
meter data........................................................................................................................................32
Tables
6.2–1. Equipment and supplies for the optical sensor method of determining dissolved-oxygen concentration ................................................................................................4
6.2–2. Solubility of oxygen in freshwater at various temperatures and pressures ....................20 6.2–3. Equipment and supplies for the spectrophotometric method of determining
dissolved-oxygen concentration using Rhodazine D and Indigo Carmine reagents ......14 6.2–4. Salinity correction factors for dissolved oxygen in water ..................................................26 1–1A. Data for comparison between spectrophotometric and optical dissolved-oxygen
meter methods ............................................................................................................................32 1–1B. Calibration data for readings in table 1–1A ...........................................................................33

iv
Conversion Factors
International System of Units to U.S. customary units
Multiply By To obtain
Length
centimeter (cm) 0.3937 inch (in.)millimeter (mm) 0.03937 inch (in.)meter (m) 3.281 foot (ft)
Mass
gram (g) 0.03527 ounce, avoirdupois (oz)kilogram (kg) 2.205 pound avoirdupois (lb)
Volume
liter (L) 0.2642 gallon (gal)milliliter (mL) 0.03381 ounce, fluid (fl. oz)cubic centimeter (cm3) 0.06102 cubic inch (in3)
Temperature in degrees Celsius (°C) may be converted to degrees Fahrenheit (°F) as follows:
°F=(1.8×°C)+32
Specific conductance is reported in microsiemens per centimeter at 25 degrees Celsius (µS/cm at 25 °C). Siemens per centimeter are the equivalent of mhos per centimeter.
Molality of a solution is the number of moles (m) of a constituent per kilogram (kg) of solution. Units of molality are reported in moles per kilogram (m/kg).
Abbreviations and Symbols
DIW deionized water with resistance greater than or equal to 18 megaohms (MΩ), and that has been quality assured
DO dissolved oxygen
EDI equal-discharge increment, isokinetic sampling method
EWI equal-width increment, isokinetic sampling method
LED light emitting diode
LDO luminescent dissolved oxygen
µg/L micrograms per liter
mg/L milligrams per liter
M molar
NFM “National Field Manual for the Collection of Water Quality Data” (USGS)
NIST National Institute of Standards and Technology
nm nanometer

v
NWIS National Water Information System (USGS)
NWS National Weather Service
RDO rugged dissolved oxygen
USGS U.S. Geological Survey
WMA Water Mission Area (USGS)
WSC Water Science Center (USGS)
YSI Yellow Springs Incorporated
> greater than
< less than
Chemical Formulas
H2O water
H2S hydrogen sulfide
Hg mercury

vi
Requirements and Recommendations
As used in the U.S. Geological Survey (USGS) “National Field Manual for the Collection of Water-Quality Data” (NFM), the terms “required” and “recommended” have the USGS-specific meanings described below:
• The terms “require,” “required,” and “requirements” in reference to USGS protocols indicate that USGS Water Mission Area (WMA) policy has been established on the basis of research or consensus of the technical staff, and has been reviewed by water-quality specialists and other professionals having the appropriate expertise. Technical memorandums and other documents that define USGS WMA policy are cited in the NFM. USGS field personnel are instructed to use required equipment and procedures as described in the NFM. Departure from or modifications to stipulated requirements, if necessary for accomplishing specific data-quality requirements or study objectives, must be independently quality assured and documented (Office of Water Quality Technical Memorandum 2002.13—U.S. Geological Survey, 2002).
• The terms “recommend,” “recommended,” and “recommendation” indicate that, on the basis of research or consensus, there are several acceptable alternatives to a given procedure or equipment selection in the NFM. Relevant technical memorandums and publications pertinent to such recommendations are cited in the NFM to the extent that such documents are available. Specific requirements, data-quality objectives, or other constraints of a project may affect the choice of recommended equipment or procedures. Selection from among the recommended alternatives should be based on referenced research and sound field judgment, and reasons for the selection must be documented. Departures from or modifications to the recommended procedures must be independently quality assured and documented (Office of Water Quality Technical Memorandum 2002.13—U.S. Geological Survey, 2002).

Chapter 6.2. Dissolved Oxygen
By U.S. Geological Survey
AbstractThe “National Field Manual for the Collection of Water-
Quality Data” (NFM) provides guidelines and procedures for U.S. Geological Survey (USGS) personnel who collect data used to assess the quality of the Nation’s surface water and groundwater resources. This chapter, NFM A6.2, provides guidance and protocols for the measurement of dissolved oxygen, which include the scientific basis of the measurement, selection and maintenance of equipment, calibration, trouble-shooting, and procedures for measurement and reporting. It updates and supersedes USGS Techniques of Water-Resources Investigations, book 9, chapter A6.2, version 3.0, by Stewart A, Rounds, Franceska D. Wilde, and George F. Ritz. Dissolved oxygen is routinely measured when water samples are col-lected, is often continually measured at USGS streamgages, and is a parameter regularly measured during laboratory and field experiments. The field method for measuring dis-solved oxygen described in this chapter is applicable to most natural waters.
Before 2017, the USGS NFM chapters were released in the USGS Techniques of Water-Resources Investigations series. Effective in 2018, new and revised NFM chapters are being released in the USGS Techniques and Methods series; this series change does not affect the content and format of the NFM. More information is in the general introduction to the NFM (USGS Techniques and Methods, book 9, chapter A0—U.S. Geological Survey, 2018) at https://doi.org/10.3133/tm9A0. The authoritative current versions of NFM chap-ters are available in the USGS Publications Warehouse at https://pubs.er.usgs.gov. Comments, questions, and sugges-tions related to the NFM can be addressed to [email protected].
1.0 IntroductionThe “National Field Manual for the Collection of Water-
Quality Data” (NFM) is the official and citable protocol for the collection of water-quality data by the Water Mission Area (WMA) of the U.S. Geological Survey (USGS). The NFM provides guidelines and procedures for USGS personnel who collect data for water quality in surface water and ground-water, with detailed, comprehensive, and citable procedures. It
updates and supersedes USGS Techniques of Water-Resources Investigations, book 9, chapter A6.2, version 3.0, by Rounds and others (2013).
National USGS program and project personnel who collect water-quality data, as well as those in USGS Water Science Centers (WSCs), and including those conducting projects supported by the USGS Cooperative program, are mandated to use protocols provided in the NFM (USGS Office of Water-Quality Technical Memorandum 2002.13—U.S. Geological Survey, 2002). Formal training, as provided in the USGS class “Field Water-Quality Methods for Groundwater and Surface Water,” and field apprenticeships supplement the information provided in the NFM and are needed to collect unbiased, high-quality data.
The USGS National Field Manual provides detailed, comprehensive, and citable procedures for monitoring the quality of surface water and groundwater. Formal train-ing and field apprenticeships supplement the information provided in the NFM.
Chapter A6.2 of the NFM provides guidance and proto-cols for the measurement of dissolved oxygen (DO), which is best measured in the field. DO concentration can change rapidly as a result of several factors that can affect a sample after removal from a water body or aquifer. The measure-ment is straightforward and precise with many environ-mental applications. DO is routinely measured when water samples are collected, is often measured continually at USGS streamgages, and is regularly measured during laboratory and field experiments.
The field methods described in this chapter are appli-cable to most natural waters. This chapter covers the physical basis for measurement of DO in aqueous solutions, as well as factors that affect the measurement, terminology, method protocols, and applications.
Before 2017, the USGS NFM chapters were released in the USGS Techniques of Water-Resources Investigations series. Effective in 2018, new and revised NFM chapters are being released in the USGS Techniques and Methods series; this series change does not affect the content and format of the NFM. More information is in the general introduction to the NFM (USGS Techniques and Methods,

2 Chapter A6.2. Dissolved Oxygen
measurement methods described are used by the USGS onsite for routine determination of DO concentrations in fresh to saline surface water and groundwater.
The primary USGS field procedure for determination of DO is the use of luminescence-based (optical) sensors. Opti-cal DO sensors are considered a major technological advance over previously used amperometric sensors because optical DO sensors are more robust in the field environment, are not flow dependent, and are generally easier to use while provid-ing higher quality data, especially at low DO concentrations (<2 milligrams per liter [mg/L]).
Optical sensor methods (section 2.0) are applicable to nearly all aqueous environmental conditions. Optical sensor technology is available in single-parameter DO meters or in multiparameter sondes and can be either handheld for discrete measurements or deployed for longer term, unattended con-tinuous and real-time measurements.
Spectrophotometric (colorimetric) instrumental methods (section 3.0) yield consistent results when applied to the deter-mination of DO concentrations in oxygen-depleted waters (for example, in certain aquifers and deep-lake horizons) and can be used to report DO concentrations from about 2.0 mg/L to as little as 0.025 mg/L. Noninstrumental colorimetric methods that are available for visually determining DO concentrations to 0 mg/L can be useful for a quick reconnaissance of DO conditions and an accuracy check of DO-sensor performance. Noninstrumental colorimetric methods that are available for visually determining DO concentrations should not be used to report DO concentrations.
The iodometric (Winkler) method is regarded as an accurate and precise method for the calibration of DO sensors and the determination of DO concentration in water when performed under controlled laboratory conditions. Before sensors that could be immersed directly in the water column became commonly available, USGS personnel were trained to perform Winkler titrations onsite. Standard USGS practice no longer sanctions onsite Winkler titrations or the transport of field samples offsite for DO determination by the Winkler method. Step-by-step instructions for conducting a Win-kler titration that were included in previous versions of this NFM chapter have been removed and are not included in this chapter.
• Some procedures for equipment operation recom-mended in this guidance document may not apply to your equipment because of technological advances or other changes.
• Be sure to record any modifications made to the standard USGS procedures given in this field manual.
book 9, chapter A0—U.S. Geological Survey, 2018) at https://doi.org/10.3133/tm9A0. The authoritative current ver-sions of NFM chapters are available in the USGS Publications Warehouse at https://pubs.er.usgs.gov. Comments, questions, and suggestions related to the NFM can be addressed to [email protected].
1.1 Overview of Dissolved Oxygen
The concentration of DO in water is affected by many factors, including ambient temperature, atmospheric pressure, and ion activity (ionic strength of the water body). Accurate dissolved-oxygen data are essential for understanding and documenting effects on environmental water resources that result from natural phenomena and human activities. Sources of DO in water include atmospheric aeration and photo-synthetic activities of aquatic plants. Sinks of DO in water include respiration, aerobic decomposition processes, ammo-nia nitrification, and other chemical and biological reactions. Many chemical and biological reactions in groundwater and surface water depend on the amount of available oxygen. The presence of DO in aquatic systems is necessary for the survival and growth of many aquatic organisms and is used as an indicator of the health and geochemical quality of surface water and groundwater systems.
DISSOLVED OXYGEN: Molecular oxygen (oxygen gas) dissolved in water.
Standard procedures used by the USGS to determine concentrations of DO in surface water and groundwater involve the use of luminescence-based optical sensors, or spectro-phoometric methods of analysis. Before the advent in the 2000s of optical sensors for DO measurement, the amperometric (Clark cell) sensor was used. Optical sensors have replaced the amperometric type of sensor. The amperometric sensor is an acceptable method for use in the measurement of DO; however, barring any project-specific requirements, optical sensors should be considered the standard field method. The iodometric (Winkler) method is no longer used by the USGS for routine measurement of DO at field sites, but remains an acceptable method for verifying the results of DO measure-ments made with other methods.
The selection of field equipment and measurement methods takes into consideration (1) whether equipment will be used at multiple and discrete locations and times or be deployed at a single location over a period during which it will be unattended, (2) anticipated environmental condi-tions, (3) the specific data-quality objectives of the data-collection program, and (4) specific program objectives. The

2.0 Optical (Luminescence) Sensor Method 3
2.0 Optical (Luminescence) Sensor Method
The optical sensor method can yield accurate results for measurement of DO concentrations under most field condi-tions encountered in routine USGS data-collection activities. The method is relatively simple to use, whether deployed for discrete (single) or continuous (unattended) DO measurements in surface water or groundwater. Because of the advantages introduced by advances in applying luminescence technol-ogy to DO measurement, optical sensors are favored for most standard USGS field operations.
Optical sensors—The technology used in optical DO sensors involves the measurement of light-emission charac-teristics of a luminescence-based reaction at the sensor-water interface (see Technical Note 1). Some characteristics of the optical DO method are—
• Oxygen is not consumed by the sensor at the sensor-water interface.
• The optical sensor is not dependent on water flow; consequently, no stirring mechanism is required at sites with slowly flowing or still waters.
• Optical sensors are relatively stable. They are able to maintain calibration over long-term deployment and over a wide range of environmental conditions, and sensor drift over time is minimal when the sensor is kept clean.
• There are no known sources of interference to the luminescence method in natural aquatic systems. Optical sensors will measure accurately in the pres-ence of hydrogen sulfide (H2S) and also when deployed in fresh, brackish, and mildly contaminated waters. Contact with organic solvents can compromise sensor integrity or performance, however.
• Cleaning and maintenance are relatively simple. The optical sensor contains no anode or cathode to service, and uses no electrolyte solution, membranes, or O-rings.
• Optical-sensor maintenance is dictated by manufac-turer guidelines that are specific to the type of sen-sor in use and the conditions to which the sensor has been subjected.
• Manufacturers generally recommend annual to bian-nual replacement of the luminophore-containing module (also called “lumiphore”). Some sensors may have a prescribed lifetime of the module, after which the sensor becomes inoperative. The modules are easily replaced. Sensors should be calibrated or undergo a calibration check after module replacement.
TECHNICAL NOTE 1. The luminescence sensor employs a light-emitting diode (LED) to provide light of a specific wavelength that excites a luminescent-dye molecule substrate (luminophore) of the sensor. After some dissipation of the excitation energy, longer wavelength light is emitted. The intensity of the fluorescence is proportional to the DO concentration because the presence of oxygen can quench, or suppress, the fluorescence response of the dye. Higher DO concentrations result in greater quench-ing and a decreased fluorescence response. The signal to the fluorescence detector is greatest at lowest DO concentrations. More importantly, the timescale, or lifetime, of the fluores-cence reaction is also dependent on the DO concentration and is not dependent on the light intensity of excitation or fluores-cence, thereby allowing more reliable determination of the DO concentration. Temperature stability during calibration and measurement is extremely important, as temperature controls the solubility of oxygen in water.
2.1 Equipment and Field Preparations
DO instruments (meters and sensors) are available from a number of commercial vendors. Because of differences among manufacturers in the instrument design and instructions for use, calibration, and maintenance, it is important that the user be thoroughly familiar with the instructional manual for the specific instrument system to be used in addition to the guid-ance given here.
2.1.1 Equipment Description and MaintenanceMeters, sondes, and the DO sensors used in these instru-
ments are sophisticated electronic equipment that require care in handling and operation. Information about the equipment and supplies required for the optical method of determining aqueous DO concentrations is summarized in table 6.2–1.
Guidance on when to replace the luminophore-containing cap or module varies among manufacturers and can be based on the specific design and materials used, the environmental conditions to which the sensor is exposed, the age of the sen-sor, and (or) the amount of time it is deployed. For example—
• Hach specifies a 2-year life of the sensor cap of its LDO (Luminescent Dissolved Oxygen) sensor.
• YSI Environmental (EXO) specifies annual replace-ment of the sensor cap for its optical DO sensor.
• In-Situ, Inc., advises that the RDO (Rugged Dissolved Oxygen) sensor cap has a 2-year life.
• Thermo Scientific specifies a 365-day lifespan for the RDO cap once it is installed on the RDO sensor.

4 Chapter A6.2. Dissolved Oxygen
Table 6.2–1. Equipment and supplies for the optical sensor method of determining dissolved-oxygen concentration (modify this list to meet specific needs of the field effort).
[[DO, dissolved oxygen; mg/L, milligrams per liter; NFM, National Field Manual for the Collection of Water-Quality Data; –, minus; +, plus; °C, degrees Celsius; ±, plus or minus; NIST, National Institute of Standards and Technology; M, molar]
DO instrument should have a digital temperature and DO readout display and have:• Automatic temperature compensation
• An operating range in water with a temperature range of at least –5 to 45 °C
• Capability to measure DO concentrations from 0.01 to 20 mg/L (instrument capability can range to 50 mg/L)
• Minimum display resolution of 0.01 mg/L DO
• Calibrated accuracy within ±0.1 mg/L DO
Calibration equipment, per manufacturer’s recommendation
Pocket altimeter-barometer or DO instrument with built-in barometer; barometer measures to nearest 1 millimeter of mercury and its calibration has been checked before use or at least annually against a NIST-traceable barometer or the uncorrected barometric pressure obtained from a National Weather Service location at the same altitude as calibration or calibration check
Thermometer (see NFM chapters A6.1 and A6.8 for calibration-check criteria)
Zero-DO solution. Dissolve approximately 2 grams sodium sulfite in 1 liter of deionized water (0.016–M solution, prepared fresh just before the field trip or during week of use)1
Flow-through chamber for determining groundwater DO concentration, if downhole sensor deployment is impractical
Oxygen-solubility table (table 6.2–2, at end of chapter), or access to table at https://water.usgs.gov/software/DOTABLES/
Waste-disposal containers
Spare batteries
Calibrated specific-conductance sensor, if measurement is being made in a saline or brackish systemCalibration and maintenance log books for DO instrument and barometer
1Take special note of the manufacturer’s guidance for your sensor. Some manufacturers supply the zero-DO solution required or document the specific instructions for preparing the zero-DO solution recommended for their sensors, including an alternative by which nitrogen gas is forced into tap or deionized water to produce a zero-DO solution. (Consult with the manufacturer’s division of technical support.)

2.0 Optical (Luminescence) Sensor Method 5
• If the instrument reading is negative, consult the manufacturer's manual; a zero-DO calibration may be necessary.
• Rinse the sensor and wiper thoroughly and then reinstall the wiper elements. Multiple, thorough rinses with deionized water are necessary to remove the sodium sulfite and restore the sensor to proper operating condition and prevent subsequent mea-surements from being biased.
5. Review the care and maintenance guidance provided by the manufacturer for the specific sensor being used; instructions can differ appreciably depending on the make and model of the instrument.
• Check the condition and (or) deployment history of the luminophore-containing sensor module, referring to the manufacturer’s guidance for replacement of the luminophore module.
• Depending on the instrument, sensor modules are replaced annually or at least every 2 years, even if the sensor is idle.
6. Remember to document field preparations and all instru-ment tests and adjustments in the meter log book. Do not use an instrument that fails calibration checks.
CAUTION:
Before handling sodium sulfite (or any other chemicals) refer to safety precautions for that chemical on the Safety Data Sheet (SDS).
2.2 Calibration of Optical Sensors
Sensor-based instrument systems used to determine DO in water must be calibrated properly before being used. Proper calibration procedures are necessary to ensure the overall accuracy and precision of DO measurements. It is recom-mended to calibrate instruments in the controlled atmosphere of the laboratory before going to the field. A calibration check is required at each field site, followed by recalibration as needed to meet the specific data-quality requirements of the project.
The accuracy required by the project for sites at which DO will be determined and the capabilities of the selected instrument will govern whether a one-point calibration will be sufficient or whether a two-point calibration should be used. In addition, some manufacturers of the DO instruments com-monly used for USGS data-collection activities recommend testing in a laboratory setting to determine the accuracy of room-temperature calibrations compared with measurements made under the anticipated warmer or cooler field conditions. Project personnel are advised to be familiar with recommenda-tions made by the manufacturer of their equipment.
Become familiar with the specific manufacturer’s recom-mendations for short-term (field) and long-term (office or labo-ratory) storage. Storage guidance for optical sensors (some specify the need for storage in a humid environment) and procedures for removing sensors from storage differ among manufacturers; consult the manual provided for the sensor.
2.1.2 Field-Trip PreparationsThe service performed on all equipment, whether a full
calibration, calibration check, or replacement or repair of parts for the instrument, and whether performed in the office, laboratory, or field, must be accurately recorded and dated in the instrument or sensor log book.
Field-measurement instruments are required to be main-tained on a regular schedule and performance tested before field use, as described below:1. Check all electrical connections and the charge on
the batteries, as applicable for the instrument in use. Batteries should be in good condition with as high a state of charge as possible. Replace or charge questionable batteries.
2. Thermistors/thermometers must be calibrated and field checked before use, as described in NFM 6.1, Temperature.
3. Perform a 100-percent oxygen-saturation calibration check (see section 2.2). This performance check does not negate the need for an onsite sensor-calibration check at oxygen saturation. The result of the check should be within +/- 0.2 mg/L of the 100-percent saturated concen-tration determined from the DO solubility tables found at https://water.usgs.gov/software/DOTABLES.
4. Perform a zero-DO sensor-performance check.
• Prepare the zero-DO sodium sulfite solution (see table 6.2–1).
• Before immersing the sensor in the zero-DO solu-tion, remove the wiper (or sponge) from the unit to avoid saturating it with the sodium sulfite solution. (Not all instruments have a wiper.)
• Immerse the sensor into the zero-DO solution, wait for reading to stabilize (usually within 5–10 minutes), record reading.
• If the instrument reading exceeds 0.2 mg/L in the zero-DO solution, check DO again with a freshly prepared zero-DO solution; if a reading greater than 0.2 mg/L persists, contact the instrument manufac-turer and inquire whether the luminophore module should be replaced.

6 Chapter A6.2. Dissolved Oxygen
One-point calibration: The main goal of the one-point DO calibration procedure is to create a 100-percent saturated oxygen environment in which the DO sensor and its thermistor are at the same temperature. There are two procedures that can be used for a one-point calibration:
• Procedure 1—Calibration in air (can be accom-plished with air-calibration chamber or wet-towel method)
• Procedure 2—Calibration in air-saturated water (water bubbled with air)
Two-point calibration: The two-point calibration typically involves calibration of the sensor at 100-percent saturation, and at zero DO. The two-point calibration adds complexity to the calibration process and is not recommended by all manu-facturers of optical sensors. Conduct a zero-DO check before committing to a two-point calibration. Be sure to understand the instrument capabilities and then determine the best course of action. For routine applications, it is advisable to rely on a zero-DO performance check rather than a zero-DO calibration, which would risk corrupting the manufacturer’s zero-DO calibration.
• Use of a two-point calibration should be considered if (1) the calibration is needed to satisfy the data-quality objectives of the project, (2) oxygen concentrations less than 2 mg/L are likely to be encountered and zero-DO performance checks fail, or (3) the calibration is deemed necessary by experienced field personnel familiar with site conditions.
• Before starting or planning for a two-point calibration, consult the manufacturer’s instructions or technical support for the specific optical DO sensor being used.
• If a two-point DO calibration is used, calibrate the DO sensor only after calibrating other field-measure-ment sensors to prevent possible interference of the sodium sulfite (zero-DO) solution with the calibration of the other sensors. Unless the equipment manu-facturer’s manual specifies otherwise, complete the DO calibration at 100-percent saturation before the zero calibration.
Sensor-performance checks—Verifying sensor perfor-mance before field use (calibration check) is a required standard procedure in USGS field operations (see section 2.1).
• All DO sensors have the capability to undergo a per-formance check at zero DO. Most DO sensors have the capability to undergo a zero-DO calibration.1
• Verifying instrument performance at zero DO and using the two-point calibration can be particularly important for data accuracy when the instrument
1Manufacturers caution against routine zero recalibration of sensors but allow for zero-DO checks, stipulating the need to thoroughly rinse the zero solution from the sensor after the check procedure.
will be used to measure low DO concentrations (less than 2 mg/L).
• The result of a DO instrument performance check should be within +/- 0.2 mg/L of the 100-percent saturated concentration determined from the DO solubility tables found at https://water.usgs.gov/software/DOTABLES or, if checking at the zero point, the sensor should read within 0.2 mg/L of zero. Project objectives may dictate a deviation of less than 0.2 mg/L from the calculated 100-percent saturation value or zero. Recalibration and additional trouble-shooting are warranted if instruments fail the DO performance checks.
Do not use an instrument that fails to calibrate properly or fails performance checks.
2.2.1 Correction for Atmospheric Pressure and Salinity
DO calibration procedures include corrections for atmospheric pressure and ionic strength. (Ionic strength is estimated from the conductivity measurement for routine field applications.) Atmospheric pressure, the temperature of the water or water vapor, and the ionic strength of the water must be known to determine the theoretical amount of oxygen that will be dissolved in water.
Record all calibration information in instrument log books and copy calibration data onto field forms at the time of calibration.
TECHNICAL NOTE 2. DO sensors do not directly measure oxygen in milligrams per liter or parts per million. Expressed concentrations are based on calculations that relate instrument sensor data with the temperature and ionic strength of the sample water. The sensor signal is proportional to the ambient partial pressure of oxygen, which can be displayed either as percent saturation or in milligrams per liter, depending on user specification.
Ambient atmospheric pressure is true atmospheric pressure at the measurement site, not the pressure that has been adjusted to sea level. Atmospheric pressure (also known as barometric pressure) reported by the National Weather Service (NWS) generally is not the absolute (ambient) value. NWS atmospheric pressure readings typically are adjusted to sea level for comparison among weather stations and must be adjusted back to the altitude of the weather station in order to obtain ambient barometric pressure values. Previous versions of this chapter described a procedure for correcting NWS barometric pressure readings for use during DO calibrations. With the advent of inexpensive, National Institute of Standards and Technology- (NIST) traceable barometers, correction of a

2.0 Optical (Luminescence) Sensor Method 7
barometric pressure reading not measured at the DO calibra-tion altitude for use during a DO calibration is no longer recommended. It is required that the barometric pressure be measured at the altitude of the DO calibration or check.
For DO calibrations, the ambient atmospheric pressure must be determined to the nearest 1 millimeter (mm) of mercury. A calibrated pocket altimeter-barometer typically has been used to determine atmospheric pressure; however, many multiparameter water-quality instruments and DO meters in common use include an internal barometer.
Check the accuracy of all field barometers (including barometers built into instrument systems) before each field trip or at least annually, and record readings and adjustments in the instrument log book. Check field barometers against a NIST-traceable barometer kept at the USGS Water Science Center, office, or laboratory, or check barometer accuracy while at an official weather station where ambient atmospheric pressure can be obtained.
Most modern multiparameter instruments (see NFM 6.8) incorporate a pressure-temperature and salinity compensa-tion algorithm in their firmware for DO measurements; the instruments have a built-in conductivity sensor that is used to correct the DO-concentration data for salinity automatically. For instruments that are not equipped with a conductivity sensor, manual correction of the DO data for salinity is required.
If a user-specified salinity correction is needed, the preferred USGS method is to apply salinity-correction factors after calibrating and measuring the DO concentration of the environmental water body (see section 5.0). Interactive tables for user-specified temperature, pressure, and salinity are avail-able at https://water.usgs.gov/software/DOTABLES/.
When a manual salinity correction is made by the user during calibration, the instrument requires recalibration for each measured field variation in salinity (see section 5.0).
If a multiparameter instrument that includes a calibrated conductivity sensor is used, salin-ity correction to the DO concentration reading is performed automatically.
2.2.2 Selection of Calibration MethodManufacturers uniformly recommend a 100-percent satu-
rated oxygen calibration of DO sensors regardless of whether calibration in air (Procedure 1) or calibration in air-saturated water (Procedure 2) is used. It is important to refer to the manufacturer-provided guidance, as each of the procedures has inherent advantages and disadvantages and may include instrument-specific sources of error.
Calibration or checking of an instrument in air (Procedure 1) is the preferred method specified by some manufacturers. The process is easily accomplished in the laboratory or field setting so long as the temperature of the air calibration chamber is stable.
The air calibration or check with a wet-towel method (variation of Procedure 1) is the recommended method to be performed at the field site. This method is well suited to checking an instrument after transportation to a field site fol-lowed by calibration if the instrument fails the check with a wet-towel procedure.
The air-saturated water method (Procedure 2) is the pre-ferred method specified by some manufacturers. Temperature stability of the bubbled solution and equilibration of the DO-sensor temperature with the solution is important and easily accomplished. This procedure is generally favored for labora-tory calibrations because of the equipment required.
The DO-meter calibration check is required at each field site.
2.2.3 Optical (Luminescence) DO Sensors—Calibration Procedures
The luminescence technology used in optical DO field instruments has improved and simplified the data-collection process for field determination of DO concentration. Optical DO sensors generally have accuracy specifications of ±0.1 mg/L or 1 percent after calibration. This level of accuracy is best achieved by calibrating under controlled conditions in a laboratory or simulated laboratory environment.
TECHNICAL NOTE 3. Optical DO sensors contain internal calibration information from the manufacturer. Although some manufacturers advise that no further calibration is needed, the accuracy of factory calibrations does not necessarily satisfy the data-quality objec-tives required for USGS applications. Because the validity of a calibration can substantially affect the overall accuracy and precision of DO measurements, users are required to check the calibration at every field site or as often as is necessary to meet specific data-quality objectives.
Optical DO sensors are subject to very little drift after a successful calibration. A laboratory-performed calibration is likely to remain stable after transport to the field. Neverthe-less, calibrations are required to be verified at the field site. Laboratory calibrations are generally preferred because of the stability of the laboratory environment compared to a typical field site.
The Rhodazine DTM 2 spectrophotometric method for DO measurement described in section 3.0 has been used to check the calibration of these instruments. USGS field scien-tists have corroborated the accuracy of the optical sensor to 0.03 mg/L DO by using repeated comparisons of results with the Rhodazine D spectrophotometric method described in
2Rhodazine D is a proprietary product of CHEMetrics, Inc. (White and others, 1990).
8 Chapter A6.2. Dissolved Oxygen
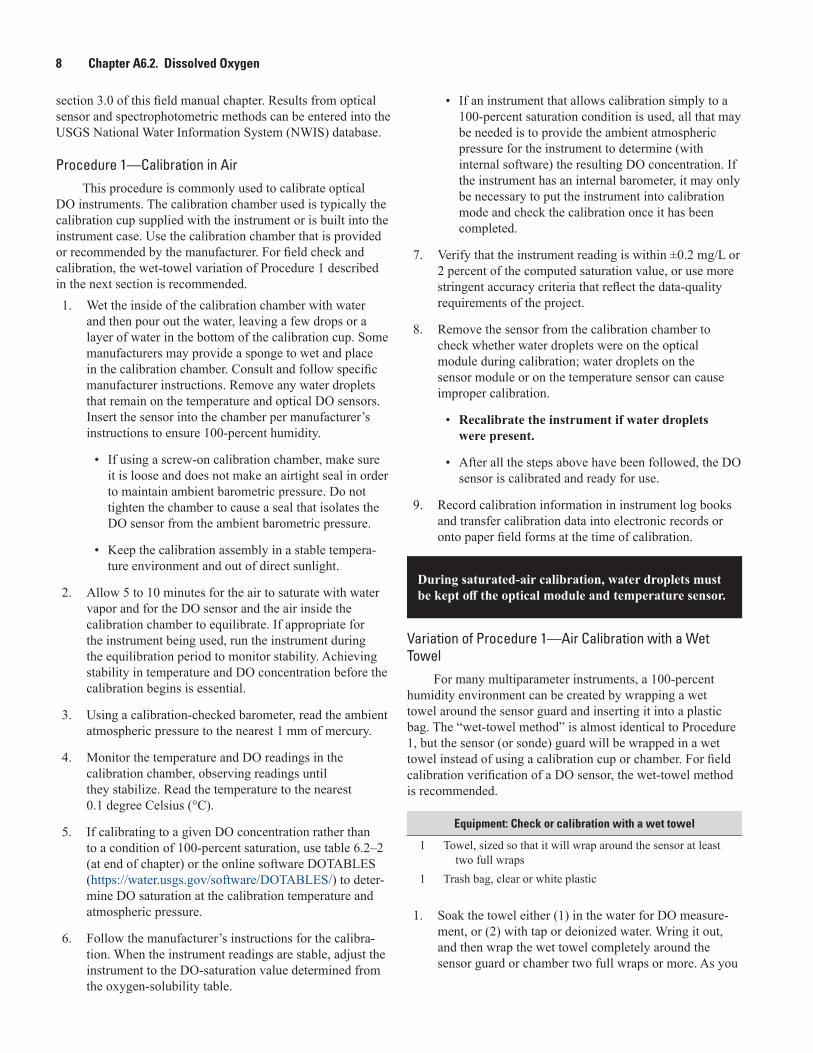
section 3.0 of this field manual chapter. Results from optical sensor and spectrophotometric methods can be entered into the USGS National Water Information System (NWIS) database.
Procedure 1—Calibration in AirThis procedure is commonly used to calibrate optical
DO instruments. The calibration chamber used is typically the calibration cup supplied with the instrument or is built into the instrument case. Use the calibration chamber that is provided or recommended by the manufacturer. For field check and calibration, the wet-towel variation of Procedure 1 described in the next section is recommended. 1. Wet the inside of the calibration chamber with water
and then pour out the water, leaving a few drops or a layer of water in the bottom of the calibration cup. Some manufacturers may provide a sponge to wet and place in the calibration chamber. Consult and follow specific manufacturer instructions. Remove any water droplets that remain on the temperature and optical DO sensors. Insert the sensor into the chamber per manufacturer’s instructions to ensure 100-percent humidity.
• If using a screw-on calibration chamber, make sure it is loose and does not make an airtight seal in order to maintain ambient barometric pressure. Do not tighten the chamber to cause a seal that isolates the DO sensor from the ambient barometric pressure.
• Keep the calibration assembly in a stable tempera-ture environment and out of direct sunlight.
2. Allow 5 to 10 minutes for the air to saturate with water vapor and for the DO sensor and the air inside the calibration chamber to equilibrate. If appropriate for the instrument being used, run the instrument during the equilibration period to monitor stability. Achieving stability in temperature and DO concentration before the calibration begins is essential.
3. Using a calibration-checked barometer, read the ambient atmospheric pressure to the nearest 1 mm of mercury.
4. Monitor the temperature and DO readings in the calibration chamber, observing readings until they stabilize. Read the temperature to the nearest 0.1 degree Celsius (°C).
5. If calibrating to a given DO concentration rather than to a condition of 100-percent saturation, use table 6.2–2 (at end of chapter) or the online software DOTABLES (https://water.usgs.gov/software/DOTABLES/) to deter-mine DO saturation at the calibration temperature and atmospheric pressure.
6. Follow the manufacturer’s instructions for the calibra-tion. When the instrument readings are stable, adjust the instrument to the DO-saturation value determined from the oxygen-solubility table.
• If an instrument that allows calibration simply to a 100-percent saturation condition is used, all that may be needed is to provide the ambient atmospheric pressure for the instrument to determine (with internal software) the resulting DO concentration. If the instrument has an internal barometer, it may only be necessary to put the instrument into calibration mode and check the calibration once it has been completed.
7. Verify that the instrument reading is within ±0.2 mg/L or 2 percent of the computed saturation value, or use more stringent accuracy criteria that reflect the data-quality requirements of the project.
8. Remove the sensor from the calibration chamber to check whether water droplets were on the optical module during calibration; water droplets on the sensor module or on the temperature sensor can cause improper calibration.
• Recalibrate the instrument if water droplets were present.
• After all the steps above have been followed, the DO sensor is calibrated and ready for use.
9. Record calibration information in instrument log books and transfer calibration data into electronic records or onto paper field forms at the time of calibration.
During saturated-air calibration, water droplets must be kept off the optical module and temperature sensor.
Variation of Procedure 1—Air Calibration with a Wet Towel
For many multiparameter instruments, a 100-percent humidity environment can be created by wrapping a wet towel around the sensor guard and inserting it into a plastic bag. The “wet-towel method” is almost identical to Procedure 1, but the sensor (or sonde) guard will be wrapped in a wet towel instead of using a calibration cup or chamber. For field calibration verification of a DO sensor, the wet-towel method is recommended.
Equipment: Check or calibration with a wet towel
1 Towel, sized so that it will wrap around the sensor at least two full wraps
1 Trash bag, clear or white plastic
1. Soak the towel either (1) in the water for DO measure-ment, or (2) with tap or deionized water. Wring it out, and then wrap the wet towel completely around the sensor guard or chamber two full wraps or more. As you

2.0 Optical (Luminescence) Sensor Method 9
wrap the sensor, ensure that no water droplets are on either the temperature sensor or the optical DO sensor.
2. Place the wrapped sensor into the plastic bag and keep it out of direct sunlight to keep the temperature from changing. The plastic bag holding the sonde and towel can be placed into a cooler if necessary to attain temperature stability.
3. Allow 5 to 10 minutes for the air to saturate with water vapor and for the DO sensor and the air inside the towel (calibration chamber) to equilibrate. If appropriate for the instrument being used, run the instrument during the equilibration period to monitor for stability of DO and temperature.
4. Using a calibration-checked barometer, read the ambient atmospheric pressure to the nearest 1 mm of mercury.
5. If calibrating to a given DO concentration rather than to a condition of 100-percent saturation, use table 6.2–2 (at end of chapter) or the online software DOTABLES (https://water.usgs.gov/software/DOTABLES/) to deter-mine DO saturation at the calibration temperature and atmospheric pressure.
6. Follow the manufacturer’s instructions for the calibration. When the instrument readings are stable, adjust the instrument to the DO-saturation value deter-mined from the oxygen-solubility table.
• If an instrument that allows calibration simply to a 100-percent saturation condition is used, all that may be needed is to provide the ambient atmospheric pressure for the instrument to determine (with internal software) the resulting DO concentration. If the instrument has an internal barometer, it may only be necessary to put the instrument into cali-bration mode and check the calibration once it has been completed.
7. Verify that the instrument reading is within ±0.2 mg/L or 2 percent of the computed saturation value, or use more stringent accuracy criteria that reflect the data-quality requirements of the project.
8. Remove the sensor from the wet towel to check whether water droplets were on the optical module during cali-bration; water droplets on the sensor module or on the temperature sensor can cause improper calibration.
• Recalibrate the instrument if water droplets were present.
• After all the steps above have been followed, the DO sensor is calibrated and ready for use.
9. Record calibration information in instrument log books and transfer calibration data into electronic records or onto paper field forms at the time of calibration.
Procedure 2—Calibration with Air-Saturated Water This procedure, in which the DO sensor or instrument
system is calibrated in water that is saturated with oxygen at a known temperature and ambient atmospheric pressure, is pre-ferred by some manufacturers for optical-sensor calibration. Some manufacturers provide the necessary aeration equip-ment with their instruments. Procedure 2 has the advantage of ensuring that all equipment parts equilibrate with water temperature simultaneously, and eliminates the need to check for water droplets on the optical module or temperature sensor. Care is required, however, to ensure that the water is indeed saturated with oxygen
Equipment—Calibration with air-saturated water
1 5-gallon bucket or manufacturer-provided aeration chamber1 10-gallon aquarium air pump with two outlets1 10-foot length of aquarium-pump tubing2 Gas-diffusion (air) stones
For this procedure, producing aerated water under controlled laboratory conditions is preferred; calibrate the DO sensor in the laboratory before departing for the field site (step 4a below). The variation of Procedure 1 using a wet towel is the recommended method to be performed at a field site.1. In the laboratory, fill a 5-gallon bucket to three-quarters
full with tap water.
2. Attach the pump tubing to the air pump and then the two air stones to the ends of the tubing. Place the tubing with air stones at the bottom of the filled bucket.
3. Turn on the pump and aerate the water for a minimum of 30 minutes. Tip: The pump can be left to operate continuously (24/7) in order to have a ready supply of air-saturated water on hand for calibration in the labora-tory. However, water will continuously evaporate from the bucket over time, raising the specific conductance of the aerated water. Be sure to replace the water in the bucket periodically.
4. Calibration—Take care to keep the optical sensor free of air bubbles.
a. For laboratory calibration, place the DO sensor (or multiparameter sonde) in the bucket and allow 5 to 10 minutes for the sensor to come to thermal equi-librium with the aerated water. Take care not to place the sensor over or in the bubbles from the air stone.
b. For field calibration verification of a DO sensor, use the wet-towel method.
5. Read and record the temperature of the calibration water to the nearest 0.1 °C.

10 Chapter A6.2. Dissolved Oxygen
6. Using a calibration-checked barometer, determine the ambient atmospheric pressure to the nearest 1 mm of mercury.
7. Using oxygen-solubility table 6.2–2 (at end of chapter) or the online software DOTABLES (https://water.usgs.gov/software/DOTABLES/), determine the DO-satura-tion value at the measured temperature and atmospheric pressure of the calibration water. (Refer to section 5.0 and table 6.2–4 (at end of chapter) for salinity correc-tions; salinity corrections should not be necessary for tap water.)
8. When the instrument readings are stable, adjust the instrument to the DO-saturation value determined from the oxygen-solubility table.
• If an instrument that allows calibration simply to a 100-percent saturation condition is used, all that may be needed is to provide the ambient atmospheric pressure for the instrument to determine (with internal software) the resulting DO concentration. If the instrument has an internal barometer, it may only be necessary to put the instrument into calibration mode and check the calibration once it has been completed.
9. Verify that the instrument reading is within ±0.2 mg/L or 2 percent of the computed saturation value, or use more stringent accuracy criteria that reflect the data-quality requirements of the project.
10. After all the steps above have been followed, the DO sensor is calibrated and ready for use.
11. Record the calibration information in instrument log books and transfer calibration data into elec-tronic records or onto paper field forms at the time of calibration.
For accurate calibration, ensure that the water is 100-percent saturated with oxygen.
2.3 Measurement
The solubility of oxygen in water depends on the temperature and ionic strength of the water. The higher the atmospheric pressure on the water’s surface and the lower the temperature and conductivity of the water, the more oxygen will be dissolved in the water.
Degassing, mineral precipitation, and other chemical, physical, and biological reactions can cause the DO concentra-tion of a water sample to change substantially within minutes after sample collection, especially if the water sampled was originally isolated from the atmosphere as in the case of groundwater or water in a deep lake or reservoir.
The solubility of oxygen in water decreases as salinity increases. Correction factors for salinity typically are applied after measuring DO for single-point samples; however, for DO measurements made with multiparameter instruments that include calibrated specific-conductance sensors, it is wise to activate the instrument’s internal salinity correction algorithms. Information that pertains to oxygen solubility and salinity is given in section 5.0, including the link to an online program that generates tables of DO solubility values and (or) salinity correction factors over a range of user-specified temperature, atmospheric pressure, and salinity or specific conductance (https://water.usgs.gov/software/DOTABLES/).
2.3.1 Surface WaterStandard determinations of DO in riverine surface water
represent the cross-sectional median or mean DO concentra-tion at the time of observation.
Multiparameter instruments (sondes) are in common use by the USGS for measurement of DO and other field param-eters, both for in situ discrete measurements in surface water and for short- or long-term deployment in streams, lakes and reservoirs, and other surface-water bodies. Refer to NFM 6.8, Wagner and others (2006), and manufacturer guidance for additional information regarding the siting and use of multiparameter instruments.
Measuring the DO concentration at one distinct point in a cross section is valid only for flowing water with a cross-sectional DO variation less than 0.5 mg/L. Discerning such variation requires a reconnaissance cross-section measure-ment. Measurements made at multiple locations in the cross section are recommended when possible. Determining DO concentration for a single channel at the centroid of flow at the midpoint of the vertical represents the cross section only under ideal mixing conditions.
Do not measure DO in or directly below sections with turbulent flow, in still water, or from the bank unless these conditions represent most of the stream reach or are required to fulfill project objectives.
Verify whether or not the instrument in use applies salin-ity corrections automatically. If not, apply a salinity correction to the saturation values after making the DO measurement, referring to section 5.0 and table 6.2–4 (at end of chapter).
If the anticipated DO concentration is less than 1.0 mg/L, use of spectrophotometric methods (section 3.0) is required to develop an instrument-specific rating before measure-ments made with a field instrument can be reported. Optical DO instrument readings are required to be verified through the development of an instrument-specific comparison with spectrophotometric methods. The instrument-specific rating should consist of at least five measurements made as nearly simultaneously as possible with the optical instrument and the spectrophotometric method. When compared, the median of these measurements should agree within 0.03 mg/L. If the measurements do not agree within 0.03 mg/L, the optical instrument should be checked and, if necessary, calibrated to

2.0 Optical (Luminescence) Sensor Method 11
the zero-DO point. The directions for the spectrophotometric method should also be checked and followed very closely. Once an instrument-specific rating has been developed, an optical DO instrument may be used to report DO concentra-tions greater than 0.03 mg/L. Example data for such a com-parison are in appendix 1.3
DO must be measured in situ. Never measure DO in subsamples from a sample splitter or other vessel; DO measurements will not be representative because the chemistry of derived samples changes quickly.
Follow the steps below to measure DO in surface water:1. Calibration checks:
• Check that the thermistor is accurate and that its calibration has been certified according to NFM 6.1 (Temperature).
• Check the performance of the DO sensor at satura-tion and zero DO (see sections 2.1 and 2.2).
• If a calibration adjustment is necessary or if it is required to address program protocols, data-quality requirements, or site-specific conditions, calibrate the DO sensor onsite in accordance with the proce-dures described in section 2.2.
2. Examine the variation in DO measured at multiple loca-tions along the stream cross section (if this reconnais-sance step was performed) to help select the sampling method.
• Flowing, shallow stream—Wade to the location(s) where DO is to be measured.
• Flowing stream too deep or swift to wade—Lower a weighted DO sensor from a bridge, cableway, or boat. Do not attach the weight directly to the sensors or sensor cables to avoid damaging the sensors or sensor cables. Contact the instrument manufacturer or vendor for information regarding the weights approved for use with the instrument and how to attach them.
• Still-water conditions—Measure DO at multiple depths at several points in the cross section.
• Lakes and reservoirs—Measure DO at a series of specific depths to determine a vertical profile at each location of interest.
3Note that spectrophotometric methods for determining DO concentration generally are not approved by the U.S. Environmental Protection Agency for regulatory assessments.
3. Immerse the DO and temperature sensors directly into the water body and allow the sensors to equilibrate to the water temperature (no less than 60 seconds).
4. Record the temperature without removing the sensor from the water.
5. After the instrument reading has stabilized, record the median DO concentration (see NFM A6.0, Field Mea-surements). The reading should stabilize to within ±0.2 mg/L.
• In still water, record the median of three or more sequential values.
• Equal Discharge Increment (EDI)—Record the mean value of all subsections measured. If there is only one vertical section, use the median at the centroid of flow.
• Equal Width Increment (EWI)—Record the mean (or median) of all subsections measured.
6. For EWI, EDI, or multiple vertical measurements, proceed to the next station in the cross section and repeat steps 3–5.
7. When measurements for the stream have been com-pleted, remove the sensor from the water, rinse it with deionized water or tap water, and store it according to the manufacturer’s instructions.
8. Record DO concentrations on the field forms.
2.3.2 GroundwaterBefore the concentration of DO in groundwater can be
determined, standing water must be evacuated from the well to ensure that measurements of DO concentration in the well will be representative of formation-water concentration. An adequate well purge ensures the flow of freshwater from the aquifer formation into the well (refer to NFM A4, Sample Collection, and NFM A6, Field Measurements, for detailed information). Measurement of ambient DO concentrations in groundwater additionally requires use of equipment and pro-cedures that avoid aeration and mitigate losses or gains of dis-solved gases in the water being sampled. A bailed sample, for example, is not recommended for DO measurement because the field sample-decanting process exposes the sample to the atmosphere; this provision likewise applies to any type of sampling device from which the sample is brought into contact with air when transferred to a measurement or analysis vessel.
Project data-quality requirements and objectives, site characteristics, and equipment availability will dictate whether (1) measurements will be made in situ (DO measured down-hole) or ex situ (DO measured above land surface, the inline-flow procedure), and whether (2) optical or spectrophotometric methods will be used for DO measurement.

12 Chapter A6.2. Dissolved Oxygen
The accuracy of DO measurements to 0.03 mg/L with an optical sensor has been field verified against Rhodazine D and Indigo Carmine spectrophotometric measurements on many occasions by USGS field-methods training class instructors. Therefore, applying optical sensor methods for groundwater DO measurements in the concentration range less than 2 mg/L is reliable. Data for some of these comparisons are in appendix 1.
If the anticipated DO concentration is less than 1.0 mg/L, use of spectrophotometric methods (section 3.0) is required to develop an instrument-specific rating before measure-ments made with a field instrument can be reported. Optical DO instrument readings are required to be verified through the development of an instrument-specific comparison with spectrophotometric methods. The instrument-specific rating should consist of at least five measurements made as nearly simultaneously as possible with the optical instrument and the spectrophotometric method. When compared, the median of these measurements should agree within 0.03 mg/L. If the measurements do not agree within 0.03 mg/L, the optical instrument should be checked and, if necessary, calibrated to the zero-DO point. The directions for the spectrophotometric method should also be checked and followed very closely. Once an instrument-specific rating has been developed, an optical DO instrument may be used to report DO concentra-tions greater than 0.03 mg/L. Example data for such a com-parison are in appendix 1.
For DO concentration less than 2 mg/L, a zero-DO cali-bration check or calibration of the DO instrument is required. Instruments are required to be performance tested before field use as described in section 2.1.2, Field-Trip Preparations.
Refer to NFM A6, Field Measurements, for guidance related to the selection, preparation, and procedures for in situ and ex situ measurement of field-determined properties. Project objectives and site characteristics will dictate the specific method selected. Select the field-measurement system that best fits the requirements of the data-collection effort.
Downhole (in situ) measurement: Submersible multi-parameter sondes and single-parameter sensors are deployed downhole to the targeted depth interval. Deployment typically includes data collection for a single field trip. The sonde or sensor sometimes is deployed for unattended monitoring, but the appropriate conditions and protocols must be followed (see NFM A6.8, Multiparameter Instruments).
Inline flow-through cell/chamber (ex situ) measurement: Sample is pumped directly (inline) to an airtight, transparent chamber or manufacturer-provided cell having either (1) leak-proof ports (compression fittings) that accommodate a DO single-parameter sensor (and other single-parameter sensors), or (2) a multiparameter sonde instrumented with an optical DO sensor.
The sample is transferred by using a positive-displacement submersible pump fitted with high-density plastic or fluorocar-bon-polymer tubing that is relatively gas impermeable.
• Use of transparent materials for the tubing and chamber is recommended to permit checking for air bubbles in the water stream or adhering to the sides of the tubing and flow-through cell or chamber (that have been introduced as an artifact of the sampling procedure, as distinguished from gas bubbles that are native to the formation water). Air bubbles intro-duced through leaking fittings can add substantial error to low-level DO measurements and should be excluded.
• Protect exposed sample tubing and the flow-through cell or chamber from direct sunlight.
Do not measure groundwater DO concentration in a sample extracted from a bailer or other sampling device that results in sample exposure to the atmosphere.
Follow the steps below to measure DO in groundwater:
1. Calibration checks:
• Check that the thermistor is accurate and that its calibration has been certified according to NFM 6.1, Temperature.
• Check the performance of the DO sensor at satura-tion and zero DO (refer to sections 2.1 and 2.2).
• If a calibration adjustment is necessary or if it is required to address program protocols, data-quality requirements, or site-specific conditions, calibrate the DO sensor onsite, in accordance with the proce-dures described in section 2.2.
2. Install the DO equipment:
• Downhole system—Lower the DO and temperature sensors to the measuring point, followed by the pump, to monitor DO variation during purging.
• Inline flow-through system—Refer to NFM 6.0, Field Measurements, for installation guidelines. For a system that includes a multiparameter instru-ment sonde, install the sonde in the flow-through cell provided by the manufacturer and in accordance with manufacturer instructions. Be sure to:
• Install the DO sensor through an air-tight grom-met if the chamber is instrumented with single-parameter sensors. Check that the seal around the DO sensor is intact and that the sensors are properly immersed.

3.0 Spectrophotometric (Rhodazine D and Indigo Carmine) Methods 13
• Shield the sample tubing and flow-through cell/chamber from direct sunlight to minimize changes to sample temperature.
• Dislodge and flush entrained gas bubbles from the tubing walls and flow-through chamber by tapping the tubing with a blunt tool (see Technical Note 4). Note that air bubbles are an indication of air leakage into the sampling system and should be distinguished from gas bubbles that could be native to formation water.
• Check for and eliminate back pressure in the flow-through chamber. The outlet of the chamber should be free flowing.
3. Measure and record the DO concentration at regular intervals throughout purging. Allow the sensors to equili-brate with groundwater for a minimum of 5 minutes before making the first measurement.
4. Check the stability (measurement variability) of the DO concentration toward the end of purging. The stability criterion is met when five consecutive measurements made at regularly spaced intervals of 3 to 5 minutes or more are within ±0.2 mg/L. (For each reading, monitor fluctuations for 30 to 60 seconds and record the median value, if necessary.) If the ±0.2-mg/L criterion is not met, increase the purging period in accordance with project objectives and continue to record measurements at regu-larly spaced time intervals.
5. Report DO concentration as the median of the final five DO readings recorded. Record on field forms any difficulty that may have been encountered with reading stabilization.
6. Remove the sensor from the water and rinse it with deionized or tap water. Store the sensor according to the manufacturer’s instructions.
Air bubbles in the tubing lines and flow-through chamber can add substantial error to measurements of DO in low-DO or oxygen-depleted groundwater.
TECHNICAL NOTE 4. Anomalously high DO measurements commonly are caused by aeration of groundwater during pumping. This situation can result from air leakage through loose fittings on production-well pumping systems, or if drawdown in the aquifer intro-duces air into the well-screen perforations. To understand these problems, review information about the pump and its depth within the well, data on well construction and water levels during pumping, and previous data records. Corrective actions may or may not be possible.
3.0 Spectrophotometric (Rhodazine D and Indigo Carmine) Methods
Various spectrophotometric methods (see Technical Note 5) are available for determining DO over a broad range of concentrations. The information in this section, however, is limited to the application of spectrophotometric analysis of Rhodazine D and Indigo Carmine reagents for determining DO concentrations in relatively oxygen-deficient waters—that is, DO concentration from about 2 to 0 mg/L. Indigo carmine is an organic salt formulated by sulfonating indigo dye. The reduced form of indigo carmine reacts with DO to form a blue product. The Rhodazine D (phenzone dye) compound, in reduced form, reacts with DO to form a bright pink reaction product. (CHEMetrics, Inc., 2012). The option to measure DO in the higher concentration ranges by spectrophotometry generally is selected when field conditions limit use of optical sensor methods. (Noninstrumental analyses of Rhodazine D and Indigo Carmine reagent indicators also are available for measuring aqueous DO concentrations, but the analysis can be subject to considerable operator variability and is not applica-ble to standard USGS field protocols, and is therefore beyond the scope of this guidance.)
TECHNICAL NOTE 5. Photometry measures only in the visible spectral region from 360 nanometers (nm) to 830 nm, the range in which human eyes are sensitive. Spectrophotometry is the quantitative measurement of the reflection or transmission properties of a material as a function of light wavelength. The National Institute of Standards and Technology (NIST) maintains the national scales for reflectance and transmittance in the ultraviolet, visible, and near-infrared spectral regions—that is, 250 to 2,500 nm (see http://www.nist.gov/pml/div685/grp03/photometry.cfm and http://www.nist.gov/pml/div685/grp03/spectrophotometry.cfm).
Spectrophotometric methods for DO measurement have been used in USGS fieldwork for measuring DO in oxygen-depleted groundwater and can be adapted for work in oxygen-depleted zones of lakes and reservoirs, but are not approved by the U.S. Environmental Protection Agency for application to regulatory assessments. The Rhodazine D spectrophotomet-ric method for determining DO concentrations in groundwater was introduced by White and others (1990) as a means for obtaining accurate DO-concentration data for groundwa-ter at a time when sensor methods were not capable of in situ measurement.
As mentioned previously, USGS technical staff have doc-umented optical sensor measurements at DO concentrations of 0.03 mg/L and spectrophotometric readings by using either Rhodazine D or Indigo Carmine to be of comparable accuracy. Data are shown in appendix 1. Comparisons between optical

14 Chapter A6.2. Dissolved Oxygen
Table 6.2–3. Equipment and supplies for the spectrophotometric method of determining dissolved-oxygen concentration using Rhodazine D and Indigo Carmine reagents.
[DO, dissolved-oxygen concentration; µS/cm, microsiemens per centimeter at 25 degrees Celsius]
Portable spectrophotometer (or photometer)Appropriate reagent kits for the expected DO range of the environ-
mental conditionBlank ampule (zero DO), included in each Rhodazine D kitSubmersible sampling tool, used in situ, to meet criteria described
in White and others (1990)Sampler device (overflow cell), length of C-flex tubing, and sample
pumpSafety gloves, glasses, and apron Waste-disposal containerDeionized water (maximum conductivity 1 µS/cm)Bottle, squeeze dispenser, for deionized waterLint-free wipes to remove moisture from the surface of the ampule
sensors and spectrophotometric methods were made by using an In-Situ, Inc., multiparameter sonde (various models) with a rugged dissolved oxygen (RDO) optical sensor. Before measuring and reporting hypoxic to anoxic (concentration less than 1.0 mg/L) DO-concentration data from optical sen-sors, the capability and accuracy of the optical sensor in this low-DO concentration range is required to be documented by making side-by-side measurements onsite to compare results with values obtained by using a spectrophotometric method. (See section 2.3, Measurement, above.)
The Rhodazine D spectrophotometric method is appli-cable to a range of DO concentrations from 0.025 to 1.0 mg/L in aqueous environments. The low-level Indigo Car-mine spectrophotometric methods are applicable to a range of DO concentrations from either 0.006 to 0.8 mg/L or 0.2 to 2.0 mg/L, depending on the specific method being used for the concentration range of interest.
3.1 Equipment and Supplies
The Rhodazine D and Indigo Carmine spectrophotomet-ric methods were designed to minimize atmospheric interac-tion with the water sampled. Two sampling systems commonly are used—(1) an in situ (submersible or downhole) sampler, such as the assemblies discussed in White and others (1990); and (2) a plastic overflow cell through which sample water is pumped (see table 6.2–3).
The sampling system is configured to use a self-filling ampule with the Rhodazine D or Indigo Carmine reagent vac-uum sealed inside. DO concentration is determined instrumen-tally on the resultant solution by using a spectrophotometer or photometer. The spectrophotometer (or photometer) selected
must be adjustable to the appropriate wavelength of incident light needed for the determination of DO concentration in the resultant colored sample, based on the reagent used. Appli-cable spectrophotometers, photometers, and ampule kits are available commercially from various companies for a variety of concentration ranges.
Information about the accuracy of commercially avail-able reagent kits may not be included with the equipment or supplies purchased. Always check with the manufacturer regarding the accuracy of the specific test kit(s) of interest. The accuracy of the test kits will typically be a function of the range of DO concentration in the sample.
3.2 Calibration and Interferences
For the Rhodazine D and Indigo Carmine methods, DO is measured by the spectrophotometer as percent absorbance. A calibration chart typically is provided with each chemi-cal reagent kit, along with a regression formula to convert absorbance to micrograms per liter of DO for use with a spectrophotometer that does not perform the conversion auto-matically. Most current spectrophotometers and photometers available for measurement of DO are precalibrated for direct readout of DO concentration in milligrams per liter.
Ensure that an appropriate blank ampule is used to zero the spectrophotometer (or photometer).
Additional calibration is needed if the method will be used to determine DO in heavily contaminated or acidic waters. Advanced calibration can be done by equilibrat-ing a water sample with known partial pressures of atmo-spheric oxygen (White and others, 1990). Atmospheric oxygen standards are available from suppliers of gas-chromatography equipment.
Rhodazine D and Indigo Carmine chemical reagent-based methods are not subject to salinity or dissolved-gas interfer-ences (ASTM International, 2009; ASTM International, 2018; White and others, 1990; Gilbert and others, 1982). Interfer-ences from total salinity, major dissolved inorganic species, dissolved gases, or temperature are typically negligible with these methods. However, turbidity may affect the Indigo Carmine method, and color and turbidity may affect the Rhodazine D method. If these methods are used in colored or turbid water, first conduct an assessment of the amount of bias attributable to such effects.
The spectrophotometric method using Rhodazine D reagent is affected by the presence of oxidizing agents, includ-ing chlorine, ferric and cupric ions, and hexavalent chromium, resulting in high-biased DO readings (White and others, 1990).4
• The presence of cupric copper and ferric iron at a concentration less than 50 micrograms per liter (µg/L) may cause a bias of less than 1 µg/L; at a concentration
4See also CHEMetrics, Inc., Simplicity in water analysis, accessed Sep-tember 4, 2019, at https://www.chemetrics.com/product-category/test-kits/oxygen-dissolved/.

3.0 Spectrophotometric (Rhodazine D and Indigo Carmine) Methods 15
of 100 µg/L, cupric copper may cause a bias of 5 µg/L, and ferric iron may cause a bias of 7 µg/L.
• A sample pH of 2 or less may cause erroneous results.
• A hydroquinone concentration greater than 200 µg/L is a positive interferent and its oxidation byproduct, benzoquinone, causes a false positive result. The effect from oxidizing agents can be corrected if the concen-trations of the interfering species are known (White and others, 1990).
The spectrophotometric method using Indigo Carmine reagent is affected by ferric iron, hypochlorite (chlorine), and chromate, which can cause a false positive at concentrations equal to or greater than 10 mg/L each.
• Cupric copper interferes positively at a concentration equal to or greater than 100 mg/L.
• Seawater may cause the reagent to precipitate.
3.3 Measurement
USGS spectrophotometric measurement procedures for the determination of DO concentration using the Rhodazine D and Indigo Carmine reagents provided in commercially available kits supplied by CHEMetrics, Inc., and Hach, respectively, have been tested and quality assured.5 Although the instructions provided by the manufacturers generally should be followed, augmented instructions and information are provided below and advised for USGS personnel to follow to ensure that DO measurements meet USGS standards for accuracy and reproducibility.
Rhodazine D and Indigo Carmine reagents react with DO to produce an oxidized complex characterized by bright pink- or bright blue-colored reaction products, respectively. The color intensity is proportional to the concentration of the initial DO present. Timing is critically important for colo-rimetric analyses made with a spectrophotometer. Follow the explicit instructions for the waiting time after the sample mixes with the reagent. The reaction with the reagents occurs almost instantaneously for both the Rhodazine D and Indigo Carmine methods. Color development continues after the time interval specified for these methods because oxygen from the atmosphere continuously diffuses into the sample through the broken ampule tip.
Do not extend the waiting times specified in the Rho-dazine D and Indigo Carmine methods. Adhere to them strictly.
Excessive mixing of the ampule before placing it into the spectrophotometer also may introduce atmospheric oxygen, which can bias the results.
5Instructions from Hach and CHEMetrics, Inc., for selected colorimetry-based methods at DO concentration ranges relevant to routine USGS sampling were selected for testing because USGS field personnel currently use the equipment and reagent kits from these companies.
Use a pumping flow rate of about 500 milliliters per minute for sample collection. Allow the sampling device to overflow during sample collection.
Follow the steps below to measure DO using the spectrophoto-metric method:
1. Familiarize yourself with the manufacturer’s instructions regarding use of the kit and adjust the instructions to incorporate the procedures that follow, as applicable.
2. Accounting for site characteristics and project objec-tives, if measuring DO in groundwater, purge the well following guidelines in NFM 4.
3. Set the spectrophotometer to an appropriate wavelength for the kit being used. When using a manufacturer-des-ignated DO photometer (or spectrophotometer), verify whether or not introduction of the ampule provided in the kit will automatically trigger the correct wavelength setting.
4. “Zero” the spectrophotometer by using the blank pro-vided in the kit or native water according to the manu-facturer’s instructions.
5. When collecting the sample:
• Prevent sample aeration. Use a positive-displace-ment submersible pump and high-density plastic or fluorocarbon polymer sample tubing that is relatively gas impermeable, if possible, throughout the mea-surement system.
• Operate equipment to mitigate losses or gains of dissolved gases. (Consult NFM 6.0 for proper downhole and inline flow-through chamber sampling procedures.)
6. Select your sample-collection method. Use either a downhole or an overflow-sampler device.
• Go to step 7 for the downhole sampling tool method6, or
• Go to step 8 for the plastic overflow-sampler device with a suitable pump method.
7. Downhole system: After purging the well (according to guidelines in NFM 4), follow steps 7a through 7d.
a. Carefully immerse a reagent-containing ampule on the sampling tool that is attached to a wire line.
b. At the desired depth of sample collection (in a well or surface-water body), break the scored tip of the ampule by using a sharp upward tugging motion on the sampling tool. This action permits sample water
6A downhole sampling tool is described by White and others (1990).

16 Chapter A6.2. Dissolved Oxygen
to be drawn into the ampule. During the sample’s transit to the surface, the progressively decreasing pressure surrounding the ampule prevents cross contamination from overlying water through the ampule tip.
c. Withdraw the ampule from the sampling device and invert once to mix the contents of the ampule, allowing the bubble to travel from end to end; follow the kit-specific instructions regarding the number of ampule inversions keeping in mind that USGS field observations indicate that vigorous or repeated mix-ing of the filled ampule can introduce atmospheric oxygen and bias the measurement. Take care not to introduce atmospheric oxygen into the ampule. Ensure that the time required to bring the ampule to the surface does not exceed the waiting times specified by the method. The downhole sampling system may work best for shallow wells and surface-water bodies.
d. Wipe all liquid from the exterior of the ampule by using a lint-free tissue. To make the DO measure-ment, skip to step 9.
8. Overflow device: After purging the well (according to guidelines in NFM 4), follow steps 8a through 8d.
a. Connect the plastic overflow-sampling device to the outlet of the pump tubing with gas-impermeable tubing 1 meter or less in length. The overflow device is used to break the ampule in the stream of flowing water. If the Rhodazine D method is used, the kit is equipped with the appropriate overflow-sampling device needed to crack the ampule. If the Indigo Carmine method is used, adapt the instructions as follows to supplement those provided7:
• Obtain a plastic funnel with a funnel size of approximately 250 milliliters.
• Adapt the funnel to the end of a length of gas-impermeable tubing. This funnel, while over-flowing, will allow the tip of the Indigo Carmine ampule to be broken very close to the location where the newest, unmixed sample water flows into the funnel.
• The flexible rubber-like cap supplied with the Hach Indigo Carmine ampules can be filled with sample water and inverted to cover the broken tip of the ampule if the ampule is also inverted with the broken tip facing down. This action
7The Hach Indigo Carmine kit instructs the user to collect the sample from a stream of water that is hard plumbed to the sample source and mentions using a funnel. Tests conducted by USGS personnel indicated that further supple-menting the directions in step 8 substantially improves measurement accuracy and reproducibility.
provides protection from oxygen diffusion from the atmosphere into the broken tip of the ampule during transport and drying for measurement in the spectrophotometer.
b. Check for air bubbles in or adhering to the tubing and flow-through chamber.
c. Tap the tubing with a blunt tool to dislodge entrained air bubbles.
• Insert the glass ampule, tip first, into the overflow-ing sampling device so that the tip is at the bottom of the device, near the point of water inflow.
• Snap the tip by gently pressing the upper end of the ampule toward the wall of the sampling device. The vacuum ampule will draw the sample water in, leaving a small bubble at one end.
d. Ensure that the ampule is full before proceeding to prevent entraining excess atmospheric oxygen and thereby producing erroneous readings.
• Withdraw the ampule from the sampling device and invert it to mix the contents of the ampule, allowing the bubble to travel from end to end; follow the kit-specific instructions regarding the number of ampule inversions, keeping in mind that USGS field observations indicate that vigor-ous or repeated mixing of the filled ampule can introduce atmospheric oxygen and bias the mea-surement. Take care to not introduce atmospheric oxygen into the ampule.
• Wipe all liquid from the exterior of the ampule by using a lint-free tissue.
9. Insert the ampule directly into the spectrophotometer cell holder, either immediately after retrieval or as specified in the kit-specific instructions.
10. Read the concentration or absorbance:
• Rhodazine D—Record the measurement within the time interval directed by the kit manufacturer (for example, within 30 seconds when using the CHE-Metrics ampule kit).
• Indigo Carmine—Record the measurement within the time interval directed by the kit manufacturer.
• If using a spectrophotometer that does not convert absorbance values of DO measurements to units of milligrams per liter for the kit being used, use regression equations (or the chart provided in the kit) to convert the units (see White and others, 1990).
11. Quality control: It is recommended to make multiple measurements to document the precision and (or)

5.0 Correction Factors for Oxygen Solubility and Salinity 17
accuracy of the DO concentration to be reported. Repeat steps 9 and 10 twice in rapid succession to document measurement precision. Make a total of three measure-ments to document the precision of the method.
12. To document the variability of DO concentrations within the water system being measured, repeat the measure-ment on three sequentially collected samples.
Do not exceed time interval specified by manufacturer for completion of DO measurement when using Rhoda-zine D or Indigo Carmine reagents.
4.0 ReportingUSGS personnel are instructed to enter the DO value on
field forms or into electronic records indicating the method code (optical, spectrophoto metric, other) appropriate for the method used for DO measurement.
DO concentrations for the optical-sensor method are reported to the nearest 0.1 mg/L and stored to the nearest 0.01 mg/L.
DO concentrations for the spectrophotometric/Rhodazine D and Indigo Carmine methods are reported and stored to the nearest 0.01 mg/L.
Note that the percentage of DO saturation in water can be greater than 100 as a result of nonequilibrium conditions induced by photosynthesis and oxygen exchange with the atmosphere. When the concentration exceeds 20 mg/L, check the sensor manufacturer’s specifications and:
• Report “> the listed numerical limit” if the concentra-tion exceeds the manufacturer’s specified sensor range.
5.0 Correction Factors for Oxygen Solubility and Salinity
Solubility concentrations of oxygen in freshwater at various temperatures and pressures (table 6.2–2, at end of chapter) and correction factors for salinity based on specific conductance (table 6.2–4, at end of chapter) were generated from the equations of Benson and Krause (1980, 1984) and can be customized to cover the range and number of decimal places needed; see U.S. Geological Survey Office of Water Quality Technical Memorandum 2011.03 (U.S. Geological Survey, 2011). By accessing “DOTABLES” at https://water.usgs.gov/software/DOTABLES/, the interactive software that generated tables 6.2–2 and 6.2–4 (at end of chapter) the user can self-generate individual values or tables of a specific range of oxygen-solubility and salinity correction factors.
To adjust freshwater oxygen-solubility values for the effects of salinity, use correction factors based on specific
conductance. Report the corrected values. Refer to the manu-facturer’s instructions for the DO instrument before applying a salinity correction. Most multiparameter instruments that include DO and specific-conductance sensors automatically correct the DO reading for salinity if needed, unless the fea-ture is turned off by the user.
Correcting DO solubility for saline waters (specific conductance greater than 2,000 µS/cm) varies with instru-ment type, calibration method, and the salts in solution. The correction based on specific conductance (table 6.2–4, at end of chapter) is useful because accurate conductivity can be determined easily from a field measurement.Example salinity correction:
Consider a DO measurement made in water with a temp-erature of 20.0 °C, an atmospheric pressure of 750 mm of mercury, and a specific conductance of 8,000 µS/cm. The freshwater oxygen solubility from table 6.2–2 (at end of chap-ter) is 8.97 mg/L for that temperature and pressure; the salinity correction factor from table 6.2–4 (at end of chapter) is 0.9733 for that temperature and specific conductance. The solubility of oxygen under these conditions then is
8.97 mg/L x 0.9733 = 8.73 mg/L (1)
The presence of dissolved ions in the water decreases the oxygen solubility.
If calibrating an instrument that lacks an internal salinity-compensation algorithm, the user could elect to adjust the DO instrument to read 8.73 mg/L for a 100-percent saturation condition.
If the DO measurement made with a sensor under the above conditions was 7.50 mg/L and the DO instrument did not have an internal salinity-compensation algorithm, then the actual DO concentration should be reported as 7.50 mg/L multiplied by 0.9733, or 7.30 mg/L.Example percent-saturation calculation:
To express results as percent saturation, use the following equation:
( )
( / ) 100 ( / )
DO percent saturationmeasured DO mg L
DO mg L at percent saturation
=
×100 -
(2)
For a salinity-corrected DO measurement of 7.30 mg/L for a sample in which the oxygen solubility (salinity corrected) is 8.73 mg/L as in the above example, the percent DO saturation would be the dividend of 7.30 divided by 8.73, multiplied by 100, which equals 83.6 percent. Note that for measurements made with the spectrophotometric method, salinity-correction factors are not applied to the measured concentration because salinity does not interfere with spectro-photometric DO analyses.

18 Chapter A6.2. Dissolved Oxygen
AcknowledgmentsThe information in the U.S. Geological Survey (USGS)
National Field Manual (NFM) is based on existing manuals, various reference documents, and a broad spectrum of expertise provided by USGS colleagues. Authors of previous versions of NFM chapter A6.2 were S.A. Rounds, F.D. Wilde, G.F. Ritz, M.A. Sylvester, R.T. Iwatsubo, D.B. Radtke, and M.E. Lewis, whose expertise and integrity provided the groundwork for this and future versions of this chapter. The persistence and spirit that all of our USGS colleagues brought to the development of a national field manual were invaluable.
The following USGS colleagues provided detailed technical content and reviews that improved the quality of this report: Gerolamo Casile, Kimberly Beisner, Irene Fisher, Allison Leninger, Cherie Miller, Timothy Oden, Patrick Rasmussen, and Stanley Skrobialowski. Editorial and produc-tion assistance from Marilyn Billone, Sandy Cooper, Elizabeth Good, Cathy Knutson, Katharine Schindler, and Dale Sim-mons is greatly appreciated. These individuals contributed to the accuracy, quality, and usability of the NFM, and dem-onstrated much patience as we traversed the difficult task of developing the new format.
Special thanks are extended to Franceska Wilde (USGS), who led the effort for the NFM from its inception until her retirement in 2014; the USGS NFM Steering Committee (Gerolamo Casile, Alissa Coes, Michael Manning, Cherie Miller, Timothy Oden, Lisa Olsen, Michael Rosen, and Stanley Skrobialowski); Cherie Miller, who led the effort from 2016 to 2018; and Gerolamo Casile, who assumed responsibility for the NFM in 2018.
References Cited
American Public Health Association, 2005, Standard methods for the examination of water and wastewater (21st ed.): Washington, D.C., American Public Health Association, American Water Works Association, and Water Environment Federation, p. 4–136 to 4–137, http://www.standardmethods.org/.
ASTM International, 2009, D5543–09 standard test methods for low-level dissolved oxygen in water: ASTM International web page accessed January 6, 2020, at https://webstore.ansi.org/Standards/ASTM/ASTMD554309.
ASTM International, 2018, D888–18 standard test methods for dissolved oxygen in water: ASTM International web page accessed January 16, 2020, at https://www.astm.org/Standards/D888.htm.
Benson, B.B., and Krause, Daniel, Jr., 1980, The concentration and isotopic fractionation of gases dissolved in freshwater in equilibrium with the atmosphere—1. Oxygen: Limnology and Oceanography, v. 25, no. 4, p. 662–671, accessed January 6, 2020, at https://pdfs.semanticscholar.org/0215/547aabc7fbc4acee0684e8a2d8638b5b8214.pdf?_ga=2.185539690.213638103.1578329446-681955374.1578329446.
CHEMetrics, Inc., 2012, Oxygen, dissolved: CHEMetrics, Inc., web page accessed January 6, 2020, at https://www.chemetrics.com/product-category/test-kits/oxygen-dissolved/.
Fishman, M.J., and Friedman, L.C., eds., 1989, Methods for determination of inorganic substances in water and fluvial sediments (3d ed.): U.S. Geological Survey Techniques of Water-Resources Investigations, book 5, chap. A1, 545 p., http://pubs.usgs.gov/twri/05a01/report.pdf.
Gilbert, T.W., Behymer, T.D., Castaneda, H.B., 1982, Deter-mination of dissolved oxygen in natural and wastewaters: American Laboratory, p. 119–134. (Also available at http://www.expotechusa.com/catalogs%5CChemetrics%5Ccatalogs/Oxygen_Dissolved_2004.pdf, accessed January 16, 2020.)
Hach, Hach LDO FAQ: Hach web page accessed January 6, 2020, at https://www.hach.com/LDOFAQ.
Hem, J.D., 1985, Study and interpretation of the chemical characteristics of natural water (3d ed.): U.S. Geological Survey Water-Supply Paper 2254, p. 155–156, http://pubs.usgs.gov/wsp/wsp2254/.
In-Situ Inc., 2016, Aqua TROLL® 600 multiparameter sonde Operator’s Manual: In-Situ Inc. web page accessed January 6, 2020, at https://in-situ.com/pub/media/support/documents/Aqua-TROLL-600-Manual.pdf.
Kane, J.A., 1999, Improved optical sensor for monitoring dissolved oxygen: Tech Briefs Media Group, KSC-11998, accessed January 6, 2020, at https://www.techbriefs.com/component/content/article/tb/supplements/ptb/briefs/30037.
Rounds, S.A., Wilde, F.D., and Ritz, G.D., 2013 (ver. 3.0), Dissolved oxygen: U.S. Geological Survey Techniques of Water-Resources Investigations, book 9, chap. A6.2, 55 p., https://doi.org/10.3133/twri09A6.2.
U.S. Geological Survey, 2002, Water-quality field methods/National Field Manual for the Collection of Water-Quality Data: U.S. Geological Survey Office of Water Quality Technical Memorandum 2002.13, accessed March 26, 2019, at https://water.usgs.gov/admin/memo/QW/qw02.13.html.
https://pdfs.semanticscholar.org/0215/547aabc7fbc4acee0684e8a2d8638b5b8214.pdf?_ga=2.185539690.21363
https://pdfs.semanticscholar.org/0215/547aabc7fbc4acee0684e8a2d8638b5b8214.pdf?_ga=2.185539690.21363
https://pdfs.semanticscholar.org/0215/547aabc7fbc4acee0684e8a2d8638b5b8214.pdf?_ga=2.185539690.21363

References Cited 19
U.S. Geological Survey, 2011, U.S. Geological Survey Office of Water Quality Technical Memorandum 2011.03, 2 p. plus attachment, accessed January 6, 2020, at http://water.usgs.gov/admin/memo/QW/qw11.03.pdf.
U.S. Geological Survey, variously dated, National field man-ual for the collection of water-quality data: U.S. Geological Survey Techniques and Methods, book 9, chap. A0–A10, accessed September 16, 2020, at https://www.usgs.gov/mission-areas/water-resources/science/national-field-man-ual-collection-water-quality-data-nfm?qt-science_center_objects=0#qt-science_center_objects.
Wagner, R.J., Boulger, R.W., Jr., Oblinger, C.J., and Smith, B.A., 2006, Guidelines and standard procedures for con-tinuous water-quality monitors—Station operation, record computation, and data reporting: U.S. Geological Survey Techniques and Methods 1–D3, http://pubs.water.usgs.gov/tm1D3.
White, A.F., Peterson, M.L., and Solbau, R.D., 1990, Measure-ment and interpretation of low levels of dissolved oxygen in groundwater: Groundwater, v. 28, no. 4, p. 584–590 (abstract), accessed January 6, 2020, at http://onlinelibrary.wiley.com/doi/10.1111/j.1745-6584.1990.tb01715.x/abstract.
Wilde, F.D., and Skrobialowski, S.C., 2011, U.S. Geological Survey protocol for sample collection in response to the Deepwater Horizon oil spill, Gulf of Mexico, 2010: U.S. Geological Survey Open-File Report 2011–1098, 178 p., http://pubs.usgs.gov/of/2011/1098/.
Wood, W.W., 1981, Guidelines for collection and field analysis of ground-water samples for selected unstable constituents: U.S. Geological Survey Techniques of Water-Resources Investigations, book 1, chap. D2, p. 22–24, http://pubs.usgs.gov/twri/twri1-d2/pdf/twri_1-D2_a.pdf.
YSI, Inc., 2019, Dissolved oxygen measurement in water with oxygen meters: accessed January 6, 2020, at https://www.ysi.com/parameters/dissolved-oxygen.

20 Chapter A6.2. Dissolved OxygenTa
ble
6.2–
2.
Solu
bilit
y of
oxy
gen
in fr
eshw
ater
at v
ario
us te
mpe
ratu
res
and
pres
sure
s.
[Sol
ubili
ty sh
own
in m
illig
ram
s per
lite
r; va
lues
are
bas
ed o
n eq
uatio
ns p
ublis
hed
by B
enso
n an
d K
raus
e (1
980,
198
4); T
emp.
(°C
), te
mpe
ratu
re in
deg
rees
Cel
sius
; sol
ubili
ty v
alue
s for
atm
osph
eric
pre
ssur
es
from
600
to 6
95 m
illim
eter
s of m
ercu
ry a
re a
fter t
he v
alue
s for
0-4
0 °C
]
Tem
p.
(deg
C)
Atm
osph
eric
pre
ssur
e, in
mill
imet
ers
of m
ercu
ry
700
705
710
715
720
725
730
735
740
745
750
755
760
765
770
775
780
785
790
795
0.0
13.4
613
.56
13.6
513
.75
13.8
513
.94
14.0
414
.14
14.2
314
.33
14.4
314
.52
14.6
214
.72
14.8
114
.91
15.0
115
.10
15.2
015
.30
0.5
13.2
713
.37
13.4
613
.56
13.6
513
.75
13.8
413
.94
14.0
314
.13
14.2
314
.32
14.4
214
.51
14.6
114
.70
14.8
014
.89
14.9
915
.08
1.0
13.0
913
.18
13.2
813
.37
13.4
613
.56
13.6
513
.75
13.8
413
.93
14.0
314
.12
14.2
214
.31
14.4
014
.50
14.5
914
.69
14.7
814
.87
1.5
12.9
113
.00
13.0
913
.19
13.2
813
.37
13.4
613
.56
13.6
513
.74
13.8
413
.93
14.0
214
.11
14.2
114
.30
14.3
914
.48
14.5
814
.67
2.0
12.7
312
.82
12.9
113
.01
13.1
013
.19
13.2
813
.37
13.4
613
.56
13.6
513
.74
13.8
313
.92
14.0
114
.10
14.2
014
.29
14.3
814
.47
2.5
12.5
612
.65
12.7
412
.83
12.9
213
.01
13.1
013
.19
13.2
813
.37
13.4
613
.55
13.6
413
.73
13.8
213
.91
14.0
014
.10
14.1
914
.28
3.0
12.3
912
.48
12.5
712
.66
12.7
512
.84
12.9
313
.02
13.1
013
.19
13.2
813
.37
13.4
613
.55
13.6
413
.73
13.8
213
.91
14.0
014
.09
3.5
12.2
312
.31
12.4
012
.49
12.5
812
.67
12.7
512
.84
12.9
313
.02
13.1
113
.19
13.2
813
.37
13.4
613
.55
13.6
313
.72
13.8
113
.90
4.0
12.0
712
.15
12.2
412
.33
12.4
112
.50
12.5
912
.67
12.7
612
.85
12.9
313
.02
13.1
113
.20
13.2
813
.37
13.4
613
.54
13.6
313
.72
4.5
11.9
111
.99
12.0
812
.17
12.2
512
.34
12.4
212
.51
12.5
912
.68
12.7
712
.85
12.9
413
.02
13.1
113
.20
13.2
813
.37
13.4
513
.54
5.0
11.7
511
.84
11.9
212
.01
12.0
912
.18
12.2
612
.35
12.4
312
.52
12.6
012
.69
12.7
712
.86
12.9
413
.03
13.1
113
.19
13.2
813
.36
5.5
11.6
011
.69
11.7
711
.86
11.9
412
.02
12.1
112
.19
12.2
712
.36
12.4
412
.52
12.6
112
.69
12.7
812
.86
12.9
413
.03
13.1
113
.19
6.0
11.4
611
.54
11.6
211
.70
11.7
911
.87
11.9
512
.04
12.1
212
.20
12.2
812
.37
12.4
512
.53
12.6
112
.70
12.7
812
.86
12.9
413
.03
6.5
11.3
111
.39
11.4
811
.56
11.6
411
.72
11.8
011
.88
11.9
712
.05
12.1
312
.21
12.2
912
.37
12.4
612
.54
12.6
212
.70
12.7
812
.86
7.0
11.1
711
.25
11.3
311
.41
11.4
911
.58
11.6
611
.74
11.8
211
.90
11.9
812
.06
12.1
412
.22
12.3
012
.38
12.4
612
.54
12.6
212
.70
7.5
11.0
311
.11
11.1
911
.27
11.3
511
.43
11.5
111
.59
11.6
711
.75
11.8
311
.91
11.9
912
.07
12.1
512
.23
12.3
112
.39
12.4
712
.55
8.0
10.9
010
.98
11.0
611
.14
11.2
111
.29
11.3
711
.45
11.5
311
.61
11.6
911
.76
11.8
411
.92
12.0
012
.08
12.1
612
.24
12.3
212
.39
8.5
10.7
710
.84
10.9
211
.00
11.0
811
.16
11.2
311
.31
11.3
911
.47
11.5
411
.62
11.7
011
.78
11.8
611
.93
12.0
112
.09
12.1
712
.24
9.0
10.6
410
.71
10.7
910
.87
10.9
411
.02
11.1
011
.18
11.2
511
.33
11.4
111
.48
11.5
611
.64
11.7
111
.79
11.8
711
.94
12.0
212
.10
9.5
10.5
110
.59
10.6
610
.74
10.8
110
.89
10.9
711
.04
11.1
211
.19
11.2
711
.35
11.4
211
.50
11.5
711
.65
11.7
311
.80
11.8
811
.95
10.0
10.3
910
.46
10.5
410
.61
10.6
910
.76
10.8
410
.91
10.9
911
.06
11.1
411
.21
11.2
911
.36
11.4
411
.51
11.5
911
.66
11.7
411
.81
10.5
10.2
610
.34
10.4
110
.49
10.5
610
.64
10.7
110
.78
10.8
610
.93
11.0
111
.08
11.1
611
.23
11.3
011
.38
11.4
511
.53
11.6
011
.68
11.0
10.1
510
.22
10.2
910
.37
10.4
410
.51
10.5
910
.66
10.7
310
.81
10.8
810
.95
11.0
311
.10
11.1
711
.25
11.3
211
.39
11.4
711
.54
11.5
10.0
310
.10
10.1
710
.25
10.3
210
.39
10.4
710
.54
10.6
110
.68
10.7
610
.83
10.9
010
.97
11.0
511
.12
11.1
911
.26
11.3
411
.41
12.0
9.91
9.99
10.0
610
.13
10.2
010
.27
10.3
510
.42
10.4
910
.56
10.6
310
.71
10.7
810
.85
10.9
210
.99
11.0
611
.14
11.2
111
.28
12.5
9.80
9.87
9.94
10.0
210
.09
10.1
610
.23
10.3
010
.37
10.4
410
.51
10.5
810
.66
10.7
310
.80
10.8
710
.94
11.0
111
.08
11.1
513
.09.
699.
769.
839.
909.
9710
.04
10.1
110
.19
10.2
610
.33
10.4
010
.47
10.5
410
.61
10.6
810
.75
10.8
210
.89
10.9
611
.03
13.5
9.59
9.65
9.72
9.79
9.86
9.93
10.0
010
.07
10.1
410
.21
10.2
810
.35
10.4
210
.49
10.5
610
.63
10.7
010
.77
10.8
410
.91
14.0
9.48
9.55
9.62
9.69
9.76
9.82
9.89
9.96
10.0
310
.10
10.1
710
.24
10.3
110
.37
10.4
410
.51
10.5
810
.65
10.7
210
.79
14.5
9.38
9.44
9.51
9.58
9.65
9.72
9.78
9.85
9.92
9.99
10.0
610
.13
10.1
910
.26
10.3
310
.40
10.4
710
.53
10.6
010
.67

References Cited 21Ta
ble
6.2–
2.
Solu
bilit
y of
oxy
gen
in fr
eshw
ater
at v
ario
us te
mpe
ratu
res
and
pres
sure
s.—
Cont
inue
d
[Sol
ubili
ty sh
own
in m
illig
ram
s per
lite
r; va
lues
are
bas
ed o
n eq
uatio
ns p
ublis
hed
by B
enso
n an
d K
raus
e (1
980,
198
4); T
emp.
(°C
), te
mpe
ratu
re in
deg
rees
Cel
sius
; sol
ubili
ty v
alue
s for
atm
osph
eric
pre
ssur
es
from
600
to 6
95 m
illim
eter
s of m
ercu
ry a
re a
fter t
he v
alue
s for
0-4
0 °C
]
Tem
p.
(deg
C)
Atm
osph
eric
pre
ssur
e, in
mill
imet
ers
of m
ercu
ry
700
705
710
715
720
725
730
735
740
745
750
755
760
765
770
775
780
785
790
795
15.0
9.27
9.34
9.41
9.48
9.54
9.61
9.68
9.75
9.81
9.88
9.95
10.0
210
.08
10.1
510
.22
10.2
910
.35
10.4
210
.49
10.5
615
.59.
189.
249.
319.
389.
449.
519.
589.
649.
719.
789.
849.
919.
9810
.04
10.1
110
.18
10.2
410
.31
10.3
810
.44
16.0
9.08
9.14
9.21
9.28
9.34
9.41
9.47
9.54
9.61
9.67
9.74
9.80
9.87
9.94
10.0
010
.07
10.1
310
.20
10.2
710
.33
16.5
8.98
9.05
9.11
9.18
9.24
9.31
9.37
9.44
9.50
9.57
9.64
9.70
9.77
9.83
9.90
9.96
10.0
310
.09
10.1
610
.22
17.0
8.89
8.95
9.02
9.08
9.15
9.21
9.28
9.34
9.41
9.47
9.54
9.60
9.66
9.73
9.79
9.86
9.92
9.99
10.0
510
.12
17.5
8.80
8.86
8.92
8.99
9.05
9.12
9.18
9.24
9.31
9.37
9.44
9.50
9.57
9.63
9.69
9.76
9.82
9.89
9.95
10.0
118
.08.
708.
778.
838.
908.
969.
029.
099.
159.
219.
289.
349.
409.
479.
539.
599.
669.
729.
789.
859.
9118
.58.
628.
688.
748.
808.
878.
938.
999.
069.
129.
189.
249.
319.
379.
439.
509.
569.
629.
699.
759.
8119
.08.
538.
598.
658.
728.
788.
848.
908.
969.
039.
099.
159.
219.
289.
349.
409.
469.
539.
599.
659.
7119
.58.
448.
508.
578.
638.
698.
758.
818.
878.
949.
009.
069.
129.
189.
259.
319.
379.
439.
499.
559.
6220
.08.
368.
428.
488.
548.
608.
668.
738.
798.
858.
918.
979.
039.
099.
159.
219.
289.
349.
409.
469.
5220
.58.
288.
348.
408.
468.
528.
588.
648.
708.
768.
828.
888.
949.
009.
069.
129.
189.
259.
319.
379.
4321
.08.
198.
258.
318.
378.
438.
498.
558.
618.
678.
738.
798.
858.
928.
989.
049.
109.
169.
229.
289.
3421
.58.
118.
178.
238.
298.
358.
418.
478.
538.
598.
658.
718.
778.
838.
898.
959.
019.
079.
139.
199.
2522
.08.
048.
098.
158.
218.
278.
338.
398.
458.
518.
578.
638.
688.
748.
808.
868.
928.
989.
049.
109.
1622
.57.
968.
028.
088.
138.
198.
258.
318.
378.
438.
488.
548.
608.
668.
728.
788.
848.
898.
959.
019.
0723
.07.
887.
948.
008.
068.
118.
178.
238.
298.
358.
408.
468.
528.
588.
648.
698.
758.
818.
878.
938.
9823
.57.
817.
867.
927.
988.
048.
098.
158.
218.
278.
338.
388.
448.
508.
568.
618.
678.
738.
798.
848.
9024
.07.
737.
797.
857.
907.
968.
028.
088.
138.
198.
258.
308.
368.
428.
488.
538.
598.
658.
708.
768.
8224
.57.
667.
727.
777.
837.
897.
948.
008.
068.
118.
178.
238.
288.
348.
408.
458.
518.
578.
628.
688.
7425
.07.
597.
657.
707.
767.
817.
877.
937.
988.
048.
108.
158.
218.
268.
328.
388.
438.
498.
548.
608.
6625
.57.
527.
587.
637.
697.
747.
807.
857.
917.
978.
028.
088.
138.
198.
248.
308.
358.
418.
478.
528.
5826
.07.
457.
517.
567.
627.
677.
737.
787.
847.
897.
958.
008.
068.
118.
178.
228.
288.
338.
398.
448.
5026
.57.
387.
447.
497.
557.
607.
667.
717.
777.
827.
887.
937.
998.
048.
108.
158.
208.
268.
318.
378.
4227
.07.
327.
377.
437.
487.
537.
597.
647.
707.
757.
817.
867.
917.
978.
028.
088.
138.
198.
248.
298.
3527
.57.
257.
307.
367.
417.
477.
527.
577.
637.
687.
747.
797.
847.
907.
958.
018.
068.
118.
178.
228.
2728
.07.
197.
247.
297.
357.
407.
457.
517.
567.
617.
677.
727.
777.
837.
887.
937.
998.
048.
108.
158.
2028
.57.
127.
187.
237.
287.
337.
397.
447.
497.
557.
607.
657.
717.
767.
817.
877.
927.
978.
028.
088.
1329
.07.
067.
117.
167.
227.
277.
327.
387.
437.
487.
537.
597.
647.
697.
747.
807.
857.
907.
958.
018.
0629
.57.
007.
057.
107.
157.
217.
267.
317.
367.
427.
477.
527.
577.
627.
687.
737.
787.
837.
897.
947.
99

22 Chapter A6.2. Dissolved OxygenTa
ble
6.2–
2.
Solu
bilit
y of
oxy
gen
in fr
eshw
ater
at v
ario
us te
mpe
ratu
res
and
pres
sure
s.—
Cont
inue
d
[Sol
ubili
ty sh
own
in m
illig
ram
s per
lite
r; va
lues
are
bas
ed o
n eq
uatio
ns p
ublis
hed
by B
enso
n an
d K
raus
e (1
980,
198
4); T
emp.
(°C
), te
mpe
ratu
re in
deg
rees
Cel
sius
; sol
ubili
ty v
alue
s for
atm
osph
eric
pre
ssur
es
from
600
to 6
95 m
illim
eter
s of m
ercu
ry a
re a
fter t
he v
alue
s for
0-4
0 °C
]
Tem
p.
(deg
C)
Atm
osph
eric
pre
ssur
e, in
mill
imet
ers
of m
ercu
ry
700
705
710
715
720
725
730
735
740
745
750
755
760
765
770
775
780
785
790
795
30.0
6.94
6.99
7.04
7.09
7.14
7.20
7.25
7.30
7.35
7.40
7.46
7.51
7.56
7.61
7.66
7.71
7.77
7.82
7.87
7.92
30.5
6.88
6.93
6.98
7.03
7.08
7.13
7.19
7.24
7.29
7.34
7.39
7.44
7.49
7.55
7.60
7.65
7.70
7.75
7.80
7.85
31.0
6.82
6.87
6.92
6.97
7.02
7.07
7.12
7.17
7.23
7.28
7.33
7.38
7.43
7.48
7.53
7.58
7.63
7.69
7.74
7.79
31.5
6.76
6.81
6.86
6.91
6.96
7.01
7.06
7.11
7.16
7.21
7.27
7.32
7.37
7.42
7.47
7.52
7.57
7.62
7.67
7.72
32.0
6.70
6.75
6.80
6.85
6.90
6.95
7.00
7.05
7.10
7.15
7.20
7.25
7.30
7.36
7.41
7.46
7.51
7.56
7.61
7.66
32.5
6.64
6.69
6.74
6.79
6.84
6.89
6.94
6.99
7.04
7.09
7.14
7.19
7.24
7.29
7.34
7.39
7.44
7.49
7.54
7.59
33.0
6.59
6.64
6.69
6.74
6.79
6.84
6.89
6.93
6.98
7.03
7.08
7.13
7.18
7.23
7.28
7.33
7.38
7.43
7.48
7.53
33.5
6.53
6.58
6.63
6.68
6.73
6.78
6.83
6.88
6.93
6.98
7.02
7.07
7.12
7.17
7.22
7.27
7.32
7.37
7.42
7.47
34.0
6.48
6.53
6.57
6.62
6.67
6.72
6.77
6.82
6.87
6.92
6.97
7.02
7.06
7.11
7.16
7.21
7.26
7.31
7.36
7.41
34.5
6.42
6.47
6.52
6.57
6.62
6.67
6.71
6.76
6.81
6.86
6.91
6.96
7.01
7.06
7.10
7.15
7.20
7.25
7.30
7.35
35.0
6.37
6.42
6.47
6.51
6.56
6.61
6.66
6.71
6.76
6.80
6.85
6.90
6.95
7.00
7.05
7.09
7.14
7.19
7.24
7.29
35.5
6.32
6.36
6.41
6.46
6.51
6.56
6.60
6.65
6.70
6.75
6.80
6.84
6.89
6.94
6.99
7.04
7.08
7.13
7.18
7.23
36.0
6.26
6.31
6.36
6.41
6.45
6.50
6.55
6.60
6.65
6.69
6.74
6.79
6.84
6.88
6.93
6.98
7.03
7.08
7.12
7.17
36.5
6.21
6.26
6.31
6.35
6.40
6.45
6.50
6.54
6.59
6.64
6.69
6.73
6.78
6.83
6.88
6.92
6.97
7.02
7.07
7.11
37.0
6.16
6.21
6.26
6.30
6.35
6.40
6.44
6.49
6.54
6.59
6.63
6.68
6.73
6.77
6.82
6.87
6.92
6.96
7.01
7.06
37.5
6.11
6.16
6.20
6.25
6.30
6.35
6.39
6.44
6.49
6.53
6.58
6.63
6.67
6.72
6.77
6.81
6.86
6.91
6.95
7.00
38.0
6.06
6.11
6.15
6.20
6.25
6.29
6.34
6.39
6.43
6.48
6.53
6.57
6.62
6.67
6.71
6.76
6.81
6.85
6.90
6.95
38.5
6.01
6.06
6.10
6.15
6.20
6.24
6.29
6.34
6.38
6.43
6.47
6.52
6.57
6.61
6.66
6.71
6.75
6.80
6.84
6.89
39.0
5.96
6.01
6.05
6.10
6.15
6.19
6.24
6.29
6.33
6.38
6.42
6.47
6.52
6.56
6.61
6.65
6.70
6.75
6.79
6.84
39.5
5.91
5.96
6.01
6.05
6.10
6.14
6.19
6.23
6.28
6.33
6.37
6.42
6.46
6.51
6.56
6.60
6.65
6.69
6.74
6.78
40.0
5.87
5.91
5.96
6.00
6.05
6.09
6.14
6.19
6.23
6.28
6.32
6.37
6.41
6.46
6.50
6.55
6.59
6.64
6.69
6.73

References Cited 23
Tem
p.(d
eg C
)A
tmos
pher
ic p
ress
ure,
in m
illim
eter
s of
mer
cury
600
605
610
615
620
625
630
635
640
645
650
655
660
665
670
675
680
685
690
695
0.0
11.5
311
.62
11.7
211
.82
11.9
112
.01
12.1
112
.20
12.3
012
.40
12.4
912
.59
12.6
912
.78
12.8
812
.98
13.0
713
.17
13.2
713
.36
0.5
11.3
611
.46
11.5
611
.65
11.7
511
.84
11.9
412
.03
12.1
312
.22
12.3
212
.41
12.5
112
.60
12.7
012
.80
12.8
912
.99
13.0
813
.18
1.0
11.2
111
.30
11.3
911
.49
11.5
811
.68
11.7
711
.86
11.9
612
.05
12.1
512
.24
12.3
412
.43
12.5
212
.62
12.7
112
.81
12.9
012
.99
1.5
11.0
511
.14
11.2
411
.33
11.4
211
.52
11.6
111
.70
11.7
911
.89
11.9
812
.07
12.1
712
.26
12.3
512
.44
12.5
412
.63
12.7
212
.81
2.0
10.9
010
.99
11.0
811
.18
11.2
711
.36
11.4
511
.54
11.6
311
.72
11.8
211
.91
12.0
012
.09
12.1
812
.27
12.3
712
.46
12.5
512
.64
2.5
10.7
510
.84
10.9
311
.02
11.1
111
.20
11.2
911
.39
11.4
811
.57
11.6
611
.75
11.8
411
.93
12.0
212
.11
12.2
012
.29
12.3
812
.47
3.0
10.6
110
.70
10.7
910
.88
10.9
611
.05
11.1
411
.23
11.3
211
.41
11.5
011
.59
11.6
811
.77
11.8
611
.95
12.0
312
.12
12.2
112
.30
3.5
10.4
710
.55
10.6
410
.73
10.8
210
.91
10.9
911
.08
11.1
711
.26
11.3
511
.43
11.5
211
.61
11.7
011
.79
11.8
711
.96
12.0
512
.14
4.0
10.3
310
.42
10.5
010
.59
10.6
810
.76
10.8
510
.94
11.0
211
.11
11.2
011
.28
11.3
711
.46
11.5
411
.63
11.7
211
.81
11.8
911
.98
4.5
10.1
910
.28
10.3
610
.45
10.5
410
.62
10.7
110
.79
10.8
810
.97
11.0
511
.14
11.2
211
.31
11.3
911
.48
11.5
711
.65
11.7
411
.82
5.0
10.0
610
.15
10.2
310
.32
10.4
010
.48
10.5
710
.65
10.7
410
.82
10.9
110
.99
11.0
811
.16
11.2
511
.33
11.4
211
.50
11.5
911
.67
5.5
9.93
10.0
210
.10
10.1
810
.27
10.3
510
.43
10.5
210
.60
10.6
810
.77
10.8
510
.94
11.0
211
.10
11.1
911
.27
11.3
511
.44
11.5
26.
09.
809.
899.
9710
.05
10.1
410
.22
10.3
010
.38
10.4
710
.55
10.6
310
.71
10.8
010
.88
10.9
611
.04
11.1
311
.21
11.2
911
.37
6.5
9.68
9.76
9.84
9.93
10.0
110
.09
10.1
710
.25
10.3
310
.42
10.5
010
.58
10.6
610
.74
10.8
210
.91
10.9
911
.07
11.1
511
.23
7.0
9.56
9.64
9.72
9.80
9.88
9.96
10.0
410
.12
10.2
010
.29
10.3
710
.45
10.5
310
.61
10.6
910
.77
10.8
510
.93
11.0
111
.09
7.5
9.44
9.52
9.60
9.68
9.76
9.84
9.92
10.0
010
.08
10.1
610
.24
10.3
210
.40
10.4
810
.56
10.6
410
.72
10.8
010
.87
10.9
58.
09.
339.
409.
489.
569.
649.
729.
809.
889.
9510
.03
10.1
110
.19
10.2
710
.35
10.4
310
.51
10.5
810
.66
10.7
410
.82
8.5
9.21
9.29
9.37
9.44
9.52
9.60
9.68
9.76
9.83
9.91
9.99
10.0
710
.14
10.2
210
.30
10.3
810
.46
10.5
310
.61
10.6
99.
09.
109.
189.
259.
339.
419.
489.
569.
649.
719.
799.
879.
9510
.02
10.1
010
.18
10.2
510
.33
10.4
110
.48
10.5
69.
58.
999.
079.
149.
229.
299.
379.
459.
529.
609.
679.
759.
839.
909.
9810
.05
10.1
310
.21
10.2
810
.36
10.4
310
.08.
888.
969.
039.
119.
189.
269.
339.
419.
499.
569.
649.
719.
799.
869.
9410
.01
10.0
910
.16
10.2
410
.31
10.5
8.78
8.85
8.93
9.00
9.08
9.15
9.23
9.30
9.37
9.45
9.52
9.60
9.67
9.75
9.82
9.89
9.97
10.0
410
.12
10.1
911
.08.
688.
758.
828.
908.
979.
049.
129.
199.
269.
349.
419.
489.
569.
639.
719.
789.
859.
9310
.00
10.0
711
.58.
588.
658.
728.
798.
878.
949.
019.
089.
169.
239.
309.
389.
459.
529.
599.
679.
749.
819.
889.
9612
.08.
488.
558.
628.
698.
778.
848.
918.
989.
059.
129.
209.
279.
349.
419.
489.
569.
639.
709.
779.
8412
.58.
388.
458.
528.
598.
678.
748.
818.
888.
959.
029.
099.
169.
239.
319.
389.
459.
529.
599.
669.
7313
.08.
298.
368.
438.
508.
578.
648.
718.
788.
858.
928.
999.
069.
139.
209.
279.
349.
419.
489.
559.
6213
.58.
198.
268.
338.
408.
478.
548.
618.
688.
758.
828.
898.
969.
039.
109.
179.
249.
319.
389.
459.
5214
.08.
108.
178.
248.
318.
388.
458.
528.
588.
658.
728.
798.
868.
939.
009.
079.
149.
209.
279.
349.
4114
.58.
018.
088.
158.
228.
298.
358.
428.
498.
568.
638.
698.
768.
838.
908.
979.
049.
109.
179.
249.
3115
.07.
937.
998.
068.
138.
208.
268.
338.
408.
478.
538.
608.
678.
748.
808.
878.
949.
009.
079.
149.
21
Tabl
e 6.
2–2.
So
lubi
lity
of o
xyge
n in
fres
hwat
er a
t var
ious
tem
pera
ture
s an
d pr
essu
res.
—Co
ntin
ued
[Sol
ubili
ty sh
own
in m
illig
ram
s per
lite
r; va
lues
are
bas
ed o
n eq
uatio
ns p
ublis
hed
by B
enso
n an
d K
raus
e (1
980,
198
4); T
emp.
(°C
), te
mpe
ratu
re in
deg
rees
Cel
sius
]

24 Chapter A6.2. Dissolved Oxygen
Tem
p.(d
eg C
)A
tmos
pher
ic p
ress
ure,
in m
illim
eter
s of
mer
cury
600
605
610
615
620
625
630
635
640
645
650
655
660
665
670
675
680
685
690
695
15.5
7.84
7.91
7.97
8.04
8.11
8.17
8.24
8.31
8.37
8.44
8.51
8.57
8.64
8.71
8.77
8.84
8.91
8.97
9.04
9.11
16.0
7.76
7.82
7.89
7.95
8.02
8.09
8.15
8.22
8.28
8.35
8.42
8.48
8.55
8.61
8.68
8.75
8.81
8.88
8.95
9.01
16.5
7.67
7.74
7.80
7.87
7.93
8.00
8.07
8.13
8.20
8.26
8.33
8.39
8.46
8.52
8.59
8.65
8.72
8.79
8.85
8.92
17.0
7.59
7.66
7.72
7.79
7.85
7.92
7.98
8.05
8.11
8.17
8.24
8.30
8.37
8.43
8.50
8.56
8.63
8.69
8.76
8.82
17.5
7.51
7.58
7.64
7.70
7.77
7.83
7.90
7.96
8.03
8.09
8.15
8.22
8.28
8.35
8.41
8.47
8.54
8.60
8.67
8.73
18.0
7.43
7.50
7.56
7.62
7.69
7.75
7.81
7.88
7.94
8.01
8.07
8.13
8.20
8.26
8.32
8.39
8.45
8.51
8.58
8.64
18.5
7.36
7.42
7.48
7.55
7.61
7.67
7.73
7.80
7.86
7.92
7.99
8.05
8.11
8.18
8.24
8.30
8.36
8.43
8.49
8.55
19.0
7.28
7.34
7.41
7.47
7.53
7.59
7.66
7.72
7.78
7.84
7.90
7.97
8.03
8.09
8.15
8.22
8.28
8.34
8.40
8.47
19.5
7.21
7.27
7.33
7.39
7.45
7.52
7.58
7.64
7.70
7.76
7.82
7.89
7.95
8.01
8.07
8.13
8.20
8.26
8.32
8.38
20.0
7.13
7.20
7.26
7.32
7.38
7.44
7.50
7.56
7.62
7.68
7.75
7.81
7.87
7.93
7.99
8.05
8.11
8.17
8.24
8.30
20.5
7.06
7.12
7.18
7.24
7.31
7.37
7.43
7.49
7.55
7.61
7.67
7.73
7.79
7.85
7.91
7.97
8.03
8.09
8.15
8.21
21.0
6.99
7.05
7.11
7.17
7.23
7.29
7.35
7.41
7.47
7.53
7.59
7.65
7.71
7.77
7.83
7.89
7.95
8.01
8.07
8.13
21.5
6.92
6.98
7.04
7.10
7.16
7.22
7.28
7.34
7.40
7.46
7.52
7.58
7.64
7.70
7.76
7.82
7.88
7.94
7.99
8.05
22.0
6.85
6.91
6.97
7.03
7.09
7.15
7.21
7.27
7.33
7.39
7.45
7.50
7.56
7.62
7.68
7.74
7.80
7.86
7.92
7.98
22.5
6.79
6.85
6.90
6.96
7.02
7.08
7.14
7.20
7.26
7.31
7.37
7.43
7.49
7.55
7.61
7.67
7.72
7.78
7.84
7.90
23.0
6.72
6.78
6.84
6.90
6.95
7.01
7.07
7.13
7.19
7.24
7.30
7.36
7.42
7.48
7.53
7.59
7.65
7.71
7.77
7.82
23.5
6.66
6.71
6.77
6.83
6.89
6.94
7.00
7.06
7.12
7.17
7.23
7.29
7.35
7.40
7.46
7.52
7.58
7.63
7.69
7.75
24.0
6.59
6.65
6.71
6.76
6.82
6.88
6.94
6.99
7.05
7.11
7.16
7.22
7.28
7.33
7.39
7.45
7.51
7.56
7.62
7.68
24.5
6.53
6.59
6.64
6.70
6.76
6.81
6.87
6.93
6.98
7.04
7.10
7.15
7.21
7.27
7.32
7.38
7.44
7.49
7.55
7.61
25.0
6.47
6.52
6.58
6.64
6.69
6.75
6.81
6.86
6.92
6.97
7.03
7.09
7.14
7.20
7.25
7.31
7.37
7.42
7.48
7.53
25.5
6.41
6.46
6.52
6.57
6.63
6.69
6.74
6.80
6.85
6.91
6.96
7.02
7.08
7.13
7.19
7.24
7.30
7.35
7.41
7.46
26.0
6.35
6.40
6.46
6.51
6.57
6.62
6.68
6.73
6.79
6.84
6.90
6.95
7.01
7.07
7.12
7.18
7.23
7.29
7.34
7.40
26.5
6.29
6.34
6.40
6.45
6.51
6.56
6.62
6.67
6.73
6.78
6.84
6.89
6.95
7.00
7.06
7.11
7.16
7.22
7.27
7.33
27.0
6.23
6.28
6.34
6.39
6.45
6.50
6.56
6.61
6.67
6.72
6.77
6.83
6.88
6.94
6.99
7.05
7.10
7.15
7.21
7.26
27.5
6.17
6.23
6.28
6.33
6.39
6.44
6.50
6.55
6.60
6.66
6.71
6.77
6.82
6.87
6.93
6.98
7.04
7.09
7.14
7.20
28.0
6.12
6.17
6.22
6.28
6.33
6.38
6.44
6.49
6.54
6.60
6.65
6.70
6.76
6.81
6.87
6.92
6.97
7.03
7.08
7.13
28.5
6.06
6.11
6.17
6.22
6.27
6.33
6.38
6.43
6.49
6.54
6.59
6.64
6.70
6.75
6.80
6.86
6.91
6.96
7.02
7.07
29.0
6.01
6.06
6.11
6.16
6.22
6.27
6.32
6.37
6.43
6.48
6.53
6.59
6.64
6.69
6.74
6.80
6.85
6.90
6.95
7.01
29.5
5.95
6.00
6.06
6.11
6.16
6.21
6.27
6.32
6.37
6.42
6.47
6.53
6.58
6.63
6.68
6.74
6.79
6.84
6.89
6.95
30.0
5.90
5.95
6.00
6.05
6.11
6.16
6.21
6.26
6.31
6.37
6.42
6.47
6.52
6.57
6.63
6.68
6.73
6.78
6.83
6.88
30.5
5.85
5.90
5.95
6.00
6.05
6.10
6.16
6.21
6.26
6.31
6.36
6.41
6.46
6.52
6.57
6.62
6.67
6.72
6.77
6.82
Tabl
e 6.
2–2.
So
lubi
lity
of o
xyge
n in
fres
hwat
er a
t var
ious
tem
pera
ture
s an
d pr
essu
res.
—Co
ntin
ued
[Sol
ubili
ty sh
own
in m
illig
ram
s per
lite
r; va
lues
are
bas
ed o
n eq
uatio
ns p
ublis
hed
by B
enso
n an
d K
raus
e (1
980,
198
4); T
emp.
(°C
), te
mpe
ratu
re in
deg
rees
Cel
sius
]

References Cited 25
Tem
p.(d
eg C
)A
tmos
pher
ic p
ress
ure,
in m
illim
eter
s of
mer
cury
600
605
610
615
620
625
630
635
640
645
650
655
660
665
670
675
680
685
690
695
31.0
5.79
5.85
5.90
5.95
6.00
6.05
6.10
6.15
6.20
6.25
6.31
6.36
6.41
6.46
6.51
6.56
6.61
6.66
6.71
6.77
31.5
5.74
5.79
5.84
5.90
5.95
6.00
6.05
6.10
6.15
6.20
6.25
6.30
6.35
6.40
6.45
6.50
6.55
6.61
6.66
6.71
32.0
5.69
5.74
5.79
5.84
5.89
5.94
5.99
6.04
6.10
6.15
6.20
6.25
6.30
6.35
6.40
6.45
6.50
6.55
6.60
6.65
32.5
5.64
5.69
5.74
5.79
5.84
5.89
5.94
5.99
6.04
6.09
6.14
6.19
6.24
6.29
6.34
6.39
6.44
6.49
6.54
6.59
33.0
5.59
5.64
5.69
5.74
5.79
5.84
5.89
5.94
5.99
6.04
6.09
6.14
6.19
6.24
6.29
6.34
6.39
6.44
6.49
6.54
33.5
5.54
5.59
5.64
5.69
5.74
5.79
5.84
5.89
5.94
5.99
6.04
6.09
6.14
6.19
6.24
6.28
6.33
6.38
6.43
6.48
34.0
5.50
5.54
5.59
5.64
5.69
5.74
5.79
5.84
5.89
5.94
5.99
6.04
6.08
6.13
6.18
6.23
6.28
6.33
6.38
6.43
34.5
5.45
5.50
5.55
5.59
5.64
5.69
5.74
5.79
5.84
5.89
5.94
5.98
6.03
6.08
6.13
6.18
6.23
6.28
6.32
6.37
35.0
5.40
5.45
5.50
5.55
5.59
5.64
5.69
5.74
5.79
5.84
5.88
5.93
5.98
6.03
6.08
6.13
6.18
6.22
6.27
6.32
35.5
5.35
5.40
5.45
5.50
5.55
5.59
5.64
5.69
5.74
5.79
5.84
5.88
5.93
5.98
6.03
6.08
6.12
6.17
6.22
6.27
36.0
5.31
5.36
5.40
5.45
5.50
5.55
5.60
5.64
5.69
5.74
5.79
5.83
5.88
5.93
5.98
6.02
6.07
6.12
6.17
6.22
36.5
5.26
5.31
5.36
5.41
5.45
5.50
5.55
5.60
5.64
5.69
5.74
5.78
5.83
5.88
5.93
5.97
6.02
6.07
6.12
6.16
37.0
5.22
5.27
5.31
5.36
5.41
5.45
5.50
5.55
5.60
5.64
5.69
5.74
5.78
5.83
5.88
5.93
5.97
6.02
6.07
6.11
37.5
5.17
5.22
5.27
5.31
5.36
5.41
5.45
5.50
5.55
5.60
5.64
5.69
5.74
5.78
5.83
5.88
5.92
5.97
6.02
6.06
38.0
5.13
5.18
5.22
5.27
5.32
5.36
5.41
5.46
5.50
5.55
5.60
5.64
5.69
5.73
5.78
5.83
5.87
5.92
5.97
6.01
38.5
5.09
5.13
5.18
5.22
5.27
5.32
5.36
5.41
5.46
5.50
5.55
5.59
5.64
5.69
5.73
5.78
5.83
5.87
5.92
5.97
39.0
5.04
5.09
5.13
5.18
5.23
5.27
5.32
5.36
5.41
5.46
5.50
5.55
5.59
5.64
5.69
5.73
5.78
5.82
5.87
5.92
39.5
5.00
5.05
5.09
5.14
5.18
5.23
5.27
5.32
5.37
5.41
5.46
5.50
5.55
5.59
5.64
5.69
5.73
5.78
5.82
5.87
40.0
4.96
5.00
5.05
5.09
5.14
5.18
5.23
5.28
5.32
5.37
5.41
5.46
5.50
5.55
5.59
5.64
5.69
5.73
5.78
5.82
Tabl
e 6.
2–2.
So
lubi
lity
of o
xyge
n in
fres
hwat
er a
t var
ious
tem
pera
ture
s an
d pr
essu
res.
—Co
ntin
ued
[Sol
ubili
ty sh
own
in m
illig
ram
s per
lite
r; va
lues
are
bas
ed o
n eq
uatio
ns p
ublis
hed
by B
enso
n an
d K
raus
e (1
980,
198
4); T
emp.
(°C
), te
mpe
ratu
re in
deg
rees
Cel
sius
]

26 Chapter A6.2. Dissolved OxygenTa
ble
6.2–
4.
Salin
ity c
orre
ctio
n fa
ctor
s fo
r dis
solv
ed o
xyge
n in
wat
er (b
ased
on
spec
ific
cond
ucta
nce)
.
[Fac
tors
are
dim
ensi
onle
ss; v
alue
s are
bas
ed o
n eq
uatio
ns p
ublis
hed
by B
enso
n an
d K
raus
e (1
984)
; Tem
p. (°
C),
tem
pera
ture
in d
egre
es C
elsi
us]
Tem
p.
(deg
C)
Spec
ific
cond
ucta
nce,
in m
icro
siem
ens
per c
entim
eter
at 2
5 de
gree
s Ce
lsiu
s
01,
000
2,00
03,
000
4,00
05,
000
6,00
07,
000
8,00
09,
000
10,0
0011
,000
12,0
0013
,000
14,0
00
0.0
1.00
000.
9961
0.99
220.
9882
0.98
430.
9804
0.97
640.
9724
0.96
840.
9644
0.96
040.
9564
0.95
240.
9483
0.94
431.
01.
0000
0.99
610.
9923
0.98
840.
9845
0.98
050.
9766
0.97
270.
9687
0.96
480.
9608
0.95
680.
9528
0.94
880.
9448
2.0
1.00
000.
9962
0.99
230.
9885
0.98
460.
9807
0.97
680.
9729
0.96
900.
9651
0.96
110.
9572
0.95
320.
9493
0.94
533.
01.
0000
0.99
620.
9924
0.98
860.
9847
0.98
090.
9770
0.97
320.
9693
0.96
540.
9615
0.95
760.
9536
0.94
970.
9458
4.0
1.00
000.
9962
0.99
250.
9887
0.98
490.
9811
0.97
720.
9734
0.96
960.
9657
0.96
180.
9579
0.95
410.
9502
0.94
625.
01.
0000
0.99
630.
9925
0.98
880.
9850
0.98
120.
9774
0.97
360.
9698
0.96
600.
9622
0.95
830.
9545
0.95
060.
9467
6.0
1.00
000.
9963
0.99
260.
9889
0.98
510.
9814
0.97
760.
9739
0.97
010.
9663
0.96
250.
9587
0.95
490.
9510
0.94
727.
01.
0000
0.99
630.
9927
0.98
900.
9853
0.98
160.
9778
0.97
410.
9703
0.96
660.
9628
0.95
900.
9552
0.95
140.
9476
8.0
1.00
000.
9964
0.99
270.
9891
0.98
540.
9817
0.97
800.
9743
0.97
060.
9669
0.96
310.
9594
0.95
560.
9519
0.94
819.
01.
0000
0.99
640.
9928
0.98
920.
9855
0.98
190.
9782
0.97
450.
9708
0.96
720.
9634
0.95
970.
9560
0.95
230.
9485
10.0
1.00
000.
9964
0.99
280.
9893
0.98
560.
9820
0.97
840.
9747
0.97
110.
9674
0.96
370.
9601
0.95
640.
9527
0.94
8911
.01.
0000
0.99
650.
9929
0.98
930.
9858
0.98
220.
9786
0.97
500.
9713
0.96
770.
9640
0.96
040.
9567
0.95
300.
9494
12.0
1.00
000.
9965
0.99
300.
9894
0.98
590.
9823
0.97
870.
9752
0.97
160.
9680
0.96
430.
9607
0.95
710.
9534
0.94
9813
.01.
0000
0.99
650.
9930
0.98
950.
9860
0.98
250.
9789
0.97
540.
9718
0.96
820.
9646
0.96
100.
9574
0.95
380.
9502
14.0
1.00
000.
9965
0.99
310.
9896
0.98
610.
9826
0.97
910.
9756
0.97
200.
9685
0.96
490.
9613
0.95
780.
9542
0.95
0615
.01.
0000
0.99
660.
9931
0.98
970.
9862
0.98
270.
9793
0.97
580.
9723
0.96
870.
9652
0.96
170.
9581
0.95
450.
9510
16.0
1.00
000.
9966
0.99
320.
9898
0.98
630.
9829
0.97
940.
9760
0.97
250.
9690
0.96
550.
9620
0.95
840.
9549
0.95
1317
.01.
0000
0.99
660.
9932
0.98
980.
9864
0.98
300.
9796
0.97
610.
9727
0.96
920.
9657
0.96
220.
9587
0.95
520.
9517
18.0
1.00
000.
9967
0.99
330.
9899
0.98
650.
9831
0.97
970.
9763
0.97
290.
9695
0.96
600.
9625
0.95
910.
9556
0.95
2119
.01.
0000
0.99
670.
9933
0.99
000.
9866
0.98
330.
9799
0.97
650.
9731
0.96
970.
9663
0.96
280.
9594
0.95
590.
9524
20.0
1.00
000.
9967
0.99
340.
9901
0.98
670.
9834
0.98
000.
9767
0.97
330.
9699
0.96
650.
9631
0.95
970.
9562
0.95
2821
.01.
0000
0.99
670.
9934
0.99
020.
9868
0.98
350.
9802
0.97
690.
9735
0.97
010.
9668
0.96
340.
9600
0.95
660.
9531
22.0
1.00
000.
9968
0.99
350.
9902
0.98
690.
9836
0.98
030.
9770
0.97
370.
9704
0.96
700.
9636
0.96
030.
9569
0.95
3523
.01.
0000
0.99
680.
9935
0.99
030.
9870
0.98
380.
9805
0.97
720.
9739
0.97
060.
9672
0.96
390.
9605
0.95
720.
9538
24.0
1.00
000.
9968
0.99
360.
9904
0.98
710.
9839
0.98
060.
9774
0.97
410.
9708
0.96
750.
9642
0.96
080.
9575
0.95
4125
.01.
0000
0.99
680.
9936
0.99
040.
9872
0.98
400.
9808
0.97
750.
9743
0.97
100.
9677
0.96
440.
9611
0.95
780.
9545
26.0
1.00
000.
9968
0.99
370.
9905
0.98
730.
9841
0.98
090.
9777
0.97
440.
9712
0.96
790.
9647
0.96
140.
9581
0.95
4827
.01.
0000
0.99
690.
9937
0.99
060.
9874
0.98
420.
9810
0.97
780.
9746
0.97
140.
9681
0.96
490.
9616
0.95
840.
9551
28.0
1.00
000.
9969
0.99
380.
9906
0.98
750.
9843
0.98
120.
9780
0.97
480.
9716
0.96
840.
9651
0.96
190.
9586
0.95
5429
.01.
0000
0.99
690.
9938
0.99
070.
9876
0.98
440.
9813
0.97
810.
9750
0.97
180.
9686
0.96
540.
9621
0.95
890.
9557

References Cited 27Ta
ble
6.2–
4.
Salin
ity c
orre
ctio
n fa
ctor
s fo
r dis
solv
ed o
xyge
n in
wat
er (b
ased
on
spec
ific
cond
ucta
nce)
.—Co
ntin
ued
[Fac
tors
are
dim
ensi
onle
ss; v
alue
s are
bas
ed o
n eq
uatio
ns p
ublis
hed
by B
enso
n an
d K
raus
e (1
984)
; Tem
p. (°
C),
tem
pera
ture
in d
egre
es C
elsi
us]
Tem
p.
(deg
C)
Spec
ific
cond
ucta
nce,
in m
icro
siem
ens
per c
entim
eter
at 2
5 de
gree
s Ce
lsiu
s
15,0
0016
,000
17,0
0018
,000
19,0
0020
,000
21,0
0022
,000
23,0
0024
,000
25,0
0026
,000
27,0
0028
,000
29,0
00
0.0
0.94
020.
9361
0.93
210.
9280
0.92
390.
9198
0.91
570.
9116
0.90
740.
9033
0.89
920.
8950
0.89
090.
8867
0.88
261.
00.
9408
0.93
670.
9327
0.92
860.
9246
0.92
050.
9164
0.91
240.
9083
0.90
420.
9001
0.89
600.
8918
0.88
770.
8836
2.0
0.94
130.
9373
0.93
330.
9293
0.92
520.
9212
0.91
720.
9131
0.90
910.
9050
0.90
090.
8969
0.89
280.
8887
0.88
463.
00.
9418
0.93
780.
9339
0.92
990.
9259
0.92
190.
9179
0.91
390.
9099
0.90
580.
9018
0.89
780.
8937
0.88
970.
8856
4.0
0.94
230.
9384
0.93
450.
9305
0.92
660.
9226
0.91
860.
9146
0.91
070.
9067
0.90
270.
8986
0.89
460.
8906
0.88
665.
00.
9428
0.93
890.
9350
0.93
110.
9272
0.92
330.
9193
0.91
540.
9114
0.90
750.
9035
0.89
950.
8955
0.89
150.
8875
6.0
0.94
330.
9395
0.93
560.
9317
0.92
780.
9239
0.92
000.
9161
0.91
220.
9082
0.90
430.
9004
0.89
640.
8924
0.88
857.
00.
9438
0.94
000.
9361
0.93
230.
9284
0.92
460.
9207
0.91
680.
9129
0.90
900.
9051
0.90
120.
8973
0.89
330.
8894
8.0
0.94
430.
9405
0.93
670.
9329
0.92
900.
9252
0.92
130.
9175
0.91
360.
9098
0.90
590.
9020
0.89
810.
8942
0.89
039.
00.
9447
0.94
100.
9372
0.93
340.
9296
0.92
580.
9220
0.91
820.
9143
0.91
050.
9067
0.90
280.
8989
0.89
510.
8912
10.0
0.94
520.
9415
0.93
770.
9340
0.93
020.
9264
0.92
260.
9188
0.91
500.
9112
0.90
740.
9036
0.89
980.
8959
0.89
2111
.00.
9457
0.94
190.
9382
0.93
450.
9308
0.92
700.
9233
0.91
950.
9157
0.91
190.
9082
0.90
440.
9006
0.89
680.
8929
12.0
0.94
610.
9424
0.93
870.
9350
0.93
130.
9276
0.92
390.
9201
0.91
640.
9126
0.90
890.
9051
0.90
140.
8976
0.89
3813
.00.
9465
0.94
290.
9392
0.93
550.
9319
0.92
820.
9245
0.92
080.
9171
0.91
330.
9096
0.90
590.
9021
0.89
840.
8946
14.0
0.94
700.
9433
0.93
970.
9361
0.93
240.
9287
0.92
510.
9214
0.91
770.
9140
0.91
030.
9066
0.90
290.
8992
0.89
5415
.00.
9474
0.94
380.
9402
0.93
660.
9329
0.92
930.
9257
0.92
200.
9183
0.91
470.
9110
0.90
730.
9036
0.89
990.
8962
16.0
0.94
780.
9442
0.94
060.
9370
0.93
340.
9298
0.92
620.
9226
0.91
900.
9153
0.91
170.
9080
0.90
440.
9007
0.89
7017
.00.
9482
0.94
460.
9411
0.93
750.
9340
0.93
040.
9268
0.92
320.
9196
0.91
600.
9123
0.90
870.
9051
0.90
140.
8978
18.0
0.94
860.
9451
0.94
150.
9380
0.93
450.
9309
0.92
730.
9238
0.92
020.
9166
0.91
300.
9094
0.90
580.
9022
0.89
8519
.00.
9490
0.94
550.
9420
0.93
850.
9349
0.93
140.
9279
0.92
430.
9208
0.91
720.
9136
0.91
010.
9065
0.90
290.
8993
20.0
0.94
930.
9459
0.94
240.
9389
0.93
540.
9319
0.92
840.
9249
0.92
140.
9178
0.91
430.
9107
0.90
710.
9036
0.90
0021
.00.
9497
0.94
630.
9428
0.93
940.
9359
0.93
240.
9289
0.92
540.
9219
0.91
840.
9149
0.91
140.
9078
0.90
430.
9007
22.0
0.95
010.
9467
0.94
320.
9398
0.93
630.
9329
0.92
940.
9260
0.92
250.
9190
0.91
550.
9120
0.90
850.
9049
0.90
1423
.00.
9504
0.94
700.
9436
0.94
020.
9368
0.93
340.
9299
0.92
650.
9230
0.91
960.
9161
0.91
260.
9091
0.90
560.
9021
24.0
0.95
080.
9474
0.94
400.
9406
0.93
720.
9338
0.93
040.
9270
0.92
360.
9201
0.91
670.
9132
0.90
970.
9063
0.90
2825
.00.
9511
0.94
780.
9444
0.94
110.
9377
0.93
430.
9309
0.92
750.
9241
0.92
070.
9172
0.91
380.
9104
0.90
690.
9034
26.0
0.95
150.
9481
0.94
480.
9415
0.93
810.
9347
0.93
140.
9280
0.92
460.
9212
0.91
780.
9144
0.91
100.
9075
0.90
4127
.00.
9518
0.94
850.
9452
0.94
190.
9385
0.93
520.
9318
0.92
850.
9251
0.92
170.
9183
0.91
490.
9115
0.90
810.
9047
28.0
0.95
210.
9488
0.94
550.
9422
0.93
890.
9356
0.93
230.
9289
0.92
560.
9222
0.91
890.
9155
0.91
210.
9087
0.90
5329
.00.
9524
0.94
920.
9459
0.94
260.
9393
0.93
600.
9327
0.92
940.
9261
0.92
280.
9194
0.91
610.
9127
0.90
930.
9060

28 Chapter A6.2. Dissolved Oxygen
Tem
p.
(deg
C)
Spec
ific
cond
ucta
nce,
in m
icro
siem
ens
per c
entim
eter
at 2
5 de
gree
s Ce
lsiu
s
30,0
0031
,000
32,0
0033
,000
34,0
0035
,000
36,0
0037
,000
38,0
0039
,000
40,0
0041
,000
42,0
0043
,000
44,0
00
0.0
0.87
840.
8742
0.87
010.
8659
0.86
170.
8575
0.85
330.
8491
0.84
490.
8407
0.83
650.
8323
0.82
810.
8239
0.81
971.
00.
8795
0.87
530.
8712
0.86
700.
8629
0.85
870.
8546
0.85
040.
8462
0.84
210.
8379
0.83
370.
8296
0.82
540.
8212
2.0
0.88
050.
8764
0.87
230.
8682
0.86
410.
8599
0.85
580.
8517
0.84
760.
8434
0.83
930.
8351
0.83
100.
8268
0.82
273.
00.
8815
0.87
750.
8734
0.86
930.
8652
0.86
110.
8570
0.85
290.
8488
0.84
470.
8406
0.83
650.
8324
0.82
830.
8242
4.0
0.88
250.
8785
0.87
450.
8704
0.86
640.
8623
0.85
820.
8542
0.85
010.
8460
0.84
190.
8379
0.83
380.
8297
0.82
565.
00.
8835
0.87
950.
8755
0.87
150.
8675
0.86
350.
8594
0.85
540.
8513
0.84
730.
8433
0.83
920.
8351
0.83
110.
8270
6.0
0.88
450.
8805
0.87
660.
8726
0.86
860.
8646
0.86
060.
8566
0.85
260.
8485
0.84
450.
8405
0.83
650.
8325
0.82
847.
00.
8855
0.88
150.
8776
0.87
360.
8697
0.86
570.
8617
0.85
770.
8538
0.84
980.
8458
0.84
180.
8378
0.83
380.
8298
8.0
0.88
640.
8825
0.87
860.
8746
0.87
070.
8668
0.86
280.
8589
0.85
490.
8510
0.84
700.
8431
0.83
910.
8351
0.83
119.
00.
8873
0.88
340.
8796
0.87
570.
8718
0.86
780.
8639
0.86
000.
8561
0.85
220.
8482
0.84
430.
8404
0.83
640.
8325
10.0
0.88
820.
8844
0.88
050.
8766
0.87
280.
8689
0.86
500.
8611
0.85
720.
8533
0.84
940.
8455
0.84
160.
8377
0.83
3811
.00.
8891
0.88
530.
8815
0.87
760.
8738
0.86
990.
8661
0.86
220.
8583
0.85
450.
8506
0.84
670.
8428
0.83
890.
8351
12.0
0.89
000.
8862
0.88
240.
8786
0.87
480.
8709
0.86
710.
8633
0.85
940.
8556
0.85
170.
8479
0.84
400.
8402
0.83
6313
.00.
8908
0.88
710.
8833
0.87
950.
8757
0.87
190.
8681
0.86
430.
8605
0.85
670.
8529
0.84
900.
8452
0.84
140.
8375
14.0
0.89
170.
8879
0.88
420.
8804
0.87
670.
8729
0.86
910.
8654
0.86
160.
8578
0.85
400.
8502
0.84
640.
8426
0.83
8815
.00.
8925
0.88
880.
8851
0.88
130.
8776
0.87
390.
8701
0.86
640.
8626
0.85
880.
8551
0.85
130.
8475
0.84
370.
8400
16.0
0.89
330.
8896
0.88
590.
8822
0.87
850.
8748
0.87
110.
8674
0.86
360.
8599
0.85
610.
8524
0.84
860.
8449
0.84
1117
.00.
8941
0.89
050.
8868
0.88
310.
8794
0.87
570.
8720
0.86
830.
8646
0.86
090.
8572
0.85
350.
8497
0.84
600.
8423
18.0
0.89
490.
8913
0.88
760.
8840
0.88
030.
8766
0.87
300.
8693
0.86
560.
8619
0.85
820.
8545
0.85
080.
8471
0.84
3419
.00.
8957
0.89
210.
8884
0.88
480.
8812
0.87
750.
8739
0.87
020.
8666
0.86
290.
8592
0.85
560.
8519
0.84
820.
8445
20.0
0.89
640.
8928
0.88
920.
8856
0.88
200.
8784
0.87
480.
8711
0.86
750.
8639
0.86
020.
8566
0.85
290.
8493
0.84
5621
.00.
8972
0.89
360.
8900
0.88
640.
8828
0.87
930.
8757
0.87
200.
8684
0.86
480.
8612
0.85
760.
8539
0.85
030.
8467
22.0
0.89
790.
8943
0.89
080.
8872
0.88
370.
8801
0.87
650.
8729
0.86
930.
8658
0.86
220.
8585
0.85
490.
8513
0.84
7723
.00.
8986
0.89
510.
8915
0.88
800.
8845
0.88
090.
8774
0.87
380.
8702
0.86
670.
8631
0.85
950.
8559
0.85
230.
8487
24.0
0.89
930.
8958
0.89
230.
8888
0.88
530.
8817
0.87
820.
8747
0.87
110.
8676
0.86
400.
8605
0.85
690.
8533
0.84
9725
.00.
9000
0.89
650.
8930
0.88
950.
8860
0.88
250.
8790
0.87
550.
8720
0.86
850.
8649
0.86
140.
8578
0.85
430.
8507
26.0
0.90
060.
8972
0.89
370.
8903
0.88
680.
8833
0.87
980.
8763
0.87
280.
8693
0.86
580.
8623
0.85
880.
8552
0.85
1727
.00.
9013
0.89
790.
8944
0.89
100.
8875
0.88
410.
8806
0.87
710.
8736
0.87
020.
8667
0.86
320.
8597
0.85
620.
8527
28.0
0.90
190.
8985
0.89
510.
8917
0.88
830.
8848
0.88
140.
8779
0.87
450.
8710
0.86
750.
8641
0.86
060.
8571
0.85
3629
.00.
9026
0.89
920.
8958
0.89
240.
8890
0.88
560.
8821
0.87
870.
8753
0.87
180.
8684
0.86
490.
8615
0.85
800.
8545
Tabl
e 6.
2–4.
Sa
linity
cor
rect
ion
fact
ors
for d
isso
lved
oxy
gen
in w
ater
(bas
ed o
n sp
ecifi
c co
nduc
tanc
e).—
Cont
inue
d
[Fac
tors
are
dim
ensi
onle
ss; v
alue
s are
bas
ed o
n eq
uatio
ns p
ublis
hed
by B
enso
n an
d K
raus
e (1
984)
; Tem
p. (°
C),
tem
pera
ture
in d
egre
es C
elsi
us]

References Cited 29
Tem
p.
(deg
C)
Spec
ific
cond
ucta
nce,
in m
icro
siem
ens
per c
entim
eter
at 2
5 de
gree
s Ce
lsiu
s
45,0
0046
,000
47,0
0048
,000
49,0
0050
,000
51,0
0052
,000
53,0
0054
,000
55,0
0056
,000
57,0
0058
,000
59,0
00
0.0
0.81
550.
8112
0.80
700.
8028
0.79
860.
7944
0.79
010.
7859
0.78
170.
7775
0.77
330.
7691
0.76
480.
7606
0.75
641.
00.
8170
0.81
280.
8086
0.80
450.
8003
0.79
610.
7919
0.78
770.
7835
0.77
930.
7751
0.77
090.
7668
0.76
260.
7584
2.0
0.81
850.
8144
0.81
020.
8061
0.80
190.
7978
0.79
360.
7894
0.78
530.
7811
0.77
700.
7728
0.76
860.
7645
0.76
033.
00.
8200
0.81
590.
8118
0.80
770.
8035
0.79
940.
7953
0.79
110.
7870
0.78
290.
7788
0.77
460.
7705
0.76
640.
7623
4.0
0.82
150.
8174
0.81
330.
8092
0.80
510.
8010
0.79
690.
7928
0.78
870.
7846
0.78
050.
7764
0.77
230.
7682
0.76
415.
00.
8230
0.81
890.
8148
0.81
080.
8067
0.80
260.
7986
0.79
450.
7904
0.78
630.
7823
0.77
820.
7741
0.77
000.
7660
6.0
0.82
440.
8204
0.81
630.
8123
0.80
820.
8042
0.80
020.
7961
0.79
210.
7880
0.78
400.
7799
0.77
590.
7718
0.76
787.
00.
8258
0.82
180.
8178
0.81
380.
8098
0.80
570.
8017
0.79
770.
7937
0.78
970.
7857
0.78
160.
7776
0.77
360.
7696
8.0
0.82
720.
8232
0.81
920.
8152
0.81
120.
8073
0.80
330.
7993
0.79
530.
7913
0.78
730.
7833
0.77
930.
7753
0.77
139.
00.
8285
0.82
460.
8206
0.81
670.
8127
0.80
880.
8048
0.80
080.
7969
0.79
290.
7889
0.78
500.
7810
0.77
700.
7731
10.0
0.82
990.
8259
0.82
200.
8181
0.81
410.
8102
0.80
630.
8023
0.79
840.
7945
0.79
050.
7866
0.78
260.
7787
0.77
4811
.00.
8312
0.82
730.
8234
0.81
950.
8156
0.81
170.
8077
0.80
380.
7999
0.79
600.
7921
0.78
820.
7843
0.78
040.
7764
12.0
0.83
240.
8286
0.82
470.
8208
0.81
700.
8131
0.80
920.
8053
0.80
140.
7975
0.79
360.
7898
0.78
590.
7820
0.77
8113
.00.
8337
0.82
990.
8260
0.82
220.
8183
0.81
450.
8106
0.80
670.
8029
0.79
900.
7952
0.79
130.
7874
0.78
360.
7797
14.0
0.83
490.
8311
0.82
730.
8235
0.81
970.
8158
0.81
200.
8082
0.80
430.
8005
0.79
660.
7928
0.78
900.
7851
0.78
1315
.00.
8362
0.83
240.
8286
0.82
480.
8210
0.81
720.
8134
0.80
950.
8057
0.80
190.
7981
0.79
430.
7905
0.78
670.
7828
16.0
0.83
740.
8336
0.82
980.
8260
0.82
230.
8185
0.81
470.
8109
0.80
710.
8033
0.79
950.
7958
0.79
200.
7882
0.78
4417
.00.
8385
0.83
480.
8310
0.82
730.
8235
0.81
980.
8160
0.81
230.
8085
0.80
470.
8010
0.79
720.
7934
0.78
960.
7859
18.0
0.83
970.
8360
0.83
220.
8285
0.82
480.
8210
0.81
730.
8136
0.80
980.
8061
0.80
230.
7986
0.79
480.
7911
0.78
7319
.00.
8408
0.83
710.
8334
0.82
970.
8260
0.82
230.
8186
0.81
490.
8112
0.80
740.
8037
0.80
000.
7963
0.79
250.
7888
20.0
0.84
190.
8383
0.83
460.
8309
0.82
720.
8235
0.81
980.
8161
0.81
240.
8087
0.80
500.
8013
0.79
760.
7939
0.79
0221
.00.
8430
0.83
940.
8357
0.83
210.
8284
0.82
470.
8211
0.81
740.
8137
0.81
000.
8064
0.80
270.
7990
0.79
530.
7916
22.0
0.84
410.
8405
0.83
680.
8332
0.82
960.
8259
0.82
230.
8186
0.81
500.
8113
0.80
760.
8040
0.80
030.
7967
0.79
3023
.00.
8451
0.84
150.
8379
0.83
430.
8307
0.82
710.
8234
0.81
980.
8162
0.81
260.
8089
0.80
530.
8016
0.79
800.
7943
24.0
0.84
620.
8426
0.83
900.
8354
0.83
180.
8282
0.82
460.
8210
0.81
740.
8138
0.81
020.
8065
0.80
290.
7993
0.79
5725
.00.
8472
0.84
360.
8400
0.83
650.
8329
0.82
930.
8257
0.82
220.
8186
0.81
500.
8114
0.80
780.
8042
0.80
060.
7970
26.0
0.84
820.
8446
0.84
110.
8375
0.83
400.
8304
0.82
690.
8233
0.81
970.
8162
0.81
260.
8090
0.80
540.
8018
0.79
8327
.00.
8491
0.84
560.
8421
0.83
860.
8350
0.83
150.
8280
0.82
440.
8209
0.81
730.
8138
0.81
020.
8066
0.80
310.
7995
28.0
0.85
010.
8466
0.84
310.
8396
0.83
610.
8326
0.82
900.
8255
0.82
200.
8184
0.81
490.
8114
0.80
780.
8043
0.80
0729
.00.
8510
0.84
760.
8441
0.84
060.
8371
0.83
360.
8301
0.82
660.
8231
0.81
960.
8160
0.81
250.
8090
0.80
550.
8019
Tabl
e 6.
2–4.
Sa
linity
cor
rect
ion
fact
ors
for d
isso
lved
oxy
gen
in w
ater
(bas
ed o
n sp
ecifi
c co
nduc
tanc
e).—
Cont
inue
d
[Fac
tors
are
dim
ensi
onle
ss; v
alue
s are
bas
ed o
n eq
uatio
ns p
ublis
hed
by B
enso
n an
d K
raus
e (1
984)
; Tem
p. (°
C),
tem
pera
ture
in d
egre
es C
elsi
us]
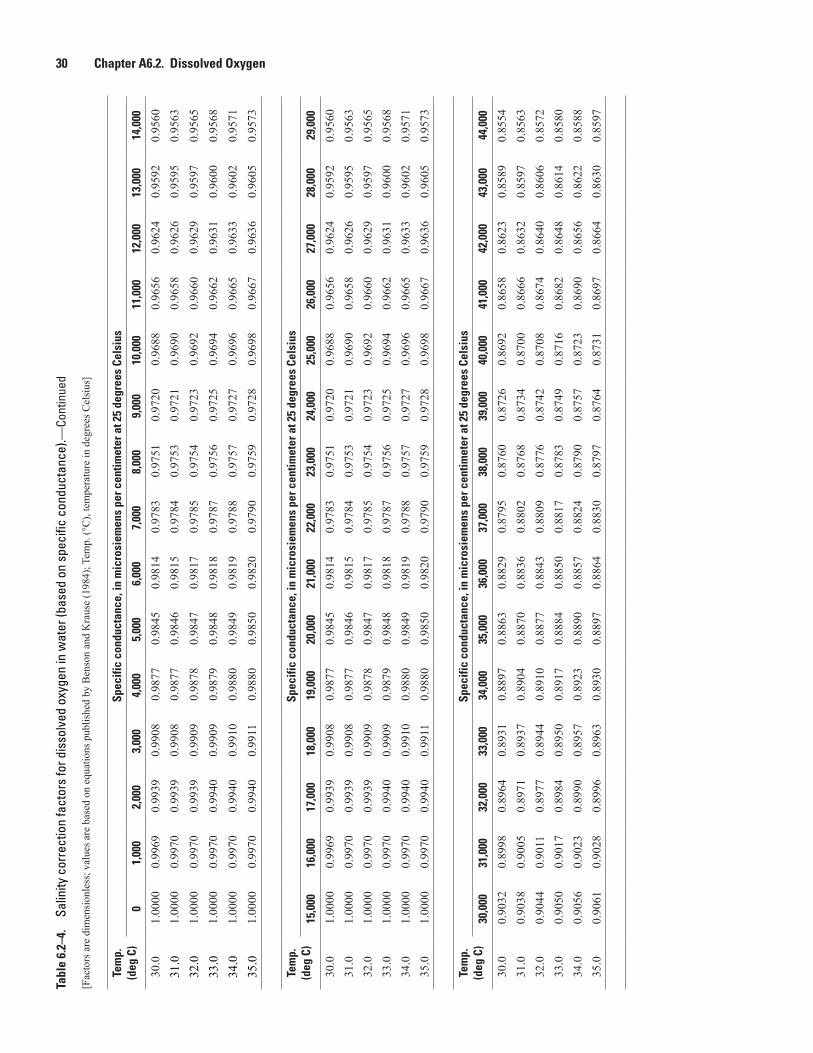
30 Chapter A6.2. Dissolved Oxygen
Tem
p.
(deg
C)
Spec
ific
cond
ucta
nce,
in m
icro
siem
ens
per c
entim
eter
at 2
5 de
gree
s Ce
lsiu
s
01,
000
2,00
03,
000
4,00
05,
000
6,00
07,
000
8,00
09,
000
10,0
0011
,000
12,0
0013
,000
14,0
00
30.0
1.00
000.
9969
0.99
390.
9908
0.98
770.
9845
0.98
140.
9783
0.97
510.
9720
0.96
880.
9656
0.96
240.
9592
0.95
6031
.01.
0000
0.99
700.
9939
0.99
080.
9877
0.98
460.
9815
0.97
840.
9753
0.97
210.
9690
0.96
580.
9626
0.95
950.
9563
32.0
1.00
000.
9970
0.99
390.
9909
0.98
780.
9847
0.98
170.
9785
0.97
540.
9723
0.96
920.
9660
0.96
290.
9597
0.95
65
33.0
1.00
000.
9970
0.99
400.
9909
0.98
790.
9848
0.98
180.
9787
0.97
560.
9725
0.96
940.
9662
0.96
310.
9600
0.95
68
34.0
1.00
000.
9970
0.99
400.
9910
0.98
800.
9849
0.98
190.
9788
0.97
570.
9727
0.96
960.
9665
0.96
330.
9602
0.95
71
35.0
1.00
000.
9970
0.99
400.
9911
0.98
800.
9850
0.98
200.
9790
0.97
590.
9728
0.96
980.
9667
0.96
360.
9605
0.95
73
Tem
p.
(deg
C)
Spec
ific
cond
ucta
nce,
in m
icro
siem
ens
per c
entim
eter
at 2
5 de
gree
s Ce
lsiu
s
15,0
0016
,000
17,0
0018
,000
19,0
0020
,000
21,0
0022
,000
23,0
0024
,000
25,0
0026
,000
27,0
0028
,000
29,0
00
30.0
1.00
000.
9969
0.99
390.
9908
0.98
770.
9845
0.98
140.
9783
0.97
510.
9720
0.96
880.
9656
0.96
240.
9592
0.95
6031
.01.
0000
0.99
700.
9939
0.99
080.
9877
0.98
460.
9815
0.97
840.
9753
0.97
210.
9690
0.96
580.
9626
0.95
950.
9563
32.0
1.00
000.
9970
0.99
390.
9909
0.98
780.
9847
0.98
170.
9785
0.97
540.
9723
0.96
920.
9660
0.96
290.
9597
0.95
6533
.01.
0000
0.99
700.
9940
0.99
090.
9879
0.98
480.
9818
0.97
870.
9756
0.97
250.
9694
0.96
620.
9631
0.96
000.
9568
34.0
1.00
000.
9970
0.99
400.
9910
0.98
800.
9849
0.98
190.
9788
0.97
570.
9727
0.96
960.
9665
0.96
330.
9602
0.95
7135
.01.
0000
0.99
700.
9940
0.99
110.
9880
0.98
500.
9820
0.97
900.
9759
0.97
280.
9698
0.96
670.
9636
0.96
050.
9573
Tem
p.(d
eg C
)Sp
ecifi
c co
nduc
tanc
e, in
mic
rosi
emen
s pe
r cen
timet
er a
t 25
degr
ees
Cels
ius
30,0
0031
,000
32,0
0033
,000
34,0
0035
,000
36,0
0037
,000
38,0
0039
,000
40,0
0041
,000
42,0
0043
,000
44,0
00
30.0
0.90
320.
8998
0.89
640.
8931
0.88
970.
8863
0.88
290.
8795
0.87
600.
8726
0.86
920.
8658
0.86
230.
8589
0.85
5431
.00.
9038
0.90
050.
8971
0.89
370.
8904
0.88
700.
8836
0.88
020.
8768
0.87
340.
8700
0.86
660.
8632
0.85
970.
8563
32.0
0.90
440.
9011
0.89
770.
8944
0.89
100.
8877
0.88
430.
8809
0.87
760.
8742
0.87
080.
8674
0.86
400.
8606
0.85
7233
.00.
9050
0.90
170.
8984
0.89
500.
8917
0.88
840.
8850
0.88
170.
8783
0.87
490.
8716
0.86
820.
8648
0.86
140.
8580
34.0
0.90
560.
9023
0.89
900.
8957
0.89
230.
8890
0.88
570.
8824
0.87
900.
8757
0.87
230.
8690
0.86
560.
8622
0.85
8835
.00.
9061
0.90
280.
8996
0.89
630.
8930
0.88
970.
8864
0.88
300.
8797
0.87
640.
8731
0.86
970.
8664
0.86
300.
8597
Tabl
e 6.
2–4.
Sa
linity
cor
rect
ion
fact
ors
for d
isso
lved
oxy
gen
in w
ater
(bas
ed o
n sp
ecifi
c co
nduc
tanc
e).—
Cont
inue
d
[Fac
tors
are
dim
ensi
onle
ss; v
alue
s are
bas
ed o
n eq
uatio
ns p
ublis
hed
by B
enso
n an
d K
raus
e (1
984)
; Tem
p. (°
C),
tem
pera
ture
in d
egre
es C
elsi
us]

References Cited 31
Tem
p.
(deg
C)
Spec
ific
cond
ucta
nce,
in m
icro
siem
ens
per c
entim
eter
at 2
5 de
gree
s Ce
lsiu
s
45,0
0046
,000
47,0
0048
,000
49,0
0050
,000
51,0
0052
,000
53,0
0054
,000
55,0
0056
,000
57,0
0058
,000
59,0
00
30.0
0.85
200.
8485
0.84
500.
8416
0.83
810.
8346
0.83
110.
8276
0.82
410.
8207
0.81
720.
8137
0.81
020.
8066
0.80
3131
.00.
8529
0.84
940.
8460
0.84
250.
8391
0.83
560.
8321
0.82
870.
8252
0.82
170.
8182
0.81
480.
8113
0.80
780.
8043
32.0
0.85
370.
8503
0.84
690.
8435
0.84
000.
8366
0.83
310.
8297
0.82
620.
8228
0.81
930.
8159
0.81
240.
8089
0.80
5433
.00.
8546
0.85
120.
8478
0.84
440.
8410
0.83
750.
8341
0.83
070.
8272
0.82
380.
8204
0.81
690.
8135
0.81
000.
8066
34.0
0.85
550.
8521
0.84
870.
8453
0.84
190.
8385
0.83
510.
8317
0.82
820.
8248
0.82
140.
8180
0.81
450.
8111
0.80
7735
.00.
8563
0.85
290.
8496
0.84
620.
8428
0.83
940.
8360
0.83
260.
8292
0.82
580.
8224
0.81
900.
8156
0.81
220.
8087
Tabl
e 6.
2–4.
Sa
linity
cor
rect
ion
fact
ors
for d
isso
lved
oxy
gen
in w
ater
(bas
ed o
n sp
ecifi
c co
nduc
tanc
e).—
Cont
inue
d
[Fac
tors
are
dim
ensi
onle
ss; v
alue
s are
bas
ed o
n eq
uatio
ns p
ublis
hed
by B
enso
n an
d K
raus
e (1
984)
; Tem
p. (°
C),
tem
pera
ture
in d
egre
es C
elsi
us]

32 Chapter A6.2. Dissolved Oxygen
Appendix A. Example comparison between spectrophotometric and optical dissolved-oxygen meter data
Table 6.2–A1. Data for comparison between spectrophotometric and optical dissolved-oxygen meter methods.
[DO, dissolved-oxygen concentration; mg/L, milligrams per liter; ND, no data]
Date Time WellMeter reading,
DO in mg/L
Hach Indigo Carmine,
DO in mg/L
CHEMetrics Rhodazine D,
DO in mg/L
6/21/2016 12:56 GSA 167 0.01 0.05 ND
6/21/2016 12:57 GSA 167 0.01 ND 0.05
6/21/2016 12:58 GSA 167 0.01 ND 0.08
6/21/2016 13:00 GSA 167 0.01 ND 0.05
6/21/2016 13:03 GSA 167 0.01 0.02 ND
6/21/2016 13:03 GSA 167 0.01 ND 0.09
6/21/2016 13:03 GSA 167 0.01 0.03 ND
6/21/2016 13:05 GSA 167 0.01 ND 0.05
6/21/2016 13:06 GSA 167 0.01 ND 0.04
6/21/2016 13:07 GSA 167 0.01 ND 0.04
6/21/2016 13:10 GSA 167 0.01 0.04 ND
6/21/2016 13:12 GSA 167 0.01 ND 0.07
6/21/2016 13:14 GSA 167 0.01 ND 0.05
6/21/2016 13:14 GSA 167 0.01 ND 0.04
6/23/2016 11:02 GSA 167 0.07 ND 0.07
6/23/2016 11:06 GSA 167 0.06 0.07 ND
6/23/2016 11:11 GSA 167 0.05 0.06 ND
6/23/2016 11:12 GSA 167 0.05 0.03 ND
6/23/2016 11:13 GSA 167 0.05 ND 0.06
6/23/2016 11:15 GSA 167 0.05 ND 0.06
6/23/2016 11:16 GSA 167 0.05 0.06 ND
6/23/2016 11:17 GSA 167 0.05 ND 0.09
6/23/2016 11:18 GSA 167 0.05 ND 0.07
6/23/2016 11:19 GSA 167 0.04 0.05 ND
6/23/2016 11:22 GSA 167 0.04 ND 0.07
6/23/2016 11:22 GSA 167 0.04 0.09 ND
6/23/2016 11:23 GSA 167 0.04 ND 0.1
7/26/2016 11:17 GSA 167 0.06 0.08 ND
7/26/2016 11:18 GSA 167 0.06 ND 0.08
7/26/2016 11:19 GSA 167 0.06 ND 0.07
7/26/2016 11:20 GSA 167 0.06 ND 0.07
7/26/2016 11:21 GSA 167 0.06 0.06 ND
7/26/2016 11:22 GSA 167 0.06 0.08 ND
7/26/2016 11:22 GSA 167 0.05 0.07 ND

Appendix 1. 33
Date Time WellMeter reading,
DO in mg/L
Hach Indigo Carmine,
DO in mg/L
CHEMetrics Rhodazine D,
DO in mg/L
7/26/2016 11:23 GSA 167 0.05 ND 0.07
7/26/2016 11:24 GSA 167 0.05 ND 0.06
7/26/2016 11:26 GSA 167 0.05 0.05 ND
7/26/2016 11:29 GSA 167 0.05 ND 0.09
7/28/2016 10:57 GSA 167 0.04 0.04 ND
7/28/2016 10:58 GSA 167 0.05 ND 0.05
7/28/2016 11:00 GSA 167 0.04 ND 0.07
7/28/2016 11:00 GSA 167 0.04 0.04 ND
7/28/2016 11:00 GSA 167 0.05 ND 0.05
7/28/2016 11:01 GSA 167 0.05 0.05 ND
7/28/2016 11:03 GSA 167 0.05 ND 0.06
7/28/2016 11:04 GSA 167 0.05 ND 0.07
7/28/2016 11:05 GSA 167 0.04 ND 0.06
7/28/2016 11:07 GSA 167 0.04 ND 0.05
Table 6.2–A2. Calibration data for readings in table 6.2–A1.
[mm of Hg, millimeters of mercury; °C, degrees Celsius; DO, dissolved oxygen; Conc, concentration; mg/L, milligrams per liter]
DateBarometric pressure,
in mm of Hg
Temperature, in °C
100% DO saturation,
in mg/L
Initial Conc, in mg/L
Adjusted Conc, in mg/L
Meter reading in
zero solution, in mg/L
2-point calibration
(yes/no)
In situ meter type
6/21/2016 622.5 21.58 7.18 7.18 7.18 0.02 no AT600 serial 449415
6/23/2016 621.8 22.75 7.01 6.88 7.02 0.01 no AT600 serial 449680
7/26/2016 623.5 22.80 6.99 6.98 6.98 0.02 no Smart Troll
7/28/2016 623.0 22.25 7.10 7.10 7.08 0.02 no Smart Troll
Table 6.2–A1. Data for comparison between spectrophotometric and optical dissolved-oxygen meter methods.—Continued
[DO, dissolved-oxygen concentration; mg/L, milligrams per liter; ND, no data]


U.S. Geological Survey—D
issolved Oxygen—
Techniques and Methods 9–A6.2
ISSN 2328-7055 (online)https://doi.org/10.3133/tm9A6.2