Introduction to the Summary Care Record (SCR) Privacy Officer Module Privacy Officer v2.02 14-05-20.

MonteTM
v2.02User Manual
by T. Kevin HitchensApril 2003
Monte ©2003Carnegie Mellon University
T. Kevin HitchensJonathan A. LukinYiping ZhanGordon S. Rule
Corresponding addresses:
[email protected]@andrew.cmu.edu
Disclamer
Monte is provided as is. Neither the authors, nor Canegie Mellon University provide any warranty, orguarantee of program function or correctness of results. Individual users are responsible for the use, andinferences of Monte results.
2
Table of ContentsDISCLAMER.................................................................................................................................................................... 1
1. INTRODUCTION ........................................................................................................................................................ 3
2. LICENSE AGREEMENT............................................................................................................................................ 3
3. GETTING STARTED.................................................................................................................................................. 4
DIRECTORY STRUCTURE................................................................................................................................................. 4
4. INPUT FILES ............................................................................................................................................................... 5
4. 1 OVERVIEW ............................................................................................................................................................... 5Minimum Requirements............................................................................................................................................. 5Optional Input ........................................................................................................................................................... 5
4.2 FILES AACONV AND AACONV_DEUT.......................................................................................................................... 54.3 CHEMICAL SHIFT DATA BASE ................................................................................................................................... 54.4 SEQUENCE FILE ........................................................................................................................................................ 64.5 PDB FILE.................................................................................................................................................................. 64.6 SECONDARY STRUCTURE FILE .................................................................................................................................. 74.7 SPECIFIC AMINO ACID LABELS ................................................................................................................................ 74.8 NOESY DATA ......................................................................................................................................................... 8
5. PARAMETER FILE ................................................................................................................................................... 8
5.1 OVERVIEW................................................................................................................................................................ 85.2 INPUT FILES .............................................................................................................................................................. 95.3 OUTPUT FILES......................................................................................................................................................... 105.4 RUN PARAMETERS .................................................................................................................................................. 10
5.41 NOE distance cut-off. ...................................................................................................................................... 105.42 Residue Type Distribution Width & Deuterium Isotope Shifts ........................................................................ 115.43 Weighting Factors ........................................................................................................................................... 115.44 Tolerence for Chemical Shift Matching .......................................................................................................... 115.45 Chemical Shift offsets ...................................................................................................................................... 12
6. CHEMICAL SHIFT IDENTIFICATION TABLE.................................................................................................. 13
7. MATCHING OLD ASSIGNMENTS........................................................................................................................ 14
8. SIMULATED ANNEALING PARAMETERS ........................................................................................................ 15
8.1 ANNEALING SCHEDULE .......................................................................................................................................... 158.11 Number of cycles:............................................................................................................................................ 158.12 tstart/tstep/tfin: ................................................................................................................................................ 158.13 swap_lim/gamma............................................................................................................................................ 158.14 swap_sz ........................................................................................................................................................... 168.15 noe_scale......................................................................................................................................................... 168.16 Repulsive Terms .............................................................................................................................................. 16
8.2 SAVING THE PARAMETER FILE................................................................................................................................ 16
9. DATA OUTPUT FILES............................................................................................................................................. 17
9.1 LOG FILE ................................................................................................................................................................. 179.2 STANDARD OUTPUT................................................................................................................................................ 179.3 TEXT OUTPUT ......................................................................................................................................................... 189.4 HTML .................................................................................................................................................................... 189.5 ASSIGNMENT SUMMARY (POSTSCRIPT) ................................................................................................................. 209.6 CORRELATION PLOT ............................................................................................................................................... 21
10. CUSTOMIZING AND RUNNING MONTE. ........................................................................................................ 21
10.1 CUSTOMIZING. ...................................................................................................................................................... 2110.2 RUNNING MONTE ................................................................................................................................................. 21
3
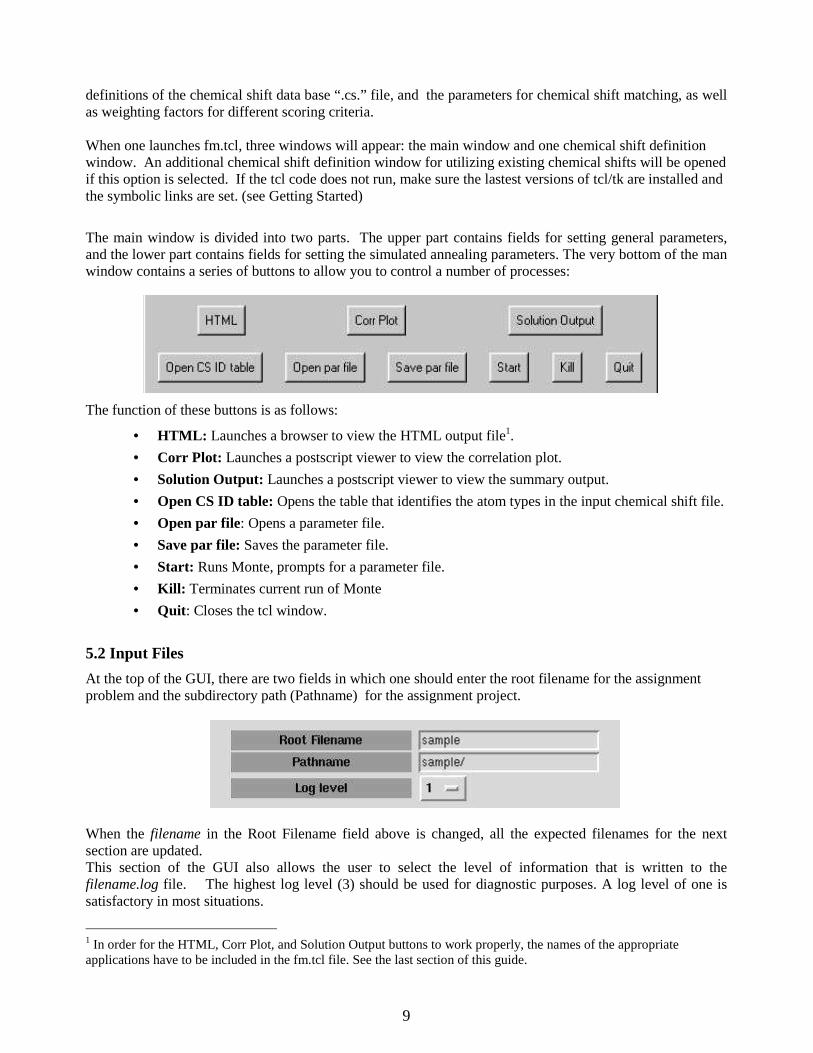
random assignment
Evaluate change in score, ∆s
Improved score?
perform swap
accept swap
accept swap with probability
exp(∆s/T)
YesNo
max. # of steps?
YesNo
reduce T
reset T
repe
at N
cycl
e tim
es
1. Introduction
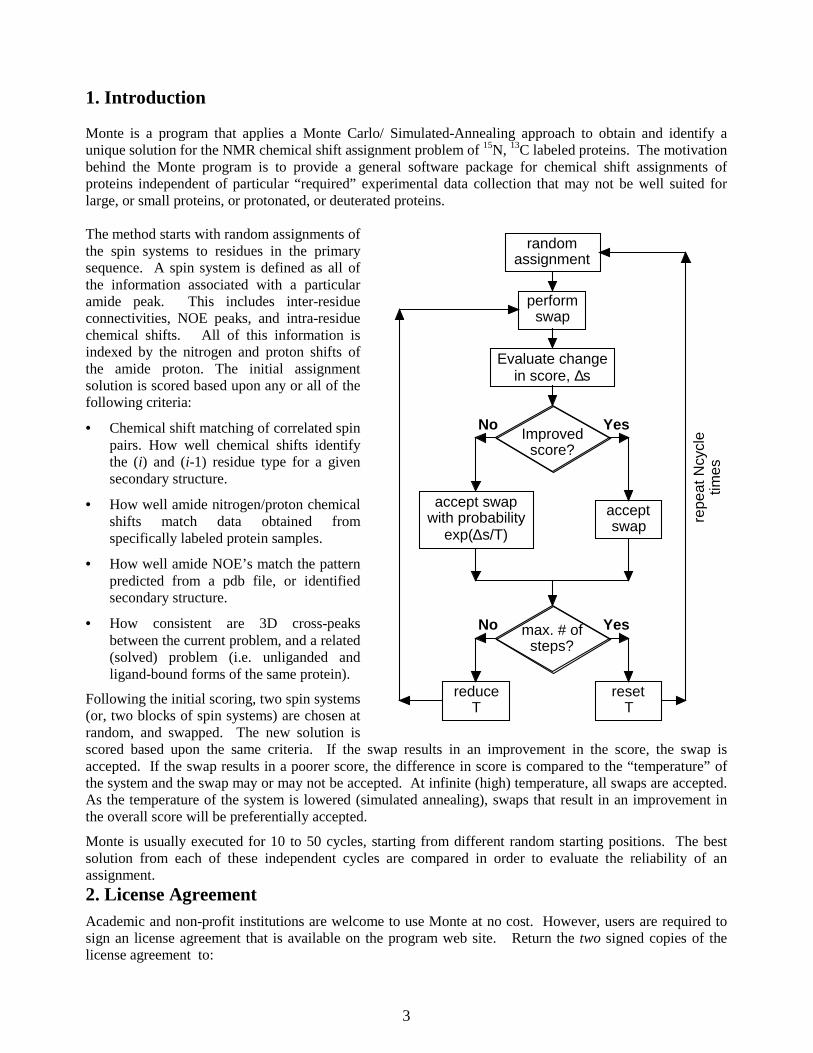
Monte is a program that applies a Monte Carlo/ Simulated-Annealing approach to obtain and identify aunique solution for the NMR chemical shift assignment problem of 15N, 13C labeled proteins. The motivationbehind the Monte program is to provide a general software package for chemical shift assignments ofproteins independent of particular “required” experimental data collection that may not be well suited forlarge, or small proteins, or protonated, or deuterated proteins.
The method starts with random assignments ofthe spin systems to residues in the primarysequence. A spin system is defined as all ofthe information associated with a particularamide peak. This includes inter-residueconnectivities, NOE peaks, and intra-residuechemical shifts. All of this information isindexed by the nitrogen and proton shifts ofthe amide proton. The initial assignmentsolution is scored based upon any or all of thefollowing criteria:
• Chemical shift matching of correlated spinpairs. How well chemical shifts identifythe (i) and (i-1) residue type for a givensecondary structure.
• How well amide nitrogen/proton chemicalshifts match data obtained fromspecifically labeled protein samples.
• How well amide NOE’s match the patternpredicted from a pdb file, or identifiedsecondary structure.
• How consistent are 3D cross-peaksbetween the current problem, and a related(solved) problem (i.e. unliganded andligand-bound forms of the same protein).
Following the initial scoring, two spin systems(or, two blocks of spin systems) are chosen atrandom, and swapped. The new solution isscored based upon the same criteria. If the swap results in an improvement in the score, the swap isaccepted. If the swap results in a poorer score, the difference in score is compared to the “temperature” ofthe system and the swap may or may not be accepted. At infinite (high) temperature, all swaps are accepted.As the temperature of the system is lowered (simulated annealing), swaps that result in an improvement inthe overall score will be preferentially accepted.
Monte is usually executed for 10 to 50 cycles, starting from different random starting positions. The bestsolution from each of these independent cycles are compared in order to evaluate the reliability of anassignment.
2. License AgreementAcademic and non-profit institutions are welcome to use Monte at no cost. However, users are required tosign an license agreement that is available on the program web site. Return the two signed copies of thelicense agreement to:
4
Dr. Gordon S. RuleDepartment of Biological Sciences4400 Fifth AvenueCarnegie Mellon UniversityPittsburgh, PA, 15213
After receipt of the license agreement you will be emailed a license key. This license key must by placed in afile called monte.license that must reside in the same directory as Monte. The license key itself is a 12character string that should be the first (and only) line in the license file. To insure that you are using arelatively current version of Monte, the license key expires one year after its issue. Registered users need notsign a new license agreement. Simply drop me an email and I will send you a new key.
For-profit organizations are welcome to use Monte gratis for a limited trial period, after completing thenecessary right-to-use agreement. After this period it is necessary to negotiate a license agreement. Pleasecontact Gordon Rule for additional information.
3. Getting StartedExtract the Monte distribution tar file:
tar –xvf FMv2.02.tar
Directory Structure
The Monte home directory, FM2 contains the following four files:
fm.exe Monte pre-compiled executable code.aaconv Chemical shift database for protonated shiftsaaconv_deut Chemical shift database for deuterated proteinsfm.tcl A graphical user interface for editing the project.par file.
Once you receive the license file, you should also place this file in the main directory. Within the homedirectory, one should create subdirectories for each chemical shift assignment project. These directoriescontain the parameter (.par) file, and all user input files. In addition, all output files will be placed in thesubdirectory. The subdirectory path and experimental filename is provided to the parameter (.par) file for agiven assignment problem. All input files must share the same root filename, and each individual file isidentified by a distinct file extension (see below).
Examples: In addition to the above files, two sample project directories, called rho and rho_dna, areincluded with the distribution. The rho directory contains sample files of all of the data types that Monte canutilize. It also includes a parameter file (.par), that contains all of the parameters that control Monte.Although this is a plain text file, it is highly recommended that one does not directly edit this file. Changesto program parameters should only be made through the tcl/tk Graphical User Interface (fm.tcl). Therho_dna directory is provided as an example of how to use known chemical shifts of an unliganded form ofthe protein to aid in the assignment of a liganded form, in this case a protein-DNA complex. The file thatcontains the chemical shifts for the unliganded form of the protein is called rho_final.out. When you run therho_dna example you will have to select this file using the tcl interface in order to get the correct directorypath.
Running tcl/tk: To run the tcl GUI, one should first make sure versions 8.0.4 or later of tcl and tk areinstalled. For SGI/IRIX these are available through http://freeware.sgi.com. Remember to change thesymbolic links for /usr/bin/tclsh -> /usr/freeware/bin/tclsh8.0, and /usr/bin/wish ->/usr/freeware/bin/wish8.0. To do this, rm /usr/bin/tclsh and /usr/bin/wish and then make the links as follows:
• ln -s /usr/freeware/bin/wish8.0 /usr/bin/wish
• ln -s /usr/freeware/bin/tclsh8.0 /usr/bin/tclsh
Running and Customizing Monte: Helpful hints on how to customize Monte and define run parameters areincluded in section 10 of this manual.
5
4. Input files4. 1 Overview
Minimum Requirementsaaconv and aaconv_deut [provided]Parameter file (filename.par) [provided, user modified]Chemical shift data base (filename.cs)Sequence File (filename.seq)License file (monte.license)
Optional Inputpdb file (filename.pdb)Secondary structure information (filename.ss)Specific label data
15N Specific Labels (filename.nsl)1-13C/15N (filename.csl)
NOESY data Single
Amide 4D NH-NH NOESY (filename.4dnoe)or a pair of
Amide 3D H-NH NOESY (filename.3dh_noe)Amide 3D N-NH NOESY (filename.3dn_noe)
Chemical shift assignment output from a related solution
4.2 Files aaconv and aaconv_deut
These are formatted text files that must reside in the HOME directory of the Monte program. Thefile contains the mean chemical shifts for CO, CA, CB, CG, and N nuclear spins, found for secondarystructures of random coil, α-helix, and β-sheet for each of the 20 common amino acids (aaconv) or the sameinformation corrected for deuterium isotope effects (aaconv_deut). The correction for the deuteriumisotope effect is selected in the Tcl/tk interface.
The data found in these files is used by Monte to determine amino acid type probabilities for the (i)and (i-1) residues of a amide pair spin system. One may wish to view this file to determine if a chemicalshift offset should be added to or subtracted from the user input shifts (N, CO, CA, CB, or CG shifts) for thepurpose residue type calculations (See Parameter file section). A slight difference in chemical shiftreferences may affect the assignment of residue type.
4.3 Chemical shift Data Base
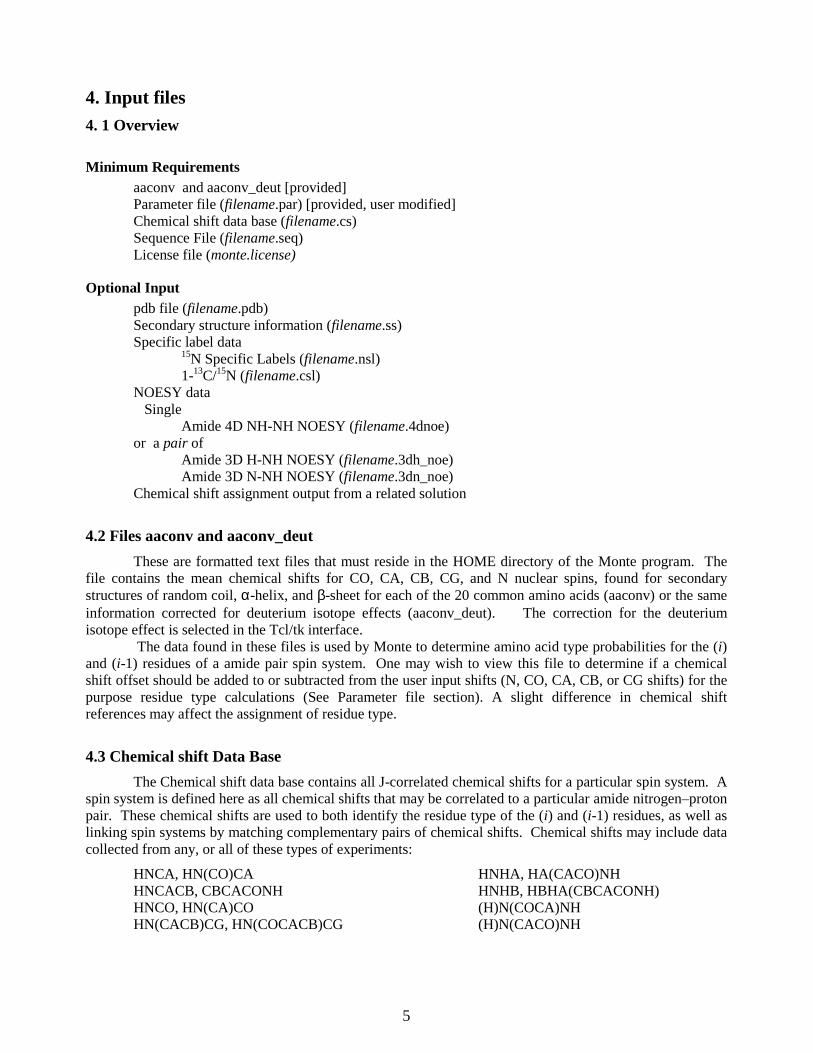
The Chemical shift data base contains all J-correlated chemical shifts for a particular spin system. Aspin system is defined here as all chemical shifts that may be correlated to a particular amide nitrogen–protonpair. These chemical shifts are used to both identify the residue type of the (i) and (i-1) residues, as well aslinking spin systems by matching complementary pairs of chemical shifts. Chemical shifts may include datacollected from any, or all of these types of experiments:
HNCA, HN(CO)CAHNCACB, CBCACONHHNCO, HN(CA)COHN(CACB)CG, HN(COCACB)CG
HNHA, HA(CACO)NHHNHB, HBHA(CBCACONH)(H)N(COCA)NH(H)N(CACO)NH
6
The format of the chemical shifts data base data follows the following example:
## N HN CA(i) CA(i-1) HA1(i) HA2(i) HA1(i-1) HA2(i-1) ....100.0 GLU12 124.23 7.65 56.32 60.54 3.43 0.00 0.00 0.00 ......101.0 GLY? 101.31 7.05 0.00 43.41 2.43 0.00 3.21 2.12 ......
Any line that is started by either ‘##’ or ‘%%’ is considered a comment text and will be ignored.
The first column in any data entry is a peak identification number. This is a four digit number with onedecimal place. The last digit may be incremented, for example, to indicated a single parent amide resonancethat may give rise to more than one carbon or proton cross peaks, i.e. from minor protein conformations oroverlapping resonance signals.
The second entry is an optional comment of up to eight characters. If there is a number in this field, thesoftware will assume that this is a tentative assignment. This number is not used in the Monte Carloprotocol; however, is carried over to the output files. Using this field to add/change tentative assignment isuseful in comparing output from multiple Monte runs.
Subsequent entries in each row are chemical shift frequencies and may be separated by spaces or comas. Thefirst and second columns must contain the parent amide nitrogen and amide proton shifts, in either order(defined by the .par file). The following chemical shifts may be in any order, but must be consistentthroughout the table. The order is user defined in the .par file. (see section on Parameter File)
Any chemical shifts at the very end of the list may be left blank if the shift is unknown. However, aunknown chemical shift field positioned within a series of known shifts must be entered 0.00 to hold its place(see example peak 101.0 above, no shift is identified with the intra residue CA).
4.4 Sequence File
The sequence file provides a primary sequence of the protein being studied. If a pdb file is available, thesequence file is not necessary. The sequence file is identified by the extension “ .seq” , and must be in theassignment sub-directory. The sequence file contains, in primary sequence order, the three letter codes(capital letters) for each amino acid, separated by one or more spaces, and or, carriage returns. Each string oftext may not exceed 100 characters. (25 Amino Acids, if separated by a single space)
MET ALA GLY PROHIS GLY LYS LEU
The sequence file, in conjunction with the secondary structure file is used to create a pseudo pdb file forNOE matching. For a coil, or sheet secondary structures, a linear peptide is created, for residues identified ashelical segments, an α-helical peptide will be created. This pdb file is written to “ temp.pdb” .
4.5 PDB File
The pdb file provides both the primary sequence of the protein being studied, as well as amide protoncoordinates for matching NOE’s. Monte will add amide protons to a crystal structure. The pdb file isidentified by the extension “ .pdb” . If a pdb file is used as input, a seq file is not used, or needed. Note: Thepdb file should end in "TER"

7
4.6 Secondary Structure File
The secondary structure file is identified by the extension “ .ss” . The secondary structure file providesinformation on the secondary structure of peptide segments. This information is used for both matchingresidue type probabilities as well as building a pseudo pdb file for NOE matching, in the absence of an X-rayor NMR structure file. The default secondary structure is random coil unless the helical or sheet segments areidentified.If a pdb file is available, then MONTE will calculate the secondary structure from the pdb file. However, theinformation in the secondary structure file will override the calculation from the pdb file. The existence of ass file prevents the calculation of secondary structure from the pdb file.
The format of the “ .ss” file is the number of helices, followed by subsequent lines that indicate theresidues at the start and the end the helical segments. This is followed by the number of β-sheet segmentsfollowed by the starting and ending residues for each segment. In the example below, there are 3 helices,segments 10-15, 22-40, and 42-50, there are also 2 β-sheet segments, residues 2-5 and 17-20. These residueswill match best with spin systems that more closely match the α-helical or β-sheet mean chemical shifts. Allother residues will match the mean chemical shifts for a random coil.
310 1522 4042 5022 517 20
If there are no β-sheets, or no α-helices, a zero must be entered followed by no segments. In the followingexample, there is no beta sheet secondary structures identified.
210 1522 400
4.7 Specific Amino Acid Labels
Monte will use amide chemical shift data acquired on either a specifically 15N labeled protein sample, or aspecifically 1-13C (carbonyl) and uniformly 15N labeled protein sample in conjunction with shifts obtainedfrom a 2-D HNCO filtered HSQC. In the former case, the pairs of amide chemical shifts identify the residuetype of the (i) amide spin system. In the latter case, the pairs of amide chemical shifts identify amide spinsystems of residues that are adjacent (i+1) to the label. Our experience is that the 1-13C/15N labeling schemeis more robust, and does not suffer from transaminase dilution of the specific label. Matching is based on acomparison of the amide proton and nitrogen shifts in the specific labeling file to the spin systems that havebeen assigned to that particular residue type. The score is based on the same Gaussian distribution that isused to score inter-residue connectivities.
The specific label files are identified the extensions “ .nsl” for the specific 15N label HSQC experiment and“ .csl” for the 1-13C/15N 2D HNCO experiment. The format of these files are the three letter code (capitalletters) for the amino acid followed by the amide nitrogen and amide proton chemical shifts. The order ofthese two chemical shifts MUST be consistent with the chemical shift data base file, and the order defined inthe .par file. The following example is a pairs of shifts for an alanine specific label.
ALA 123.4 7.44ALA 120.5 8.54
8
Identification of residues containing methyl groups and other residue specific experiments.Additional information on the potential residue type of spin systems can also be incorporated into Monte. Ifthe residue type is uncertain, e.g. for methyl containing residues, then all possible residues should beindicated. For example, if the an amide peak at 120.2 and 7.3 ppm was observed in a (H)(CC)(CO)NHTOCSY spectrum of a methyl protonated protein then the following should be include in the "csl" file:
ALA 120.2 7.3VAL 120.2 7.3LEU 120.2 7.3ILE 120.2 7.3
4.8 NOESY data
Monte may use input from either a 4D Amide-Amide NOESY, or two 3D NOESY spectra, an H-NH HSQCNOESY, and an N-NH HSQC NOESY. The NOESY cross peaks are matched with those which arepredicted from the pdb file, or secondary structure, within the NOE distance cut off (see Parameter file).
The 4D NH-NH NOE file is identified by the extension “ .4dnoe” . Each set of NOE data must be assigned toa parent amide peak. The file format contains the peak identification number followed by the parent amidenitrogen and amide proton chemical shifts. The order of these shifts and subsequent NOE pairs must beconsistent with the chemical shift data base file, and the definition in the .par file.
## PARENT NOE1 NOE2 NOE3##100.0 124.2 7.65 123.3 8.54 120.4 7.24 128.4 9.00
The 3D H-NH and N-NH HSQC NOESY files are identified by either the file extension “ .3dh_noe” and“ .3dn_noe” , respectively. Monte will run with only the 3D H-NH NOESY, however, this information aloneis often too general to provide a useful constraint for finding a unique chemical shift assignment solution.Therefore, it is highly recommended that the complementary pair of information is used for input. Theformat of the 3D NOESY files is similar to the 4D input file described above; however, in these cases, theparent amide shifts are followed by the single proton, or nitrogen cross peak. For example:
## 3d H-NH HSQC NOESY## PARENT NOE1 NOE2 NOE3100.0 124.2 7.65 8.54 7.24 9.00
## d3 N-NH HSQC NOESY## PARENT NOE1 NOE2 NOE3100.0 124.2 7.65 123.3 120.4 128.4
5. Parameter File5.1 Overview
The parameter (.par) file is unique to each chemical shift assignment project, and must reside in theassignment project sub-directory. This is a plain text file; however, it is strongly suggested that this file onlybe edited via the graphical user interface (fm.tcl).The parameter file provides Monte with several pieces of information, such as the root filename for theparameter, data , and output files. In addition, the directory path for the assignment problem is also in theparameter file. The parameter file also identifies to Monte what data files are available for input, the column
9
definitions of the chemical shift data base “ .cs.” file, and the parameters for chemical shift matching, as wellas weighting factors for different scoring criteria.
When one launches fm.tcl, three windows will appear: the main window and one chemical shift definitionwindow. An additional chemical shift definition window for utilizing existing chemical shifts will be openedif this option is selected. If the tcl code does not run, make sure the lastest versions of tcl/tk are installed andthe symbolic links are set. (see Getting Started)
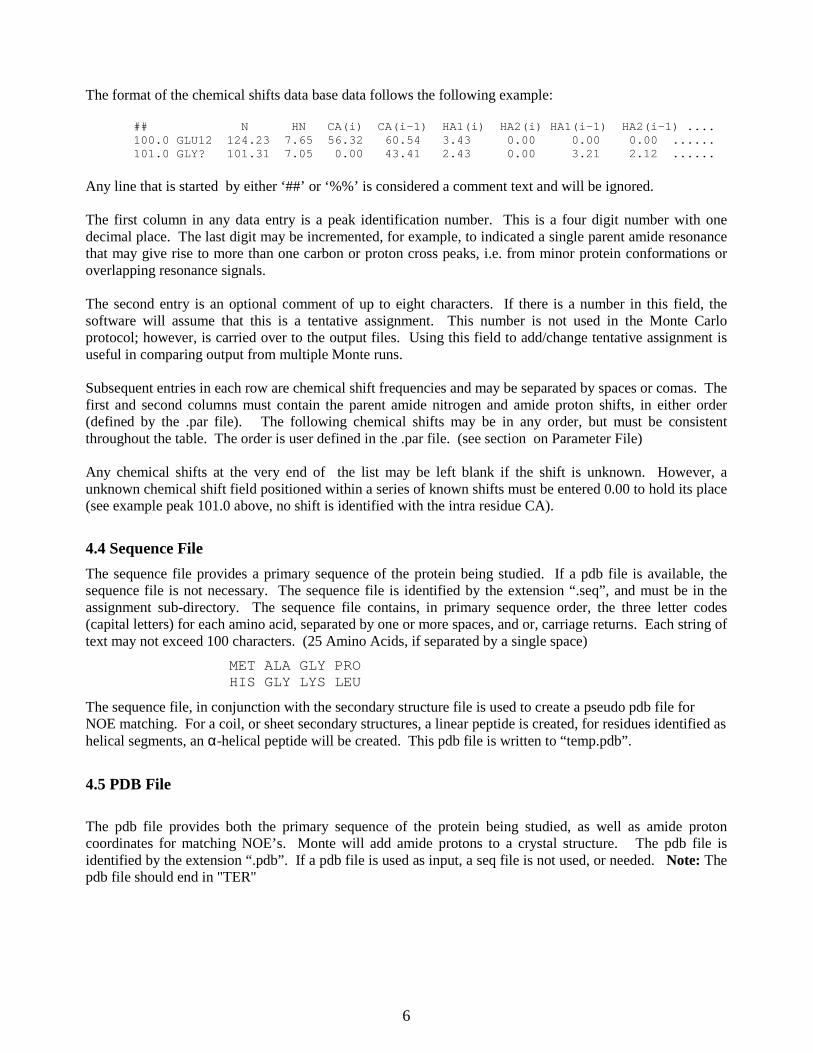
The main window is divided into two parts. The upper part contains fields for setting general parameters,and the lower part contains fields for setting the simulated annealing parameters. The very bottom of the manwindow contains a series of buttons to allow you to control a number of processes:
The function of these buttons is as follows:
• HTML: Launches a browser to view the HTML output file1.
• Corr Plot: Launches a postscript viewer to view the correlation plot.
• Solution Output: Launches a postscript viewer to view the summary output.
• Open CS ID table: Opens the table that identifies the atom types in the input chemical shift file.
• Open par file: Opens a parameter file.
• Save par file: Saves the parameter file.
• Start: Runs Monte, prompts for a parameter file.
• Kill: Terminates current run of Monte
• Quit: Closes the tcl window.
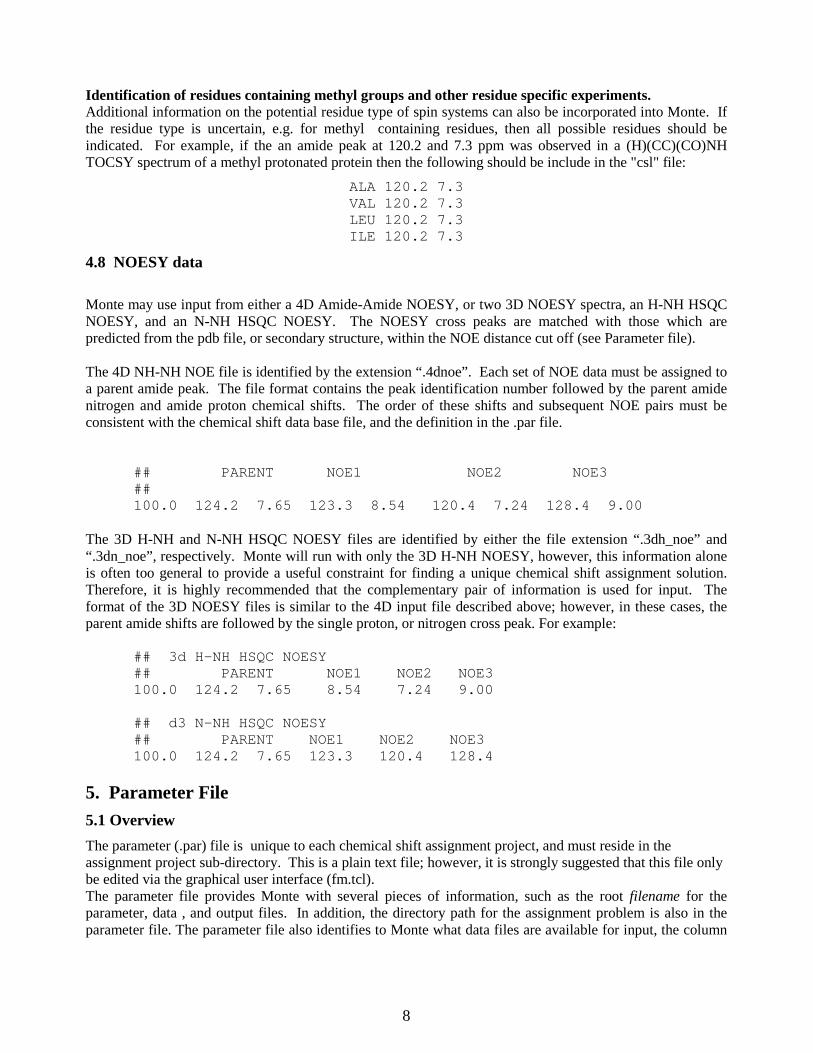
5.2 Input Files
At the top of the GUI, there are two fields in which one should enter the root filename for the assignmentproblem and the subdirectory path (Pathname) for the assignment project.
When the filename in the Root Filename field above is changed, all the expected filenames for the nextsection are updated.This section of the GUI also allows the user to select the level of information that is written to thefilename.log file. The highest log level (3) should be used for diagnostic purposes. A log level of one issatisfactory in most situations.
1 In order for the HTML, Corr Plot, and Solution Output buttons to work properly, the names of the appropriateapplications have to be included in the fm.tcl file. See the last section of this guide.

10
Next, identify what files are available for the Monte run by clicking on the appropriate radio button (seebelow)
The “ .cs” file MUST be available. Either the “ .seq” or “ .pdb” file MUST also be available. The other filesare optional. One may only use the N-NH HSQC NOESY data if there is also H-HN HSQC NOESY dataavailable, hence in the above example, the “ .3dn_noe” choice may not be selected.
5.3 Output Files
Monte produces the following output files:main.html: An HTML document summarizing chemical shift matching, NOE matching, and residue
type prediction.filename_out: The best assignment solution.filename_out.ps: A postscript figure that summarizes the assignment datasolutions/filename_nn.soln: The best assignment solutions for each cycle of the Monte runsolutions/corr.ps: A postscript correlation plot
The GUI can be used to select whether theHTML or postscript output is desired. If thepostscript output is selected then you canselect how many residues to print/line and ascaling factor for the final output. For largeproteins (e.g. >200 residues) it may benecessary to reduce the scaling factor to keepthe output on one page. The NOE output onthe postscript plot can be turned off ifdesired.Additional detail regarding the output files can be found in section 8.
5.4 Run Parameters
The parameters that control the scoring are defined in the next section of the top portion of the mainwindow. You will probably have to scroll down in order to see these windows.
5.41 NOE distance cut-off.In the next field enter the desired distance cut-off (Å) for NOE matching. Monte will matchNOE chemical shifts that are consistent withthe current assignment solution and are within the distance cut-off radius of the parent amide proton in thepdb structure file. If the pdb file is not available, Monte will create a pseudo pdb file (temp.pdb). In this
11
case, random coil or β-sheet defined residues are constructed as a linear peptide. If an NOE distance cut-offof 4.5A is selected then NOEs between adjacent residues will be generated for assignment purposes.
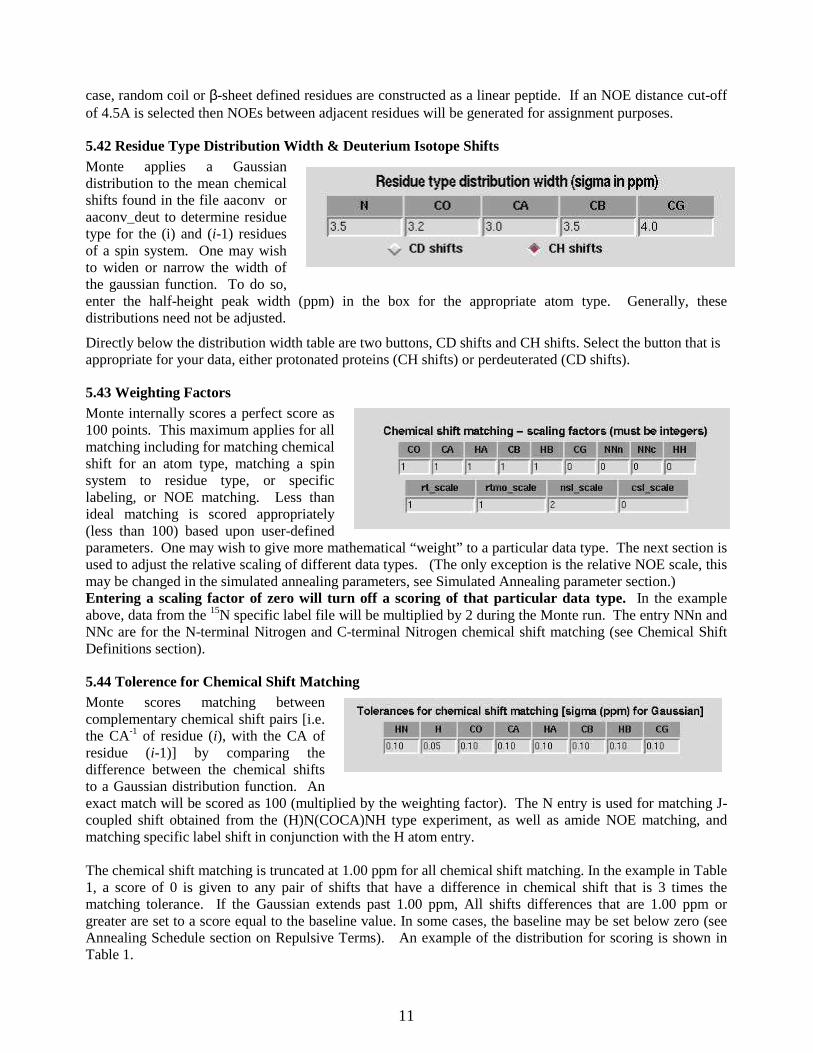
5.42 Residue Type Distribution Width & Deuterium Isotope ShiftsMonte applies a Gaussiandistribution to the mean chemicalshifts found in the file aaconv oraaconv_deut to determine residuetype for the (i) and (i-1) residuesof a spin system. One may wishto widen or narrow the width ofthe gaussian function. To do so,enter the half-height peak width (ppm) in the box for the appropriate atom type. Generally, thesedistributions need not be adjusted.
Directly below the distribution width table are two buttons, CD shifts and CH shifts. Select the button that isappropriate for your data, either protonated proteins (CH shifts) or perdeuterated (CD shifts).
5.43 Weighting FactorsMonte internally scores a perfect score as100 points. This maximum applies for allmatching including for matching chemicalshift for an atom type, matching a spinsystem to residue type, or specificlabeling, or NOE matching. Less thanideal matching is scored appropriately(less than 100) based upon user-definedparameters. One may wish to give more mathematical “ weight” to a particular data type. The next section isused to adjust the relative scaling of different data types. (The only exception is the relative NOE scale, thismay be changed in the simulated annealing parameters, see Simulated Annealing parameter section.)Entering a scaling factor of zero will turn off a scoring of that particular data type. In the exampleabove, data from the 15N specific label file will be multiplied by 2 during the Monte run. The entry NNn andNNc are for the N-terminal Nitrogen and C-terminal Nitrogen chemical shift matching (see Chemical ShiftDefinitions section).
5.44 Tolerence for Chemical Shift MatchingMonte scores matching betweencomplementary chemical shift pairs [i.e.the CA-1 of residue (i), with the CA ofresidue (i-1)] by comparing thedifference between the chemical shiftsto a Gaussian distribution function. Anexact match will be scored as 100 (multiplied by the weighting factor). The N entry is used for matching J-coupled shift obtained from the (H)N(COCA)NH type experiment, as well as amide NOE matching, andmatching specific label shift in conjunction with the H atom entry.
The chemical shift matching is truncated at 1.00 ppm for all chemical shift matching. In the example in Table1, a score of 0 is given to any pair of shifts that have a difference in chemical shift that is 3 times thematching tolerance. If the Gaussian extends past 1.00 ppm, All shifts differences that are 1.00 ppm orgreater are set to a score equal to the baseline value. In some cases, the baseline may be set below zero (seeAnnealing Schedule section on Repulsive Terms). An example of the distribution for scoring is shown inTable 1.

12
5.45 Chemical Shift offsetsTo determine reside type for the (i) and (i-1)residues, Monte compares the input chemicalshifts to the median shifts for each residue typeand secondary structure type found in the aaconvfile (see aaconv section). One’ s chemical shiftreferencing may differ from the standard shifts.In this case, one may instruct Monte to apply a correction to the input data for residue type identification.Enter the values in the appropriate boxes provided. These corrections are only applied when determiningresidue type probabilities, and Monte will not actually change the chemical shifts between the input andoutput files.
Table 1: Example of distribution of scoring for chemical shift matching for three different Guassiantolerence widths. The chemical shift difference between complementary shifts is indicated in the firstcolumn (ppm). In this example a tolerence is 0.3 ppm for CO, 0.15 ppm for CA, and 0.05 ppm for HA.
ppm CO Ca Ha
0.00 100 100 100 0.01 99 99 98 0.02 99 99 92 0.03 99 98 83 0.04 99 96 72 0.05 98 94 60 0.06 98 92 48 0.07 97 89 37 0.08 96 86 27 0.09 95 83 19 0.10 94 80 13 0.11 93 76 8 0.12 92 72 5 0.13 91 68 3 0.14 89 64 1 0.15 88 60 1 0.16 86 56 0 0.17 85 52 0 0.18 83 48 0 0.19 81 44 0 0.20 80 41 0 0.21 78 37 0 0.22 76 34 0 0.23 74 30 0 0.24 72 27 0 0.25 70 24 0 0.26 68 22 0 0.27 66 19 0 0.28 64 17 0 0.29 62 15 0 0.30 60 13 0 0.31 58 11 0 0.32 56 10 0
ppm CO Ca Ha
0.33 54 8 0 0.34 52 7 0 0.35 50 6 0 0.36 48 5 0 0.37 46 4 0 0.38 44 4 0 0.39 42 3 0 0.40 41 2 0 0.41 39 2 0 0.42 37 1 0 0.43 35 1 0 0.44 34 1 0 0.45 32 1 0 0.46 30 0 0 0.47 29 0 0 0.48 27 0 0 0.49 26 0 0 0.50 24 0 0 0.51 23 0 0 0.52 22 0 0 0.53 21 0 0 0.54 19 0 0 0.56 17 0 0 0.57 16 0 0 0.58 15 0 0 0.59 14 0 0 0.60 13 0 0 0.61 12 0 0 0.62 11 0 0 0.63 11 0 0 0.64 10 0 0 0.65 9 0 0 0.66 8 0 0
ppm CO Ca Ha
0.67 8 0 0 0.68 7 0 0 0.69 7 0 0 0.70 6 0 0 0.71 6 0 0 0.72 5 0 0 0.73 5 0 0 0.74 4 0 0 0.75 4 0 0 0.76 4 0 0 0.77 3 0 0 0.78 3 0 0 0.79 3 0 0 0.80 2 0 0 0.81 2 0 0 0.82 2 0 0 0.83 2 0 0 0.84 1 0 0 0.85 1 0 0 0.86 1 0 0 0.87 1 0 0 0.88 1 0 0 0.89 1 0 0 0.90 1 0 0 0.91 1 0 0 0.92 0 0 0 0.93 0 0 0 0.94 0 0 0 0.95 0 0 0 0.96 0 0 0 0.97 0 0 0 0.98 0 0 0 0.99 0 0 0 1.00 0 0 0

13
6. Chemical Shift Identification Table
The chemical shift identification table allows the user to define the chemical shift types that are listed in eachcolumn of the “ .cs” file. The “ N” and the “ H” entries are the parent amide nitrogen and amide protonchemical shifts. These two shifts must be in either of the first two columns of the chemical shift data basefile.
Only one column may be selected for one atom type listed in each row. To redefine a row or colum, the rowor column must first be deselected. The intra residue (i) chemical shifts for the parent amide nitrogen pairare identified by CO, CA, HA, etc. Inter-residue shifts (i-1) (i.e. from the preceeding residue) are identifiedby the same atom names followed by the superscript “ -1” . The atom types Nn and Nc refer to the N-terminalnitrogen shift and the C-terminal nitrogen shift. These correlations are derived from the followingexperiments
Nn : (H)N(CACO)NHNc : (H)N(COCA)NH
In the following example, the Chemical shift matching table is consistent with the “ .cs” input file thatcontains the parent amide nitrogen shift in column 1, the parent amide proton shift in column 2, the inter-residue CO shift in column 3 (i.e. from the HN(CA)CO experiment), the inter-residue CO shift in column 4(i.e., HNCO experiment), the intra-residue CB shift in column 7, and the inter-residue CB shift in column 8.If there happen to be shifts in columns 9 and above, the chemical shifts will be carried over to the Monteoutput, however, they will NOT be used by the program to obtain the solution.
Note about aliphatic Proton matching: Monte will match HA1 and HA1-1 chemical shifts without theHA2 shifts being defined. If both shifts are identified (as in the case of Glycine residues), however, Montewill find the best combination of the two shifts. If one desires to match HB chemical shifts, however, both

14
HB1, HB2 and the complement HB1-1 and HB2-1 must be defined. Monte will find the best combinationbetween these four chemical shifts.
If the window shown above is closed, it may be opened again by selecting the “ Open CS ID table” button atthe bottom of the Main window.
7. Matching old AssignmentsOne of the unique features of Monte is that the program can match a chemical shift assignment solution froman previous Monte output file. An example of this approach is provided in the rho_dna directory that isincluded in the distribution. This feature is useful when working on chemical shift assignments of a particularprotein, and subsequent ligand bound forms of the same protein. The assumption here is that the presence ofthe ligand only significantly perturbs chemical shifts of residues that are in the vicinity of the binding site, orare involved in structural changed due to the ligand binding. In this case many of the chemical shiftsobtained for the unliganded form of the protein provide a useful constraint for assignment of the ligandbound form of the protein (or, vice versa). To match an old assignment solution, Monte compares how wellcross peaks in the same type of 3D spectra match. Monte will match all or some of HNCO, HN(CA)CO,HNCA, HN(CO)CA, HNCB, and HN(CO)CB types data.
To match an old output, select “ match old output” . Onemust also tell Monte what columns to find the desireddata. These column definitions identified in a mannersimilar to that described above. (See Chemical ShiftDefinitions). Open the old CS match table to set thecolumn definitions.
The user must also provide the path and filename of the old Monte output file. One may bowse the directorystructure for the desired file.
Monte will only match chemical shift assignments in this old output file that are indicated as a confidentassignment. A confident assignment is indicated in the file with a “ +” symbol (see Output File section). Onemay wish to first edit this file to remove some “ +” symbols (see Advice section)
The tolerance for chemical shift matching follows the rules discussed above. Enter the desired matchingtolerance and weight factor in the appropriate field.

15
8. Simulated Annealing ParametersThe lower section of the GUI is used to set the simulated annealing schedule. The annealing schedule mayhave a single, or multiple steps. To add, or delete a step, click “ Add a row” or “ Delete last row” ,respectively.
8.1 Annealing Schedule
Each Annealing schedule step has several user adjustable features.
8.11 Number of cycles:This specifies the number of times, or cycles, the annealing schedule will be run. Since the initialassignments are random, these will be independent solutions.
8.12 tstart/tstep/tfin:The parameter tstart defines the starting “ temperature” for that annealing step. After the number of swappingcycles is reached, the temperature of the system is lowered by tstep until the temperature is less than or equalto tfin. Following which, the next annealing step is started. At the end of each annealing step (in addition tothe initial random assignment) a text output file is written to the experiment sub-directory. The output fileextension is incremented as the annealing step in incremented (see Output Files section).
Note on annealing temperature: Monte is designed to provide a general method for chemical shiftassignments. Different chemical shift assignment problems will result in higher or lower overall scores, aswell as variable magnitude of score differences while comparing swapped blocks of assignments. Thesescore difference are a function of the amount of data and the relative weighting factors used for the Monterun. With this in mind, the “ melting temperature” , or transition between the temperature at which all swapsare accepted and better scores a preferentially accepted will vary. The annealing schedule should be adjustedaccordingly. Monte provides some scoring and swapping data during simulated annealing process to helpthe user adjust the annealing schedule.
8.13 swap_lim/gammaThe parameter ncyclim defines the number of cycles that should be completed before the temperature islowered. Since lower temperatures result in a fewer number of accepted swaps, it is useful to increase thenumber of cycles per interation as the temperature is lowered. The parameter gamma defines the rate ofincrease of ncyclim as temperature is lowered for a particular annealing step. The desired result is tonormalize the number of successful swaps over the course of the annealing step.
16
8.14 swap_szThe parameter n_swap defines the maximum number of adjacent spin systems that will be swapped duringthat annealing step. The size of the blocks that are swapped is chosen at random from 1 to n_swap. Initially,n_swap should be low, i.e. 1, since it is unlikely that the random assignment resulted in correctly assemblinglinked spin systems. As the temperature is lowered, more spin systems will be better linked, and the problembecomes finding the correct position in the primary sequence of the protein. Therefore, at later stages of theannealing schedule, it may be advantageous to swap larger blocks of spin systems.
8.15 noe_scaleMatching predicted NOE’ s (from a pdb file) to experimental NOE’ s is a very powerful assignment tool. Thisinformation becomes most useful to Monte after some spin systems become linked and better assignment. Inaddition, since, Monte internally scores all perfect matches to 100, and a single parent amide may havemultiple NOE’ s, NOE matching may over power J-coupled matching. For these reasons, the NOE scalingfactor may be adjusted at each annealing step. Also, in contrast to other scaling factors, the NOE scalingfactor may be less than 1. It may be advantageous to start out a Monte run with a scaling factor of zero. Asthe “ melting temperature” of the system is reached slowly increase the NOE scale to desired value.
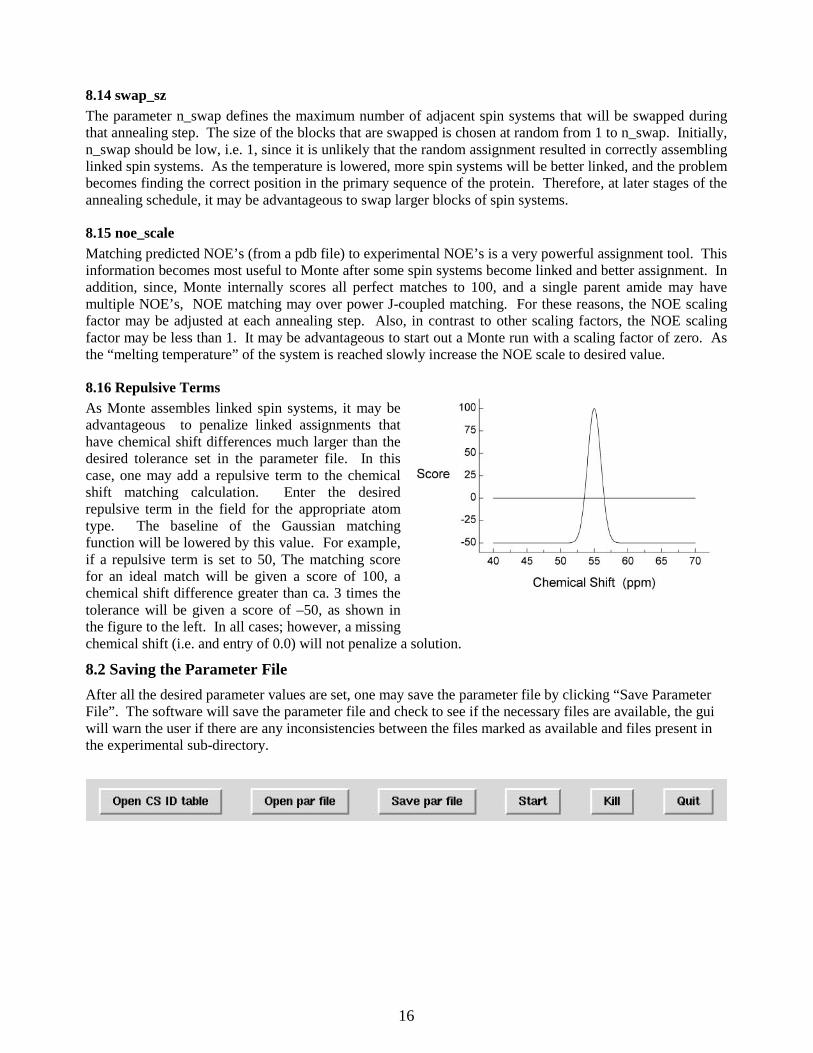
8.16 Repulsive TermsAs Monte assembles linked spin systems, it may beadvantageous to penalize linked assignments thathave chemical shift differences much larger than thedesired tolerance set in the parameter file. In thiscase, one may add a repulsive term to the chemicalshift matching calculation. Enter the desiredrepulsive term in the field for the appropriate atomtype. The baseline of the Gaussian matchingfunction will be lowered by this value. For example,if a repulsive term is set to 50, The matching scorefor an ideal match will be given a score of 100, achemical shift difference greater than ca. 3 times thetolerance will be given a score of –50, as shown inthe figure to the left. In all cases; however, a missingchemical shift (i.e. and entry of 0.0) will not penalize a solution.
8.2 Saving the Parameter File
After all the desired parameter values are set, one may save the parameter file by clicking “ Save ParameterFile” . The software will save the parameter file and check to see if the necessary files are available, the guiwill warn the user if there are any inconsistencies between the files marked as available and files present inthe experimental sub-directory.

17
9. Data Output filesMonte writes several forms of output during the simulated annealing run, as well as at the end of the run.These output files are useful in determining the quality of an assignment solution, and help the user makedecisions concerning the annealing schedule and other parameters. The log file is also useful to trouble shootproblems that may arise with files that may have a format, which is incompatible with Monte.
9.1 Log file
Monte creates a “ .log” file in the experimental sub-directory. The amount of information written to this fileis controlled by the log level parameter.
log level=0 Nothing is logged.
log level=1 Only the filenames of input data, and standard output are logged.
log level=2 In addition to log level=1, most data read in from input files is written to the log fileThis includes chemical shift database, pdb file, specific label files, etc
log level=3 In addition to log level=2, all internally calculated data is logged.
9.2 Standard Output
During the simulated annealing, Monte with write text to the unix shell indicating the progress of theannealing schedule. An example is shown below
anneal max max NOEsched temp ncyc n-suc n-rej score score swap scale2 140.0 10001 2712 7289 28971 30875 2 0.1------------------------------------------------------------------------| CO Ca Ha Cb Hb Cg Nn/Nc || 2745 2436 4304 2132 6387 0 0 |------------------------------------------------------------------------| rt(i) rt(i-1) N(15) 1-C(13) | NH NH HA HB || 6111 4308 0 0 | NOE 548 |------------------------------------------------------------------------
The top row of this output shows the current step number of the annealing and the current temperature. Thevalue ncyc indicated the number of cycles for that temperature. The values n-suc and n-rej indicate thenumber of successful swaps and number of rejected swaps, respectively. Score and max Score indicate thecurrent overall score for the solution and the highest score that has been reached over the current annealingstep. Max swap indicated the maximum number of residues that are swapped, and NOE scale indicated thecurrent scaling factor for NOE matching.
The next section of text indicated the total score calculated for each type of chemical shift matching. (Thesevalues are a result of the internal score multiplied by the scaling factor). The values reported here might benegative if repulsive terms are greater than zero in the annealing step parameters. (see Repulsive Terms)
The following section reports the score given for residue type matching. The first two indicate the total scorefor matching residue type probabilities (based upon chemical shifts) for the (i) and (i-1) residues,respectively. The value for N(15) reports the total score given for matching 15N specific label data, andlikewise the 1-C(13) value reports the total score for any 1-13C/15N type specific label data.
The next section in this row reports the total score for NOE matching. Currently Monte only takes advantageof amide/amide NOE data. Hence the HA and HB fields are blank.
18
9.3 Text Output
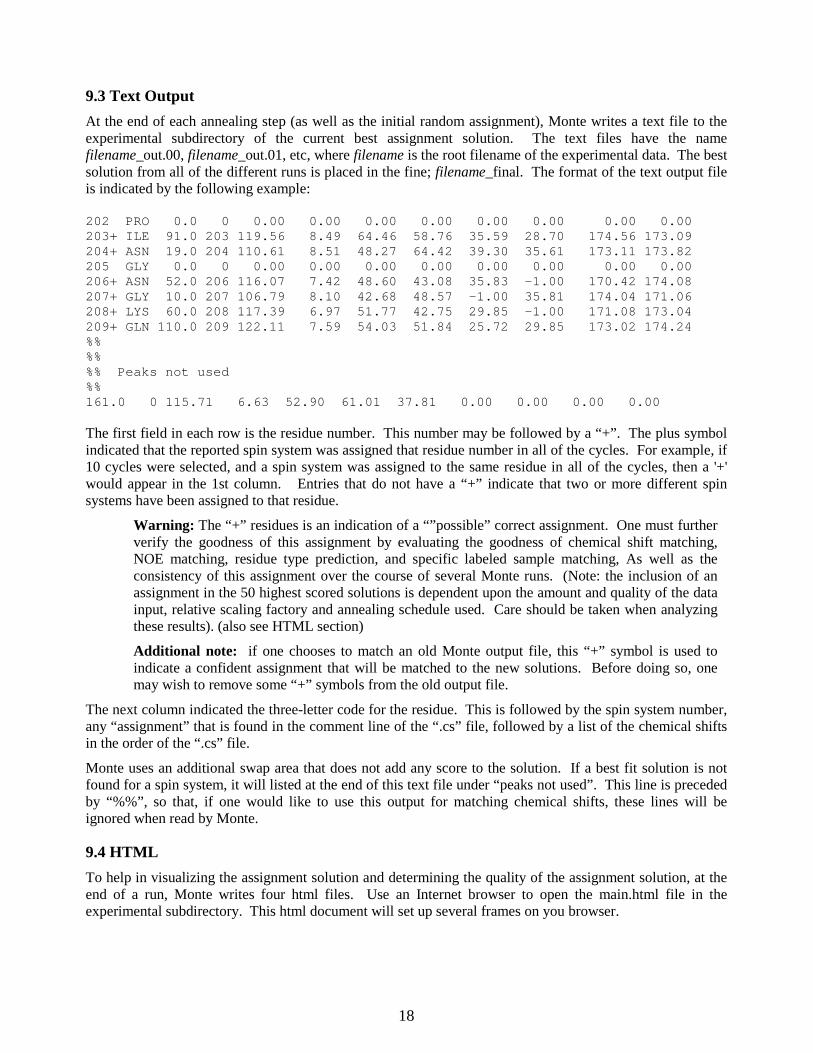
At the end of each annealing step (as well as the initial random assignment), Monte writes a text file to theexperimental subdirectory of the current best assignment solution. The text files have the namefilename_out.00, filename_out.01, etc, where filename is the root filename of the experimental data. The bestsolution from all of the different runs is placed in the fine; filename_final. The format of the text output fileis indicated by the following example:
202 PRO 0.0 0 0.00 0.00 0.00 0.00 0.00 0.00 0.00 0.00203+ ILE 91.0 203 119.56 8.49 64.46 58.76 35.59 28.70 174.56 173.09204+ ASN 19.0 204 110.61 8.51 48.27 64.42 39.30 35.61 173.11 173.82205 GLY 0.0 0 0.00 0.00 0.00 0.00 0.00 0.00 0.00 0.00206+ ASN 52.0 206 116.07 7.42 48.60 43.08 35.83 -1.00 170.42 174.08207+ GLY 10.0 207 106.79 8.10 42.68 48.57 -1.00 35.81 174.04 171.06208+ LYS 60.0 208 117.39 6.97 51.77 42.75 29.85 -1.00 171.08 173.04209+ GLN 110.0 209 122.11 7.59 54.03 51.84 25.72 29.85 173.02 174.24%%%%%% Peaks not used%%161.0 0 115.71 6.63 52.90 61.01 37.81 0.00 0.00 0.00 0.00
The first field in each row is the residue number. This number may be followed by a “ +” . The plus symbolindicated that the reported spin system was assigned that residue number in all of the cycles. For example, if10 cycles were selected, and a spin system was assigned to the same residue in all of the cycles, then a '+'would appear in the 1st column. Entries that do not have a “ +” indicate that two or more different spinsystems have been assigned to that residue.
Warning: The “ +” residues is an indication of a “ ” possible” correct assignment. One must furtherverify the goodness of this assignment by evaluating the goodness of chemical shift matching,NOE matching, residue type prediction, and specific labeled sample matching, As well as theconsistency of this assignment over the course of several Monte runs. (Note: the inclusion of anassignment in the 50 highest scored solutions is dependent upon the amount and quality of the datainput, relative scaling factory and annealing schedule used. Care should be taken when analyzingthese results). (also see HTML section)
Additional note: if one chooses to match an old Monte output file, this “ +” symbol is used toindicate a confident assignment that will be matched to the new solutions. Before doing so, onemay wish to remove some “ +” symbols from the old output file.
The next column indicated the three-letter code for the residue. This is followed by the spin system number,any “ assignment” that is found in the comment line of the “ .cs” file, followed by a list of the chemical shiftsin the order of the “ .cs” file.
Monte uses an additional swap area that does not add any score to the solution. If a best fit solution is notfound for a spin system, it will listed at the end of this text file under “ peaks not used” . This line is precededby “ %%” , so that, if one would like to use this output for matching chemical shifts, these lines will beignored when read by Monte.
9.4 HTML
To help in visualizing the assignment solution and determining the quality of the assignment solution, at theend of a run, Monte writes four html files. Use an Internet browser to open the main.html file in theexperimental subdirectory. This html document will set up several frames on you browser.
19
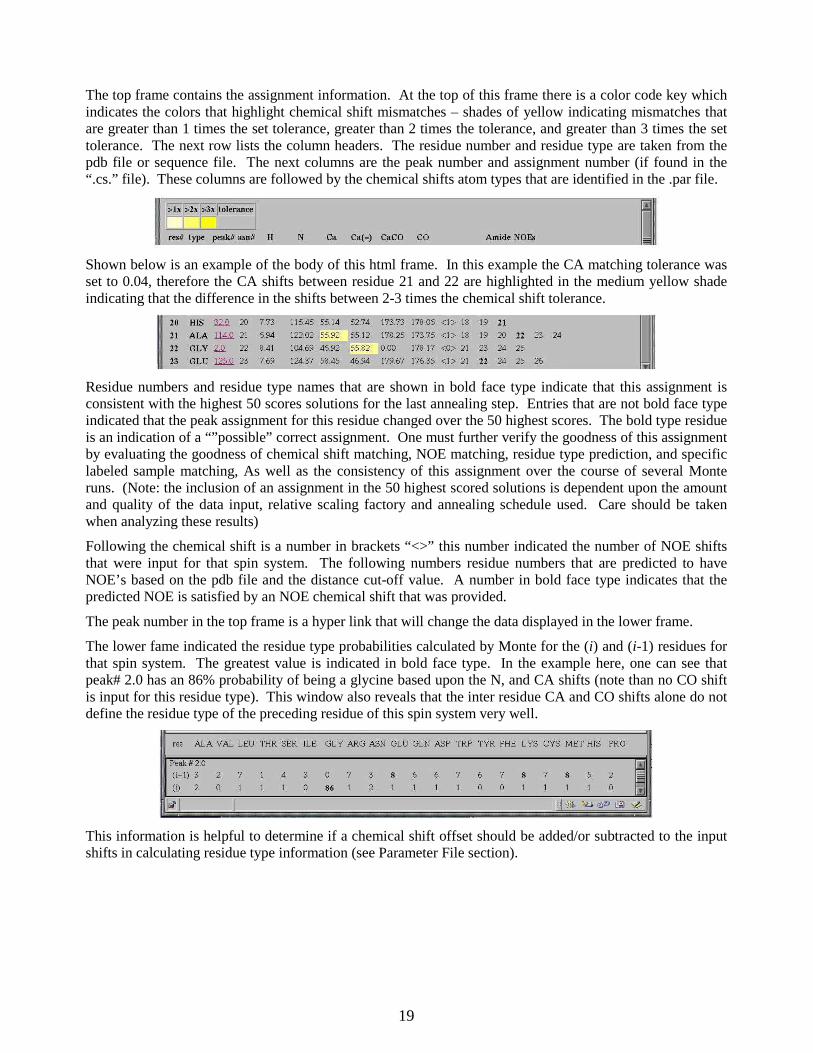
The top frame contains the assignment information. At the top of this frame there is a color code key whichindicates the colors that highlight chemical shift mismatches – shades of yellow indicating mismatches thatare greater than 1 times the set tolerance, greater than 2 times the tolerance, and greater than 3 times the settolerance. The next row lists the column headers. The residue number and residue type are taken from thepdb file or sequence file. The next columns are the peak number and assignment number (if found in the“ .cs.” file). These columns are followed by the chemical shifts atom types that are identified in the .par file.
Shown below is an example of the body of this html frame. In this example the CA matching tolerance wasset to 0.04, therefore the CA shifts between residue 21 and 22 are highlighted in the medium yellow shadeindicating that the difference in the shifts between 2-3 times the chemical shift tolerance.
Residue numbers and residue type names that are shown in bold face type indicate that this assignment isconsistent with the highest 50 scores solutions for the last annealing step. Entries that are not bold face typeindicated that the peak assignment for this residue changed over the 50 highest scores. The bold type residueis an indication of a “ ” possible” correct assignment. One must further verify the goodness of this assignmentby evaluating the goodness of chemical shift matching, NOE matching, residue type prediction, and specificlabeled sample matching, As well as the consistency of this assignment over the course of several Monteruns. (Note: the inclusion of an assignment in the 50 highest scored solutions is dependent upon the amountand quality of the data input, relative scaling factory and annealing schedule used. Care should be takenwhen analyzing these results)
Following the chemical shift is a number in brackets “ <>” this number indicated the number of NOE shiftsthat were input for that spin system. The following numbers residue numbers that are predicted to haveNOE’ s based on the pdb file and the distance cut-off value. A number in bold face type indicates that thepredicted NOE is satisfied by an NOE chemical shift that was provided.
The peak number in the top frame is a hyper link that will change the data displayed in the lower frame.
The lower fame indicated the residue type probabilities calculated by Monte for the (i) and (i-1) residues forthat spin system. The greatest value is indicated in bold face type. In the example here, one can see thatpeak# 2.0 has an 86% probability of being a glycine based upon the N, and CA shifts (note than no CO shiftis input for this residue type). This window also reveals that the inter residue CA and CO shifts alone do notdefine the residue type of the preceding residue of this spin system very well.
This information is helpful to determine if a chemical shift offset should be added/or subtracted to the inputshifts in calculating residue type information (see Parameter File section).
20
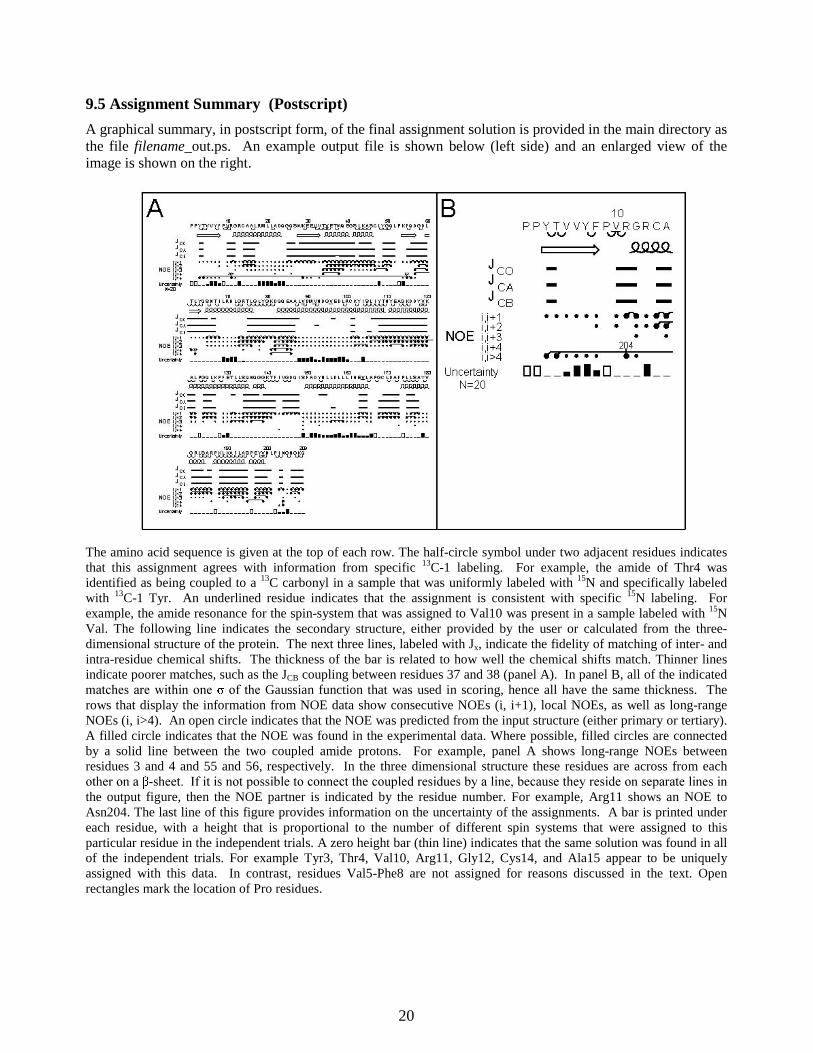
9.5 Assignment Summary (Postscript)
A graphical summary, in postscript form, of the final assignment solution is provided in the main directory asthe file filename_out.ps. An example output file is shown below (left side) and an enlarged view of theimage is shown on the right.
The amino acid sequence is given at the top of each row. The half-circle symbol under two adjacent residues indicatesthat this assignment agrees with information from specific 13C-1 labeling. For example, the amide of Thr4 wasidentified as being coupled to a 13C carbonyl in a sample that was uniformly labeled with 15N and specifically labeledwith 13C-1 Tyr. An underlined residue indicates that the assignment is consistent with specific 15N labeling. Forexample, the amide resonance for the spin-system that was assigned to Val10 was present in a sample labeled with 15NVal. The following line indicates the secondary structure, either provided by the user or calculated from the three-dimensional structure of the protein. The next three lines, labeled with Jx, indicate the fidelity of matching of inter- andintra-residue chemical shifts. The thickness of the bar is related to how well the chemical shifts match. Thinner linesindicate poorer matches, such as the JCB coupling between residues 37 and 38 (panel A). In panel B, all of the indicatedPDWFKHV�DUH�ZLWKLQ�RQH� �RI� WKH�Gaussian function that was used in scoring, hence all have the same thickness. Therows that display the information from NOE data show consecutive NOEs (i, i+1), local NOEs, as well as long-rangeNOEs (i, i>4). An open circle indicates that the NOE was predicted from the input structure (either primary or tertiary).A filled circle indicates that the NOE was found in the experimental data. Where possible, filled circles are connectedby a solid line between the two coupled amide protons. For example, panel A shows long-range NOEs betweenresidues 3 and 4 and 55 and 56, respectively. In the three dimensional structure these residues are across from eachRWKHU�RQ�D� �VKHHW���,I�LW�LV�QRW�SRVVLEOH�WR�FRQQHFW�WKH�FRXSOHG�UHVLGXHV�E\�D�OLQH��EHFDXVH�WKH\�UHVLGH�RQ�VHSDUDWH�OLQHV�LQthe output figure, then the NOE partner is indicated by the residue number. For example, Arg11 shows an NOE toAsn204. The last line of this figure provides information on the uncertainty of the assignments. A bar is printed undereach residue, with a height that is proportional to the number of different spin systems that were assigned to thisparticular residue in the independent trials. A zero height bar (thin line) indicates that the same solution was found in allof the independent trials. For example Tyr3, Thr4, Val10, Arg11, Gly12, Cys14, and Ala15 appear to be uniquelyassigned with this data. In contrast, residues Val5-Phe8 are not assigned for reasons discussed in the text. Openrectangles mark the location of Pro residues.

21
9.6 Correlation Plot
Additional detail on the existence of alternativeassignments is presented in a correlation plot. This is apostscript file that is found in the ’solutions directory.
Figure Legend: The x-axis indicates the residue number andthe y-axis indicates to what other residues, besides that foundin the best solution, the spin system was assigned to. Forexample, the circled point in the plot indicates that the spinsystem that was most frequently assigned to residue 88 is alsoassigned to 179 in one or more of the 20 solutions. Theintensity of the plotted point is proportional to the frequencythat a spin-system is assigned to a particular residue. Themore darkly colored the point, the higher the frequency of theassignment of a single spin-system to a particular residue. Forexample, the dark diagonal in this plot shows that most spin-systems are uniquely assigned to a single-residue. Therectangular area below the lower horizontal line represents thecache area. Points found in this region indicate that spin-system was placed in the cache (i.e., unassigned) in some orall of the assignment solutions.
10. Customizing and Running Monte.10.1 Customizing.
If you desire to use the buttons to launch thebrowser and postscript viewers for viewing the output files then it is necessary to tell Monte whatthe names of the applications are. This is done by editing two lines at the beginning of the tcl/tkscript, fm.tcl:
• set browser netscape• set psviewer xpsview
You should replace "netscape" and "xpsview" with the names of the browser and postcript vieweron your system.
10.2 Running Monte
1. The most important thing to remember is to save the parameter file before starting a run, Montealways reads the parameter file, it does not directly obtain the information from the tcl/tkwindow.
2. The initial annealing temperature should be high enough so that most proposed swaps are accepted.
3. The final annealing temperature should be low enough so that the score has stabilized.
4. The annealing schedule should be slow enough to maintain equilibrium. Try doubling the number ofattempted swaps (swap_lim) at each stage of annealing, and check whether the final score improves.
5. Inspect the html output. If all the chemical shift matches are within tolerance (i.e. no yellow, orange orred blocks), you can afford to tighten the tolerances for chemical shift matching.
6. View the correlation plot (corr.ps). If long stretches of connected chemical shifts are swapped betweendifferent residues, you may want to increase the scaling factors for residue type RT(i), RT(i-1), andspecific labeling (nsl and csl).