TM 820 136 Moskowitz, Joel M.; And Others The Effects of a ... · The research design and training...
41
DOCUMENT RESUME ED 212 679 TM 820 136 AUTHOR Moskowitz, Joel M.; And Others TITLE The Effects of a Classroom Management Teacher Training Primary Prevention Program on Fifth-Grade Students. INSTITUTION Pacific Inst. for Research and Evaluation, Napa, Calif. SPONS AGENCY National Inst. on Drug Abuse (DHHS /PHS), Rockville, Md. PUB DATE Jul 81 NOTE 42p.; For related documents, see TM 820 137-138 EDRS PRICE MF01/PCO2 Plus Postage. DESCRIPTORS Classroom Environment; *Classroom Techniques; *Drug Abuse; *Elementary School Teachers; Grade 5; *Inservice Teacher Education; Intermediate Grades; Intervention; *Prevention; *Program Evaluation; Student Teacher Relationship IDENTIFIERS *Effective Classroom Management (Elementary) ABSTRACT Effective Classroom Management II-Elementary (ECM), an in-service teacher training course, was evaluated. Grade 5 teachers were taught techniques in communication, classroom management, and self-esteem enhancement. The goals were to make classroom environments more responsive to students' affective and cognitive needs, thereby fostering positive attitudes, behaviors, and norms regarding self, peers, and school. These changes were expected to reduce, in subsequent years, student acceptance and use of psychoactive substances. Process data included (1) teacher feedback on each training session, (2) surveys of teachers at the end of training and at the end of the school year, and (3) observations of classroom implementation. Pre- and posttests were administered to students and teachers, student achievement and attendance data were gathered, and teachers rated students' classroom behavior. Analyses of covariance revealed no predicted treatment effects on teacher outcomes. Analyses of covariance conducted on the class-level student data did not reveal a coherent pattern of treatment effects for comparisons of all control classes with all experimental classes, or with those experimental classes whose teachers completed ECM. For female students no significant effects were found; for males, significant positive treatment effects were found on reading achievement, perceived costs of alcohol use, and perceived costs of marijuana use. These latter effects were attributed to school differences or Type I error. The lack of treatment effects was discussed in terms of possible problems with treatment implementation. (Author/GK) ********************************************************************** * Reproductions supplied by EDRS are the best that can be made * * from the original document. * ***********************************************************************
Transcript of TM 820 136 Moskowitz, Joel M.; And Others The Effects of a ... · The research design and training...

DOCUMENT RESUME
ED 212 679 TM 820 136
AUTHOR Moskowitz, Joel M.; And OthersTITLE The Effects of a Classroom Management Teacher
Training Primary Prevention Program on Fifth-GradeStudents.
INSTITUTION Pacific Inst. for Research and Evaluation, Napa,Calif.
SPONS AGENCY National Inst. on Drug Abuse (DHHS /PHS), Rockville,Md.
PUB DATE Jul 81NOTE 42p.; For related documents, see TM 820 137-138
EDRS PRICE MF01/PCO2 Plus Postage.DESCRIPTORS Classroom Environment; *Classroom Techniques; *Drug
Abuse; *Elementary School Teachers; Grade 5;*Inservice Teacher Education; Intermediate Grades;Intervention; *Prevention; *Program Evaluation;Student Teacher Relationship
IDENTIFIERS *Effective Classroom Management (Elementary)
ABSTRACTEffective Classroom Management II-Elementary (ECM),
an in-service teacher training course, was evaluated. Grade 5teachers were taught techniques in communication, classroommanagement, and self-esteem enhancement. The goals were to makeclassroom environments more responsive to students' affective andcognitive needs, thereby fostering positive attitudes, behaviors, andnorms regarding self, peers, and school. These changes were expectedto reduce, in subsequent years, student acceptance and use ofpsychoactive substances. Process data included (1) teacher feedbackon each training session, (2) surveys of teachers at the end oftraining and at the end of the school year, and (3) observations ofclassroom implementation. Pre- and posttests were administered tostudents and teachers, student achievement and attendance data weregathered, and teachers rated students' classroom behavior. Analysesof covariance revealed no predicted treatment effects on teacheroutcomes. Analyses of covariance conducted on the class-level studentdata did not reveal a coherent pattern of treatment effects forcomparisons of all control classes with all experimental classes, orwith those experimental classes whose teachers completed ECM. Forfemale students no significant effects were found; for males,significant positive treatment effects were found on readingachievement, perceived costs of alcohol use, and perceived costs ofmarijuana use. These latter effects were attributed to schooldifferences or Type I error. The lack of treatment effects wasdiscussed in terms of possible problems with treatmentimplementation. (Author/GK)
*********************************************************************** Reproductions supplied by EDRS are the best that can be made ** from the original document. *
***********************************************************************

THE EFFECTS OF A CLASSROOM MANAGEMENT
TEACHER TRAINING PRIMARY PREVENTION PROGRAM
ON FIFTHGRADE STUDENTS
SUBMITTED TO
NATIONAL INSTITUTE ON DRUG ABUSE
PREVENTION BRANCH
The Napa ProjectPacific Institute for Research
and Evaluation905 Jefferson StreetNapa, California 94558
JULY, 1983.
U.S. DEPARTMENT OF EDUCATIONNATIONAL INSTITUTE OF EDUCATION
EDUCATIONAL RESOURCES INFORMATION
CENTER IERICIS This document has been reproduced as
received from the person or nrgandanononspnatinp d
Mex$ chances have been made to unprovereproduction (rimy
Pants of view or opnvons stated el this doCumolt do not neCeSSanly represent °thew POE
posrnon or poky
"PERMISSION TO REPRODUCE THISMATERIAL HAS BEEN GRANTED BY
J . /4 . ititY:i' ci. d. -, ")
TO THE EDUCATIONAL RESOURCESINFORMATION CENTER (ERIC)."
Joel M. Moskowitz, Ph.D.
Janet H. Malvin, Ph.D.
Gary A. Schaeffer, Ph.D. Cand.
Eric Schaps, Ph.D
John W. Condon, Ph.D

4
ABSTRACT
Effective Classroom Management II-Elementary (ECM), an in-serviceteacher training course, was evaluated. In this course, 5th grade teacherswere taught techniques in communication, classroom management, and self-esteemenhancement. The goals of the course were to make classroom environments moreresponsive to students' affective and cognitive needs, thereby fosteringpositive attitudes, behaviors, and norms regarding self, peers, and school.These changes were expected to reduce, in subsequent years, student acceptanceand use of psychoactive substances.
Schools were paired on the basis of student characteristics, and oneschool from each pair was randomly assigned to either the experimental or controlcondition. The experimental group consisted of 11 classes, but only seven ofthese classes had teachers who received the training. There were 11 controlclasses with teachers who received no training.
The ECM in-service training consisted of ten two-hour sessions heldweekly after school hours. Also, the trainer visited each teacher's classroomon at least four occasions to observe and guide implementation of the ECMtechniques.
Process data included a) teacher feedback on each training session, b)surveys of teachers at the end of training and at the end of the school year,and c) observations of classroom implementation. The training was highly re-garded by the teachers, the teachers used the skills competently, and theyfound almost all of the techniques quite useful. The teachers varied consider-ably in how often they used the techniques.
Pre- and posttests were administered to students and teachers in thestudy. Student achievement and attendance data were gathered from schooldistrict records. Teachers also rated their students' classroom behavior.
Analyses of covariance revealed no predicted treatment effects onteacher outcomes.
Analyses of covariance conducted on the class-level student data didnot reveal a coherent pattern of treatment effects for comparisons of allcontrol classes with a) all experimental classes or b) those experimentalclasses whose teachers completed ECM. For female students no significanteffects were found. For male students significant positive treatment effectswere found on reading achievement, perceived costs of alcohol use, and per-ceived costs of marijuana use. These latter effects were considered spuriousand attributed to school differences or Type I error. The lack of treatmenteffects was discussed in terms of possible problems with treatment implementa-tion.
3

INTRODUCTION
Effective Classroom Management II1-Elementary (henceforth called ECM)
is an in-service teacher training course. It focuses on affective teaching
techniques typical of courses currently provided by primary prevention pro-
grams. In the ECM course, teachers are taught techniques in communication,
classroom management, and self-esteem enhancement. They are also assisted in
applying the skills while teaching the regular academic curriculum. The
general goals of the course are to make classroom environments more responsive
to students' affective and cognitive needs. The course is designed to foster
positive student attitudes, behaviors, and norms regarding self, peers, and
school; and to reduce in subsequent years students' acceptance and use of
psychoactive substances.
An earlier version of the ECM course was taught and evaluated in the
year prior to this study (Schaps, Moskowitz, Condon, and Malvin, Note 1).
Only small, nonsignificant effects of the treatment on teachers and students
were found. However, the analyses may not have adjusted adequately for
initial differences that existed between the experimental and control students
and teachers. Furthermore, the process evaluation revealed poor implementa-
tion of a major component of the curriculum, problem solving skills.
1The "II" refers to the second version of the course.
2.
The research design and training curriculum of the present study benefited
in two ways from knowledge obtained in the earlier Study. The present study
employed a larger number of schools (13 vs. 8) with fewer teachers per school
included in the study. Also, the present curriculum substituted classroom
management skills for problem solving skills.
The revised ECM training curriculum was eclectic. It included techniques
developed by Thomas Gordon (reflecting feelings and content; 1-messages), Louis
Raths (clarifying responses), Jack Canfield (self-esteem enhancement activities),
Rudolph Dreikurs and William Glasser (classroom management techniques). The
curriculum did not directly address substance use, except for one presentation
on the links between substance abuse and attitudes (e.g., low self-esteem,
negative attitudes toward school) and behaviors (e.g., poor academic performance,
high absenteeism). The curriculum offered no information about psychoactive
substances and gave no advice on how to handle substance abuse problems per se.
Detailed documentation of the course curriculum is available (Adams & Slimmon,
Note 2).
Many primary prevention programs have been offering affective teacher train-
ing courses similar to ECM. There have been state-wide programs in Michigan
(Michigan Department of Education, Note 3), Georgia (Georgia Department of
Human Resources, Note 4), and Pennsylvania (R3ndt, Hammond, Wisdo, & Mitzel,
Note 5). Affective teacher training programs have been shown to be effective
at improving peer relationships, classroom discipline, attitudes toward school,
and academic achievement (Baskin and Hess, 1980). A recent review of prevention
program evaluations suggested that training "significant others" (e.g., parents,
teachers) in affective skills may be an effective approach to prevention (Schaps,
DiBartolo, Moskowitz, Palley & Churgin, 1981).
5

3.
In the present study, ECM was provided to eight 5th grade teachers in five
elementary schools during the 1979-80 school year. The teachers applied skills
in their classrooms under the guidance of the in-service trainers. The teachers,
then, were the critical links in the delivery of the intervention; the adequacy
of the treatment depended upon teachers' use of the skills. Consequently,
teachers' reactions to the training and their use of the ECM skills were closely
monitored.
The impact of ECM on both the teachers and their students was assessed.
Three teacher outcome variables were measured: the importance of, and effective-
ness at, achieving the objectives of the ECM training; satisfaction with teach-
ing; and perceived faculty cohesiveness. We hypothesized that ECM would impact
all three of these outcome variables.
Student outcome measures were locus of control, social self-esteem, academic
self-esteem, attitudes toward peers, perceived classroom climate, attitudes
toward school, perceived peer attitudes toward school, total absences, unexcused
absences, reading achievement, math achievement, and teacher ratings of student
behavior in school. Drug-specific outcome measures were perceived positive and
negative consequences of tobacco, alcohol, and marijuana use; and involvement
in use of each of these substances. Among these variables, we hypothesized
that ECM would be most likely to impact perceived classroom climate, attitudes
toward school, social self-esteem, and behavior ratings because the in-service
skills bear most directly on these variables. We also anticipated that ECM
would impact other variables less directly. Among these other variables, we
expected that the drug-specific measures would be least likely to show an effect,
due to the low level of drug involvement at these ages and the limited duration
of the intervention. The present study will be continued for an additional yer.
U

4.
OUTCOME METHOD
Assignment of Schools to Condition
Thirteen elementary schools (grades K-6) from a predominantly white,
middle-class, suburban public school system in Northern California were paired
based upon characteristics of their students. One school from each pair was
assigned randomly to the experimental condition and the other to the control
condition.2 Table 1 shows the school means and standard deviations of the
measures employed in matching the schools for each condition. The measures for
each school were a) total student enrollment prior to the study; b) the per-
centage of students from families receiving Aid for Families with Dependent Chil-
dren (AFDC); c) the percentage of students classified as Spanish-speaking with
either limited or no English language skills; d) the average number of unexcused
absences per student during the school year; and e) an estimate of the student
body's socioeconomic status (made by a school district official).
Subjects
All Grade 5 and combined grade 5-6 students and their 12 teachers in the
six experimental schools constituted the experimental group.3 Eight
2Since an odd number of schools existed, one triplet was formed fromwhich one school was randomly assigned to the experimental condition andthe other two to the control condition.
3Two experimental and three control combined grade 4-5 classes werenot included in the study because they were part of another study.

5.
of the teachers from five experimental schools completed the ECM in-service
training.4 One male and seven female teachers completed the training; the
four nonparticipating teachers were males. The control group consisted of all
grade 5 students and combined grade 5-6 students and their 11 teachers (seven
females and four males) in the seven control schools. Both the experimental and
control conditions contained 11 classrooms; seven grade 5 classes and four grade
5-6 classes.
Initially, there were 266 experimental students and 270 control students.
However, 46 experimental students and 49 control students were excluded due to
attrition or parental objections to their participation in the research. The
experimental group consisted of 82 males and 138 females,5 and the control
group consisted'of 115 males and 106 females. The ethnic composition was 90%
(N = 396) White and 10% (N = 45) minority with Mexican-American 5% (N = 22)
comprising the largest minority group.
In-Service Training Program
The ECM in-service program consisted of ten, two-hour sessions held weekly
after school. There were also two "reunion" sessions between November 1979 and
February 1980. The teachers were paid $200 for attending the voluntary sessions
and trying to apply the in-service skills in their classrooms. They also were
offered graduate-level credit from a local university for completing the training.
4Two of the participat. 1g teachers taught half-time in the same class;thus, seven classes had parocipating teachers.
529 males and 47 females were enrolled in classrooms with nonparticipatingexperimental teachers.
8

TABLE 1
EQUIVALENCE OF EXPERIMENTAL AND CONTROL SCHOOLS
Experimental Schools (N=6) Control Schools (N=7)
MeanStandardDeviation
Total School Enrollment 340 130
Percent of Enrollment Receiving AFDC 13.0 8.0
Percent of Spanish-Speaking 2.3 3.2
Average Number of UnexcusedAbsences per Pupil 2.0 0.3
Socioeconomic Status Rating 46.7 34.2
9
Mean
StandardDeviation
294 49
11.6 10.4
1.5 3.1
1.8 0.9
47.1 30.1

7.
A trainer observed the teachers in their classrooms at least four times.
These visits began during the training and continued until May 1980. After
each visit, the trainer met briefly with the teacher to provide feedback
on classroom behaviors.
Both trainers had experience conducting in-service programs for teachers.
They also had experience as classroom teachers and as school administrators,
and had taught many of the ECM skills in previous trainingprograms.
Most of the training sessions followed a standard format. First, a
self-concept t 4iancement technique or activity was introduced. Then the
skills learned in prior sessions were reviewed at length, along with the
teachers' experiences using the skills during the previous week. Fir.ally,
a new skill was introduced and practiced.
Four communication techniques were taught during the first five training
sessions:
I-Messages--a technique for effectively communicating theimpact of another's behavior upon oneself;
Clarifying Responses--brief questions and comments by whicha listener can prompt further thinking by a speaker;
Reflecting Feelings--techniques that enable a listener toindicate acceptance and accurate understanding of the speaker's
feelings; and
Reflecting Content--techniques that enable a listener to showinterest and to indicate understanding of the speaker's message.
In the next three sessions, teachers were taught a sequence of class-
room management skills for minimizing and handling discipline problems.
Techniques were taught for effectively communicating expectations and
establishing classroom rules. In addition, skills were taught for managing
discipline problems and for rewarding desired behaviors. These skills
10

1
8.
included systematic positive reinforcement of appropriate student behavior:
Positive Verbal Feedback (e.g., praise);
Positive Nonverbal Cues (e.g., smile, nod); and
Tangible Reinforcers (e.g., token system);
and systematic discipline of inappropriate behavior:
Negative Verbal Feedback (e.g., request for behavioral change);
Negative Nonverbal Cues (e.g., eye contact, touch); and
Time-out (e.g., isolation).
Activities to enhance student self-concept were introduced at nine of the
sessions and were the major component of the last two sessions. Classr om
activities were taught that facilitate classroom discussion of students' ex-
periences, talents, and achievements, and that elicit positive feedback from
peers. Another approach to self-concept improvement included modifying the
regular curriculum to help students organize their work, assist each other,
and gain recognition for their efforts.
Student self-report outcome data. Student data at pretest were obtained
with an instrument developed for this study called the Student Questionnaire.
This instrument consists of two parts. Part 1 contains 18 items selected from
the Intellectual Achievement Responsibility Questionnaire (Crandall, Katkovsky,
& Crandall, 1965). Selection of items was based upon published psychometric
properties. Four items referring to "parents" were adapted to read "an adult who
knows you" in order to concorm to California Education Code.6 This questionnaire
6California Education Code requires that active parental permission besecured before requesting information about family life, This study employed
passive consent procedures.

9.
measures the belief in one's own control over, and responsibility for, intellectual-
academic successes and failures. Part 2 contains three set of items: a) the
Scholastic subscale from the Intermediate Level of the Self Appraisal Inven-
tory (20 items) (Instructional Objectives Exchange, Note 6), a criterion-
referenced measure of academic self-esteem; b) the Authority and Control (12
items) and Interpersonal Relationships With Pupils (12 items) subscales from
the Intermediate-Level of the School Sentiient Inde_ (Instructional Objectives
Exchange, Note 7), a criterion-referenced measure of attitudes toward school;
and c) a measure of perceived peer attitudes toward school developed for this
study by adapting 11 items from eight instruments that measure attitudes toward
school.
Student pretest data were also obtained with the Self Observation Scales
(Intermediate Level, Form C) developed by Stenner and Katzenmeyer (Note 8).
This instrument measures the ways children perceive their social and academic
selves and their relationship to peers, teachers, and ,chool. Students respond
"yes" or "no" to 60 statements.
Drug-related protest data were collected using the My Opinion Survey.
This instrument was developed for this study to assess student opinions of
each of the three ''gateway" drugs, alcohol, cigarettes, and marijuana. Speci-
fically, students were asked about perceived positive and negative consequences
from use of the drug, their lifetime use, their current use ("last four weeks"),
their attitudes toward use, their perceptions of peers' attitudes toward use
("most kids in my class"), al their perceptions of peer use.

10.
The pretest measures used in the data analysis were derived from empirical
scaling.? Pretest data were collected from a large sample of students in
grades 3-6. Samples were selected from each grade level. Item means,
variances, and intercorrelations were found to be similar across grade levels;
thus, scaling procedures were applied across grades. Item intercorrelations
from the pretest data were subjected to separate multiple group confirmatory
factor analyses.8 The resultant pretest scales appear in Table 2 with the
number of items contained in each, and their internal consistency reliabili-
ties estimated by coefficient alpha. The final scales included measures of
affective teaching climate, attitudes toward school, social self-esteem,
attitudes toward peers, locus of control for succuss, locus of control for
failure, academic self-esteem, perceived peer attitudes toward school, per-
ceived costs of and involvement in alcohol, cigarette, and marijuana use.
The involvement scales were comprised of items measurino own use and attiL
tudes, and perceived use and attitudes.9
Posttest data were obtained with revised versions of the Student Quesion-
naire and the My Opinion Survey. The revised instruments included the items in
the final pretest measures. In addition, the locus of control for succuss
scale contained five extra items and the failure scale contained three extra
items from the original instrument.
?The details of the scaling have been reported by Moskowitz, Condon,Brewer, Schaps & Malvin, Note 9.
8The matrices were computed using pairwise deletion of missing valuesand communalities were inserted into their diagonal elements.
9For each substance, the five component items exhibited good internaland external consistency, providing support for a single unidimensional con-struct. The positive relationships between the perceived peer measures andthe own use and attitude measures indicate that students' own use and atti-tudes parallel their peers', or that they project their own use and attitudesonto their peers.
..
13

11.
TABLE 2
STUDENT SCALES, NUMBER OF ITEMS AND PRETESTINTERNAL CONSISTENCY RELIABILITIES (COEFFICIENT ALPHA)
Subscale N
Number ofItems
PretestReliability
Affective Teaching Climate(Affec Climate) 513 17 .91
Attitudes Toward School(Att School) 513 6 .74
Social Self-Esteem(Social Self) 513 6 .66
Attitudes Toward Peers(Att Peers) 513 8 .80
Locus of Control: Success(Control Sue) 513 7 .56
Locus of Control: Failure(Control Fail) 513 7 .62
Academic Self-Esteem(Acad Self) 513 11 .79
Perceived Peer AttitudesToward School
(Peer Att Sch) 513 8 .72
Perceived Costs of Alcohol Use(Alc Costs) 3R6 5 .70
Perceived Costs of Cigarette Use(Cig Costs) 386 5 .63
Perceived Costs of Marijuana Use(Pot Costs) 386 5 .67
Involvement in Alcohol Use(Alc Involve) 386 5 .77
Involvement in Cigarette Use(Cig Involve) 386 5 .75
Involvement in Marijuana Use(Pot Involve) 386 5 .84
14

12.
Student archival outcome data. In addition to the student self-report data,
we used achievement data collected by the school district. These data included
the total reading (Read) and total mathematics (Math) stanine scores from the
Stanford Lchievement Test, Intermediate Levels I and II (Madden, Gardner, Rudman,
Karisen, Merwin, Note 10), administered in May 1979, and in May 1980, respec-
tively.
Student attendance was measured in two ways. The total number of unex-
cused absences for the second semester (Unex Abs) was obtained for each student
from the school district's records. This type of absence occurred when a stu-
dent was absent from school and did not provide the school with a parental
excuse stating that the student was sick. In addition, the average monthly
number of absences for each student (Total Abs) during the fifth through eighth
school months (January through April) was extracted from teachers' records by
project staff. Both measures were obtained for Spring 1979 and Spring 1980.
Students' sex and ethnicity were determined from school district records.
Teacher data on student behavior. Teacher ratings of student misbehavior
were obtained at pretest and posttest with the Student Behavior Report.1°
Using the class roster, each teacher indicated how frequently each child had
been a minor (Minor) and major (Major) discipline problem during the previous
four months (January through April). A five-point scale was used that ranged
from "never" to "about once a day or more."
To determine whether experimental and control teachers used the "minor"
and "major" categories in the same manner, teachers rated 17 hypothetical
student behaviors as either a) not a discipline problem, b) a minor problem
10The teachers who provided the pretest data were the students'teachers in the prior year and not the teachers in the study.
t)

13.
or c) a major problem. The pretest data were invalid because most teachers
did not follow the instructions; hence, instructions for the posttest were
revised. Analysis of the posttest data indicated that experimental and con-
trol teachers employed similar definitions of minor and major discipline
problems.
Teacher outcome data. The teacher's pretest and posttest self-report
data were obtained with the Teacher Questionnaire which was developed for this
study. This instrument measured a) teacher satisfaction, adapted from the
Purdue Teacher Morale Inventory (Rempel and Bentley, 1964); b) faculty co-
hesiveness, adapted from the Teacher Cooperation Subscale of the Teacher Atti-
tude and Classroom Climate Questionnaire (Kaufman, Semmel & Agard, Note 11)
and from the Intimacy Subscale of the Organization Climate Description Question-
naire (Halpin and Croft, 1963); and c) the importance and effectiveness of
achieving teaching objectives related to ECM, a measure developed for this
study. Table 3 shows the number of items included in these scales and the pre-
test internal consistency reliabilities estimated by coefficient alpha for grade
3-6 teachers.11
Data Collection Procedures
Student survey. The student pretest was administered in May 1979 and the
posttest in May 1980 by six substitute teachers. The Student Questionnaire and
My Opinion Survey were administered at both times during two sessions in the
students' classrooms. In adu 'ion, the Self Observation Scales were administered
at the pretest during the first session. The students read the items to them-
selves (assisted by the administrator as necessary) except for the first
11To increase the sample size, additional teachers were included in thescaling analysis.
16

14.
TABLE 3
TEACHER SCALES, NUMBER OF ITEMS, AND PRETESTINTERNAL CONSISTENCY RELIABILITIES (COEFFICIENT ALPHA) (N=60)
Number of Pretest
Scale Items Reliability
ECM Objectives 6 .76
Teacher Satisfaction 8 .80
Faculty Cohesiveness 7 .90

15.
administration of the My Opinion Survey which was read to the students. One
make up session was held for students who were absent from the original
sessions.
In a prepared statement, administrators assured students of complete con-
fidentiality. The confidentiality of the My Opinion Survey administration was
enhanced by prelabeling questionnaires with student names on the cover sheet and
students' school district identification numbers on page one. After receiving
the questionnaire, students were instructed to tear off the cover page which
displayed their names. Students were told of the need for identification
numbers as a way of tracking students over time.
Teacher survey. Teachers completed the pretest teacher questionnaire at
their school in September 1979. Teachers completed the posttest questionnaires
in their classrooms while their students were being surveyed. To ensure the
privacy of their responses, teachers were provided with questionnaires con-
taining unique identifiers.
Data Analysis
\Student data were analyzed in two ways.12 The first approach examined
differences between experimentals and controls. This approach grouped together
all experimental students regardless of whether their teacher participated in
the ECM training (35% of experimental students had teachers who did not parti-
cipate). The analysis provides a conservative estimate of treatment effects
because it assumes that all experimental students were treated. The advan-
tages of this approach are a) that it preserves the experimental design,
12A third approach, based on process data, attempted to relate a compositemeasure of treatment implementation to classroom mean student outcomes. Thisanalysis was conducted only on participating teacher/classroom data and had toofew cases to produce stable estimates. The pattern of results was not illumi-nating and has not been reported here.

16.
allowing stronger inferences to be made from the data, and b) that the ob-
tained results may be generalizable to a wider range of situations.
The second approach compared only the students of teachers who partici-
pated in the training with all control students. A problem with this approach
is that observed effects may be due to selection and not the treatment. That
is, participating teachers (and their students) are likely to be different
from controls simply because they constitute a special group--teachers who
chose to undertake and complete the training.
Least squares techniques assume that the units of analysis are statis-
tically independent. The research design involved random assignment of schools
to the experimental and control conditions. Within each school there was inter-
dependence among classes as well as interdependence among the students within
each class. Because the treatment was delivered by teachers to their classes,
interdependence among students within classes was probably substantial; inter-
dependence among classes within schools probably was not. Hence, we decided
to aggregate the student data to the class-level and analyse the class-level
data.
Classroom means were computed for pretest and posttest student measures
separately for each sex. This approach allows control for, and examination of,
relationship between student sex and treatment effects. Separate analyses were
then conducted for males and females at each grade level to avoid problems
with heterogeneity of variance and covariance.
Univariate analyses of variance and covariance were the primary analysis
straegies. While multivariate analysis controls better for Type I error, it
has several problems. Multivariate analysis generally has less statistical
19

17.
power than univariate analysis when sample sizes are small. The effect of
violations of the homogeneity of covariance assumption, which frequently
occur, is not well understood. In addition, the selection of covariates in
the multivariate analysis of covariance is constrained by the parallelism
assumption; i.e., that the regression hyperplanes be parallel.
In the present study we have set the Type I error rate for each analysis
at .05. If we require power (the likelihood of detecting a real effect) to
be .80,<OVA can detect an effect size as small as 1.2 SD.13 With a pretest-
posttest correlation of .45 (the median r), ANCOVA can detect an effect size
as small as 1.0 SD. Since we conducted many analyses, isolated effects must
be interpreted cautiously because they may be due to experiment-wise Type I
error. Interpretation of results is based on patterns in the data rather than
single findings.
Rules were set for handling missing data in computing scale scores. A
scale score was computed for a student if at least 60% of the items comprising
that scale were present. Any missing item score was replaced by the mean for
that item in the appropriate cell of the experimental design. This procedure
utilized most of the item data and provided unbiased cell means. When more
than 40% of the items comprising a scale were missing, the student received
a missing value for that scale, and the case was not utilized in computing
the class mean for that scale.
13SD refers to the pooled-within group posttest standard deviation.Although the minimum effect sizes seem large, the standard deviation ofclass means is considerably smaller than the standard deviation of studentscores. Therefore, the unstandardized effect sizes are c- mparable at bothlevels of analyses.

18.
PROCESS EVALUATION METHODS AND RESULTS
Teacher Attendance at Training Sessions
Nine of the 12 experimental teachers signed up for the in-service
training. Of these teachers, eight attended at least nine of the ten
sessions, and thereby earned 5200 stipends. These teachers also attended two
"reunion" sessions.
Teacher Feedback on the Individual Training Sessions
At the end of each training session (except the final session), teachers
were asked to complete a one-page "feedback form" anonymously. This form
solicited ratings of, and comments about, t)e session. On the form, teachers
rated each session in terms of interest, organization, usefulness, and enjoy-
ableness, using five-point rating scales with higher numbers signifying more
positive ratings.
Teachers rated all sessions favorably. Of the 36 separate ratings (four
per session), 30 averaged above 4.5, and none averaged less than 4.1. The
teachers frequently wrote compliments and rarely had critical comments.
Questionnaire Surveys of Participating Teachers
At the completion of training (February 1980), and again near the end
of the school year (May 1980), participating teachers in the experimental
group completed questionnaires about tneir use of the ECM skills in their
classrooms. Teachers reported how often they used each in-service skill,
rated the usefulness of each skill, and rated their own mastery of each skill.
2i

19.
Table 4 summarizes the year-end data. The fist four skills listed in Table
4 are the communication skills; the second six are classroom management skills;
the last "skill"--self-concept enhancing activities--is a series of classroom
exercises used apart from the teaching of the regular curriculum.
At the year-end, nearly all of the teachers reported using each of the
four communication skills at least several times per week. On a daily basis,
I-messages were most widely used and reflecting feelings and content were least
used. With the exception of time-out and tangible reinforcers, most of the
teachers reported using the classroom management skills at least several times
per week. However, on a daily basis, only two of the six skills, positive
nonverbal cues and positive verbal feedback, were widely used. Almost two-
thirds of the teachers reported using self-concept enhancement activities on
a weekly basis.
With regard to the usefulness of the skills, positive nonverbal cues
and self-concept enhancement activities were considered most valuable, and
tangible reinforcers and time-out least valuable. Thus, perceptions of
utility corresponded strongly with reported use. The teachers generally
rated their own mastery of the skills as "good," seeing themselves least
adept at using time-out, I-messages and negative verbal feedback.
The mid-year questionnaire asked the teachers to evaluate the in-service
course as a whole, using five-point rating scales. The teachers' ratings
were extremely favorable with respect to interest (M = 5.00), organization
(M = 5.00), usefulness (M = 4.69), and enjoyableness (M = 4.88). The teachers
also rated the trainers highly.
22

c:(\.1
TABLE 4
TEACHERS' REPORTS ON FREQUENCY, UTILITY, AND QUALITY OF SKILL IMPLEMENTATION (N = 8)
AT THE END OF THE YEAR
Percentage of Teachers
Using the Skill at Least:Mean Ratings of Valueof the Skill (5=HighUtility; 1=Low Utility)
Mean Ratings of Masteryof Skill (4=Excellent;1=Poor)
Several TimesIn-Service Skill per Week Every Day
I-Messages 75 63 4.25 2.63
Clarifying Responses 88 38 4.38 2.88
Reflecting Feelings 88 25 4.62 2.88
Reflecting Content 88 25 4.62 3.00
Positive Verbal Feedback 100 63 4.62 3.25
Positive Nonverbal Cues 100 88 4.75 3.38
Tangible Reinforcers 50 25 3.25 3.001
Negative Verbal Feedback 63 13 3.75 2.63
Negative Nonverbal Cues 100 38 4.38 3.141
Time-Out 25 0 2.88 2.43
Self-Concept Enhancement 63 25 4.75 3.001
'One teacher who did not use this skill is not included in this mean.
23
2,1

21.
To summarize, data from the questionnaires indicate that teachers were
using most skills on a regular basis, were finding them useful, and con-
sidered themselves fairly adept at using these skills. In addition, the
teachers positively evaluated the overall training and the trainers' skills.
Trainer Observations of Classroom Im lementation
One of the trainers visited each classroom four times between December
and April to observe the teachers applying the ECM skills. These observa-
tions ranged between 20 and 60 minutes, averaging 48 minutes. After each
classroom observation, the trainer recorded a) how frequently each skill was
observed, and b) how well each skill was applied.
Combining teachers and classroom visits, the observational data indicate
that teachers used some skills much more frequently than others. Among the
communication skills, teachers used reflecting content and clarifying responses
most frequently, and I-messages and reflecting feelings least frequently.
Among the classroom management skills, teachers used positive verbal feedback
and positive nonverbal cues most often, and negative verbal feedback, time-out,
and tangible reinforcers least frequently. Self-concept enhancing activities
were observed on 26% of the classroom visits.
Ignoring frequency and considering quality, teachers applied the skills
with roughly equal competency. The trainer's average quality of implementation
ratings were in the "B" to "B+" range for most skills, varing between 3.89
and 5.00 on a five-point scale, and averaging 4.14 (SD = .31) across all skills.
The number and quality of skills used varied across teachers. One teacher
used six different skills in more than half of the observed sessions, whereas,
another used only three different skills. The range in average quality rating
2:i

(across skills and over classroom visits) was 3.79 (i.e., "B-") to 4.42 (i.e.,
"B+"). The average for all teachers was 4.06 (SD . .19).
These observational data were consistent with the teacher self-report
data described earlier regarding relative frequency of skill implementation.
The only major discrepency pertained to I-messages, where the teachers re-
ported frequent implementation and the trainer observed infrequent implementa-
tion. Because I-messages were complex behaviors, teachers probably did not
know exactly what the appropriate behaviors were. Evidence of this is that
the teachers' self-rated mastery of this skill was low.
Additional Observations of ECM Classroom Implementation
Other observations were conducted by a researcher who was not involved
in the training. The researcher also observed the frequency of teacher
implementation of ECM-related behaviors in the classroom. However, only
verbal behaviors were recorded; nonverbal behaviors and self-concept activi-
ties were not recorded.
Four of the eight teachers who completed the training were randomly
selected for observation. The data were collected at three points in time:
early in the training, near the end of training, and finally about six weeks
after training ended. Each of the four teachers was observed once at each
time point. Teacher behavior was coded for thirty minutes and then anecdotal
notes were recorded. A total of six hours of observational data were collected'`'
14Observational data collected by a second researcher have not been reported
due to problems with observer agreement. Most of the skills were complex andoccurred infrequently, making it difficult to obtain observer agreement and main-tain it over time. The data reported here are for the observer deemed mostskilled by the training and research staffs at identifying ECM behaviors. It
should be noted that the skilled observer identified fewer instances of ECM be-
haviors than the other observer because of her ability to discriminate ECM be-haviors from ordinary teacher behaviors.
2g

23.
The anecdotal reports indicated that the amount of codeable behavior was
limited by the classroom activity observed. The two primary activities ob-
served were individualized seatwork and teacher-directed drill. When the
teachers were working with students individually, dialogue was often inaudible
to the observer. When teachers were conducting drills, they generally relied
upon question and answer formats that precluded use of some skills.
Few, if any, communication skills were observed. Reflecting content and
clarifying responses were used by only one teacher. None of the teachers used
reflecting feelings or I-messages.
Negative and positive verbal feedback were used frequently by all
teachers at the last time point, although these skills were observed infre-
quently prior to that. None of the teachers used tangible reinforcers or
time-out. A counter-productive behavior, criticism, was incluied in the
observation system. One teacher used this behavior infrequently.
The researcher's data are consistent with the trainer's observations
regarding the relative frequencies of skill implementation. The only dis-
crepancy concerned negative verbal feedback, which was observed frequently
by the researcher but not by the trainer. The researcher may have used a
more general definition of this category than the trainer.

24.
OUTCOME RESULTS
Initial Equivalence--Students
Experimental and control students were tested for initial equivalence.
The means and standard deviations for all class-level pretest and posttest
measures are summarized in Table 5 for each sex and group. Due to non -
normality and heterogeneity of variance, log (x+1) transformations were per-
formed on the following variables: Major, Unex Abs, Total Abs, Cig Involve,
and Pot Involve. For the drug and attendance variables a high score is un-
desirable; whereas, for all other variables a high score is desirable. The
posttest results will be discussed later.
Analyses of variance were performed on each of the pretest measures with
condition (experimental vs. control) as the factor. For both males and fe-
males, there was little evidence of initial nonequivalence for either:the
experimental-control comparison or the participant-control comparison. A
significant main effect for condition was obtained on one of the 20 pretest
measures for males. As compared to their controls, experimental males were
initially lower on Cig Costs, F (1,20) = 5.00, p. <.05. No significant differ-
ences were obtained for females. Analyses of variance were also performed on
each of the pretest measures with participation (participant vs. control) as
the factor. As compared to controls, experimental males were initially lower
on Control Fail, F (1,16) = 11.54, p. <.01. The differences on Cig Costs was
not significant F (1,16) = 3.46, p <.10. Once again no differences were ob-
tained for females
25.
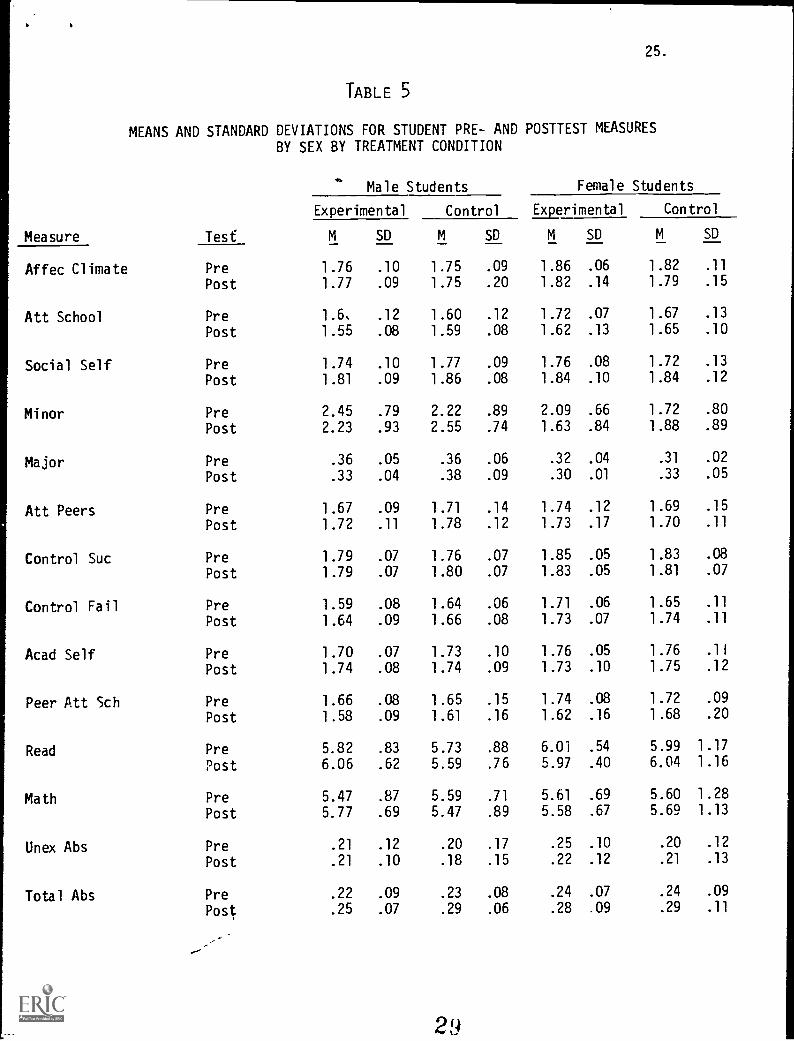
TABLE 5
MEANS AND STANDARD DEVIATIONS FOR STUDENT PRE- AND POSTTEST MEASURES
BY SEX BY TREATMENT CONDITION
Measure Test
IPMale Students Female Students
Experimental Control Experimental Control
M SD M SD M SD M SD
Affec Climate Pre 1.76 .10 1.75 .09 1.86 .06 1.82 .11
Post 1.77 .09 1.75 .20 1.82 .14 1.79 .15
Att School Pre 1.6. .12 1.60 .12 1.72 .07 1.67 .13
Post 1.55 .08 1.59 .08 1.62 .13 1.65 .10
Social Self Pre 1.74 .10 1.77 .09 1.76 .08 1.72 .13
Post 1.81 .09 1.86 .08 1.84 .10 1.84 .12
Minor Pre 2.45 .79 2.22 .89 2.09 .66 1.72 .80
Post 2.23 .93 2.55 .74 1.63 .84 1.88 .89
Major Pre .36 .05 .36 .06 .32 .04 .31 .02
Post .33 .04 .38 .09 .30 .01 .33 .05
Att Peers Pre 1.67 .09 1.71 .14 1.74 .12 1.69 .15
Post 1.72 .11 1.78 .12 1.73 .17 1.70 .11
Control Suc Pre 1.79 .07 1.76 .07 1.85 .05 1.83 .08
Post 1.79 .07 1.80 .07 1.83 .05 1.81 .07
Control Fail Pre 1.59 .08 1.64 .06 1.71 .06 1.65 .11
Post 1.64 .09 1.66 .08 1.73 .07 1.74 .11
Acad Self Pre 1.70 .07 1.73 .10 1.76 .05 1.76 .11
Post 1.74 .08 1.74 .09 1.73 .10 1.75 .12
Peer Att Sch Pre 1.66 .08 1.65 .15 1.74 .08 1.72 .09
Post 1.58 .09 1.61 .16 1.62 .16 1.68 .20
Read Pre 5.82 .83 5.73 .88 6.01 .54 5.99 1.17
Post 6.06 .62 5.59 .76 5.97 .40 6.04 1.16
Math Pre 5.47 .87 5.59 .71 5.61 .69 5.60 1.28
Post 5.77 .69 5.47 .89 5.58 .67 5.69 1.13
Unex Abs Pre .21 .12 .20 .17 .25 .10 .20 .12
Post .21 .10 .18 .15 .22 .12 .21 .13
Total Abs Pre .22 .09 .23 .08 .24 .07 .24 .09
Post .25 .07 .29 .06 .28 .09 .29 .11
..-

Table 5 (continued)
Measure Test
Male Students
26.
Female Students
Experimental Control Experimental Control
M SD M SD M SD M SD
Alc Costs Pre .55 .24 .61 .16 .50 .09 .60 .28
Post .37 .16 .67 .17 .45 .20 .38 .13
Cig Costs Pre .38 .13 .49 .11 .45 .10 .57 .21
Post .38 .14 .55 .14 .39 .16 .41 .11
Pot Costs Pre .44 .14 .46 .21 .39 .12 .49 .21
Post .36 .13 .52 .20 .37 .12 .36 .10
Alc Involve Pre 1.40 .15 1.55 .21 1.28 .17 1.39 .40
Post 1.50 .27 1.71 .24 1.40 .25 1.37 .24
Cig Involve Pre .27 .03 .28 .03 .27 .02 .27 .04
Post .31 .04 .33 .04 .30 .03 .30 .05
Pot Involve Pre .25 .03 .26 .03 .25 .02 .25 .03
Post .27 .04 .29 .04 .27 .03 .26 .04
3

27.
Floor and Ceiling Effects--Students
Statistical analysis of measures with floor or ceiling effects generally
suffers from decreased power (due to decreased reliability) and from bias.
For example, students who are at the ceiling on a pretest measure where a
high score is desirable (or at the floor on a measure where a lower score is
desirable) cannot show improvement on the identical measure at posttest. This
could bias an analysis against finding a treatment effect.
Some evidence for ceiling effects was found on the affective measures.
The percentage of students with a maximum scale score at the pretest ranged
from 14% on Control Fail to 32% on Social Self with a median value of 22%.
The corresponding percentages at the posttest ranged from 13% to 47% with a
median value of 17%. Thus, the prevalence of ceiling effects was similar on
the affective pretests and posttests.
On the drug-related measures, evidence was found for floor effects.
The percentage of students with a minimum scale score at the pretest ranged
from 13% on Alc Involve to 52% on Pot Involve with a median value of 30%.
The corresponding percentages at the posttest ranged from 9% to 41% with a
median value of 30%. Thus, for the drug-related measures, the prevalence of
floor effects was similar at pretest and posttest.
In sum, the affective measures, except for Social Self, did not suffer
from substantial ceiling effects. Although floor effects were substantial on
several of the drug-related measures, they were expected given the age of the
students. Furthermore, they do not constitute a problem for the present study
because no direct effects on these measures were hypothesized.

28.
TABLE 6
SUMMARY OF COVARIANCE ANALYSES OF CLASS DATA: EXPERIMENTAL VS. CONTROL
Posttest Males
B F(1,19)Measure
Affec Climate .17 <1
Att School .14 2.33
Social Self .56 1.89
Minor .12 <1
Att Peers .63 <1
Control Suc .28 <1
Control Fail .25 <1
Acad Self .71 <1
Peer Att Sch .65 <1
Read .67 5.29*
Math .77 3.30
Unex Abs .20 <1
Total Abs .11 1.69
Alc Costs .35 17.54**
Cig Costs .49 3.96
Pot Costs .56 5.16*
Alc Involve .84 <1
Cig Involve .75 1.50
Pot Involve .79 1.13
Females
B F(1,19)
.60 <1
.29 1.21
.59 <1
.40 1.28
.66 <1
.44 <1
.47 1.23
.95 <1
1.58 2.32
.80 <1
.81 <1
.45 <1
.66 <1
.06 <1
.19 <1
.21 <1
.21 <1
.58 <1
.45 <1
B refers to the unstandardized regression coefficient of posttest on its correspondingpretest.
* = p<.05
** = p<.001
29.
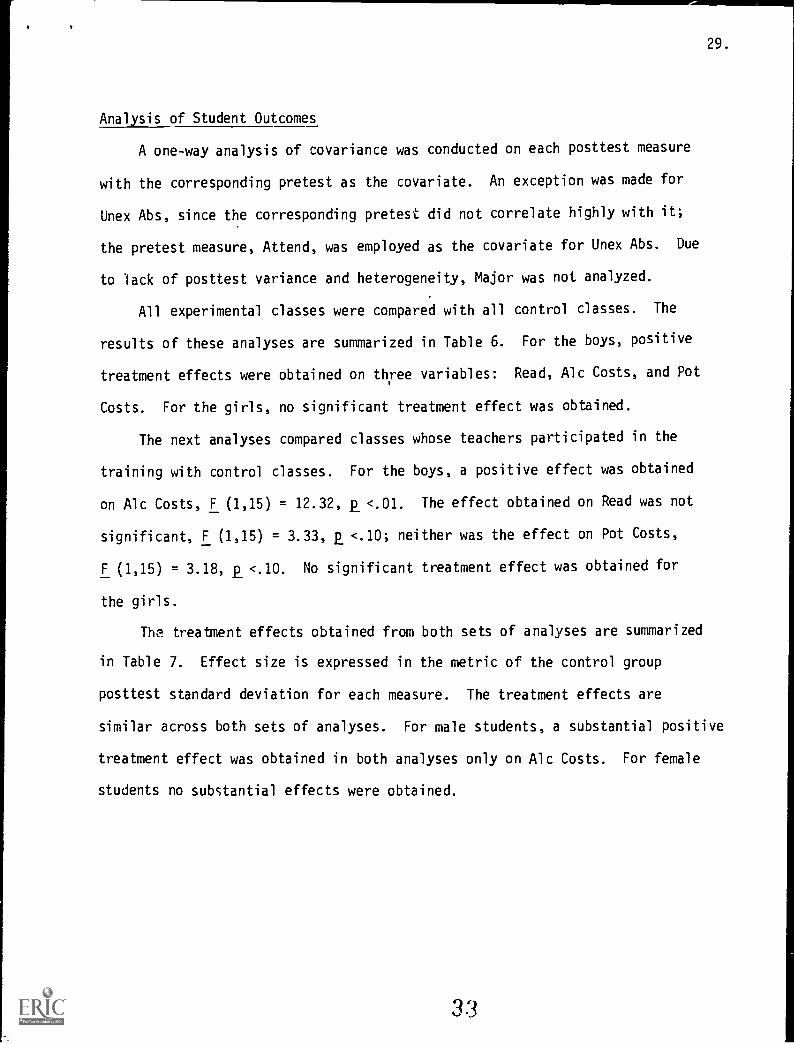
Analysis of Student Outcomes
A one-way analysis of covariance was conducted on each posttest measure
with the corresponding pretest as the covariate. An exception was made for
Unex Abs, since the corresponding pretest did not correlate highly with it;
the pretest measure, Attend, was employed as the covariate for Unex Abs. Due
to lack of posttest variance and heterogeneity, Major was not analyzed.
All experimental classes were compared with all control classes. The
results of these analyses are summarized in Table 6. For the boys, positive
treatment effects were obtained on three variables: Read, Alc Costs, and Pot
Costs. For the girls, no significant treatment effect was obtained.
The next analyses compared classes whose teachers participated in the
training with control classes. For the boys, a positive effect was obtained
on Alc Costs, F (1,15) = 12.32, p <.01. The effect obtained on Read was not
significant, F (1,15) = 3.33, p <.10; neither was the effect on Pot Costs,
F (1,15) = 3.18, p <.10. No significant treatment effect was obtained for
the girls.
The treatment effects obtained from both sets of analyses are summarized
in Table 7. Effect size is expressed in the metric of the control group
posttest standard deviation for each measure. The treatment effects are
similar across both sets of analyses. For male students, a substantial positive
treatment effect was obtained in both analyses only on Alc Costs. For female
students no substantial effects were obtained.

30.
TABLE 7
EFFECT SIZES FOR EXPERIMENTAL-CONTROL DIFFERENCES ANDPARTICIPANT-CONTROL DIFFERENCES FOR MALE AND FEMALE CLASSESa
Posttest Measure
Males Females
Exp-ControlEffect
Part-ControlEffect
Exp-ControlEffect
Part-Control
Effect
Affec Climate .10 .25 .00 .33
Att School -.74 -.62 -.58 -.19
Social Self -.50 -.62 -.16 .08
Minor .49 .22 .47 .29
Att Peers -.33 -.25 .00 .62
Control Suc -.29 -.29 .00 .14
Control Fail .00 .78 -.37 -.18
Acad Self .22 .56 -.17 .17
Peer Att Sch -.25 -.13 -.40 -.30
Read .53 .50 -.09 -.11
Math .45 .50 -.11 -.12
Unex Abs -.27 -.33 .00 -.08
Total Abs .62 .16 .00 .00
Alc Costs 1.64 1.64 -.61 -.76
Cig Costs .99 1.06 .00 -.44
Pot Costs .70 .65 -.40 -.80
Alc Involve .43 .77 -.25 -.04
Cig Involve .52 .79 .00 .00
Pot Involve .51 .76 -.52 .00
aThe effects are the covariate-adjusted posttest differences expressed in the metricof the control group posttest standard deviation. A negative sign indicates a negative
treatment effect.
311

31.
Initial Equivalence--Teachers
Analyses of pretest and background measures were conducted to detennine
a) whether teachers in the experimental and control conditions were equival-
ent and b) whether teachers in the experimental school who participated in
the training were similar to nonparticipating teachers.
Experimental and control teachers were found not to differ in terms of
teaching experience, prior in-service training, use of various academic
and affective techniques in the classroom, or the pretest measures of satis-
faction, faculty cohesiveness, and teaching objectives related to ECM.
There were differences between experimental participants and experimental
nonparticipants. Seven of eight participants were female; whereas, allnon-
participants were males. As compared to the nonparticipants, the participants
reported less teaching experience, less prior in-service training, and less
use of special academic and affective techniques in the classroom during the
year prior to the study. The two groups did not differ on the pretest measures
of the three teacher outcome variables.
Analysis of Teacher Outcomes
One-way (experimental vs. control) analyses of covariance were applied
to each teacher posttest measure with the corresponding pretest used as a
covariate. No differences were obtained on Teacher Satis, F (1,16) <1, or
ECM Object, F (1,16) <1. A significant difference was obtained on Faculty
Cohes, F (1,16) = 8.08, p. <.05. Compared to experimental teachers, control
teachers reported greater faculty cohesiveness. These results were unchanged
when control teachers were compared with only those experimental teachers who
participated in the training.

32.
DISCUSSION
The results of this study were disappointing. There was no evidence for
the hypothesized treatment effects on teachers. In fact, there was evidence
for reduced perceptions of faculty c3hesiveness. The hypothesized direct
effects on students' attitudes toward school, social self-esteem, perceptions
of classroom climate, and discipline problems, were not supported. For boys,
several effects were found that are indirectly related to the treatment, but
these effects are uninterpretable given the lack of direct effects. For girls,
there was no evidence for either direct or indirect effects.
It appears that ECM as implemented is not an effective prevention strategy.
There was no indication that experimental classrooms were more responsive to
students' affective and cognitive needs. There were moderate positive effects
for males on reading achievement and marijuana costs (i.e., adverse consequences
of marijuana use), but these effects did not replicate in the participant-
control comparisons. For both the experimental-control and the participant-
control comparisons, a substantial positive effect was obtained on alcohol costs.
However, if this effect was due to the treatment, then the effect from the
participant-control comparison should be larger than the effect from the
experimental-control comparison. Since this was not the case, the obtained
effect should not be attributed to the treatment.
One problem in this study may have been that teachers failed to adequately
implement the ECM skills. However, defining the adequacy of implementation is
difficult inasmuch as the ECM curriculum was predominantly unstructured.
313
...
33.
Teachers were trained to integrate interpersonal skills within their regular
classroom behavior rather than to set aside time for specific activities.
Although ECM included some structured activities (i.e., self-concept enhance-
ment activities) the emphasis was on increasing the teachers' use of communica-
tion and discipline skills with students, as needed. Whether these skills were
practiced was contingent upon the occurrence of student behaviors (e.g.,
aggression). Adequacy may have more to do with appropriate and timely skill
use than with absolute counts of skill use. Hence, determining behavioral
objectives for teachers is complicated because student behavior cannot be
anticipated or predicted.
In order to assess the adequacy of implementation given a program such
as ECM, it may be necessary to document the patterns of student-teacher inter-
action in the classroom. In the present study observational data were collected
on teacher behavior without regard to student behavior. While these data pro-
vided estimates of the frequency of skill use, they did not indicate how appro-
priately and timely the skills were used. A sequential coding system, in which
teacher behaviors and precipitating student behaviors are recorded, would fur-
nish the required information. However, this type of system entails complex
analysis o= behavioral contingencies which demands a large quantity of observa-
tional data. This would make the process evaluation quite costly. If future
evaluations are to contribute to a better understanding of unstructured
affective programs, it may be necessary to expend considerable resources for
collection and analysis of process data.
Teachers are likely to use ECM skills only when the appropriate oppor-
tunities arise, and these opportunities are related to the organization and

34.
type of classroom activities conducted. For example, teachers who allow
students to interact freely with each other in the classroom may find that
students spend less time on task or misbehave more often than if they did not
allow this interaction. These teachers may use ECM skills more regularly be-
cause of greater opportunity to use them. By contrast, opportunities to use
many ECM techniques may be quite limited in classrooms that are managed differ-
ently. Since teacher management style varies from classroom to classroom,
affective programs like ECM are particularly likely to confound teacher/class-
room effects with program effects. The detection of treatment effects is
complicated by this lack of standardization of the treatment.
Differences among teachers in the way a treatment is implemented, and
differences within teachers across occasions will inflate error variance in
the student outcome measures. This will reduce the likelihood of finding treat-
ment effects. It has been suggested that measures of variability of implementa-
tion be taken and incorporated into the data analysis (Cook & Campbell, 1979).
In the present study, we attempted and failed to relate a measure of frequency
of treatment implementation to classroom mean student outcomes. This failure
may be due to lack of data regarding appropriateness of skill use or to in-
adequate power.
It is also possible that our hypotheses about the relationship between
treatment ;mplementation and student outcomes were based on a faulty assumption.
Our assumption that regular use of affective skills by teachers creates positive
effects on students is intuitively compelling. However, a recent observational
study of classroom teacher behavior found that teacher implementation of speci-
fic affective skills was related in an unexpected way to student outcomes
38

35.
(Coker, Medley, & Soar, 1980). The frequency with which many affective
teacher behaviors were used was negatively related to pupil self-concept gain
and/or achievement gain. Thus, the more frequently teachers used certain
affective skills, the more student outcomes declined. Furthermore, some
affective teacher behaviors were positively related tc self-concept gain and
negatively related to achievement gain, and other behaviors showed the reverse
pattern of correlations. Because the relationships between teacher behavior
and student gains are complex, it is unlikely that investigations of i.!-ese
relationships, in isolation from student effects on teachers and environmental
factors, will be interpretable.
Besides the problems inheront in our treatment, there were several
impediments to dedicated adoption of the pr3gram by the experimental teachers.
A study of federal programs supporting educational change found that the
organizational climate and the school principal critically contribute to im-
plementation by giving moral support to participants and by creating an environ-
ment that values the program (Berman & McLaughlin, Note 12). Although ECM was
not characteristic of the federal programs reviewed, this point is distinctly
apropos. In many of our experimental schools the tone was that of tolerance
and not support. For this reason, our treatment delivery model may have
actually limited teacher commitment to implementation.
ECM may have lacked support because many teachers and principals in
experimental schools never fully accepted ECM as a drug abuse prevention
strategy, although our trainers explained the rationale underlying the program.
The extent to which the teachers' skepticism attenuated our credibility and
affected classroom implementation is unknown. In addition, we offered a
3

I.
36.
financial incentive to maximize participation in the training. However,
extrinsic rewards generally fail to guarantee commitment to program implementa-
tion if teachers are not motivated to change on the basis of professional
growth (Berman & McLaughlin, Note 12).
In ECM, teachers were taught to apply specific affective skills in an
ad hoc manner. These skills were added to the teachers' existing repertoire of
classroom behaviors. The training and follow-up visits did not directly venture
to change the teachers' teaching styles nor their established classroom routines
which may have been incompatible with the program's goals. ECM did not ask
that teachers change their classroom learning activities in ways that would
maximize opportunities to use ECM skills. For example, the trainers might
have asked teachers to "personalize" learning by relating academic content to
students' personal lives. In the future, developers of affective in-service
training programs should consider promoting changes in general teaching style
and in the organization of classroom activities.
40

I r s
37.
REFERENCE NOTES
1. Schaps, E., Moskowitz, J., Condon, J. & Malvin, J. A process andOutcome Evaluation of an Affective Teacher Training Primary Pre-vention Program. Prevention Branch, National Institute on DrugAbuse, 1980.
2. Adams, S. and Slimmon, L. Process Documentation: Effective ClassroomManagement II-Elementary, 1979-1980 School Year. Prevention Branch,National Institute on Drug Abuse, 1980.
3. Michigan Department of Education & The Office of Substance Abuse Ser-vices, Department of Public Health. 1976-1977 Evaluation Report:Substance Abuse Prevention Education Program, undated.
4. Georgia Department of Human Resources & Georgia State Department ofEducation. Life Skills for Mental Health, 1977.
5. Bandt, P., Hammond, M., Wisdo, T. & Mitzel, H. A Follow-Up Study ofTeachers Trained in Affective Classroom Approaches to Primary Pre-vention of Drug and Alcohol Abuse. State College, PA: AddictionsPrevention Laboratory, 1976.
6. Instructional Objectives Exchange. Measures of Self Concept X-12.(rev. ed.) Los Angeles: Instructional Objectives Exchange, 1972 b.
7. Instructional Objectives Exchange. Attitude Toward School K-22.(rev. ed.) Los Angeles: Instructional Objectives Exchange, 1972 a.
8. Stenner, A. & Katzenmeyer, W. Technical Manual and User's Guide:Self-Observation Scales, NTS Research Corporation, Durham, NC:undated.
9. Moskowitz, J., Condon, J., Brewer, M., Schaps, E. & Malvin, J. TheNapa Project: Scaling of Student Self-Report Instruments. PreventionBranch, National Institute on Drug Abuse, 1979.
10. Madden, R., Gardner, E., Rudman, H., Karlsen, B. & Merwin, J. StanfordAchievement Tests: Norms Booklet (Intermediate Level I). New York:Harcourt Brace Javanovich, 1973.
11. Kaufman, M., Semmel, M. & Agai-d, J. Supplcriental Ma.tfriols to Year IInterim Report, Part II. Washington, D. C.: U. S. Office of Educa-tion, Project Prime, undated.
12. Berman, P. & McLaughlin, M.W. Federal Program supporting educationalchange, vol., VIII: Implementing and sustaining innovations, U.S.Office of Education, 1978.

38.
REFERENCES
Baskin, E. & Hess, R. Does affective education work? A review of seven pro-grams. Journal of School Psychology, 1980, 18, 40-50.
Coker, H., Medley, D. A Soar, R. How valid are expert opinions about effectiveteaching? Phi Delta Kappan, 1980, 131-149.
Cook, T.D. & Campbell, D.T. Quasi-Experimentation: Design & Analysis Issuesfor Field Settings, Chicago, Rand McNally, 1979, 43-44.
Crandall, V., Katkovsky, W. & Crandall, V. Children's belief in their owncontrol of reinforcement in intellectual-academic achievement situations.Child Development, 1965, 36, 91-109.
Halpin, A. & Croft, D. The Organizational Climate of S-hools. Chicago: Mid-west Administration Center, University of Chicago, 1963.
Rempel, A. & Bentley, R. The measurement of teacher worale: a factor analysisapproach. Educational and Psychological Measurement, 1964, 24, 631-643.
Schaps, E., DiBartolo, R., Moskowitz, J., Palley, C. & Churgin, S. A reviewof 127 prevention program evaluations, Journal of Drug Issues, 1981, 11,17-44.