Title page Final - Transportation Planning | …trek.ubc.ca/files/2010/10/PBS_Final.pdfUBC PUBLIC...
53
by: Adam Cooper M.A. Candidate, SCARP, UBC September, 2009 public bicycle system feasibility study. the UBC
Transcript of Title page Final - Transportation Planning | …trek.ubc.ca/files/2010/10/PBS_Final.pdfUBC PUBLIC...

by: Adam CooperM.A. Candidate, SCARP, UBC
September, 2009
public bicycle system feasibility study.the UBC

UBC PUBLIC BICYCLE SYSTEM FEASIBILITY STUDY Page|i
The UBC Public Bicycle Feasibility Study by
Adam Stuart Cooper B.A. Geog.(Hons), B.A. Planning,
M.A. Planning Candidate
A PROJECT SUBMITTED IN PARTIAL FULFILMENT OF THE REQUIREMENTS FOR THE DEGREE OF
MASTER OF ARTS (PLANNING)
in THE FACULTY OF GRADUATE STUDIES
School of Community and Regional Planning
We accept this project as conforming
to the required standard
......................................................
.....................................................
.....................................................
THE UNIVERSITY OF BRITISH COLUMBIA September, 2009
© Adam Cooper, 2009

UBC PUBLIC BICYCLE SYSTEM FEASIBILITY STUDY Page|ii
Acknowledgements
The author would like to first thank Carole Jolly and Michael Peterson of the TREK Program Centre at the University of British Columbia for the opportunity to compile and complete this report. The leadership of UBC TREK and their support of student projects focused on sustainable transportation is greatly appreciated.
Dr. Larry Frank and the Bombardier Foundation deserve many thanks for their help in supporting the vision of this project and sustainable transportation across the Metro Vancouver Region. Without Larry’s guidance and enthusiasm for his students, this report would not have materialized.
The author would like to thank Michel Philibert and the wonderful people at Stationnement de Montréal and BIXI who provided first hand access to their award winning system, as well as financial and technical information that have greatly improved this report.
Gavin Davidson and Andrew Curran at TransLink, as well as Meghan Winters of the Cycling in Cities Study at UBC, deserve many thanks for providing the initial opportunity to become involved in the study of bicycles in both Vancouver and Paris.
Appreciation is extended to one of the most charismatic people I have had the pleasure to meet; Mr. Eric Britton of EcoPlan International. Eric, inspired me to make a difference at UBC and acted as a gracious host while I studied first‐hand the genesis of the bike sharing phenomena: the always fantastic Vélib'.
Finally, I would like to thank my parents, Barbara and Cody Cooper, who have lovingly supported me through nine years of university education. I love you both very much.
Thank you all.
‐ a

UBC PUBLIC BICYCLE SYSTEM FEASIBILITY STUDY Page|iii
Executive Summary
Introduction
This report was initiated and funded by the UBC TREK Program Centre to assess the feasibility of an on‐campus public bicycle system (PBS). The report considers whether such a system could improve on‐campus mobility, reduce travel times and advance transportation and sustainability goals of the University and the region. The report evaluates relevant components of implementing a public bicycle system: the success factors, usage rates, and the expected costs and benefits. The report concludes with recommendations on how to best implement a PBS at UBC.
A Snapshot of Transportation at UBC
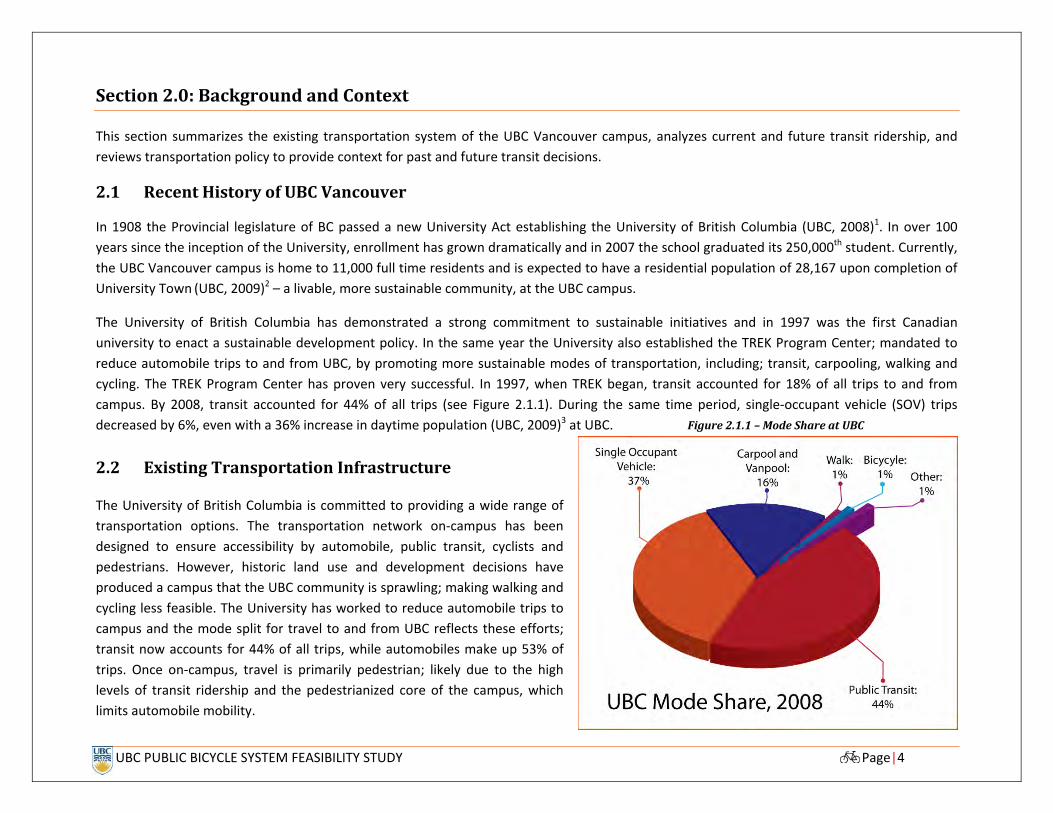
As Figure 1 indicates, public transit accounts for 44% of all trips to and from UBC. Notwithstanding the progress made by the TREK Program Centre, cars continue to permeate the UBC campus, remaining the dominant mode of transportation. Vehicles account for over half (53%) of all trips arriving to UBC: 37% as single occupant vehicles and 16% as vanpool and carpool. Cycling, walking and other modes of transportation account for the remaining 3%.
Travel to UBC is easy. However, the central core of the 402 hectare campus suffers from limited mobility options. Prohibited car access to portions of the campus, combined with community shuttles that serve the perimeter of campus, leave walking as the main mode of on‐campus transportation. Walking distance is frequently cited as an issue, and there is a desire among many to improve on‐campus mobility. Bicycles represent one affordable and sustainable option.
Nevertheless, several factors limit the popularity of cycling on‐campus; fear of theft, the topography en‐route to UBC and the limited capacity of the bike racks on buses. With intervention, cycling could imporve on‐campus mobility, especially as 60% of all potential cyclists in the Lower Mainland describe themselves as “interested but concerned,” with regard to increasing the amount they cycle1. As the residentail population of UBC continues to grow ‐ especially in the far southern portion of campus – more people will be seeking alternatives to the automobile to meet their daily mobility needs at UBC.
12009 TransLink Regional Cycling Strategy: Setting the Context
Figure 1: Mode Share to UBC, 2008

UBC PUBLIC BICYCLE SYSTEM FEASIBILITY STUDY Page|iv
A Primer on Public Bicycle Systems
The terms public bicycle system (PBS), free bikes, or city bikes are commonly interchanged, but all describe the same phenomena; a network of bicycles distributed across an urban area, available for public access from self‐service docking stations. Public bicycles can be picked up at any self‐serve station and returned to any other station in the network area, making them appropriate for point A to point B travel. The pricing structure of PBS is designed to encourage short utilitarian trips, differentiating them from typical bicycle rental programs, which target tourists and leisurely bicycle trips. Typically, bike share programs can be defined by their low cost, high concentration of stations and 24 hour operations.
Public use bicycles differ from typical bicycles in their heavier construction for durability, and the use of proprietary parts to reduce theft. The bicycles are designed to accommodate a range of body types and users. Their low stand‐over height, fenders and enclosed drive train, allow for riders in business casual clothing to use the bikes in all weather conditions. The bikes feature integrated, always‐on lighting as well space for carrying personal items and a locking mechanism that interfaces with the self‐serve docking station. The primary purpose of PBS is not to generate profit through user fees, but rather to enhance existing transit options , therefore membership rates and use fees are typically kept as low as possible.
PBS is commonly viewed as a compliment to the existing public transit network; extending and improving its reach, at a comparatively low cost. When located close to transit interchanges, commercial areas and other major destinations, PBS can act as the first and last leg of a transit journey. Around the world, public bicycles are being embraced as a form of sustainable transportation; over 125 cities now operate bike sharing systems.
The Benefits of a Public Bicycle System
A PBS will bring many benefits to the members of the UBC community, including; students, faculty, staff, tourists and those living in the residential communities. The expected benefits will likely accrue to six general categories; transportation, health, environmental, social, educational and economic. The bulk of the payback from investing in a public bicycle system will come in the form of transportation benefits to the UBC community, followed by health and environmental benefits that will improve regional quality of life. UBC will benefit from the social and educational opportunities created by an investment in PBS, as it will create opportunities for cross‐disciplinary research and advance positive social change. The economic benefits of PBS are likely to be moderate and are highly contingent on the program’s operating and financing model. However, options for improving the program’s financial viability do exist and should be pursued at the will of the university.

UBC PUBLIC BICYCLE SYSTEM FEASIBILITY STUDY Page|v
Figure 2, visually displays the magnitude of expected benefits in relation to each other, and lists the expected benefits across the six previously outlined categories. The image is not based on a common quantified scale of benefit, rather it depicts the scale of expected benefits accruing in each category.
Figure 2: An Ordinal, Visual Representation of PBS Expected Benefits

UBC PUBLIC BICYCLE SYSTEM FEASIBILITY STUDY Page|vi
Policy Support for a PBS
A comprehensive policy review examined material produced by UBC, not‐for‐profit organizations, and external stakeholders, including, TransLink, the City of Vancouver and Metro Vancouver. Notwithstanding the diversity in the sources of policy, their goals and policies for bicycle use and bicycle facility planning are consistent. Generally, all of the policy documents had specific actions focused on increasing access to cycling, improving its safety and making cycling a substitute for vehicle trips. The analysis reveals that a PBS fits the regional goals as well as the goals of UBC, as outlined in the Campus Plan, Strategic Transportation Plan and the Sustainability Strategy.
The Financials of a PBS
Purchasing and operating a public bicycle system represents a major capital investment in sustainable transportation infrastructure at UBC. Based on the financial model developed for this report, an appropriate PBS at UBC is likely to cost $4000/bike, with ongoing operating costs of $1250/bike/year. This represents a total capital investment of approximately $1,030,511 over a ten year period.
A PBS at UBC is likely to generate enough revenue from subscriptions and user fees to cover the annual operating costs of. However, without sponsorship, grant funding or the inclusion of advertising, the program will not recover its capital costs. Without these other sources of revenue, the cost of operating and installing a PBS over a ten year period is equal to $509,956 or $50,995/year. With minimal amounts of advertising introduced into the program, the capital costs can be recovered and the program will generate revenue that could be used to fund other sustainable initiatives at UBC.
Conclusion
Cycling culture in Vancouver is becoming entrenched in daily life. The evidence of cycling’s renaissance in Vancouver is everywhere. In 2009, the Burrard Street Bridge Bike Lane Reallocation Trial was launched, the Museum of Vancouver celebrated Vancouver and the Bicycle Revolution via “Velo‐City” an art exhibition exploring Vancouver’s cycling history. In June of 2009 the Central Valley Greenway, a 24 km, multi‐use pathway opened to cyclists, pedestrians and other active transportation users. In addition, the City of Vancouver’s Greenest City Team identified bike sharing as a quick start project capable of being implemented before the 2010 Olympics.
As the second largest commuter destination in the Metro Vancouver region, UBC must consider its impact on the region and the world. By implementing a public bicycle system, UBC has the opportunity to showcase its commitment to leadership in sustainability. The program will have an immediate and direct impact on public health, the environment, and generating social change. From a triple‐bottom‐line assessment, PBS is an excellent way to bring social and environmental benefits to UBC and the region, in addition to a moderate return on investment.

UBC PUBLIC BICYCLE SYSTEM FEASIBILITY STUDY Page|1
Contents Section 1.0: Introduction ............................................................................................................................................................................................... 3
1.0 Purpose of the Feasibility Study of Public Bicycles at UBC ............................................................................................................................ 3
1.1 Report Scope and Limitations ........................................................................................................................................................................ 3
Section 2.0: Background and Context ............................................................................................................................................................................ 4
2.1 Recent History of UBC Vancouver .................................................................................................................................................................. 4
2.3 Future Transit Infrastructure ......................................................................................................................................................................... 7
Section 3.0: Policy Review ............................................................................................................................................................................................. 8
3.1 Regional Policy Review ................................................................................................................................................................................... 8
3.2 UBC Policy Review ........................................................................................................................................................................................ 11
Section 4.0: What are Public Bicycles? ........................................................................................................................................................................ 13
4.1 An Introduction to Public Bicycles ............................................................................................................................................................... 13
4.2 The Goals of Bike Sharing ............................................................................................................................................................................. 15
4.3 The History of Public Bicycles ...................................................................................................................................................................... 16
4.4 Other Characteristics of Public Bicycle Systems .......................................................................................................................................... 18
Section 5.0: Is PBS Right for UBC ? ............................................................................................................................................................................... 19
5.1 Success factors for Public Bicycles ............................................................................................................................................................... 19
5.2 Who Uses Bike Sharing ................................................................................................................................................................................ 21
5.3 UBC’s Culture of Sustainability .................................................................................................................................................................... 21
Section 6.0: The Benefits of a Public Bicycle System ................................................................................................................................................... 24
6.1 PBS Benefits Summary ................................................................................................................................................................................. 24
6.2 Transportation Benefits ............................................................................................................................................................................... 25
6.3 Health Benefits ............................................................................................................................................................................................. 29
6.4 Environmental Benefits ................................................................................................................................................................................ 30

UBC PUBLIC BICYCLE SYSTEM FEASIBILITY STUDY Page|2
6.5 Social Benefits .............................................................................................................................................................................................. 31
6.6 Economic Benefits ........................................................................................................................................................................................ 31
6.7 Educational Benefits .................................................................................................................................................................................... 32
Section 7: The Financials of a Public Bicycle System.................................................................................................................................................... 33
7.1 The Information Void ................................................................................................................................................................................... 33
7.2 Typical Costs of a PBS ................................................................................................................................................................................... 33
7.3 Expected Ridership at UBC ........................................................................................................................................................................... 35
7.4 Capital Costs for PBS at UBC ........................................................................................................................................................................ 36
7.5 Operating Costs of PBS at UBC ..................................................................................................................................................................... 37
7.6 Operating Revenue of PBS at UBC ............................................................................................................................................................... 37
Section 8: Conclusion ................................................................................................................................................................................................... 40
8.1 Triple Bottom Line Assessment .................................................................................................................................................................... 40
8.2 Recommendations ....................................................................................................................................................................................... 41
References ................................................................................................................................................................................................................... 43

UBC PUBLIC BICYCLE SYSTEM FEASIBILITY STUDY Page|3
Section 1.0: Introduction
This section outlines the purpose of the report, its scope and limitations as well as the project partners.
1.0 Purpose of the Feasibility Study of Public Bicycles at UBC
This report was initiated and funded by the UBC TREK Program Centre to assess the viability of an on‐campus public bicycle system (PBS), with support from the Bombardier Foundation and the Active Transportation Lab, in the Centre for Human Settlements at UBC. Specifically the report considers whether such a system could improve on‐campus mobility, reduce travel times for students and meet transportation and sustainability policy goals of the University and the Metro Vancouver region.
The report evaluates relevant components of implanting a public bicycle system at UBC, from ridership projections and technical analysis to social, environmental and economic considerations.
1.1 Report Scope and Limitations
The study will:
Review the current and expected demand for transit to and from UBC.
Review relevant policy documents produced by UBC and other stakeholders.
Utilize data from public bicycle systems worldwide.
Evaluate and report various options for public bicycle systems at UBC. Identify the required number of bicycles to support the UBC population as well as station locations.
Estimate costs to install and operate a public bicycle system at UBC
Provide a triple bottom line conclusion as well as recommendations for the deployment of a PBS at UBC.
This report relies upon:
Ridership, vehicle and population data provided by UBC TREK, UBC Campus and Community Planning as well as TransLink.
TransLink reports regarding future transit planning associated with UBC.
A public bicycle assessment provided by The Public Bicycle Company, operators of the BIXI PBS in Montreal, Canada.
Reports from other cities and non‐profit agencies on the feasibility of public bicycles and the state of public bicycles world‐wide
UBC PUBLIC BICYCLE SYSTEM FEASIBILITY STUDY Page|4
Figure 2.1.1 – Mode Share at UBC
Section 2.0: Background and Context
This section summarizes the existing transportation system of the UBC Vancouver campus, analyzes current and future transit ridership, and reviews transportation policy to provide context for past and future transit decisions.
2.1 Recent History of UBC Vancouver
In 1908 the Provincial legislature of BC passed a new University Act establishing the University of British Columbia (UBC, 2008)1. In over 100 years since the inception of the University, enrollment has grown dramatically and in 2007 the school graduated its 250,000th student. Currently, the UBC Vancouver campus is home to 11,000 full time residents and is expected to have a residential population of 28,167 upon completion of University Town (UBC, 2009)2 – a livable, more sustainable community, at the UBC campus.
The University of British Columbia has demonstrated a strong commitment to sustainable initiatives and in 1997 was the first Canadian university to enact a sustainable development policy. In the same year the University also established the TREK Program Center; mandated to reduce automobile trips to and from UBC, by promoting more sustainable modes of transportation, including; transit, carpooling, walking and cycling. The TREK Program Center has proven very successful. In 1997, when TREK began, transit accounted for 18% of all trips to and from campus. By 2008, transit accounted for 44% of all trips (see Figure 2.1.1). During the same time period, single‐occupant vehicle (SOV) trips decreased by 6%, even with a 36% increase in daytime population (UBC, 2009)3 at UBC.
2.2 Existing Transportation Infrastructure
The University of British Columbia is committed to providing a wide range of transportation options. The transportation network on‐campus has been designed to ensure accessibility by automobile, public transit, cyclists and pedestrians. However, historic land use and development decisions have produced a campus that the UBC community is sprawling; making walking and cycling less feasible. The University has worked to reduce automobile trips to campus and the mode split for travel to and from UBC reflects these efforts; transit now accounts for 44% of all trips, while automobiles make up 53% of trips. Once on‐campus, travel is primarily pedestrian; likely due to the high levels of transit ridership and the pedestrianized core of the campus, which limits automobile mobility.

UBC PUBLIC BICYCLE SYSTEM FEASIBILITY STUDY Page|5
Automobiles
For more than ten years, UBC TREK has been working to reduce automobile trips to and from campus and to encourage the use of other modes of transportation, such as, transit, carpooling, cycling and walking. The introduction of the U‐Pass, in conjunction with other transportation demand management measures such as increased parking fees, a restricted parking supply, and upgraded cycling infrastructure have helped UBC reduce the number of trips made to campus by automobiles. Although great progress has been made during the last ten years of transportation intervention, cars still permeate the UBC campus and remain the primary mode of transportation for daily trips to UBC. In total, vehicles account for over half (53%) of all trips arriving to UBC; with 37% arriving as single occupant and the remaining 16% as vanpool or carpool (UBC, 2009)4. This automobile dominated mode share has major implications for the University, as Provincial climate change goals strive to make the campus carbon neutral by 2010.
The carbon dioxide emissions associated with commuting to and from UBC represent the University’s second highest output at 22,815 tonnes/year (UBC, 2006)5. The high output of carbon from commute patterns places it second only to emissions associated with the burning of natural gas to produce steam for plant operations. The current commute patterns produce more emissions than those associated with electricity use and those generated from buildings (22,365 and 12,012 tonnes/year respectively), (UBC,2006)6. In order to advance sustainability and achieve carbon neutrality at UBC, further transportation intervention will be necessary.
Public Transit
Coast Mountain Bus Company (CMBC) a subsidiary of TransLink; the regional transportation authority for Metro Vancouver, serves UBC with 13 bus routes (see Table 2.2.1), including one express bus (99 B‐Line) as well as 3 community shuttles (C19, C20, C22). Since 1997, transit ridership to and from UBC has increased 168% totaling 51,000 weekday trips (UBC, 2009)7. The dramatic increase in ridership resulted from the introduction of a mandatory student U‐Pass program, significant improvements in transit service levels (including new routes to UBC and extended hours of service), a reduced supply of commuter parking and higher prices for on‐campus parking (UBC, 2009)8.
UBC PUBLIC BICYCLE SYSTEM FEASIBILITY STUDY Page|6
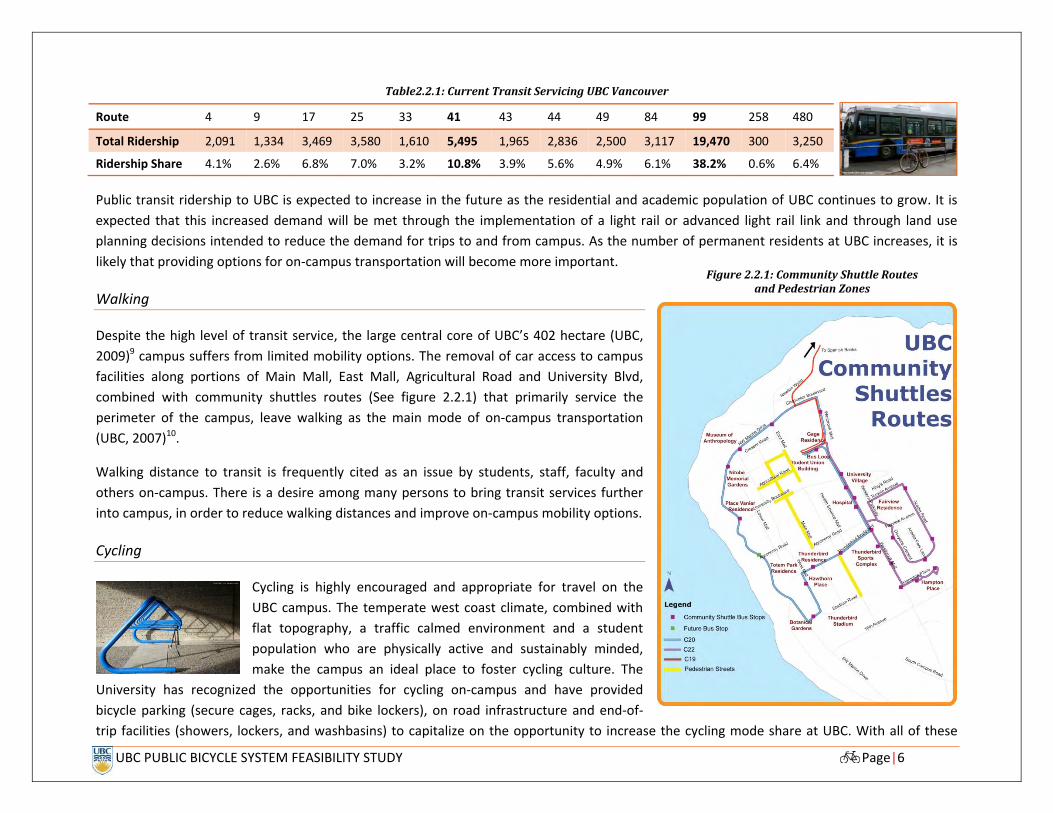
Table2.2.1: Current Transit Servicing UBC Vancouver
Public transit ridership to UBC is expected to increase in the future as the residential and academic population of UBC continues to grow. It is expected that this increased demand will be met through the implementation of a light rail or advanced light rail link and through land use planning decisions intended to reduce the demand for trips to and from campus. As the number of permanent residents at UBC increases, it is likely that providing options for on‐campus transportation will become more important.
Walking
Despite the high level of transit service, the large central core of UBC’s 402 hectare (UBC, 2009)9 campus suffers from limited mobility options. The removal of car access to campus facilities along portions of Main Mall, East Mall, Agricultural Road and University Blvd, combined with community shuttles routes (See figure 2.2.1) that primarily service the perimeter of the campus, leave walking as the main mode of on‐campus transportation (UBC, 2007)10.
Walking distance to transit is frequently cited as an issue by students, staff, faculty and others on‐campus. There is a desire among many persons to bring transit services further into campus, in order to reduce walking distances and improve on‐campus mobility options.
Cycling
Cycling is highly encouraged and appropriate for travel on the UBC campus. The temperate west coast climate, combined with flat topography, a traffic calmed environment and a student population who are physically active and sustainably minded, make the campus an ideal place to foster cycling culture. The
University has recognized the opportunities for cycling on‐campus and have provided bicycle parking (secure cages, racks, and bike lockers), on road infrastructure and end‐of‐trip facilities (showers, lockers, and washbasins) to capitalize on the opportunity to increase the cycling mode share at UBC. With all of these
Route 4 9 17 25 33 41 43 44 49 84 99 258 480
Total Ridership 2,091 1,334 3,469 3,580 1,610 5,495 1,965 2,836 2,500 3,117 19,470 300 3,250
Ridership Share 4.1% 2.6% 6.8% 7.0% 3.2% 10.8% 3.9% 5.6% 4.9% 6.1% 38.2% 0.6% 6.4%
Figure 2.2.1: Community Shuttle Routes and Pedestrian Zones

UBC PUBLIC BICYCLE SYSTEM FEASIBILITY STUDY Page|7
measures in place and more bicycle racks consistently being added across campus, the mode share for cycling trips to and from UBC is 1.4%, down from a pre U‐Pass high of 2.6% in 2002 (UBC, 2009)11.
The relatively low mode share for cycling to UBC is likely a result of several factors. Foremost is UBC’s isolated location on Point Grey ‐ increasing distances from the City of Vancouver and other destinations. Additional factors include the topography en route to campus, fear of theft once at UBC and the relative attractiveness of alternatives, particularly public transit (Winters & Cooper, 2008)12. While the University can address some of these deterrents to cycling, topography proves difficult to overcome and can be prohibitive to attracting new riders, older cyclists or those with health conditions. TransLink has ensured that the majority of buses running to UBC are or will be equipped with bicycle racks as one solution to overcoming the steep topography, although the Fall 2008 Transportation Status Report indicate that the bicycle racks are not well utilized. Unfortunately, this report may be misleading, as the usage rates for the racks are averaged across a full day and fail to illustrate the demand for bicycle rack capacity during peak travel times. Personal observation during peak travel times, especially in good weather, reveals many pass‐ups for transit riders wishing to bring bicycles to UBC. This lack of capacity at peak demand, likely discourages transit users from bringing their bicycles to campus, further compounding on‐campus mobility problems and contributing to the low cycling mode share.
Table 2.2.2: Bikes on Buses (Daily Averages) Route 4 9 17 25 33 41 43 44 49 84 99 258 480
Bicycles 17 6 22 36 10 40 5 20 11 36 135 2 11
Buses with Racks 135 95 198 182 101 250 55 82 126 185 429 14 103
Avg. Bikes/Rack 0.13 0.06 0.11 0.20 0.10 0.16 0.09 0.24 0.09 0.19 0.31 0.14 0.11
2.3 Future Transit Infrastructure
In the future, public transit will continue to play a critical role for transporting the UBC community. Transit ridership can generally be expected to grow and remain integral to the commuting patterns at UBC. Currently, TransLink is expected to meet future demand with the construction of a high speed rail link. It is expected that this upgraded transit linkage to UBC will improve the attractiveness of public transit for those commuters currently travelling in an automobile. A reduction of vehicles on‐campus combined with the centralized location of public transit facilities at UBC will further compound the issue of on‐campus mobility. In order to make public transit as viable and attractive as possible, it is imperative that UBC improve options for on‐campus mobility.
UBC Line Expected Transit Load
Baseline (Broadway) 24,273
Baseline + Surrounding (Broadway, 4th and 16th) 37,807
Baseline + Surrounding + Expected Increase 54,745
Table 2.3.1: Expected Future Transit Load to UBC

UBC PUBLIC BICYCLE SYSTEM FEASIBILITY STUDY Page|8
Section 3.0: Policy Review
The following section outlines the relevant policies of regional government, local government and the University which relate to the implementation of a large scale public bicycle system at the UBC Vancouver campus.
3.1 Regional Policy Review
Decisions with respect to the provision of transportation infrastructure at UBC occur within a broader policy context, therefore transportation planning should consider regional objectives, City of Vancouver, Metro Vancouver and TransLink policies, as well as advice from local independent research organizations. Notwithstanding the diversity in the sources of policy, their suggestions for transportation planning and policy are fairly consistent. The three key themes that emerge from the policy and research review are; connecting transportation to land use, reducing reliance on the private automobile and supporting the transportation hierarchy (see Figure 3.1.1).
Table 3.1.1: Policy and Research Review
Sector Organization Document Applicable Policies / Goals / Targets
Regional Government
TransLink Transport 2040, Regional Cycling Strategy Background Study
Aggressively reduce greenhouse gas emissions from transportation support of federal, provincial and regional targets.
The majority of trips will be by transit, walking and cycling. Metro Vancouver is the most bicycle friendly city/region in the world Cycling is a normal activity – everyone cycles.
Metro Vancouver
1996 Livable Region Strategic Plan Increase transportation choice. Reduce reliance on private automobile
Local Government
City of Vancouver
1997 Transportation Plan,1999 Bicycle Plan, 2003 Downtown Transportation Plan, 2005 Community Climate Change Action Plan
Identifies cycling as a high‐priority transportation mode within the city. Identifies 12 action items to improve cycling in Vancouver Create a balanced transportation system that includes a network of bike lanes. Identifies the role of active transportation in meeting climate change targets.
Non‐Profit
Smart Growth BC
2005 Transportation Vision
Use TDM to reduce congestion and decrease commuting costs by encouraging drivers to choose alternatives to travelling in private automobiles
Transportation infrastructure investments designed to provide all citizens with safe convenient and affordable access to most daily needs, including employment, education, shopping, personal services and recreation.
Victoria Transport Policy Institute
Evaluating Public Transit Benefits and Costs
Non‐motorized modes (walking and cycling) are important in their own right and provide access to public transit. Non‐motorized improvements can leverage shifts to transit.
Cycling is one of the most practical ways to increase community health and fitness.

UBC PUBLIC BICYCLE SYSTEM FEASIBILITY STUDY Page|9
Theme #1: Connect Transportation to Land Use
The efficient provision of public transportation is only possible by adopting land use policies which enhance transit’s attractiveness as an alternative to the automobile. Communities designed on the principles of SmartGrowth or Transit Oriented Design (TOD) have high street connectivity and a mixture of land uses and are more often associated with increased walking, transit, and biking (Frank, 2007)13. The proximity of diverse land uses, including; residential, commercial, industrial, institutional and recreational, allow people to access many of their daily needs by walking or cycling, thereby reducing the need to invest in costly road and transit infrastructure. When longer distance travel is necessary, compact communities make public transportation a viable option by increasing demand and reducing the costs of transit provision. When potential riders are concentrated within smaller geographic areas, transit service can be more frequent, convenient and comfortable. When transit exhibits these characteristics, ridership increases and economies of scale allow reinvestment to ensure continued provision of effective and attractive public transportation.
Figure 3.1.1: Transportation / Land Use Interaction (Wegener,1999)14.
Theme # 2: Reduce Reliance on Private Automobiles
Driven by mounting concerns about the environmental, health and social consequences of automobile use, such as reliance on fossil fuels linked to declining global reserves and vehicle emissions which contribute to lower air quality and climate change, contemporary policy in Metro Vancouver is focused on discouraging reliance on the private automobile for local and regional mobility.

UBC PUBLIC BICYCLE SYSTEM FEASIBILITY STUDY Page|10
The automobile requires significant raw material and energy inputs and generates solid, liquid and gaseous waste that in many cases is toxic and difficult to reuse or recycle. For some individuals, cars are economically unfeasible to own, operate and or maintain. For communities, the roads and parking areas required by motor vehicles are costly to build and maintain, and consume valuable land that might otherwise be available for houses, shops or parks.
Theme # 3: Support the New Transportation Hierarchy
The policy documents under review for this study suggest either implicitly or explicitly, a hierarchy to guide transportation planning, funding and infrastructure. The hierarchy prioritizes inexpensive and environmentally benign modes of transport. The hierarchy’s role in policy is significant not only for establishing priority modes, but also for guiding public decisions. Any review of transportation policy suggests that investment is required to support the hierarchy. This does not require more money to be spent on bike paths than buses, but it does imply that support for modes lower on the hierarchy should not come at the expense of the higher priorities.

UBC PUBLIC BICYCLE SYSTEM FEASIBILITY STUDY Page|11
3.2 UBC Policy Review
UBC has produced several important transportation and sustainability policy documents and reports which impact the feasibility and likelyhood of developing a large scale public bicycle system on‐campus. The following list is a chronological outline of policies and reports that support the implementation of a PBS.
Table 3.2.1: UBC Transportation and Sustainability Policies / Reports
Plan, Strategy or Study Policy Goal PBS Alignment with Policy Goals
1992 Campus Plan An enhanced on‐campus transit system should be developed to overcome the extreme walking
distances from parking facilities and between buildings, and to improve user safety and comfort at night
High
1997 Official Community Plan & MOU
Committed to consider measures to improve the bicycle network on‐campus, provide additional bicycle parking, and implement a “public bike” program.
A commitment to reduce the number of commuter parking stalls on‐campus
High High
Strategic Transportation Plan 1999, Updated 2005
Based on four primary goals1. Provide a wide range of transportation choices for everyone at UBC. 2. Shift travel from automobiles to transit and other modes of transportation. 3. Improve safety for all modes of transportation, particularly for vulnerable road users —
pedestrians and cyclists. 4. Mitigate the impacts of heavy truck traffic
High High Medium Low
2007 Access and Movement Study
Walking distance on‐campus cited as an issue by students, faculty, staff and others. Desire to bring transit further into campus in order to reduce walking distances. However,
TransLink have stated that they do not support extending bus routes into the campus; would result in substantial increases in operating costs
Community shuttle service has been cited as an issue; prefer that the service operated more frequently so that it could be used for trips on‐campus.
High High Medium
Inspirations and Aspirations: the Sustainability Strategy, 2007
Improve human health and safety. Make UBC a model sustainable community Reduce pollution.
Medium High Low
Trek 2010
Develop improved and innovative ways for the external community to gain access to UBC ’s many academic, cultural, and recreational offerings
Model UBC as a responsible, engaged, and sustainable community, dedicated to the principles of inclusivity and global citizenship.
High High

UBC PUBLIC BICYCLE SYSTEM FEASIBILITY STUDY Page|12
UBC policy typically reiterates the themes found in the external policy review. However, the language, tone and scope of the UBC policies tends be stronger and broader, reflecting the University’s deep commitment to sustainable development and environmental stewardship. The most critical policies identified in the review are related to improving transportation options for all and improving on‐campus mobility as well as specific statements in the 1997 Campus Plan which indicate the opportunity to develop a bike sharing system at UBC. Developing a PBS will help UBC to advance many of its policy goals in both the transportation and sustainability divisions. The system will provide environmental, social and economic benefits to the UBC and its residential communities. For greater detail on the benefits that will accrue please see Section 6 of this report.
UBC PUBLIC BICYCLE SYSTEM FEASIBILITY STUDY Page|13
Section 4.0: What are Public Bicycles?
The following section introduces the concept of public bicycles and outlines the current state of technology worldwide, focusing on the largest and most successful systems worldwide.
4.1 An Introduction to Public Bicycles
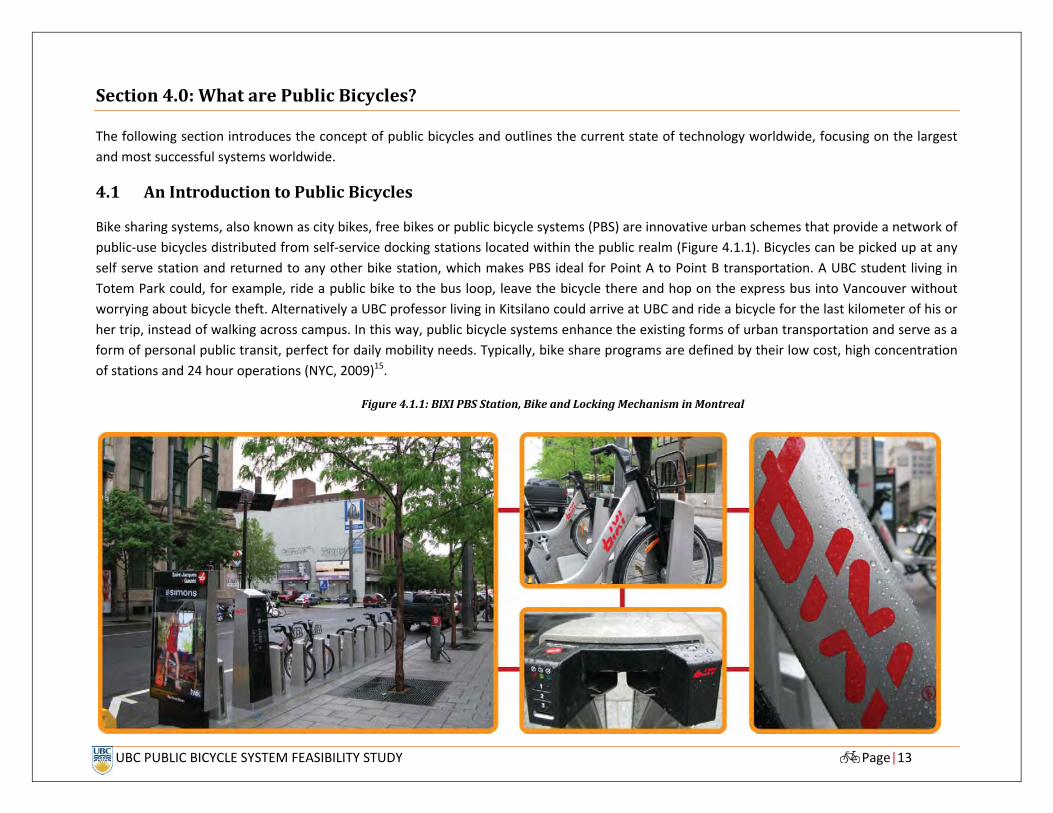
Bike sharing systems, also known as city bikes, free bikes or public bicycle systems (PBS) are innovative urban schemes that provide a network of public‐use bicycles distributed from self‐service docking stations located within the public realm (Figure 4.1.1). Bicycles can be picked up at any self serve station and returned to any other bike station, which makes PBS ideal for Point A to Point B transportation. A UBC student living in Totem Park could, for example, ride a public bike to the bus loop, leave the bicycle there and hop on the express bus into Vancouver without worrying about bicycle theft. Alternatively a UBC professor living in Kitsilano could arrive at UBC and ride a bicycle for the last kilometer of his or her trip, instead of walking across campus. In this way, public bicycle systems enhance the existing forms of urban transportation and serve as a form of personal public transit, perfect for daily mobility needs. Typically, bike share programs are defined by their low cost, high concentration of stations and 24 hour operations (NYC, 2009)15.
Figure 4.1.1: BIXI PBS Station, Bike and Locking Mechanism in Montreal

UBC PUBLIC BICYCLE SYSTEM FEASIBILITY STUDY Page|14
After paying the initial subscription fee (annually, monthly, weekly or daily), users typically have low‐cost or free access to the bicycles for the first half hour, via the swipe of a smart card or credit card. These systems differ from traditional, mostly leisure‐oriented bicycle rental services because they provide fast and easy, self‐serve access to a large volume of bicycles, available within a short walking distance of any given point within the program area. Docking stations are typically located every 300 m – 600 m, providing a high degree of mobility utility to subscribers while simultaneously creating a new tourist attraction and way‐finding system for visitors. The majority of PBS accommodate one‐way trips, making them well suited for multi‐modal trip chaining and spontaneous trips. The bicycles are designed to suit a wide range of users, providing a fast, convenient and flexible option to public transit, walking or driving, that is particularly useful in congested urban areas or places with limitied mode choices. As a result of their high utility, the systems identified in Table 4.1.1 have dramatically exceeded initial ridership projections. Some, such as Vélib’ in Paris, have reduced total car trips by up to 5%, and more than doubled the cycling mode share within a year of implementation (TransLink, 2008)16.
The early examples of bicycle sharing, such as Amsterdam’s “White Bikes” or UBC’s own “Purple and Yellow” bikes were somewhat idealistic experiments in which large numbers of bicycles were left haphazardly around city centers or university campuses for people to use as needed. Not surprisingly these programs amounted to bike giveaways, with the bicycles disappearing almost immediately (DeMaio and Gifford, 2004)17. UBC’s own “Purple and Yellow” program utilizes volunteer labour and donated bicycles to provide an ever‐fluctuating number of bicycles to program volunteers. Unfortunatley, the system uses a standardized keyed master lock, and has no permanent stations. These lack of user accountability has led to theft debilitating the program (TransLink, 2008)18.
Table 4.1.1: Mainstream Public Bicycle Systems
City Paris, France* Lyon, France* Barcelona, Spain* Washington DC Montreal, Canada
Operator JC Decaux JC Decaux Clear Channel Adshel
Clear Channel Adshel Public Bicycle System Co.
Opening Date 15‐Jul‐07 20‐May‐05 27‐Mar‐07 13‐Aug‐08 12‐May‐09 Current Fleet Size
23,900 4000 6,000 120
3,000**
Current # of Stations
1,751 340 400 10
200***
Business Model For Profit For Profit Local Government For Profit Non‐Profit Technology Smart Card Smart Card Smart Card Smart Card Smart Card Funding Subscriptions and Outdoor
Advertising Subscriptions and Outdoor
Advertising Subscriptions and Parking Revenue
Subscriptions and Outdoor Advertising
Subscriptions and Sponsorship
* Compiled with data obtained from the OBIS (The Opitimising of Bike Sharing in European Cities Project) ** Expanding to 5000 in summer 2009, *** Expanding to 300 in summer 2009

UBC PUBLIC BICYCLE SYSTEM FEASIBILITY STUDY Page|15
Although many small‐scale bicycle rental systems are currently in operation in Vancouver, these are intended to serve limited niche markets for tourists or corporate and university campuses. The latest generation of bike sharing systems (see Table 4.1.1) function as a new mode of individual public transportation and have become an integrated and integral component of the wider public transportation network. For a full review of the existing PBS worldwide, please refer to the following reports available online; Bike Share: Opportunities in New York City; Public Use Bike Share Feasibility Study for King County Washington or the TransLink Public Bike System Feasibility Study. For the latest information on the location of existing and proposed bicycle sharing systems worldwide, see the The Bike‐Sharing Blog’s world map which keeps an update to date log of the rapidly expanding number of systems worldwide.
4.2 The Goals of Bike Sharing
One of the principle goals of bike sharing is to better integrate transit facilities within an urban network to achieve a higher overall level of mobility and efficiency. This applies not only to users of PBS, but to transit riders and car drivers who benefit from increased capacity on the road network and in transit vehicles. While improved mobility may be the number one goal and benefit of PBS, the majority of cities around the world have a range of secondary goals they believe can be advanced by implementation of PBS.
The secondary goals of many cities include, but are not limited to; fighting climate change, improving air quality, reducing reliance on the private automobile, improving public health, creating jobs, stimulating economic activity, increasing tourism and creating opportunities for impromptu social interaction. Furthermore, it is clear that PBS is viewed by many politicians and local councils as an opportunity to demonstrate their commitment to sustainability and “going green.” The relatively low cost of PBS, compared to other interventions which can meaningfully impact a wide range of public policies, makes the concept extremely popular. In the summer of 2009 alone, Boston, London, Mexico City and Melbourne all announced plans to implement bike sharing systems by 2010 (MetroBike LLC, 2009)19. In Canada, Montreal’s BIXI system become such “an extraordinary success,” according to André Lavallée, (Vice‐Chairperson of Montreal’s Transportation and Planning system), that the program will expand ahead of time; increasing from 3000 bicycles and 200 stations to 5000 bicycles and 300 stations.
On the periphery of all of these goals, is the hope that PBS will act as a catalyst to increasing the acceptance of cycling as a legitimate mode of urban transportation, eventually leading to significant increases in levels of cycling on both PBS as well as privately owned bicycles. Many of the transportation planners and PBS advocates view bike sharing in the same light as recycling, canvas grocery bags and compact fluorescent light bulbs: a tool capable of creating a social phenomenon that will forever change the face of modern urban living. As Gérard Collomb, the President of Greater Lyon said, “there are two types of mayors, those who have bike sharing and those who want bike sharing” (DeMaio,2008)20. This certainly seems to be the case ‐ as each new system creates more interest in the idea. With hundreds of bike sharing systems now in use worldwide and more being planned and announced daily, PBS just might be the transportation breakthrough cities have been craving.

UBC PUBLIC BICYCLE SYSTEM FEASIBILITY STUDY Page|16
4.3 The History of Public Bicycles
There have been four generations of public use bicycles, beginning with their original implementation in 1964, in Amsterdam. The bicycles in the original experiment were known as the Witte Fiesten or white bikes and were a haphazard supply of several thousand donated bikes, painted white for easy identification within the city (DeMaio, 2008)21. The bikes were left in the streets of Amsterdam for people to use on an honour‐system basis. The bicycles had no locking mechanism and users of the system had no way of knowing where the bikes would be located at any given time.
The white bike program was launched by Luud Schimmelpennink and his radical youth, political group; the Provos (Angell, 1998)22. The Provo’s discussed the possibility of removing all of the motorized vehicles from Amsterdam’s city center and focused their work on provoking violent responses from government using non‐violent bait. Their social experiment quickly deteriorated and many of the bicycles were stolen or found floating in the city’s canals. The program quickly collapsed, but the lessons that were learned from this social experiment are still valuable for organizations looking to implement bike sharing today.
Nearly 30 years later, the second generation of public bikes was launched in Copenhagen, Denmark in 1996. The critical difference between Amsterdam’s white bikes and the Copenhagen system is that the bikes were specially manufactured for the program and had to be picked up and returned at specific locations across the city. The Bycyklen bikes are simple, durable, and conspicuous, and users of the system have the added benefit of knowing where to find the bicycles on a regular basis. In an additional effort to reduce theft, the bicycles were equipped with an integrated coin operated locking system, similar to those used on grocery shopping carts. Although theft is still an issue, the Bycklen are still on the streets of Copenhagen with a total of 2000 bicycles at 110 locations in the city’s core (Bycyklen, 2009)23.
The problem of theft and the lack of user accountability gave rise to the third generation of public bicycles; commonly known as ‘smart bikes’. The first large scale deployment of a smart bike system was in Lyon France, in 2005. The Velo'v was responsible for introducing new technologies to bike sharing including; magnetic swipe cards, computerized terminals and electronic locks, all of which were intended to introduce accountability on behalf of the user. These emerging technologies are now common to all large scale PBS’s and they allow program managers to know the identity of the customer and follow up if the bicycle is not returned. This increased level of security is intended to reduce theft to manageable levels, although some systems still suffer high levels of theft and vandalism, due to poorly engineered locking mechanisms.
Current PBS’s generally use two kinds of locking systems; in the first type, you can get a bicycle from an automated rack by using a special magnetic card. Companies such as Clear Channel, JC Decaux and the Public Bicycle Co. use this technology; with examples in Lyon, Paris and most recently Montreal. In the other type of system, bikes are checked out using an automated locking device, accessed from the customer’s mobile phone. The German national rail company, Deutsche Bahn developed this Call‐A‐Bike system, with examples found in Berlin, London, and the City of Chalon‐Sur‐Saone in Southern France.

UBC PUBLIC BICYCLE SYSTEM FEASIBILITY STUDY Page|17
Figure 4.2.1: The Generations of Bike Sharing
The fourth generation of public bicycles are currently emerging into the marketplace. Thanks to an increased awareness of the benefits of cycling and the need to develop and utilize more sustainable transportation options, bike sharing is growing more rapidly than ever. The new breed of bicycles are more secure, cheaper to install and operated not by advertising companies, but non‐profit or quasi‐government enterprises. Currently, there exists only one example of a fourth generation bicycle sharing system: “BIXI” (a combination of the words bicycle and taxi), located in Montreal Canada and has only been operational since May 12, 2009.
BIXI has raised the bar on earlier generations by utilizing the latest technologies to improve on their flaws; wireless data transmission, solar powered and modular stations, RFID tags and a web 2.0 interface, round out a PBS that has been highly successful since its launch. Users of BIXI have the ability to track their carbon offsets, the amount of gasoline they have saved and their total kilometers travelled; all in an attempt to create ownership over the system, in order to reduce theft and vandalism.

UBC PUBLIC BICYCLE SYSTEM FEASIBILITY STUDY Page|18
4.4 Other Characteristics of Public Bicycle Systems
Public use bicycles differ from typical bicycles in their heavier construction for durability, and use of parts calibrated not to work on other bicycles to enhance theft reduction. They also use an enclosed chain or shaft drive system, to prevent users’ clothes from being caught in the gears. Public use bicycle programs are not a regular bike rental service, they are geared for more short, utiliatarian trips than recreational rides. Providing bicycles is meant to support larger transportation goals, including improving mobility and access, just like any other public transport system or service. Also, their primary purpose is not to generate profit through user fees, “as bike sharing programs are designed to enhance existing transit options, membership rates and use fees are kept low” (NYC, 2009)24.

UBC PUBLIC BICYCLE SYSTEM FEASIBILITY STUDY Page|19
Section 5.0: Is PBS Right for UBC ?
This section summarizes the success factors for the planning and implementation of a public bicycle system and identifies why UBC is an ideal location for implementation of such a system.
5.1 Success factors for Public Bicycles
Will UBC be a good place to create a public bicycle system? Success factors relate to the physical attributes of the proposed location and include its topography, climate, land use and built form, as well the provision of bike infrastructure. Additional success factors are related to the cultural attributes of the location; its acceptance of cycling as an alternative to the car, the transportation patterns of the target user population, quality of public transit service and institutional or governmental commitment to sustainability.
These initial success factors define whether a PBS could work in a specific place. After implementation, another set of success factors will determine whether the PBS will succeed in meeting its goals and achieving desired ridership levels. Operational success factors relate to network configuration and density, maintenance levels, redistribution and the incidence of theft and vandalism. The TransLink Public Bicycle Feasibility Study, the World City Bike Strategies Implementation Guide, as well as the European Commission’s report on public bicycles and the King County Public Use Bike Share Feasibility Study, identify quantitative and qualitative factors critical to the success of a PBS from the planning and operational stages. Table 5.1.1 is an amalgamation of the planning success factors from these sources, including UBC’s rating on these factors.
Table 5.1.1: PBS Planning Success Factors
Factor Description Importance UBC Scorecard
Cycling Infrastructure
KM’s of safe cycling access Demand for cycle parking Plans to extend cycling infrastructure Road condition / maintenance
High High
Cycling Culture Perception of mode / willingness to utilize Commitment to sustainable transportation Vandalism and theft levels
Medium High
Land Use and Transportation Proximity and mixture of uses High demand for one way trips
High High
Weather and Topography Amount of Precipitation Area (km’s) easily cyclable, # of cyclable months/year
Medium Medium
Quality of Public Transit Service Capacity to motivate population to forgo auto trips Ridership and mode split
Medium High
UBC PUBLIC BICYCLE SYSTEM FEASIBILITY STUDY Page|20
Although many of the factors in Table 5.1.1 are qualitative, it is important to keep in mind that important characteristics often do not lend themselves to quantitative comparison. Rather than attempting to limit the evaluation to numeric data, or ignore or conceal the subjective aspects, a preferable approach “does not eliminate subjectivity, but rather makes it explicit, spelling out the basis of the judgment and facilitating discussion of that assessment” (Smith and Theberge, 1987)25. Efforts to force these intangible qualities into a numeric scale can be counterproductive as “certain intangibles lose significance when attempts are made to quantify them” (Fausold and Liliholm, 1996)26. For this reason, it is equally important to consider the relevance of factors such as the Alma Mater Society, Student Union Building Survey results which identify a PBS as the number one choice for enriching student life.
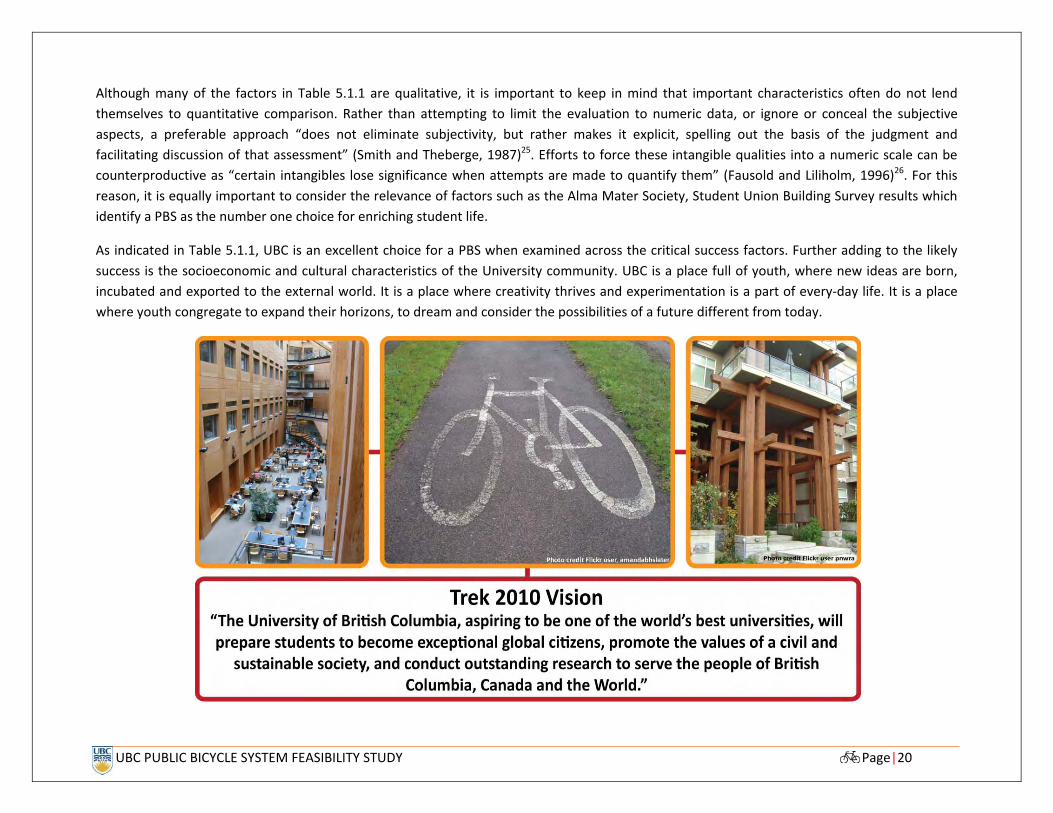
As indicated in Table 5.1.1, UBC is an excellent choice for a PBS when examined across the critical success factors. Further adding to the likely success is the socioeconomic and cultural characteristics of the University community. UBC is a place full of youth, where new ideas are born, incubated and exported to the external world. It is a place where creativity thrives and experimentation is a part of every‐day life. It is a place where youth congregate to expand their horizons, to dream and consider the possibilities of a future different from today.

UBC PUBLIC BICYCLE SYSTEM FEASIBILITY STUDY Page|21
These characteristics point to bike sharing being successful at UBC. Further, the University’s commitment to being a “green” institute; a place where sustainability is not only preached, but practiced, makes bike sharing a practical solution to addressing on‐campus mobility concerns while also advancing the school’s sustainability agenda. Finally, the weather, topography and healthy lifestyle associated with Vancouver and the West coast of Canada, further point to UBC being a successful location for PBS.
5.2 Who Uses Bike Sharing
Cyclists and bike share users tend to share a similar demographic profile, in terms of gender and age (Benson et al., 2009)27. CityRyde; a consulting firm, specializing in public bicycle systems, has identified the defining characteristics of typical PBS users to be: (CityRyde, 2009)28
18 – 34 years of age
High level of education
Require a high level of mobility
Cognizant of environmental and social issues
These characteristics of the typical bike sharing user, bode well for the success of PBS at UBC. There is also some indication that bike share users may encompass a more diverse group than identified by CityRyde. In Paris, a large portion of the users (70%+) said they had never ridden a bicycle in Paris before the introduction of Vélib’ (CityRyde, 2009)29. Unfortunately, there is no strong evidence from North American examples to suggest that bike share programs will have an appeal beyond those who are already regular cyclists.
5.3 UBC’s Culture of Sustainability
The university has made tremendous progress in advancing the sustainability goals of key policy documents, outlined in Section 3.2 of this report. Aggressive actions intended to reduce waste, conserve energy and curb automobile trips, have made UBC a recognized world leader in sustainability. However, opportunities to continue our progress exist and the institution must continue to develop new programs, policies and plans that work towards the vision of Trek 2010 and the goals of the Sustainability Strategy outlined in Table 3.2.1.

UBC PUBLIC BICYCLE SYSTEM FEASIBILITY STUDY Page|22
The UBC community extends well beyond the boundaries of the campus, drawing students, staff and faculty from the Metro region, while the institutes research work and sustainable practices connect us to a global network. The benefits created by a PBS at UBC (see Section 6) will also transcend campus boundaries, effecting the Metro region, Canada and the entire world. As a leader, we have the opportunity and the responsibility to set an example of the highest caliber, one that can be drawn on by our partners who rely upon us to lead by example. By taking action now, UBC can be the first university in Canada to implement a large scale bike sharing system, continuing the tradition of leadership in sustainability.
As seen in Table 5.3.1, the results of the AMS SUB Renewal survey indicate that the students of UBC support the concept of bicycle sharing. 1,360 respondents chose a comprehensive bicycle sharing system as the number one option for enriching student life on‐campus. The opportunity for bicycle sharing has been recognized since the 1997 Campus Plan and has been experimented with via the Bike Co‐op’s Purple and Yellow program, although it has failed to be implemented on the correct scale and with the right technologies. The recent advances in the design and operation of PBS have addressed early failures, making PBS a viable mode of transportation. For UBC and the TREK Program Centre, who are focused on reducing automobile trips and supporting sustainable transportation, the development of a campus wide PBS presents a rare opportunity to showcase UBC’s commitment to sustainability, while simultaneously addressing regional and institutional policy goals.
Table 5.3.1: AMS SUB Renewal Survey Results
These 4 Businesses are Most Important in Terms of 'Enriching Student Life'
1st Choice: 2nd Choice: 3rd Choice: 4th Choice:
N ‐ Grocery store (possibly ethical/sustainable focus) 22.6% (281) 19.9% (243) 14.7% (174) 9.5% (110)
N ‐ Comprehensive bicycle sharing system 35.0% (434) 12.4% (151) 8.9% (105) 7.2% (84)
N ‐ Used book store (general, NOT UBC textbooks) 15.7% (195) 17.9% (219) 11.3% (134) 7.7% (90)
C – Copyright (photocopy & printing) 5.4% (67) 6.5% (79) 8.9% (106) 10.4% (121)
C ‐ Post office 4.0% (50) 6.7% (82) 8.9% (105) 11.3% (131)
N ‐ Thrift store (used clothing, maybe other used goods) 2.5% (31) 8.3% (101) 10.9% (129) 8.5% (99)
N ‐ Hostel (see Q.4) 3.9% (49) 7.2% (88) 6.9% (82) 8.8% (102)
N ‐ Bank (possibly ethical, e.g. Vancity) 2.7% (34) 7.0% (86) 7.6% (90) 7.7% (90)
C ‐ Travel cuts (travel consultation & booking) 2.5% (31) 4.5% (55) 6.7% (80) 10.2% (118)
C – Computer patch (computer repair) 1.9% (23) 3.6% (44) 6.0% (71) 5.9% (69)
C – Lucky 101 (Convenience Store) 1.6% (20) 2.0% (24) 3.1% (37) 5.4% (63)
C – Outpost (stationary) 1.3% (16) 2.3% (28) 3.5% (42) 3.5% (41)
C – On the Fringe (Hair salon) 0.8% (10) 1.7% (21) 2.6% (31) 3.8% (44)
UBC PUBLIC BICYCLE SYSTEM FEASIBILITY STUDY Page|23
The popularity of public bicycles continues to grow, with over 125 cities worldwide now taking advantage of the high‐tech, pollution free and affordable solution to urban congestion and mobility (DeMaio, 2009)30. At the same time, cycling and its associated culture is becoming entrenched in the daily lives of Vancouverites. The bicycle is now viewed among many as a legitimate mode of transportation and a viable alternative to the automobile.
The evidence of cycling’s renaissance in Vancouver is everywhere. In 2009, the Burrad Street Bridge Lane Reallocation Trial was launched (City of Vancouver, 2009)31, The Museum of Vancouver celebrated Vancouver and the Bicycle Revolution via “Velo‐City (MOV,2009)32,” and a 24km multi‐use path; The Central Valley Greenway, opened to cyclists, pedestrians and other active transportation users (TransLink,2009)33. In addition, the City of Vancouver’s Greenest City Team identified bike sharing as a quick start project capable of being implemented before the 2010 Olympics (City of Vancouver, 2009)34. With Vancouver and the world embracing cycling culture and public bicycles, the time for UBC to take action is now.

UBC PUBLIC BICYCLE SYSTEM FEASIBILITY STUDY Page|24
Section 6.0: The Benefits of a Public Bicycle System
This following section will outline the expected benefits of a PBS and indicate who will likely receive them. The typical benefits of PBS fall into several categories, including; transportation, health, the environment, social and economic and will fall upon individual users, UBC, TransLink as well as society at large.
6.1 PBS Benefits Summary
Public Bicycle Systems provide many benefits. They offer convenient mobility for many types of urban trips, provide healthy exercise, and by reducing automobile travel, they can help reduce traffic congestion, road and parking facility costs, consumer costs, energy consumption and pollution emissions (Litman, 2008)35. The primary or direct benefits of a public bicycle system will accrue to the individual users of the system. Secondary benefits of a PBS are less tangible, more challenging to measure and will likely accrue on a macro scale to the University, TransLink and people living in the region. Table 6.1.1 summarizes the expected benefits generated by a PBS and who will likely be the beneficiary.
Table 6.1.1: Benefits of a PBS
Students, Faculty, Staff UBC TransLink Society Increased mobility
choices Improves campus livability Effective first and last
kilometer Improved public health as
increased proportion meeting recommended physical activity levels
Cost effective transportation
Positive public image Promotes multi‐modal trips
Creates green collar jobs
Reduced on‐campus travel times
Supports Green 2010 Winter Olympics
Potential to increase transit ridership
Green house gas savings
Increased health benefits Supports the transportation hierarchy (pedestrian and transit modes)
Extends the reach of transit network
200g less CO2 per km travelled
Increased access to UBC services.
Increases local retail utilization
Improves transit accessibility
Zero emission transportation mode.
Improved access to transit
In line with transportation / sustainability policies
Cost effective UBC graduates will export learned behaviors to society.
On‐campus job creation Increases private bicycle use, makes cycling safer.
Improves transit accessibility
Increases social interaction

UBC PUBLIC BICYCLE SYSTEM FEASIBILITY STUDY Page|25
6.2 Transportation Benefits
On‐campus Mobility
As noted in Section 3, Figure 3.1.1, the design of a built environment has a direct impact on travel behavior (Wegener,1999)36. This relationship is highly evident at UBC, where the original campus plan developed from 1912 to 1914, still has a major impact on the way students, staff and faculty move around the campus. After the creation of 18 successive campus and neighbourhood plans, UBC still bears the marks of the original plans, including; the historic road network, wide boulevards and segregated land uses.
The effect of historic planning decisions, combined with the most recent plans for the 402 hectare campus, that promote public transit usage and discourage private automobile trips, has produced a campus defined by its vastness. As a result of land use and its transportation relationship, walking has become not only the dominant way to move around UBC, but in many ways the only option. The pedestrianized core of the campus; an area entirely restricted to automobiles and not serviced by the TransLink Community Shuttles, further reduces on‐campus transportation options. Students wishing to overcome the lengthy walking times, may choose to bring a bicycle to campus. Sadly, the fear of theft and the lack of bicycle rack capacity on buses, during peak travel times make this option less feasible. A portion of the UBC community does take advantage of the bicycle racks on buses; however these riders represent a small portion of the total demand for bicycles on‐campus, as all buses arriving to UBC can only accommodate two bicycles at a time.
Although, walking brings health benefits to the UBC community, it should not be at the expense of mobility options and reduced utilization of campus services. Students, staff, faculty and especially visitors to UBC, may choose not to take full advantage of the services offered on‐campus. Walking across campus to reach the food services, tourist attractions, or other amenities can be extremely time consuming, making the community and its visitors less likely to utilize them. With improved on‐campus mobility, food services, tourist destinations and other service providers would benefit from increased usage, resulting in greater economic return. A side benefit consistent with UBC’s mission could be cross‐disciplinary interaction resulting from increased social interaction.
On‐campus mobility challenges could be addressed through a large‐scale, self serve PBS. Such a system would significantly improve on‐campus mobility and provide visitors and residents alike with greater transportation options. A PBS can dramatically reduce travel times on‐campus, as the average cycling speed is approximately 3 times faster than walking (Advani and Tiwari, 2006)37. As Figure 6.1.1 indicates, a trip leaving the University Services Building on foot would cover 350 meters in 3 minutes, while a trip leaving on bicycle could cover 948 meters. Reducing travel times creates greater access to on‐campus services, which in turn generates greater demand for the services at UBC.

UBC PUBLIC BICYCLE SYSTEM FEASIBILITY STUDY Page|26
Figure 6.1.1: Time and Distance for Walking and Cycling
*based on walk speed of 7km/hr and bike speed of 19.31 km/hr
Trip Chaining: the first and last Kilometer
Most transit trips begin and end with walking. A typical journey on public transit begins walking out of the home to the closest transit stop. After boarding and riding to a stop, the trip typically ends with a walk to a final destination. A public bicycle system can reduce overall trip times on public transit by replacing walking portions of a trip with cycling. In this way, a PBS can serve as the first and last kilometer of a trip. In Paris,

UBC PUBLIC BICYCLE SYSTEM FEASIBILITY STUDY Page|27
Vélib’ is used to supplement and enhance the existing public transit network; 28% of subscribers using the service to travel from home to a bus stations, another 28% use the system to travel from a subway station to work or school, with the remaining 23% using the system for transferring between buses and subway stations (Velib, 2009)38.
At UBC, a PBS could enhance the attractiveness of public transportation by improving access to the service and reducing travel time to reach transit stations. Permanent residents, as well as students, rely heavily on the bus routes that serve UBC to gain access to goods and services not available on‐campus. By providing campus residents with improved access to transit services, a PBS can help reduce the need for vehicles on‐campus and lead to the development of a car free culture at UBC.
Figure 6.1.2: PBS as the First and Lask Kilometer
For those living in any of UBC’s student residences or residential communities, a PBS would provide exceptional value by providing a fast, reliable and healthy option for reaching public transit. The reduction in travel time to the bus loops, will effectively improve access to all of Vancouver and the entire Metro Vancouver region. Combined with car sharing and other transportation demand management programs, a PBS could dramatically reduce the need for automobiles in the residential communities at UBC. Over time this enhanced network of public transportation could result in fewer automobile trips, less carbon emissions and a reduced number of vehicles on‐campus. In Paris, Vélib’ users report that they are now 46% less likely to use their car for daily mobility, with 18% using the bikes to make trips they otherwise would not have made (Velib, 2009)39.
For transit users terminating their journey at UBC, a PBS will act as the last link in their commute trip. Transit riders will have the ability to transition from trolley or diesel bus, to self serve bicycle, travelling quickly to their final destination. The reduced travel times associated with
UBC PUBLIC BICYCLE SYSTEM FEASIBILITY STUDY Page|28
cycling will be attractive to students who must travel long distances from one classroom to another. The improved speed and access created by a PBS will likely attract new ridership to public transit, further reducing car trips on‐campus.
Improved Way Finding On campus
Introducing a public bicycle system presents an opportunity for UBC to improve way finding on‐campus. Public bicycle station terminals can easily be equipped with a map to display not only the location of other bike stations in the system, but also the entire UBC campus, indicating the location of key services and tourist attractions. Ideally, the density of PBS stations across the campus and their location in relation to transit loops, residences and other major destinations, will ensure that at any location on‐campus, visitors will never be far from a map.
A map and way finding system adds value to a PBS, this would be especially true at UBC, where visitors and new students often find the size and layout of the campus overwhelming and confusing. Evidence from UBC TREK supports this argument, as it is a daily occurrence to have conference delegates, tourists and potential students, visit the office to request directions and a map. The introduction of a PBS, would allow UBC to enhance the tourist experience two‐fold: visitors will have the ability to choose a fast, fun and sustainable mode of transportation and have the added benefit of not getting lost in the process.
Effect on Community Shuttles
A PBS can offer an alternative to the community shuttle service at UBC. By providing a new option for people travelling across campus, the community shuttle will be free to better serve its target demographic; people with mobility impairments, people carrying large or heavy objects, and people walking at night. The UBC community shuttles are intended to provide transportation where typical transit is unsuitable or where demand is not sufficient. However, the community shuttles fail to penetrate the core of the campus, an area that is devoid of transit service and private vehicles. A public bicycle system will allow some users of the community shuttles to reduce their travel times by switching to an alternative mode. The reduction in demand for the shuttle will mean improved access for those who must rely on it as walking and cycling are not options for reaching their destination.
The Effect of Future Transit Investments
In the future, it is expected that UBC will be served by a form of rapid transit that can carry greater numbers of passengers than the existing bus routes. The upgraded transit infrastructure, combined with continued efforts to reduce automobile trips, will result in a greater proportion of the UBC community choosing public transit for their commute trip. The centralized location of transit facilities at UBC, combined with increased ridership levels will compound on‐campus mobility issues. Investment in a PBS now will provide the time necessary for UBC to scale the system up to meet future demand.

UBC PUBLIC BICYCLE SYSTEM FEASIBILITY STUDY Page|29
6.3 Health Benefits
The built environment can be considered an enabler or disabler of public health, as it has a direct effect on transportation choices (see Figure 3.1.1), which in turn directly affect our personal health and the health of society. Environments that promote walking, cycling and other active modes of transportation generate positive health benefits for their residents and society at large (Dora, 1999)40. This is because when walking and cycling are a viable alternative to driving, residents have a greater opportunity to engage in the 30 minutes of moderate physical activity per day, recommended by the Center for Disease Control (Center for Disease Control and Prevention, 2009).41 The health benefits of exercising for a half hour per day, cannot be understated and include halving the risk of developing heart disease – an act equivalent to the effect of not smoking. Even when spread over two or three shorter episodes, this amount of physical activity can also reduce the risk of developing diabetes,
reduce blood pressure, and improve functional capacity (Oja, Pekka et al., 1999). 42
Public bicycles, because they do not require users to own, store or maintain a personal bicycle, tend to introduce new people to bicycling and make bicycling a part of peoples’ lives in new ways. In its first year of operation, 96% of the subscribers to the Velov’s program in Lyon, France had never cycled in the city before. ClearChannel Adshel, the provider of SmartBike in Washington DC, as well as Bicing in Barcelona, found that 45% of their membership used a bike share more than five times per week (NYC, 2009)43. Introducing large new numbers of the population to cycling and having them sustain these physical activities over extending periods of time, will help to achieve the health impacts previously mentioned.
Although UBC’s built environment is semi‐permanent, it is possible to overcome the physical barriers to increased cycling we face, via investments in cycling infrastructure. These investments include, but are not limited to; secure bicycle storage facilities, bike racks, on street bicycle lanes, as well as, end of trip facilities including washbasins and showering facilities. These types of investments enhance a public bicycle system and combined with transportation demand management measures intended to reduce reliance on automobiles, will foster a campus transportation system centered on cycling and other active modes.
Investment in public bicycles will further generate positive health benefits, as they tend to increase the use of both private and public bicycles. Experience in North America and Europe has demonstrated that the introduction of a PBS can have a dramatic and sustained impact on bicycle

UBC PUBLIC BICYCLE SYSTEM FEASIBILITY STUDY Page|30
mode share. In Early 2001, cycling represented about 1% of 10.6 million trips made daily in Paris. Following the introduction of Vélib’, cycling mode share increased 118% ‐ from 1.6 to 3.6% in the span of a few months. Similar results were seen in Barcelona, where mode share rose from 1% to 2% in the first four months of operation (TransLink, 2008).44 Experience from Lyon suggests that a significant increase in private cycling trips (up to 50%) is likely to occur as the public bicycle system acts a door opener to increase the acceptance of cycling an urban transport mode.
Unfortunately, a PBS at UBC is unlikely to have a dramatic impact on the health of students, faculty or staff, as the majority of trips on‐campus are already made by foot. However, residents living in UBC’s new communities could choose to replace car trips to the village and future commercial destinations with bicycle trips, leading to greater amounts of daily physical activity. The greatest health impact for the UBC community will likely accrue to those who shift their commute trip from private automobiles to a combination of public transit and PBS.
Although immediate health effects may not ensue, the exposure to alternative modes of transportation will generate long term health impacts, as the substantial health‐enhancing potential of physical activity can be best realized on a population when people incorporate physical activity into their daily routines (Oja, 1998)45. By providing active transportation options on‐campus, UBC can help foster healthy living habits that will transcend the temporal limits of the typical university experience, leading to long term improved public health.
6.4 Environmental Benefits
An on‐campus PBS will advance the UBC community towards achieving the goals of pollution reduction and making UBC a model sustainable community, as outlined in the 2007 Sustainability Strategy. Currently, the commute patterns to and from UBC represent the institutes second highest source of carbon dioxide emissions, falling only behind the burning of natural gas to power steam operations. As the second largest commuter destination in the Metro Vancouver region, UBC’s contribution to regional air quality and climate change must be taken seriously.

UBC PUBLIC BICYCLE SYSTEM FEASIBILITY STUDY Page|31
Table 6.4.1: UBC’s 2006 Emissions as Reported by the Sustainability Office
Scope Source Total Emissions (Tonnes CO2) Rank
Scope 1 Natural Gas 66,418 1 Oil 455 9 Fleet 2,248 6 Scope 2 Electricity 22,365 3 Scope 3 Buildings 12,012 5
Air Travel 15,385 4 Commuting 25,761 2 Waste 1,065 8 Paper 1,146 7 Fertilizer 149 10
6.5 Social Benefits
The social benefits of a PBS are difficult to quantify, but this does not mean they do not exist. Bicycle sharing, by virtue of improving access to all areas of the UBC campus, increases the likely hood of interaction between all members of the institute. My personal observation in Paris and Montreal indicates that bicycle sharing creates a “buzz.” The bicycles become a topic of conversation in the street as people are curious about where they came from and how to use them. People feel a sense of community about their new street furniture and this translates into social interaction. While in Montreal exploring the BIXI system in the summer of 2009, I had conversations that would not have taken place if I was not on a shared bike. I spoke to a garbage truck driver, towering over me in his truck, as well as curious passerby’s at the station terminals. These conversations provide an opportunity to begin a dialogue around urban transportation, sustainability and health – a conversation that may not take place otherwise. Although these conversations may seem inconsequential, education is the key to changing behavior and therefore the social value of PBS must not be underestimated. At UBC, the opportunity to promote conversation between disparate interests is extremely valuable. As a leading research institute, UBC must foster and incubate new ideas and partnerships. PBS adds to UBC’s ability to spawn new research ideas and this in turn brings economic value to the institute.
6.6 Economic Benefits
The amount of revenue and jobs generated by bike sharing programs is entirely dependent on the program size, its operating model and any additional revenue streams including in the operations, such as advertising on bikes, kiosks or docking stations. In Paris, Vélib’ which has 20,600 bicycles, earned over €30 million in its first year of operations from membership fees alone (NYC, 2009)46. As the costs of the Vélib’ program are
UBC PUBLIC BICYCLE SYSTEM FEASIBILITY STUDY Page|32
covered through advertising revenue, this money goes directly to the city of Paris. Washington DC’s SmartBike program also directs all of the membership fees to the city as revenue, in addition to 30% of advertising revenue, although the small size of the program means that these revenues are much lower than in other systems. Given UBC’s limited on‐campus advertising potential ‐ a product of the campus’s ad‐free nature ‐ it is unlikely that a PBS at UBC will generate large surplus revenue streams. However, the administration fee charged to access the system, combined with the sale of day passes and revenue from trips longer than 30min, will likely make the program revenue neutral, in terms of operational costs. The addition of advertising revenue to a potential UBC system, would have a dramatic effect on the revenue potential of the program and would result in the generation of profit that could be used to fund other capital projects to advance university sustainability objectives.
6.7 Educational Benefits
The presence of a bicycle sharing system at UBC creates opportunities for research projects across a variety of fields. Computer science, urban planning, transportation engineering, environmental studies and health students, among others, will benefit from the opportunity to utilize the PBS to conduct experiments in their fields. Planners and transportation engineers may be interested in how this intervention effects travel patterns, future land use planning and social interaction on‐campus. Students in health fields could use the opportunity to investigate the amount of physical activity students get before and after the introduction of the program. Geographers and students of environmental science, could use the opportunity to study the impact that PBS has on greenhouse gas emissions and how the system could be used to generate carbon credits for a future trading system.
The ability of PBS to attract and retain talented individuals, combined with its ability to foster cross‐disciplinary dialogue, means that a PBS could help the university work towards achieving some of the goals outlined in its Strategic Research Plan. The broad goals from the Strategic Research Plan, that a PBS is most likely to affect include (UBC, 2009)47;
1. Creative innovative ideas and methodologies across disciplines – a PBS will help to foster greater cross disciplinary social interaction. 2. Improve quality of life for Canadian citizens – a PBS at UBC can act as a catalyst to show other western Canadian cities that cycling is a
viable form of urban transportation that can reduce carbon emissions, while improving air quality and public health. 3. Chart a course for society to lead and adapt to rapid technological and social changes – bike sharing is a new phenomena that utilizes
many recent technological breakthroughs, while also facilitating rapid social change. 4. Inform responsible ethical, legal, environmental and public policy – A PBS addresses many areas of public policy in a fiscally responsible
manner. Policies developed at UBC are often exported to other places around the globe, helping to inform the development of responsible public policy worldwide.
UBC PUBLIC BICYCLE SYSTEM FEASIBILITY STUDY Page|33
Section 7: The Financials of a Public Bicycle System
This following section will outline costs associated with implementing a PBS at UBC and will provide examples of operating models currently used worldwide to finance public bicycle systems. The section will outline expected membership levels and will conclude with a financial feasibility model of a proposed PBS at UBC.
7.1 The Information Void
Large scale, mainstream public bicycle systems are a new phenomena. The oldest of the three largest systems in the world; Vélib’, only celebrated its second anniversary in the summer of 2009. Consequently, there is little publicly available data on the capital costs, operating costs, revenues and operating statistics for such systems. JC Decaux and Clear Channel, two of the largest suppliers of PBS worldwide, have consistently declined to share information about capital and operating costs, as they are competing to win contracts worldwide for new systems. Thankfully, the information void is slowly being filled by researchers collecting new information and refining existing data. The market has responded to the PBS boom and new vendors as well as consultants on PBS are emerging on what seems like a daily basis.
One important company to arise in the last year is the Public Bike System Co., a non‐profit organization spun off from Stationement De Montreal, the parking regulator for the City of Montreal who was mandated to design, build and operate a PBS one year ago. The Public Bike System Co. is responsible for the launch of Canada’s first PBS and the world’s 3rd largest system – the award winning “BIXI”. Due to the quasi‐governmental, non‐profit nature of the company, the PBS Co. has been willing to share critical information about BIXI. To date they have provided UBC with cost information, station planning information, as well as a tour of their facilities in Montreal.
In the past year, I have had the opportunity to interact and build relationships with several of the PBS technology providers and consultants, including; BIXI, JC Decaux, TransDev, Veolia Transport, CityRyde, EcoPlan International and UBC’s own Bike Co‐op. Directed studies, internships and research appointments have provided opportunities to travel to France and Montreal to study the various PBS systems first‐hand. Additionally, I have invested many hours exchanging information with PBS program operators at conferences, online webinars, and via email to obtain accurate information on program costs and station planning. These first‐hand experiences proved invaluable in obtaining the information required to successfully model the finances of a PBS for UBC.
7.2 Typical Costs of a PBS
The cost for setting up and operating a PBS service depends very much on the size of the service and the scheme chosen. In general the majority of solutions are not financially self sufficient and typically need to be financially backed by a large transport operator or by public resources. In many cases a public‐private‐partnership between an outdoor advertising company and a local authority is established. A billboard company

UBC PUBLIC BICYCLE SYSTEM FEASIBILITY STUDY Page|34
receives the right to use specific public spaces for advertisements and in return implements and operates a PBS (i.e.: Clear Channel, JC Decaux), which can raise the issue of foregone revenue for the local authority. Cities can also buy a PBS “off‐shelf” from providers that offer the technology, these programs typically aim at being self financing through advertisements on the bicycles.
Typically there are four major cost associated with a PBS:
1. Direct capital costs for producing and installing the system (bicycles and terminals) 2. Direct operating costs for running the system (staff, IT support, etc.) 3. Associated capital costs for building cycling infrastructure and needed streetscape improvements (bicycle lanes and station area
improvements) 4. Associated operating costs for maintaining the on‐road cycling and docking station infrastructure (bicycle maintenance).
Cost information was provided to UBC TREK on a per bike basis, including the cost of any necessary supporting station infrastructure. Both, Veloia Transport who operate the campus‐based PBS known as ”GreenBike” at St. Xavier Univeristy in Chicago using their OY Bike Technology, as well as The Public Bicycle System Co., who operate the BIXI program in Montreal provided cost estimates to UBC. The cost information was provided based on a “turn‐key” installation scenario in which the supplier would be responsible for all aspects of the program’s operation, including; IT and call center support, maintenance and redistribution. These costs, outlined in Table 7.2.1 also include a 10% contingency for theft and vandalism.
Table 7.2.1: Range of Costs for a Public Bicycle System
PBS SupplierCosts Veolia Transport ‐ “Oy Bike” Public Bicycle System Co. ‐ “BIXI”
Capital Cost / Bike $2,500 $4,000Operation Cost / Bike / Year $600 – $1,500 $1,000 – $1,250
A dramatic difference exists in the price per bike between the two referenced vendors of a PBS. It is important to note that price is directly related to the quality of the system and the ability of the vendor to provide the necessary support to operate the system. In the case of BIXI the increased price can be directly attributed to the design and build quality of the bicycles and stations, the technologies used in the system, and its ability to attract ridership based on these characteristics. In the current market, the ability of a high quality design to attract customers must not be underestimated. Consider, for example, the value that high quality design has brought to consumer goods such as Apple’s iPod, which dominates its competitors and is now synonymous with the words “MP3 player”.
Although some PBS are more expensive than others, a good argument for making the greater initial investment exists. Investing in a high quality system up front will likely prove worthwhile over the long term, as it will provide cost savings with regard to theft, maintenance, operations and

UBC PUBLIC BICYCLE SYSTEM FEASIBILITY STUDY Page|35
the ability to attract increased ridership. The value in high quality design is becoming evident, as BIXI becomes an increasingly preferred vendor worldwide. As of the summer of 2009, BIXI is slated to develop systems in Minneapolis, Boston and London. More than any other system, BIXI has been recognized as outstanding, winning numerous awards, including a Bronze in the Transportation category of the 2009 International Design Excellence Awards (IDEA), a Gold award for best product of 2009 in the Energy and Sustainability category of the Edison Best New Products Awards, and a ranking of 19th in Time magazines 50 Best Inventions of 2008 (BIXI, 2009)48. For this reason, all cost estimates in this document are based on BIXI figures.
7.3 Expected Ridership at UBC
Estimating the ridership for a large‐scale PBS at UBC is the necessary first step in determining program costs and expected revenue, as both are directly related to number of subscribers. Table 7.3.1 below, shows the total number of estimated annual and daily members classified by their choice of transportation mode to UBC and including the campus’s residential population. An examination of subscription rates in other PBS worldwide has led to the conclusion that students, faculty and staff who live on campus will be most likely to take advantage of PBS, followed by those who arrive on public transit. The thousands of visitors who come to UBC every year will also play an important role in generating revenue for the system via the sale of daily memberships. The target percentages for annual and daily membership were developed after consulting with PBS providers in Paris, Montreal and Chicago and from ridership estimates made by New York City and King County Washington, in their own feasibility studies. The membership targets used in the UBC model are considered conservative and moderate when compared to existing systems worldwide.
Table 7.3.1: Estimated Annual and Daily Membership
Targeted Population (per annum)
Population Size*
Annual Membership Target Percentage
Total Annual Members
Daily Membership Target Percentage
Total Daily Members
Live on Campus 11,000 6% 660 6% 660
Transit 22,000 6% 1,320 6% 1,320
Carpool / Vanpool 8,000 3% 240 3% 240
SOV 18,500 3% 555 1% 185
Walk 8,000 1% 80 1% 80
Tourists 126,857 0% 0 1% 1,269
Total Members 2,855** 3,754
*Population values from ** In year one, this figure was reduced to 75% of its total = to 2,141 to account for program uptake.

UBC PUBLIC BICYCLE SYSTEM FEASIBILITY STUDY Page|36
7.4 Capital Costs for PBS at UBC
The total capital cost for UBC to implement a PBS will be based on the price of investing in the bicycles and stations over the proposed ten year period. In order to make an accurate estimation of the capital costs, the number of subscribers per bicycles had to be determined. The technical planning team from BIXI provided details on their own planning process, which suggested using a value of between 10 and 15 subscribers per bicycle; having used a value of 13 when planning for the highly successful Montreal system. A sensitivity analysis indicated that this value was critical to the costs of the program, with capital costs rising sharply when the ratio of members to bicycles decreases below 13:1. The following capital cost estimates for UBC are therefore based on a value of 13 subscribers per bicycle. At this ratio, capital costs are kept low and program subscribers will be ensured access to a large number of bicycles at any given time.
For UBC to deploy a high quality PBS, based on the ratio of 13 subscribers per bicycle, with a projected first year annual membership of 2,141 and capital costs equal to $4000 per bicycle (including stations), the total capital cost in year one will be $700,024, including the cost of transporting the bicycles to UBC. In year two a second major capital investment in bicycles will be required, as membership is expected to reach its full potential. In year two an additional $233,341 will be required. After the second year of operations, the program will have a fleet of 220 bicycles and an expected annual membership of 2,855. Table 7.4.1 shows the expected capital costs in the first ten years of the program, which are equal to $1,030,511. It is expected that ongoing capita investment will be required in the later years of the program to ensure the ratio of subscribers to bicycles stays in balance. It is recommended that these long‐term investments be made in bulk to achieve any possible economies of scale.
Table 7.4.1: Estimated Capital Costs of PBS at UBC
Capital Expenses
Year 1 2 3 4 5 6 7 8 9 10
# of Bikes in System 165 220 220 220 220 220 242 242 242 242
# of Bikes Required 165 220 224 228 233 238 242 247 252 257
New Bikes Required 48 4 4 5 5 5 4 5 5
# of Bikes to Order 143 48 0 0 0 0 24 0 0 0
Total Bike and Station Cost $ (658,846) $ (219,615) 0 0 0 0 $91,431 0 0 0 Total Capital Cost (Including Transportation)
$ (700,024) $ (233,341) 0 0 0 0 $(97,145) 0 0 0
Ten Year Total Capital Cost $1,030,511

UBC PUBLIC BICYCLE SYSTEM FEASIBILITY STUDY Page|37
7.5 Operating Costs of PBS at UBC
The cost of operating a PBS at UBC will be equal to a maximum of $1,250 per bicycle, per year. This value was provided by BIXI staff and represents the cost of purchasing a PBS as a full “turn‐key” operation. This implies that UBC would not perform any maintenance, redistribution or back‐end IT operations on the system, instead contracting out all operations to the PBS manufacturer or a management company. Given that the University is mandated to engage students and create jobs, it is likely that the cost of operating the program will be less than $1,250 per bicycle, per year, as students could be employed to perform some of the functions normally performed by the contracted maintenance team.
However, for the purpose of this report and to show the maximum expected costs, the assumption is being made that UBC will purchase the program as a full turn‐key operation. With 165 bicycles in the program in the first year of implementation, operational costs are equal to $205,889. Over time, operational costs will rise with the rate of inflation and with the increasing number of bicycles in the system, as reflected in Table 7.2.4. However, it is likely that operational costs may decrease on a per capita basis, as the university and the program operators become more efficient in managing the PBS.
Table 7.2.4: Estimated Operational Costs of PBS at UBC
Operating Expenses
Year 1 2 3 4 5 6 7 8 9 10
Maintenance Cost/Bike/Year $1,250 $1,263 $1,275 $1,288 $1,301 $1,314 $1,327 $1,340 $1,354 $1,367
# of Bikes 165 220 220 220 220 220 242 242 242 242
Operating Expense/Year $(205,889) $(277,264) $(285,638) $(294,264) $(303,151) $(312,306) $(321,738) $(331,454) $(341,464) $(351,776)
7.6 Operating Revenue of PBS at UBC
Operating revenue in a typical PBS covers 2/3 of the operating costs, however a PBS at UBC can likely cover more than this if subscription fees follow the same model used in the BIXI system. The financial model used for this report takes into account both annual and daily membership revenues, but does not account for monthly subscriptions, as appropriate data for modeling monthly subscriptions was not available. The fee structure that was used to calculate the operating revenue was based on a price of $75 for a yearly subscription and $5 for 24 hour access. Any membership to the system will provide unlimited 30 min trips, with trips over 30 min charged an additional $1.50. For the next 30 minute period the price rises to $3.00, then to $6.00 for any and all subsequent 30 minute periods. This pricing scheme encourages the bicycles to be used for short trips, ensuring a high number of bicycles are always available to subscribers. In the operating revenue model below, I assumed that 3% of all trips generated would be longer than 30 min (5% of all trips are longer than 30 min in Paris) and charged these trips an additional $1.50. Trips extending for additional 30 minute periods were not modeled as reliable data to estimate the frequency of these trips was not available.

UBC PUBLIC BICYCLE SYSTEM FEASIBILITY STUDY Page|38
Table 7.6.1: PBS Operating Revenue
Operating Revenue (Membership and User Fees Only)
Year 1 2 3 4 5 6 7 8 9 10
Daily Membership Revenue
$18,768 $19,143 $19,526 $19,917 $20,315 $20,721 $21,136 $21,558 $21,989 $22,429
Annual Membership Revenue
$160,594 $214,125 $218,408 $222,776 $227,231 $231,776 $236,411 $241,140 $245,962 $250,882
Revenue from Trips Over 30 min
$77,872 $103,830 $105,906 $108,024 $110,185 $112,389 $114,636 $116,929 $119,268 $121,653
Total Operating Revenue
$257,234 $337,098 $343,840 $350,717 $357,731 $364,886 $372,183 $379,627 $387,220 $394,964
Total Operating Cost $(205,889) $(277,264) (285,638) $(294,264) $(303,151) $(312,738) $(321,738) $(331,454) $(341,464) $(351,776)
Net Operating Revenue $51,344 $59,834 $58,202 $56,453 $54,580 $52,580 $50,446 $48,173 $45,756 $43,188
As Table 7.6.1 illustrates, a PBS at UBC could cover its operating costs based solely on revenue from subscriptions and user fees. The surplus revenue generated from operations, would in turn contribute to paying down the capital expense of the project. Table 7.6.2, shows the expected cash flows in the program and indicates that the capital investment of $1,030,511 made over during the 10 year modeling period, cannot be repaid in its entirety when user fees and subscriptions are the only revenue source. Net revenue from operations will only be able to pay back 51% of the capital investment, equal to $520,554, or an average of $52,055 per year. It is important to note however, that payback of the program’s capital expense could be dramatically enhanced in one of several ways; introducing an advertising component to the system, securing a corporate sponsorship to contribute to the capital cost or by applying for program funding from Provincial and Federal sustainable transportation initiatives, which could reduce capital or operating expenses.
Table 7.6.2: Cash Flow Analysis
Cash Flow Analysis
Year 1 2 3 4 5 6 7 8 9 10
Starting Balance N/A $(648,680) $(822,187) $(763,985) $(707,533) $(652,953) $(600,373) $(647,073) $(598,900) $(553,144)
Capital Cost $(700,024) $(233,341) $0 $0 $0 $0 $(97,145) $0 $0 $0
Operating Cost $(205,889) $(277,264) $(285,638) $(294,264) $(303,151) $(312,306) $(321,738) $(331,454) $(341,464) $(351,776)
Operating Revenue $257,234 $337,098 $ 343,840 $350,717 $357,731 $364,886 $372,183 $379,627 $387,220 $394,964
Cash Flow $(648,680) $(822,187) $(763,985) $(707,533) $(652,953) $(600,373) $(647,073) $(598,900) $(553,144) $(509,956)

UBC PUBLIC BICYCLE SYSTEM FEASIBILITY STUDY Page|39
The majority of public bicycle systems world‐wide rely on some form of advertising to supplement the revenue generated from user fees and subscriptions. Some PBS, like Vélib’ are almost entirely funded in this way, while others use advertising to top up revenue. A financial sensitivity analysis revealed that if minimal amounts of advertising were introduced into a PBS at UBC, it would be possible for the program to become revenue neutral or better. Adding greater amounts of advertising would allow the program to generate a surplus that could be used to invest in other sustainable initiatives across campus. Table 7.6.3 shows a financial scenario with incorporated advertising. For the purpose of this model, the rate charged for advertising space per month is equal to the cost of renting out the “Mega‐Lit” billboards located in the Student Union Building; $1200 per month. In order to become revenue neutral, the PBS program would require 4 advertising spaces, being utilized for 12 months per year. Under this scenario, the operating revenue would be increased by $60,000 per year.
Table 7.6.3: Potential Revenue from Advertising
Cash Flow Analysis for a Limited Advertising Scenario
Year 1 2 3 4 5 6 7 8 9 10
Starting Balance N/A $(588,680) $(702,187) $(583,985) $(467,533) $(352,953) $(240,373) $(227,073) $(118,900) $(13,144)
Capital Cost $(700,024) $(233,341) $0 $0 $0 $0 $(97,145) $0 $0 $0
Operating Cost $(205,889) $(277,264) $(285,638) $(294,264) $(303,151) $(312,306) $(321,738) $(331,454) $(341,464) $(351,776)
Net Operating Revenue $111,344 $119,834 $118,202 $116,453 $114,580 $112,580 $110,446 $108,173 $105,756 $103,188
Cash Flow $(588,680) $(702,187) $(583,985) $(467,533) $(352,953) $(240,373) $(227,073) $(118,900) $(13,144) $90,044
Figure 7.6.1 and 7.6.2: Examples of PBS Based AdSpace and OnBike Corporate Sponsorship

UBC PUBLIC BICYCLE SYSTEM FEASIBILITY STUDY Page|40
Section 8: Conclusion
This section summarizes the findings outlined in previous sections and provides conclusions on the feasibility of a PBS at UBC. Recommendations for implementing a public bicycle system are also presented for further consideration.
8.1 Triple Bottom Line Assessment
The purpose of the triple bottom line value system is to equally weight the social, environmental and economic dimensions of a decision. This ensures equality for people, the planet and profit. Throughout this report, each dimension of the triple bottom line assessment has been discussed and evaluated in detail. A summary assessment follows:
Social
The social component of the triple bottom line assessment is often the most contentious, as the human element introduces a great degree of subjectivity. Nonetheless, when broadly considering the social impact of a public bicycle system at UBC, the benefits are excellent. Everyday, students will benefit from improved mobility, increased physical activity as well as the increased social interaction and sense of community that bike sharing can generate. Further, the increased social interaction and improved accessibility of all parts of the campus could have a positive impact on the universities goal to promote cross‐disciplinary research.
One goal of the university is to expose students to new ideas and to instill the values of a civil and sustainable society. By implementing a public bicycle system, the university can increase the chances that graduates will make sustainable transportation choices after leaving the UBC community. The impact of society’s collective transportation decisions directly affects public health, climate change and environmental degradation. For this reason it is important to expose students to a lifestyle built around sustainable transportation options. By implementing a PBS, UBC can have a direct and positive impact on society.
Environmental
A public bicycle system at UBC could be implemented with limited to no long‐term environmental impact, given its ability to be solar powered and installed without “breaking‐ground”. Further adding to the positive outcomes of bike sharing is its ability to change the transportation behaviours of commuters arriving to UBC. By extending the reach of the public transit network and acting as the first and last leg in public transit trip, PBS can encourage fewer drivers to bring their automobiles to UBC. By reducing the number of car trips to and from UBC, the institute can reduce its carbon footprint associated with commuting. With a relatively low impact to the environment, likely green‐house gas reductions and the promotion of an environmentally sustainable transit mode, the assessment is clear: the environmental benefits of PBS are excellent.

UBC PUBLIC BICYCLE SYSTEM FEASIBILITY STUDY Page|41
Economic
As seen in section 7, there are many variables that will affect the economic performance of a bike sharing system. Nonetheless, assuming the predictions made in this report are moderate and reasonable, the economic benefits of a public bicycle system can be considered to be moderate. Without external funding or sponsorship, and based solely on the revenue from subscriptions and user fees, a PBS at UBC will not generate surplus, instead it will cost the university and average of $52,055 per year to install and operate.
However, by introducing minimal amounts of advertising or finding a corporate sponsor, UBC can easily turn the bike sharing system into a revenue generator which could be used to fund other sustainable initiatives across the campus. By introducing only four, bus‐shelter size ad spaces at key PBS stations the program can easily generate an additional $60,000 in operating revenue. This minor change creates enough additional revenue that the full capital investment can be paid back within a 10 year time span. After the first 10 years of operation, the revenue generated by the system would become available to finance new capital projects that further contribute to the social and environmental goals of UBC.
In conclusion, the triple bottom line assessment of a public bicycle system at UBC is good overall. There are excellent benefits relating to the social and environmental aspects of a PBS, although the current assessment of the economic impact reveals that the program will not generate more than a moderate economic return.
8.2 Recommendations
This report has investigated the feasibility of a public bicycle system at UBC. In order to advance the potential of developing a PBS at UBC, the following recommendations should be taken.
1. Conduct a transportation survey or diary intended to identify on‐campus transportation patterns. Having this information will aid in the implementation of a PBS, by informing the location and capacity of stations across campus, as well as the program’s boundaries.
2. Submit the report to Campus and Community Planning at UBC for further consideration.
3. Pending support for further investigation of PBS, engage internal and external stakeholders in discussion. This should include but not be limited to municipalities and others who may be interested in PBS, such as the City of Vancouver, TransLink and UBC’s own Bike Coop.
4. Draft an RFP and engage a PBS provider to obtain full details on financial arrangements, station planning and operations management. Request the development of an implementation plan, including full details on project scope and phasing.

UBC PUBLIC BICYCLE SYSTEM FEASIBILITY STUDY Page|42
5. Prior to launch identify a suitable funding source and any opportunities for external funding.
6. Pending a completed implementation plan, develop the proper education and promotion campaign through the UBC TREK Program
Centre. Ensure the launch date coincides with the beginning of the academic school year to capitalize on student energy and the opportunities for promotion. Ensure the launch date includes media attention and a celebration of UBC’s advancement in sustainable transportation.

UBC PUBLIC BICYCLE SYSTEM FEASIBILITY STUDY Page|43
References 1The University of British Columbia. (2008). UBC Archives – University History – General History: A Brief History of UBC.
Online: http://www.library.ubc.ca/archives/hist_ubc.html
2 The University of British Columbia. (2009). University Town. U‐Town Library, FAQ’s: the Basics Online: http://www.universitytown.ubc.ca/library_faq.php
3The University of British Columbia. (2009). Fall 2008 Transportation Status Report. UBC TREK Online: http://www.planning.ubc.ca/corebus/pdfs/TSR_Fall2008_6Feb09.pdf
4 The University of British Columbia. (2009). Fall 2008 Transportation Status Report. UBC TREK Online: http://www.planning.ubc.ca/corebus/pdfs/TSR_Fall2008_6Feb09.pdf
5 The University of British Columbia. (2006). Climate Action Plan: UBC GHG Emissions Inventory. Online: http://www.sustain.ubc.ca/pdfs/2006UBC_GHG.pdf
6 The University of British Columbia. (2006). Climate Action Plan: UBC GHG Emissions Inventory Online: http://www.sustain.ubc.ca/pdfs/2006UBC_GHG.pdf
7 The University of British Columbia. (2009). Fall 2008 Transportation Status Report. UBC TREK Online: http://www.planning.ubc.ca/corebus/pdfs/TSR_Fall2008_6Feb09.pdf
8 The University of British Columbia. (2009). Fall 2008 Transportation Status Report. UBC TREK. Online: http://www.planning.ubc.ca/corebus/pdfs/TSR_Fall2008_6Feb09.pdf
9 The University of British Columbia. (2009). UBC Facts and Figures (2008/2009). UBC Public Affairs. Online: http://www.publicaffairs.ubc.ca/ubcfacts/index.html
10 The University of British Columbia. (2007) Access and Movement Study. Campus and Community Planning. Online: http://www.planning.ubc.ca/corebus/pdfs/pdf‐landuse/VCP_AccessMovement.pdf
11 The University of British Columbia. (2009). Fall 2008 Transportation Status Report. UBC TREK. Online: http://www.planning.ubc.ca/corebus/pdfs/TSR_Fall2008_6Feb09.pdf
12 Winters, M., Cooper A. (2008). What Makes a Neighbourhood Bikeable. TransLink and the University of British Columbia. Online: http://www.cher.ubc.ca/cyclingincities/pdf/WhatMakesNeighbourhoodsBikeable.pdf
13 Frank, Lawrence. (2007). Urban form, travel time, and cost relationships with tour complexity and mode choice. Transportation Journal. Online: http://www.springerlink.com/content/9228326786t53047/fulltext.pdf

UBC PUBLIC BICYCLE SYSTEM FEASIBILITY STUDY Page|44
14 Wegener, Michael. (1999). Land‐Use Transport Interaction: State of the Art. Dortmund, November 1999 Online: http://129.3.20.41/econ‐wp/urb/papers/0409/0409005.pdf
15 NYC Dept. City Planning. (2009). Bike‐Share Opportunities in New York City. New York City: New York City Department of City Planning Online: http://www.nyc.gov/html/dcp/pdf/transportation/bike_share_complete.pdf
16 TransLink, (2008). TransLink Public Bicycle Feasibility Study. Online: http://www.translink.ca/site‐info/document‐library‐result.aspx?id={0044F9A5‐BECB‐4C4D‐9FD0‐E3D32D8E9A7F}|{D191F5C3‐2E4D‐4937‐9EDC‐578A1FC50285}|{6B6CD0F7‐D14F‐4C72‐BDFC‐A9DA1E4C3919}|{A7685FAD‐DB49‐43D5‐AC93‐C5BF73CA5061}|{9AC16684‐25D3‐4938‐9C83‐07EB6DBA83CE}&ref={48F61830‐22A1‐4F90‐804A‐83C0C9A9D367}
17DeMaio, P. and Gifford, J.(2004). Will Smart Bikes Succeed as Public Transportation in the United States? Journal of Public Transportation, 2004 – Center of Urban Transport Research. Online: http://www.nctr.usf.edu/jpt/pdf/JPT%207‐2.pdf#page=6
18 TransLink, (2008). TransLink Public Bicycle Feasibility Study. Online: http://www.translink.ca/site‐info/document‐library‐result.aspx?id={0044F9A5‐BECB‐4C4D‐9FD0‐E3D32D8E9A7F}|{D191F5C3‐2E4D‐4937‐9EDC‐578A1FC50285}|{6B6CD0F7‐D14F‐4C72‐BDFC‐A9DA1E4C3919}|{A7685FAD‐DB49‐43D5‐AC93‐C5BF73CA5061}|{9AC16684‐25D3‐4938‐9C83‐07EB6DBA83CE}&ref={48F61830‐22A1‐4F90‐804A‐83C0C9A9D367}
19 MetroBike LLC. (2009). The Bike Sharing Blog. Online: http://bike‐sharing.blogspot.com/search?updated‐max=2009‐07‐01T10%3A23%3A00‐04%3A00&max‐results=10
20 DeMaio, Paul. (2008). The Bike Sharing Phenomena. Carbusters # 36, Nov 2008 – Feb 2009 Online: http://www.metrobike.net/index.php?s=file_download&id=16
21 DeMaio, Paul. (2008). The Bike Sharing Phenomena. Carbusters # 36, Nov 2008 – Feb 2009 Online: http://www.metrobike.net/index.php?s=file_download&id=16
22 Angell, Elizabeth. (1998). Luud Schimmelpennink. Luud Schimmelpennink – Advocates Forum. Taken from: Newsweek, Nov. 10, 1998. Online: http://ecoplan.org/advocates/l‐schimmelpennink‐bio.htm
23Fonden Bycyklen (2009). News and Facts. Den officielle hjemmeside for Bycyklen. Online: http://www.bycyklen.dk/english/newsandfacts.aspx
24 NYC Dept. City Planning. (2009). Bike‐Share Opportunities in New York City. New York City: New York City Department of City Planning Online: http://www.nyc.gov/html/dcp/pdf/transportation/bike_share_complete.pdf

UBC PUBLIC BICYCLE SYSTEM FEASIBILITY STUDY Page|45
25 Smith, P.G., and Theberge, J.B. (1987). Evaluating Natural Areas Using Multiple Criteria: Theory and Practice. Environmental Management, 11(4), 447‐460.
26 Fausold, C. and Lilieholm, R. (1996). The Economic Value of Open Space. Land Lines, September
27 Benson, et al. (2009). Public Use Bike Share Feasibility Study for King County, Washington. The University of Washington and King County. Online: http://drop.io/king_county_bike_share_report
28 CityRyde, (2009). Bicycle Systems Worldwide: Selected Case Studie. CityRyde LLC, Philadelphia, PA Online: http://www.cityryde.com/reports/
29 CityRyde, (2009). CityRyde Bikesharing Informational Webinar – May 11, 2009. Philadelphia, PA,
30 DeMaio, Paul. (2009). Oh Yes, OBIS! The Bike‐sharing Blog Online: http://bike‐sharing.blogspot.com/2009/08/o‐yes‐obis.html
31 The City of Vancouver. (2009). Burrard Bridge Lane Reallocation Trial. Online: http://vancouver.ca/projects/burrard/index.htm
32 The Museum of Vancouver. (2009). Velocity: Vancouver and the Bicycle Revolution. MOV Online: http://www.museumofvancouver.ca/exhibition.php?id=6
33 Translink. (2009). Cycling: Metro Vancouver: Central Valley Greenway. Online: http://www.translink.ca/en/Cycling/Central‐Valley‐Greenway.aspx
34 The City of Vancouver. (2009). Greenest City: Quick Start Recommendations. Online: http://vancouver.ca/greenestcity/PDF/greenestcity‐quickstart.pdf
35 Litman, Todd. (2008). Public Bike Systems: Automated Bike Rentals for Short Utilitarian Trips. TDM Encyclopedia, Victoria Transport Policy Institute. Online: http://www.vtpi.org/tdm/tdm126.htm
36 Wegener, Michael. (1999). Land‐Use Transport Interaction: State of the Art. Dortmund, November 1999 Online: http://129.3.20.41/econ‐wp/urb/papers/0409/0409005.pdf
37 Advani, Mukit., and Tiwari, Gateem. Bicycle as Feeder Mode for Bus Service. TRIPP/IIT‐Delhi, India
Online: http://web.iitd.ernet.in/~tripp/publications/paper/planning/mukti_VELO06%20paper.pdf
38 Vélib’. (2009). Newsletter Vélib’ Juin 2009 ‐ #22: Bientot 2 ans: Votre Opinion sur le service! Online: http://www.Vélib’.centraldoc.com/newsletter/22_bientot_2_ans_d_utilisation_votre_regard_sur_le_service

UBC PUBLIC BICYCLE SYSTEM FEASIBILITY STUDY Page|46
39 Vélib’, (2009). Newsletter Vélib’ Juin 2009 ‐ #22: Bientot 2 ans: Votre Opinion sur le service! Online: http://www.velib.centraldoc.com/newsletter/22_bientot_2_ans_d_utilisation_votre_regard_sur_le_service
40 Dora. Carlos, (1999). A Different Route to Health: Implications of Transport Policy. BMJ 1999, 318, 1686‐9 Online: http://www.bmj.com/cgi/content/full/318/7199/1686
41 Center for Disease Control and Prevention, (2009). Physical Activity for Everyone. How Much Physical Activity do Adults Need? Online: http://www.cdc.gov/physicalactivity/everyone/guidelines/adults.html
42 Oja, Pekka et al., (1999). Daily walking and cycling to work: their utility as health‐enhancing physical activity. UKK Institute for Health Promotion Research Online: http://www.sciencedirect.com/science?_ob=ArticleURL&_udi=B6TBC‐3YN3PD5‐C&_user=1022551&_rdoc=1&_fmt=&_orig=search&_sort=d&_docanchor=&view=c&_acct=C000050484&_version=1&_urlVersion=0&_userid=1022551&md5=633fd217ac31abd57f7c82c3bb393b66
43 NYC Dept. City Planning. (2009). Bike‐Share Opportunities in New York City. New York City: New York City Department of City Planning Online: http://www.nyc.gov/html/dcp/pdf/transportation/bike_share_complete.pdf
44TransLink, (2008). TransLink Public Bicycle Feasibility Study.
Online: http://www.translink.ca/site‐info/document‐library‐result.aspx?id={0044F9A5‐BECB‐4C4D‐9FD0‐E3D32D8E9A7F}|{D191F5C3‐2E4D‐4937‐9EDC‐578A1FC50285}|{6B6CD0F7‐D14F‐4C72‐BDFC‐A9DA1E4C3919}|{A7685FAD‐DB49‐43D5‐AC93‐C5BF73CA5061}|{9AC16684‐25D3‐4938‐9C83‐07EB6DBA83CE}&ref={48F61830‐22A1‐4F90‐804A‐83C0C9A9D367}
45 Oja, Pekka et al., (1999). Daily walking and cycling to work: their utility as health‐enhancing physical activity. UKK Institute for Health Promotion Research Online: http://www.sciencedirect.com/science?_ob=ArticleURL&_udi=B6TBC‐3YN3PD5‐C&_user=1022551&_rdoc=1&_fmt=&_orig=search&_sort=d&_docanchor=&view=c&_acct=C000050484&_version=1&_urlVersion=0&_userid=1022551&md5=633fd217ac31abd57f7c82c3bb393b66
46 NYC Dept. City Planning. (2009). Bike‐Share Opportunities in New York City. New York City: New York City Department of City Planning Online: http://www.nyc.gov/html/dcp/pdf/transportation/bike_share_complete.pdf
47 UBC, (2009). UBC Research Summary: Strategic Research Plan Online: http://www.research.ubc.ca/Uploads/Docs/UBC%20RESEARCH%20SUMMARY_12_01_08.pdf
48 BIXI, (2009). BIXI News. Online: http://montreal.bixi.com/news