Title Page Doc 2 - PEP-NET · PDF file9 Carré F.X. Lemieux Lévis, Québec,...
131
Multidimensional Poverty Technical Appendices LOUIS-MARIE ASSELIN This document has been produced with the financial support of the MIMAP programme, IDRC, Canada. Institut de Mathématique Gauss 9 Carré F.X. Lemieux Lévis, Québec, Canada G6W 1H2 418 837 1139 [email protected] IMG
Transcript of Title Page Doc 2 - PEP-NET · PDF file9 Carré F.X. Lemieux Lévis, Québec,...

Multidimensional Poverty
Technical Appendices
LOUIS-MARIE ASSELIN
This document has been produced with the financial support of the MIMAPprogramme, IDRC, Canada.
Institut de Mathématique Gauss9 Carré F.X. LemieuxLévis, Québec, Canada G6W 1H2418 837 [email protected]
IMG

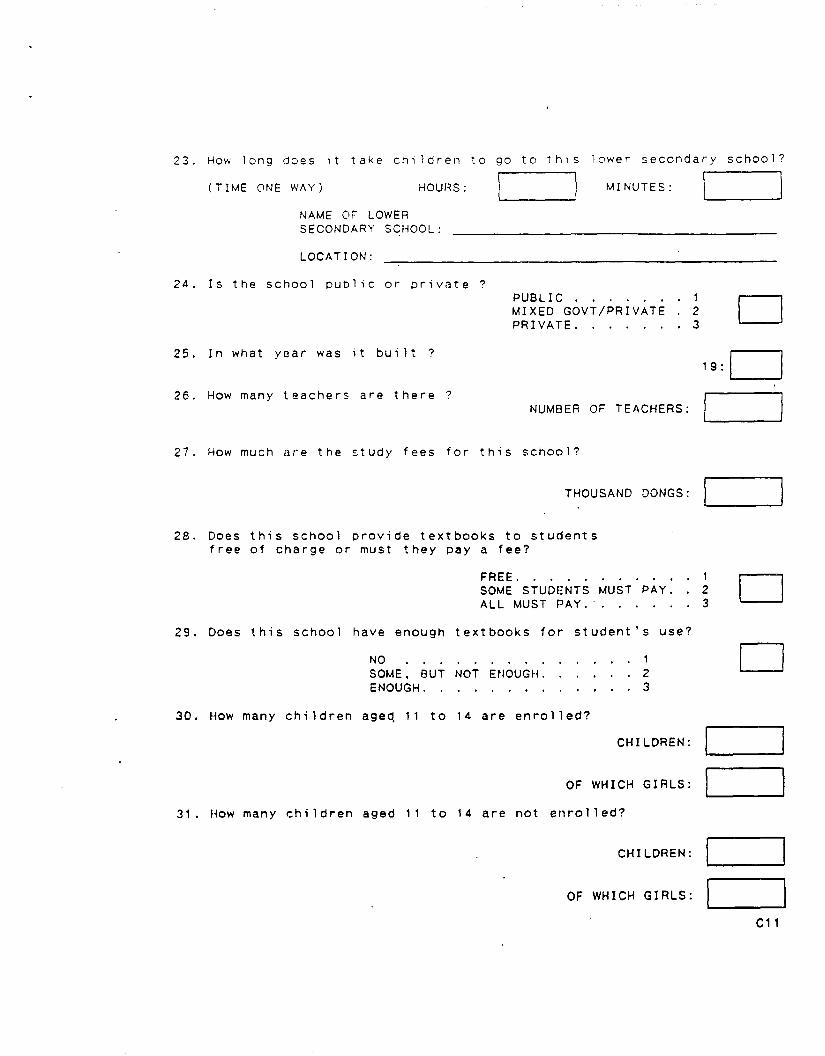
Appendix 2 Community Questionnaire and Data Dictionary


1
DICTIONARY OF COMMUNE QUESTIONNAIRE VLSS92-93
PRICE
scr1.dta 1. section int %8.0g 2. cum int %8.0g 3. name str30 %30s 4. antro int %8.0g 5. super int %8.0g 6. date1 float %9.0g 7. date2 float %9.0g 8. date3 float %9.0g
scr2.dta 1. section int %8.0g 2. cum int %8.0g 3. order int %8.0g 4. observ str30 %30s 5. price1 float %9.0g 6. price2 float %9.0g 7. price3 float %9.0g
scr3.dta 1. section int %8.0g 2. cum int %8.0g 3. order int %8.0g 4. observ str30 %30s 5. price1 float %9.0g 6. price2 float %9.0g 7. price3 float %9.0g
scr4.dta 1. section int %8.0g 2. cum int %8.0g 3. order int %8.0g 4. observ str30 %30s 5. price1 float %9.0g 6. price2 float %9.0g 7. price3 float %9.0g
scr5.dta 1. section int %8.0g 2. cum int %8.0g

2
3. order int %8.0g 4. observ str30 %30s 5. price1 float %9.0g 6. price2 float %9.0g 7. price3 float %9.0g
scr6.dta 1. section int %8.0g 2. cum int %8.0g 3. order int %8.0g 4. price1 float %9.0g 5. price2 float %9.0g 6. price3 float %9.0g
COMMUNITY
scr01.dta 1. section int %8.0g 2. cum int %8.0g 3. name str30 %30s 4. date int %8.0g 5. sup int %8.0g 6. tim1 int %8.0g 7. tim2 int %8.0g 8. tim3 int %8.0g 9. tim4 int %8.0g
scr02.dta 1. section int %8.0g 2. cum int %8.0g 3. order str30 %30s 4. titl str30 %30s 5. prof str30 %30s
scr03.dta 1. section int %8.0g 2. cum int %8.0g 3. s1q01 int %8.0g 4. s1q02 int %8.0g 5. s1q03d int %8.0g 6. s1q03m int %8.0g 7. s1q03y int %8.0g 8. s1q04 int %8.0g 9. s1q051 int %8.0g

3
10. s1q052 int %8.0g 11. s1q053 int %8.0g 12. s1q054 int %8.0g 13. s1q061 int %8.0g 14. s1q062 int %8.0g 15. s1q063 int %8.0g 16. s1q07 int %8.0g
scr04.dta 1. section int %8.0g 2. cum int %8.0g 3. s1q011 int %8.0g 4. s1q012 int %8.0g 5. s1q013 int %8.0g 6. s1q02 int %8.0g 7. s1q031 int %8.0g 8. s1q032 int %8.0g 9. s1q033 int %8.0g 10. s1q034 int %8.0g 11. s1q04 int %8.0g 12. s1q05 int %8.0g 13. s1q06 int %8.0g 14. s1q07 int %8.0g 15. s1q08 int %8.0g 16. s1q09 int %8.0g 17. s1q10 int %8.0g 18. s1q11 int %8.0g 19. s1q12 int %8.0g 20. s1q13 int %8.0g
scr05.dta 1. section int %8.0g 2. cum int %8.0g 3. s2q14 int %8.0g 4. s2q15 int %8.0g 5. s2q16 float %9.0g 6. s2q17 int %8.0g 7. s2q18n int %8.0g 8. s2q18p float %9.0g 9. s2q19n int %8.0g 10. s2q19p float %9.0g 11. s2q20 int %8.0g 12. s2q21 int %8.0g 13. s2q22t int %8.0g

4
14. s2q22u int %8.0g 15. s2q23 int %8.0g 16. s2q24 int %8.0g 17. s2q25 int %8.0g 18. s2q26t int %8.0g 19. s2q26u int %8.0g 20. s2q27 int %8.0g 21. s2q28 int %8.0g 22. s2q29 int %8.0g 23. s2q30 int %8.0g
scr06.dta 1. section int %8.0g 2. cum int %8.0g 3. s2q31t int %8.0g 4. s2q31u int %8.0g 5. s2q32a int %8.0g 6. s2q32s int %8.0g 7. s2q33 int %8.0g 8. s2q34 int %8.0g 9. s2q35 int %8.0g 10. s2q36t int %8.0g 11. s2q36u int %8.0g 12. s2q37a int %8.0g 13. s2q37s int %8.0g
scr07.dta 1. section int %8.0g 2. cum int %8.0g 3. s2q38a str30 %30s 4. s2q38b str30 %30s 5. s2q38c str30 %30s 6. s2q39 int %8.0g 7. s2q40 int %8.0g 8. s2q41a str30 %30s 9. s2q41b str30 %30s 10. s2q41c str30 %30s 11. s2q42h int %8.0g 12. s2q42p int %8.0g
scr08.dta 1. section int %8.0g 2. cum int %8.0g 3. s3q01 int %8.0g

5
4. s3q02 int %8.0g 5. s3q03 int %8.0g 6. s3q04h int %8.0g 7. s3q04m int %8.0g
scr09.dta 1. section int %8.0g 2. cum int %8.0g 3. num int %8.0g 4. s3q05 str30 %30s 5. s3q06 int %8.0g 6. s3q07 int %8.0g 7. s3q08 int %8.0g 8. s3q09 int %8.0g 9. s3q10 int %8.0g 10. s3q11 int %8.0g 11. s3q12 int %8.0g
scr10.dta 1. section int %8.0g 2. cum int %8.0g 3. s3q131 float %9.0g 4. s3q132 float %9.0g 5. s3q14 int %8.0g 6. s3q15 int %8.0g 7. s3q161 int %8.0g 8. s3q162 int %8.0g 9. s3q171 int %8.0g 10. s3q172 int %8.0g 11. s3q181 int %8.0g 12. s3q182 int %8.0g 13. s3q183 int %8.0g 14. s3q191 int %8.0g 15. s3q192 int %8.0g 16. s3q193 int %8.0g
scr11.dta 1. section int %8.0g 2. cum int %8.0g 3. s3q20 int %8.0g 4. s3q21 float %9.0g 5. s3q22 int %8.0g 6. s4q23h int %8.0g 7. s4q23m int %8.0g

6
8. name str30 %30s 9. loca str30 %30s 10. s3q24 int %8.0g 11. s3q25 int %8.0g 12. s3q26 int %8.0g 13. s3q27 float %9.0g 14. s3q28 float %9.0g 15. s3q29 int %8.0g 16. s3q301 int %8.0g 17. s3q302 int %8.0g 18. s3q311 int %8.0g 19. s3q312 int %8.0g 20. s3q321 int %8.0g 21. s3q322 int %8.0g 22. s3q323 int %8.0g 23. s3q331 int %8.0g 24. s3q332 int %8.0g 25. s3q333 int %8.0g
scr12.dta 1. section int %8.0g 2. cum int %8.0g 3. s3q34 int %8.0g 4. s3q35 float %9.0g 5. s3q36 int %8.0g 6. s4q37h int %8.0g 7. s4q37m int %8.0g 8. name str30 %30s 9. loca str30 %30s 10. s3q38 int %8.0g 11. s3q39 int %8.0g 12. s3q40 float %9.0g 13. s3q41 int %8.0g 14. s3q42 int %8.0g 15. s3q431 int %8.0g 16. s3q432 int %8.0g 17. s3q441 int %8.0g 18. s3q442 int %8.0g 19. s3q451 int %8.0g 20. s3q452 int %8.0g 21. s3q453 int %8.0g
scr13.dta 1. section int %8.0g

7
2. cum int %8.0g 3. s3q46 int %8.0g 4. s3q47 int %8.0g 5. s3q48 int %8.0g 6. s3q49 int %8.0g 7. s3q50t int %8.0g 8. s3q50m int %8.0g 9. s3q50w int %8.0g
scr14.dta 1. section int %8.0g 2. cum int %8.0g 3. item str1 %9s 4. s4q01 int %8.0g 5. s4q02 float %9.0g 6. s4q03 str30 %30s 7. s4q04h int %8.0g 8. s4q04m int %8.0g 9. s4q05 int %8.0g
scr15.dta 1. section int %8.0g 2. cum int %8.0g 3. s4q006 int %8.0g 4. spec str30 %30s 5. s4q071 int %8.0g 6. s4q072 int %8.0g 7. s4q073 int %8.0g 8. s4q081 int %8.0g 9. s4q082 int %8.0g 10. s4q083 int %8.0g 11. s4q09 int %8.0g 12. s4q10 int %8.0g 13. s4q11 int %8.0g 14. s4q12 int %8.0g 15. s4q13 int %8.0g 16. s4q14 int %8.0g 17. s4q15 int %8.0g
scr16.dta 1. section int %8.0g 2. cum int %8.0g 3. crop int %8.0g 4. s5q02 int %8.0g

8
5. s5q031 int %8.0g 6. s5q032 int %8.0g 7. s5q033 int %8.0g 8. s5q034 int %8.0g 9. s5q035 int %8.0g 10. s5q036 int %8.0g 11. s5q041 int %8.0g 12. s5q042 int %8.0g 13. s5q043 int %8.0g
scr17.dta 1. section int %8.0g 2. cum int %8.0g 3. s5q05a int %8.0g 4. s5q05b float %9.0g 5. s5q05c float %9.0g 6. s5q05d float %9.0g 7. s5q05e float %9.0g 8. s5q05f float %9.0g
scr18.dta 1. section int %8.0g 2. cum int %8.0g 3. s5q06a int %8.0g 4. s5q076 float %9.0g
scr19.dta 1. section int %8.0g 2. cum int %8.0g 3. s5q07a int %8.0g 4. s5q07b float %9.0g
scr20.dta 1. section int %8.0g 2. cum int %8.0g 3. ln int %8.0g 4. s5q08a int %8.0g 5. s5q08b float %9.0g 6. s5q08c float %9.0g 7. s5q08d float %9.0g
scr21.dta 1. section int %8.0g 2. cum int %8.0g

9
3. s5q09a str1 %9s 4. s5q09b str1 %9s 5. s5q09c str1 %9s 6. s5q09d str1 %9s 7. s5q09e str1 %9s 8. s5q09f str1 %9s 9. s5q09g str1 %9s 10. s5q09h str1 %9s 11. s5q09i str1 %9s 12. s5q10 int %8.0g
scr22.dta 1. section int %8.0g 2. cum int %8.0g 3. s5q11 int %8.0g 4. s5q12 float %9.0g 5. s5q13 int %8.0g 6. s5q141 int %8.0g 7. s5q142 int %8.0g 8. s5q143 int %8.0g 9. s5q15 int %8.0g 10. s5q16 int %8.0g 11. s5q17 int %8.0g 12. s5q18 int %8.0g 13. s5q19 int %8.0g 14. s5q20 int %8.0g 15. s5q21 int %8.0g 16. s5q22m1 int %8.0g 17. s5q22m2 int %8.0g 18. s5q22m3 int %8.0g 19. s5q22m4 int %8.0g 20. s5q22w1 int %8.0g 21. s5q22w2 int %8.0g 22. s5q22w3 int %8.0g 23. s5q22w4 int %8.0g 24. s5q22c1 int %8.0g 25. s5q22c2 int %8.0g 26. s5q22c3 int %8.0g 27. s5q22c4 int %8.0g
scr23.dta 1. section int %8.0g 2. cum int %8.0g 3. s5q23 int %8.0g

10
4. s5q23m int %8.0g 5. s5q23w int %8.0g 6. s5q23c int %8.0g 7. s5q25 int %8.0g 8. s5q261 int %8.0g 9. s5q262 int %8.0g 10. s5q263 int %8.0g 11. s5q27 int %8.0g 12. s5q28 int %8.0g

Appendix 3 Data Exploration with Multiple Correspondence Analysis

Homals
Credit
HOMALSVersion 1.0byData Theory Scaling System Group (DTSS)Faculty of Social and Behavioral SciencesLeiden University, The Netherlands
Case Processing Summary
120Cases Used in Analysis
Marginal Frequencies
C-Is there an agric coop in the community?
77430
AgricYAgricNMissing
MarginalFrequency
C-Where most of women give birth?
358050
homehos,cliotherMissing
MarginalFrequency
C-Clinic in community
37830
clinYesclinNOMissing
MarginalFrequency
VLSS-1 Communes Data Exploration39 variables 111 categories
L.-M. Asselin 02-10-30 Appendix 3 page 1D:\CF Gauss projets\Formation SISERA Dakar nov 2002\Volume 2\Homals VLSS1-COMMUNES-explo.spo

C-Doctor in community
50700
Doctor-YDoctor-NMissing
MarginalFrequency
C-Distance kms to hospital
2349471
d<=3kd3-10kd>10kMissing
MarginalFrequency
C-Do hlds have electricity?
1550550
C-NoneC-A fewC-MostMissing
MarginalFrequency
C-large enterprise < 10 kms
55650
entYESentNOMissing
MarginalFrequency
C-Is there an agric ext center in the community?
31890
ExtYExtNMissing
MarginalFrequency
C-food shop
52680
foodsYESfoodsNOMissing
MarginalFrequency
VLSS-1 Communes Data Exploration39 variables 111 categories
L.-M. Asselin 02-10-30 Appendix 3 page 2D:\CF Gauss projets\Formation SISERA Dakar nov 2002\Volume 2\Homals VLSS1-COMMUNES-explo.spo

C-Proportion of land quality 1
5741220
Land1=0Land1<25Land1>25Missing
MarginalFrequency
C-Proportion of land quality 2
4055250
Land2=0land2<25Land2>25Missing
MarginalFrequency
C-Proportion of land quality 3
2861310
Land3=0land3<25Land3>25Missing
MarginalFrequency
C-Proportion of land quality 4
2372250
Land4=0land4<25Land4>25Missing
MarginalFrequency
C-Proportion of land quality 5
2470260
Land5=0land5<25Land5>25Missing
MarginalFrequency
VLSS-1 Communes Data Exploration39 variables 111 categories
L.-M. Asselin 02-10-30 Appendix 3 page 3D:\CF Gauss projets\Formation SISERA Dakar nov 2002\Volume 2\Homals VLSS1-COMMUNES-explo.spo

C-Proportion of land quality 6
3469170
Land6=0land6<25Land6>25Missing
MarginalFrequency
C-Proportion of land quality 7
5351160
Land7=0land7<25Land7>25Missing
MarginalFrequency
C-loud speaker
64560
speakYESspeakNOMissing
MarginalFrequency
C-Fees at lower secondary school
2848431
fLS<25fLS25-50fLS50+Missing
MarginalFrequency
C-market
4016640
no markperiodicdailyMissing
MarginalFrequency
VLSS-1 Communes Data Exploration39 variables 111 categories
L.-M. Asselin 02-10-30 Appendix 3 page 4D:\CF Gauss projets\Formation SISERA Dakar nov 2002\Volume 2\Homals VLSS1-COMMUNES-explo.spo

C-First reason not attending prim sch
19512117120
too fartoo expillnessparentsotherMissing
MarginalFrequency
C-First reason not attend sec school
10622611110
too fartoo expnot ableparentsotherMissing
MarginalFrequency
C-Pharmacist in community
65550
phcistYphcistNMissing
MarginalFrequency
C-Pharmacy in community
85350
Pharm-YPharm-NMissing
MarginalFrequency
C-post office
41790
postYESpostNOMissing
MarginalFrequency
VLSS-1 Communes Data Exploration39 variables 111 categories
L.-M. Asselin 02-10-30 Appendix 3 page 5D:\CF Gauss projets\Formation SISERA Dakar nov 2002\Volume 2\Homals VLSS1-COMMUNES-explo.spo

C-Study fees at grade 1-3 (000 dongs)
58620
fee<10fee>=10Missing
MarginalFrequency
C-Study fees at grade 4-5 (000 dongs)
54660
fee<10fee>=10Missing
MarginalFrequency
C-Primary enrolment rate
2215830
primr80primr90prir100Missing
MarginalFrequency
C-Major health service prob in commun.
718
1511150
lackfacilackmediqualitysanitaryotherMissing
MarginalFrequency
C-Major health problem in community
315124140
MalariamalnutriRespiratotherMissing
MarginalFrequency
VLSS-1 Communes Data Exploration39 variables 111 categories
L.-M. Asselin 02-10-30 Appendix 3 page 6D:\CF Gauss projets\Formation SISERA Dakar nov 2002\Volume 2\Homals VLSS1-COMMUNES-explo.spo

C-Major problem primary school-rec
76321020
Poor matLiving SBudgetQualityMissing
MarginalFrequency
C-Major problem lower second school
6335184
poor matliving sotherMissing
MarginalFrequency
C-Distance public transportation
621528150
pubt0kpubt3kpubt10kpubt11k+Missing
MarginalFrequency
C-Road passes by the community
103170
roadYESrosdNOMissing
MarginalFrequency
C-Enrol.rate at lower secondary school
3135540
s<=35s35-70s>70Missing
MarginalFrequency
VLSS-1 Communes Data Exploration39 variables 111 categories
L.-M. Asselin 02-10-30 Appendix 3 page 7D:\CF Gauss projets\Formation SISERA Dakar nov 2002\Volume 2\Homals VLSS1-COMMUNES-explo.spo

C-Is there a lower secondary school?
106140
secsnosecsMissing
MarginalFrequency
C-Traditional healer in community
77430
tradheYtradheNMissing
MarginalFrequency
C-Traditional midwife in community
87330
tradmidYtradmidNMissing
MarginalFrequency
C-Trained midwife in community
101190
traimidYtraimidNMissing
MarginalFrequency
C-Source of drinking water
42
793050
raindrilleddug wellriverotherMissing
MarginalFrequency
VLSS-1 Communes Data Exploration39 variables 111 categories
L.-M. Asselin 02-10-30 Appendix 3 page 8D:\CF Gauss projets\Formation SISERA Dakar nov 2002\Volume 2\Homals VLSS1-COMMUNES-explo.spo

Iteration History
,308254 ,000007Iteration16a
Fit
Differencefrom thePreviousIteration
The iteration was terminated because convergence criteria are satisified.a.
Eigenvalues
,186,122
Dimension12
Eigenvalue
Discrimination Measures
,115 ,375
,337 ,111
,005 ,259,252 ,133
,209 ,177
,514 ,154
,254 ,044
,206 ,004
,132 ,221
,492 ,121
,371 ,244
,107 ,178
,016 ,178
,176 ,175
,167 ,243
,123 ,096
,315 ,095
,081 ,072
C-Is there an agric coopin the community?
C-Where most of womengive birth?
C-Clinic in communityC-Doctor in communityC-Distance kms tohospital
C-Do hlds haveelectricity?
C-large enterprise < 10kms
C-Is there an agric extcenter in the community?
C-food shopC-Proportion of landquality 1
C-Proportion of landquality 2
C-Proportion of landquality 3
C-Proportion of landquality 4
C-Proportion of landquality 5
C-Proportion of landquality 6
C-Proportion of landquality 7
C-loud speakerC-Fees at lowersecondary school
1 2Dimension
VLSS-1 Communes Data Exploration39 variables 111 categories
L.-M. Asselin 02-10-30 Appendix 3 page 9D:\CF Gauss projets\Formation SISERA Dakar nov 2002\Volume 2\Homals VLSS1-COMMUNES-explo.spo

Discrimination Measures
,194 ,171
,388 ,133
,289 ,081
,138 ,019
,262 ,095
,079 ,193
,021 ,096
,021 ,079
,348 ,136
,070 ,021
,299 ,077
,219 ,138
,278 ,083
,175 ,164
,106 ,046
,287 ,072
,030 ,002
,018 ,094
,069 ,015
,009 ,001
,078 ,178
C-marketC-First reason notattending prim sch
C-First reason not attendsec school
C-Pharmacist incommunity
C-Pharmacy incommunity
C-post officeC-Study fees at grade 1-3(000 dongs)
C-Study fees at grade 4-5(000 dongs)
C-Primary enrolment rateC-Major health serviceprob in commun.
C-Major health problem incommunity
C-Major problem primaryschool-rec
C-Major problem lowersecond school
C-Distance publictransportation
C-Road passes by thecommunity
C-Enrol.rate at lowersecondary school
C-Is there a lowersecondary school?
C-Traditional healer incommunity
C-Traditional midwife incommunity
C-Trained midwife incommunity
C-Source of drinkingwater
1 2Dimension
VLSS-1 Communes Data Exploration39 variables 111 categories
L.-M. Asselin 02-10-30 Appendix 3 page 10D:\CF Gauss projets\Formation SISERA Dakar nov 2002\Volume 2\Homals VLSS1-COMMUNES-explo.spo

Discrimination Measures
Dimension 1
,6,5,4,3,2,10,0
Dim
ensi
on 2
,4
,3
,2
,1
0,0
-,1
C-Source of
C-Trained miC-Traditiona
C-Traditiona
C-Is there a
C-Enrol.rateC-Road passe
C-Distance p
C-Major prob
C-Major prob
C-Major heal
C-Major heal
C-Primary en
C-Study feesC-Study fees
C-post offic
C-Pharmacy i
C-Pharmacist
C-First reas
C-First reas
C-market
C-Fees at loC-loud speakC-Proportion
C-Proportion
C-ProportionC-ProportionC-Proportion
C-Proportion
C-Proportion
C-food shop
C-Is there a
C-large ente
C-Do hlds haC-Distance k
C-Doctor in
C-Clinic in
C-Where most
C-Is there a
Quantifications
C-Is there an agric coop in the community?
77 -,252 ,45843 ,455 -,8190
AgricYAgricNMissing
MarginalFrequency 1 2
DimensionCategory Quantifications
C-Where most of women give birth?
35 ,902 ,00880 -,385 ,0965 -,125 -1,5890
homehos,cliotherMissing
MarginalFrequency 1 2
DimensionCategory Quantifications
VLSS-1 Communes Data Exploration39 variables 111 categories
L.-M. Asselin 02-10-30 Appendix 3 page 11D:\CF Gauss projets\Formation SISERA Dakar nov 2002\Volume 2\Homals VLSS1-COMMUNES-explo.spo

C-Clinic in community
37 -,109 -,76383 ,050 ,3400
clinYesclinNOMissing
MarginalFrequency 1 2
DimensionCategory Quantifications
C-Doctor in community
50 -,593 -,43270 ,426 ,3090
Doctor-YDoctor-NMissing
MarginalFrequency 1 2
DimensionCategory Quantifications
C-Distance kms to hospital
23 -,669 -,70549 -,153 ,43847 ,539 -,0911
d<=3kd3-10kd>10kMissing
MarginalFrequency 1 2
DimensionCategory Quantifications
C-Do hlds have electricity?
15 1,007 ,27750 ,539 -,46455 -,761 ,3460
C-NoneC-A fewC-MostMissing
MarginalFrequency 1 2
DimensionCategory Quantifications
VLSS-1 Communes Data Exploration39 variables 111 categories
L.-M. Asselin 02-10-30 Appendix 3 page 12D:\CF Gauss projets\Formation SISERA Dakar nov 2002\Volume 2\Homals VLSS1-COMMUNES-explo.spo

C-large enterprise < 10 kms
55 -,546 -,22865 ,465 ,1930
entYESentNOMissing
MarginalFrequency 1 2
DimensionCategory Quantifications
C-Is there an agric ext center in the community?
31 -,768 -,10989 ,269 ,0380
ExtYExtNMissing
MarginalFrequency 1 2
DimensionCategory Quantifications
C-food shop
52 -,414 -,53768 ,319 ,4110
foodsYESfoodsNOMissing
MarginalFrequency 1 2
DimensionCategory Quantifications
C-Proportion of land quality 1
57 ,683 -,26141 -,346 ,48322 -1,117 -,2240
Land1=0Land1<25Land1>25Missing
MarginalFrequency 1 2
DimensionCategory Quantifications
VLSS-1 Communes Data Exploration39 variables 111 categories
L.-M. Asselin 02-10-30 Appendix 3 page 13D:\CF Gauss projets\Formation SISERA Dakar nov 2002\Volume 2\Homals VLSS1-COMMUNES-explo.spo

C-Proportion of land quality 2
40 ,783 -,63255 -,180 ,49025 -,852 -,0670
Land2=0land2<25Land2>25Missing
MarginalFrequency 1 2
DimensionCategory Quantifications
C-Proportion of land quality 3
28 ,593 -,75761 -,191 ,27731 -,154 ,1400
Land3=0land3<25Land3>25Missing
MarginalFrequency 1 2
DimensionCategory Quantifications
C-Proportion of land quality 4
23 ,122 -,85772 -,101 ,16125 ,184 ,3240
Land4=0land4<25Land4>25Missing
MarginalFrequency 1 2
DimensionCategory Quantifications
C-Proportion of land quality 5
24 -,638 -,57070 -,024 ,35126 ,660 -,4200
Land5=0land5<25Land5>25Missing
MarginalFrequency 1 2
DimensionCategory Quantifications
VLSS-1 Communes Data Exploration39 variables 111 categories
L.-M. Asselin 02-10-30 Appendix 3 page 14D:\CF Gauss projets\Formation SISERA Dakar nov 2002\Volume 2\Homals VLSS1-COMMUNES-explo.spo

C-Proportion of land quality 6
34 -,600 -,48769 ,149 ,41917 ,604 -,7260
Land6=0land6<25Land6>25Missing
MarginalFrequency 1 2
DimensionCategory Quantifications
C-Proportion of land quality 7
53 -,188 -,30951 -,079 ,35216 ,884 -,1000
Land7=0land7<25Land7>25Missing
MarginalFrequency 1 2
DimensionCategory Quantifications
C-loud speaker
64 -,524 -,28856 ,601 ,3300
speakYESspeakNOMissing
MarginalFrequency 1 2
DimensionCategory Quantifications
C-Fees at lower secondary school
28 ,296 ,07848 ,135 ,26343 -,384 -,3471
fLS<25fLS25-50fLS50+Missing
MarginalFrequency 1 2
DimensionCategory Quantifications
VLSS-1 Communes Data Exploration39 variables 111 categories
L.-M. Asselin 02-10-30 Appendix 3 page 15D:\CF Gauss projets\Formation SISERA Dakar nov 2002\Volume 2\Homals VLSS1-COMMUNES-explo.spo

C-market
40 ,471 ,46216 ,476 ,39064 -,410 -,3860
no markperiodicdailyMissing
MarginalFrequency 1 2
DimensionCategory Quantifications
C-First reason not attending prim sch
19 ,919 -,31051 ,064 -,27421 -1,172 ,29117 ,285 ,25012 -,066 ,7910
too fartoo expillnessparentsotherMissing
MarginalFrequency 1 2
DimensionCategory Quantifications
C-First reason not attend sec school
10 1,049 -,50462 ,254 -,17226 -,856 ,38411 -,191 ,25111 -,156 ,2710
too fartoo expnot ableparentsotherMissing
MarginalFrequency 1 2
DimensionCategory Quantifications
C-Pharmacist in community
65 -,340 -,12655 ,405 ,1490
phcistYphcistNMissing
MarginalFrequency 1 2
DimensionCategory Quantifications
VLSS-1 Communes Data Exploration39 variables 111 categories
L.-M. Asselin 02-10-30 Appendix 3 page 16D:\CF Gauss projets\Formation SISERA Dakar nov 2002\Volume 2\Homals VLSS1-COMMUNES-explo.spo

C-Pharmacy in community
85 -,327 -,19735 ,798 ,4790
Pharm-YPharm-NMissing
MarginalFrequency 1 2
DimensionCategory Quantifications
C-post office
41 -,390 -,61079 ,204 ,3170
postYESpostNOMissing
MarginalFrequency 1 2
DimensionCategory Quantifications
C-Study fees at grade 1-3 (000 dongs)
58 ,152 ,32162 -,140 -,3000
fee<10fee>=10Missing
MarginalFrequency 1 2
DimensionCategory Quantifications
C-Study fees at grade 4-5 (000 dongs)
54 ,162 ,31066 -,130 -,2540
fee<10fee>=10Missing
MarginalFrequency 1 2
DimensionCategory Quantifications
VLSS-1 Communes Data Exploration39 variables 111 categories
L.-M. Asselin 02-10-30 Appendix 3 page 17D:\CF Gauss projets\Formation SISERA Dakar nov 2002\Volume 2\Homals VLSS1-COMMUNES-explo.spo

C-Primary enrolment rate
22 1,132 -,59015 ,390 -,49483 -,368 ,2460
primr80primr90prir100Missing
MarginalFrequency 1 2
DimensionCategory Quantifications
C-Major health service prob in commun.
71 -,016 ,0538 ,867 -,274
15 -,014 -,18311 -,459 ,29415 -,024 -,1400
lackfacilackmediqualitysanitaryotherMissing
MarginalFrequency 1 2
DimensionCategory Quantifications
C-Major health problem in community
31 ,799 -,27851 -,385 ,30324 -,479 -,30114 ,465 ,0260
MalariamalnutriRespiratotherMissing
MarginalFrequency 1 2
DimensionCategory Quantifications
C-Major problem primary school-rec
76 ,348 ,17632 -,553 -,55810 -,582 ,5812 -1,401 -,6670
Poor matLiving SBudgetQualityMissing
MarginalFrequency 1 2
DimensionCategory Quantifications
VLSS-1 Communes Data Exploration39 variables 111 categories
L.-M. Asselin 02-10-30 Appendix 3 page 18D:\CF Gauss projets\Formation SISERA Dakar nov 2002\Volume 2\Homals VLSS1-COMMUNES-explo.spo

C-Major problem lower second school
63 ,406 ,05635 -,789 -,39018 -,258 ,4984
poor matliving sotherMissing
MarginalFrequency 1 2
DimensionCategory Quantifications
C-Distance public transportation
62 -,246 -,30415 -,428 ,84428 ,303 -,02915 ,892 ,4680
pubt0kpubt3kpubt10kpubt11k+Missing
MarginalFrequency 1 2
DimensionCategory Quantifications
C-Road passes by the community
103 -,131 ,08717 ,802 -,5260
roadYESrosdNOMissing
MarginalFrequency 1 2
DimensionCategory Quantifications
C-Enrol.rate at lower secondary school
31 ,836 -,27435 ,017 -,21254 -,488 ,2950
s<=35s35-70s>70Missing
MarginalFrequency 1 2
DimensionCategory Quantifications
VLSS-1 Communes Data Exploration39 variables 111 categories
L.-M. Asselin 02-10-30 Appendix 3 page 19D:\CF Gauss projets\Formation SISERA Dakar nov 2002\Volume 2\Homals VLSS1-COMMUNES-explo.spo

C-Is there a lower secondary school?
106 -,062 ,01814 ,478 -,1330
secsnosecsMissing
MarginalFrequency 1 2
DimensionCategory Quantifications
C-Traditional healer in community
77 -,100 -,22943 ,183 ,4100
tradheYtradheNMissing
MarginalFrequency 1 2
DimensionCategory Quantifications
C-Traditional midwife in community
87 ,163 -,07533 -,424 ,1990
tradmidYtradmidNMissing
MarginalFrequency 1 2
DimensionCategory Quantifications
C-Trained midwife in community
101 -,041 -,01019 ,226 ,0520
traimidYtraimidNMissing
MarginalFrequency 1 2
DimensionCategory Quantifications
VLSS-1 Communes Data Exploration39 variables 111 categories
L.-M. Asselin 02-10-30 Appendix 3 page 20D:\CF Gauss projets\Formation SISERA Dakar nov 2002\Volume 2\Homals VLSS1-COMMUNES-explo.spo

C-Source of drinking water
4 -,102 -,4672 ,414 ,306
79 -,166 ,29130 ,269 -,6075 ,959 -,7100
raindrilleddug wellriverotherMissing
MarginalFrequency 1 2
DimensionCategory Quantifications
Quantifications
Dimension 1
1,51,0,50,0-,5-1,0-1,5
Dim
ensi
on 2
1,0
,5
0,0
-,5
-1,0
-1,5
-2,0
10 kms
C-Do hlds have elect
ricity?
C-Distance kms to ho
spital
C-Doctor in communit
y
C-Clinic in communit
y
C-Where most of wome
n give birth?
C-Is there an agric
coop in the communit
otherriver
dug well drilled
rain
traimidNtraimidYtradmidN
tradmidY
tradheN
tradheYnosecs
secs
s>70
s35-70 s<=35
rosdNO
roadYES
pubt11k+
pubt10k
pubt3k
pubt0k
other
living s
poor mat
Quality
Budget
Living S
Poor matother
Respirat
malnutri
Malariaother
sanitary
qualitylackmedi
lackfaciprir100
primr90primr80
fee>=10
fee<10
fee>=10
fee<10postNO
postYES
Pharm-N
Pharm-Y
phcistN
phcistY
otherparentsnot able
too exp
too far
other
parentsillness
too exp too fardaily
periodicno mark
fLS50+
fLS25-50fLS<25
speakNO
speakYESLand7>25
land7<25
Land7=0
Land6>25
land6<25
Land6=0 Land5>25
land5<25
Land5=0
Land4>25land4<25
Land4=0
Land3>25land3<25
Land3=0
Land2>25
land2<25
Land2=0
Land1>25
Land1<25
Land1=0
foodsNO
foodsYES
ExtNExtY
entNO
entYES
C-Most
C-A few
C-None
d>10k
d3-10k
d<=3k
Doctor-N
Doctor-Y
clinNO
clinYes
other
hos,clihome
AgricN
AgricY
Object Scores
2,110 -,2881,055 ,824,796 -2,063
1,037 ,433,930 ,592
1,249 ,8321,548 ,6001,230 ,244-,245 -,046
123456789
1 2Dimension
VLSS-1 Communes Data Exploration39 variables 111 categories
L.-M. Asselin 02-10-30 Appendix 3 page 21D:\CF Gauss projets\Formation SISERA Dakar nov 2002\Volume 2\Homals VLSS1-COMMUNES-explo.spo

Object Scores
-,103 1,5981,182 ,4691,252 ,1161,033 -,133,250 1,087
1,681 ,061-,553 -,355-,896 ,776,166 -,108
-1,690 -,662-1,305 ,045-1,350 -,955
-,702 ,8351,364 ,889,282 1,695,319 1,344
-,162 1,489-,167 1,905,409 ,867
-,405 ,223,353 ,845
-,123 ,728-2,283 -,949-1,398 -,299-1,824 -,513-1,204 1,270-1,341 -,002-1,460 -,430-1,779 ,098-1,172 -,180-1,598 ,494
-,927 ,897-1,788 -,198-1,499 -,346
-,997 ,441-,598 1,166,019 1,402
-,822 1,003-,774 ,893-,772 1,204,686 ,627
-1,579 -,196-,906 1,241-,759 ,419,790 1,496
101112131415161718192021222324252627282930313233343536373839404142434445464748495051525354
1 2Dimension
VLSS-1 Communes Data Exploration39 variables 111 categories
L.-M. Asselin 02-10-30 Appendix 3 page 22D:\CF Gauss projets\Formation SISERA Dakar nov 2002\Volume 2\Homals VLSS1-COMMUNES-explo.spo

Object Scores
,090 1,567,053 1,327
-1,310 -,285-,265 1,770-,233 ,981,112 1,159
-,112 ,7551,563 -,230,175 1,569,884 -,083,548 ,573,319 ,487,939 1,336
-,418 ,9882,113 ,679-,234 ,749
-1,696 -1,178,549 ,021
1,494 -1,053-1,120 ,3881,963 ,138-,529 1,291-,199 ,849-,282 ,821-,995 -,179,281 -,388
-1,027 -1,068-,938 ,502-,175 -,362,980 ,066
1,197 -,732-,043 -2,081,877 ,731,402 -,965,083 -,348,984 -1,411
-,909 -,7701,184 -1,907
-1,109 -,960,303 -,567
-,451 -,707,934 -,811,619 -1,794
-,745 -1,615-,711 -1,257
555657585960616263646566676869707172737475767778798081828384858687888990919293949596979899
1 2Dimension
VLSS-1 Communes Data Exploration39 variables 111 categories
L.-M. Asselin 02-10-30 Appendix 3 page 23D:\CF Gauss projets\Formation SISERA Dakar nov 2002\Volume 2\Homals VLSS1-COMMUNES-explo.spo

Object Scores
-,419 -1,509,306 -1,487,042 -1,663
-,521 -,764,059 -1,070,421 -1,060,815 -,857
-,227 -,730,141 ,584
-,905 -1,378,345 -1,580
-,331 -1,8821,445 ,0451,602 -,514-,519 -,385-,191 -2,209,519 -1,659
1,427 -,5531,338 -,6861,397 -1,2431,724 -,816
100101102103104105106107108109110111112113114115116117118119120
1 2Dimension
VLSS-1 Communes Data Exploration39 variables 111 categories
L.-M. Asselin 02-10-30 Appendix 3 page 24D:\CF Gauss projets\Formation SISERA Dakar nov 2002\Volume 2\Homals VLSS1-COMMUNES-explo.spo

VARNAME_: C_AGRCOO C-Is there an agric coop in the communit
DIM1
,5,4,3,2,1-,0-,1-,2-,3
DIM
2
,6
,4
,2
,0
-,2
-,4
-,6
-,8
-1,0
AgricN
AgricY
VARNAME_: C_BIRTH C-Where most of women give birth?
DIM1
1,0,8,6,4,20,0-,2-,4
DIM
2
,5
0,0
-,5
-1,0
-1,5
-2,0
other
hos,clihome
VARNAME_: C_CLINIC C-Clinic in community
DIM1
,10,0-,1-,2
DIM
2
,4
,2
0,0
-,2
-,4
-,6
-,8
clinNO
clinYes
VARNAME_: C_DOCTOR C-Doctor in community
DIM1
,6,4,20,0-,2-,4-,6-,8
DIM
2
,4
,2
-,0
-,2
-,4
-,6
Doctor-N
Doctor-Y
VLSS-1 Communes Data Exploration39 variables 111 categories
L.-M. Asselin 02-11-04 Appendix 3 page 25D:\Bureau de Québec\Projets\MIMAP-Vietnam-3\Report\INDEXCOM03-Graph_1.spo

VARNAME_: C_DSTHOS C-Distance kms to hospital
DIM1
,6,4,20,0-,2-,4-,6-,8
DIM
2
,6
,4
,2
0,0
-,2
-,4
-,6
-,8
d>10k
d3-10k
d<=3k
VARNAME_: C_ELEC C-Do hlds have electricity?
DIM1
1,51,0,50,0-,5-1,0
DIM
2
,4
,2
-,0
-,2
-,4
-,6
C-Most
C-A few
C-None
VARNAME_: C_ENTERP C-large enterprise < 10 kms
DIM1
,6,4,2-,0-,2-,4-,6
DIM
2
,3
,2
,1
-,0
-,1
-,2
-,3
entNO
entYES
VARNAME_: C_EXTCEN C-Is there an agric ext center in the co
DIM1
,4,20,0-,2-,4-,6-,8
DIM
2
,06
,04
,02
0,00
-,02
-,04
-,06
-,08
-,10
-,12
ExtN
ExtY
VLSS-1 Communes Data Exploration39 variables 111 categories
L.-M. Asselin 02-11-04 Appendix 3 page 26D:\Bureau de Québec\Projets\MIMAP-Vietnam-3\Report\INDEXCOM03-Graph_1.spo

VARNAME_: C_FOODSH C-food shop
DIM1
,4,2-,0-,2-,4-,6
DIM
2
,6
,4
,2
-,0
-,2
-,4
-,6
foodsNO
foodsYES
VARNAME_: C_LAND1 C-Proportion of land quality 1
DIM1
1,0,50,0-,5-1,0-1,5
DIM
2
,6
,4
,2
0,0
-,2
-,4
Land1>25
Land1<25
Land1=0
VARNAME_: C_LAND2 C-Proportion of land quality 2
DIM1
1,0,50,0-,5-1,0
DIM
2
,6
,4
,2
0,0
-,2
-,4
-,6
-,8
Land2>25
land2<25
Land2=0
VARNAME_: C_LAND3 C-Proportion of land quality 3
DIM1
,8,6,4,20,0-,2-,4
DIM
2
,4
,2
0,0
-,2
-,4
-,6
-,8
Land3>25
land3<25
Land3=0
VLSS-1 Communes Data Exploration39 variables 111 categories
L.-M. Asselin 02-11-04 Appendix 3 page 27D:\Bureau de Québec\Projets\MIMAP-Vietnam-3\Report\INDEXCOM03-Graph_1.spo

VARNAME_: C_LAND4 C-Proportion of land quality 4
DIM1
,2,10,0-,1-,2
DIM
2
,6
,4
,2
,0
-,2
-,4
-,6
-,8
-1,0
Land4>25
land4<25
Land4=0
VARNAME_: C_LAND5 C-Proportion of land quality 5
DIM1
,8,6,4,20,0-,2-,4-,6-,8
DIM
2
,6
,4
,2
-,0
-,2
-,4
-,6
Land5>25
land5<25
Land5=0
VARNAME_: C_LAND6 C-Proportion of land quality 6
DIM1
,8,6,4,20,0-,2-,4-,6-,8
DIM
2
,6
,4
,2
0,0
-,2
-,4
-,6
-,8
Land6>25
land6<25
Land6=0
VARNAME_: C_LAND7 C-Proportion of land quality 7
DIM1
1,0,8,6,4,20,0-,2
DIM
2
,4
,3
,2
,1
0,0
-,1
-,2
-,3
-,4
Land7>25
land7<25
Land7=0
VLSS-1 Communes Data Exploration39 variables 111 categories
L.-M. Asselin 02-11-04 Appendix 3 page 28D:\Bureau de Québec\Projets\MIMAP-Vietnam-3\Report\INDEXCOM03-Graph_1.spo

VARNAME_: C_LOUDSP C-loud speaker
DIM1
,8,6,4,2-,0-,2-,4-,6
DIM
2
,4
,3
,2
,1
-,0
-,1
-,2
-,3
speakNO
speakYES
VARNAME_: C_LSECFE C-Fees at lower secondary school
DIM1
,4,3,2,10,0-,1-,2-,3-,4
DIM
2
,3
,2
,1
0,0
-,1
-,2
-,3
-,4
fLS50+
fLS25-50
fLS<25
VARNAME_: C_MARKET C-market
DIM1
,6,4,2-,0-,2-,4-,6
DIM
2
,6
,4
,2
0,0
-,2
-,4daily
periodic
no mark
VARNAME_: C_NOATTP C-First reason not attending prim sch
DIM1
1,0,50,0-,5-1,0-1,5
DIM
2
1,0
,8
,6
,4
,2
0,0
-,2
-,4
other
parentsillness
too exptoo far
VLSS-1 Communes Data Exploration39 variables 111 categories
L.-M. Asselin 02-11-04 Appendix 3 page 29D:\Bureau de Québec\Projets\MIMAP-Vietnam-3\Report\INDEXCOM03-Graph_1.spo

VARNAME_: C_NOATTS C-First reason not attend sec school
DIM1
1,51,0,50,0-,5-1,0
DIM
2
,4
,2
-,0
-,2
-,4
-,6
otherparents
too exp
too far
VARNAME_: C_PHAMAC C-Pharmacist in community
DIM1
,6,4,20,0-,2-,4
DIM
2
,2
,1
0,0
-,1
-,2
phcistN
phcistY
VARNAME_: C_PHARM C-Pharmacy in community
DIM1
1,0,8,6,4,20,0-,2-,4
DIM
2
,7
,6
,5
,4
,3
,2
,1
-,0
-,1
-,2
-,3
Pharm-N
Pharm-Y
VARNAME_: C_POSTOF C-post office
DIM1
,3,2,10,0-,1-,2-,3-,4
DIM
2
,4
,2
0,0
-,2
-,4
-,6
-,8
postNO
postYES
VLSS-1 Communes Data Exploration39 variables 111 categories
L.-M. Asselin 02-11-04 Appendix 3 page 30D:\Bureau de Québec\Projets\MIMAP-Vietnam-3\Report\INDEXCOM03-Graph_1.spo
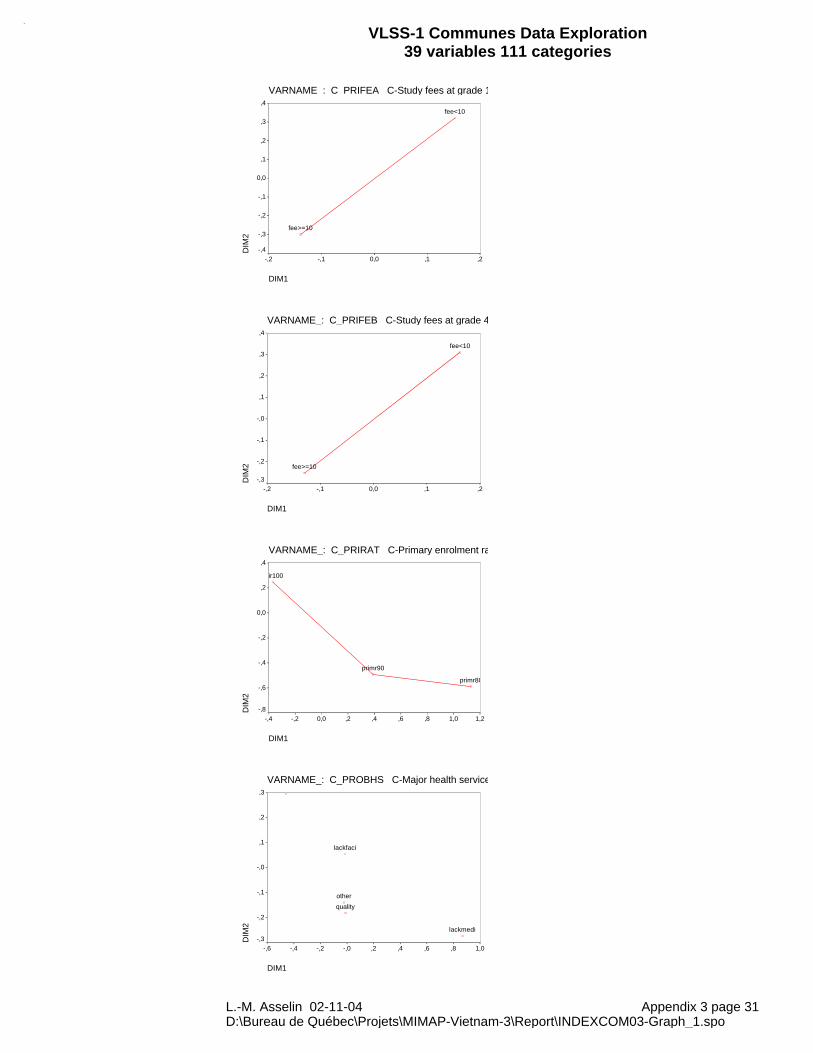
VARNAME_: C_PRIFEA C-Study fees at grade 1-3 (000 dongs)
DIM1
,2,10,0-,1-,2
DIM
2
,4
,3
,2
,1
0,0
-,1
-,2
-,3
-,4
fee>=10
fee<10
VARNAME_: C_PRIFEB C-Study fees at grade 4-5 (000 dongs)
DIM1
,2,10,0-,1-,2
DIM
2
,4
,3
,2
,1
-,0
-,1
-,2
-,3
fee>=10
fee<10
VARNAME_: C_PRIRAT C-Primary enrolment rate
DIM1
1,21,0,8,6,4,20,0-,2-,4
DIM
2
,4
,2
0,0
-,2
-,4
-,6
-,8
prir100
primr90
primr80
VARNAME_: C_PROBHS C-Major health service prob in commun.
DIM1
1,0,8,6,4,2-,0-,2-,4-,6
DIM
2
,3
,2
,1
-,0
-,1
-,2
-,3
other
quality
lackmedi
lackfaci
VLSS-1 Communes Data Exploration39 variables 111 categories
L.-M. Asselin 02-11-04 Appendix 3 page 31D:\Bureau de Québec\Projets\MIMAP-Vietnam-3\Report\INDEXCOM03-Graph_1.spo

VARNAME_: C_PROBLH C-Major health problem in community
DIM1
1,0,8,6,4,2-,0-,2-,4-,6
DIM
2
,4
,3
,2
,1
0,0
-,1
-,2
-,3
-,4
other
Respirat
malnutri
Malaria
VARNAME_: C_PROBLP C-Major problem primary school-rec
DIM1
,50,0-,5-1,0-1,5
DIM
2
,6
,4
,2
0,0
-,2
-,4
-,6
-,8
Quality
Living S
Poor mat
VARNAME_: C_PROBLS C-Major problem lower second school
DIM1
,6,4,20,0-,2-,4-,6-,8
DIM
2
,6
,4
,2
0,0
-,2
-,4
other
living s
poor mat
VARNAME_: C_PUBTRA C-Distance public transportation
DIM1
1,0,8,6,4,2-,0-,2-,4-,6
DIM
2
1,0
,8
,6
,4
,2
0,0
-,2
-,4
pubt11k+
pubt10k
pubt3k
pubt0k
VLSS-1 Communes Data Exploration39 variables 111 categories
L.-M. Asselin 02-11-04 Appendix 3 page 32D:\Bureau de Québec\Projets\MIMAP-Vietnam-3\Report\INDEXCOM03-Graph_1.spo

VARNAME_: C_ROADS C-Road passes by the community
DIM1
1,0,8,6,4,20,0-,2
DIM
2
,2
,1
,0
-,1
-,2
-,3
-,4
-,5
-,6
rosdNO
roadYES
VARNAME_: C_SECRAT C-Enrol.rate at lower secondary school
DIM1
1,0,8,6,4,2-,0-,2-,4-,6
DIM
2
,4
,3
,2
,1
-,0
-,1
-,2
-,3
s>70
s35-70
s<=35
VARNAME_: C_SECSCH C-Is there a lower secondary school?
DIM1
,5,4,3,2,10,0-,1
DIM
2
,04
,02
0,00
-,02
-,04
-,06
-,08
-,10
-,12
-,14nosecs
secs
VARNAME_: C_TRADHE C-Traditional healer in community
DIM1
,2,10,0-,1-,2
DIM
2
,5
,4
,3
,2
,1
-,0
-,1
-,2
-,3
tradheN
tradheY
VLSS-1 Communes Data Exploration39 variables 111 categories
L.-M. Asselin 02-11-04 Appendix 3 page 33D:\Bureau de Québec\Projets\MIMAP-Vietnam-3\Report\INDEXCOM03-Graph_1.spo

VARNAME_: C_TRADMI C-Traditional midwife in community
DIM1
,2,10,0-,1-,2-,3-,4-,5
DIM
2
,3
,2
,1
0,0
-,1
tradmidN
tradmidY
VARNAME_: C_TRAIMI C-Trained midwife in community
DIM1
,3,2,10,0-,1
DIM
2
,06
,05
,04
,03
,02
,01
0,00
-,01
-,02
traimidN
traimidY
VARNAME_: C_WATER C-Source of drinking water
DIM1
1,0,8,6,4,20,0-,2-,4
DIM
2
,4
,2
0,0
-,2
-,4
-,6
-,8
other
river
dug well drilled
rain
VLSS-1 Communes Data Exploration39 variables 111 categories
L.-M. Asselin 02-11-04 Appendix 3 page 34D:\Bureau de Québec\Projets\MIMAP-Vietnam-3\Report\INDEXCOM03-Graph_1.spo

Discrimination MeasuresRank Rank
1 2 dim 1 dim 2C-Do hlds have electricity? 0,514 0,154 1 14C-Proportion of land quality 1 0,492 0,121 2 19C-First reason not attending prim sch 0,388 0,133 3 17C-Proportion of land quality 2 0,371 0,244 4 3C-Primary enrolment rate 0,348 0,136 5 16C-Where most of women give birth? 0,337 0,111 6 20C-loud speaker 0,315 0,095 7 23C-Major health problem in community 0,299 0,077 8 29C-First reason not attend sec school 0,289 0,081 9 27C-Enrol.rate at lower secondary school 0,287 0,072 10 30C-Major problem lower second school 0,278 0,083 11 26C-Pharmacy in community 0,262 0,095 12 24C-large enterprise < 10 kms 0,254 0,044 13 33C-Doctor in community 0,252 0,133 14 18C-Major problem primary school-rec 0,219 0,138 15 15C-Distance kms to hospital 0,209 0,177 16 10C-Is there an agric ext center in the community? 0,206 0,004 17 37C-market 0,194 0,171 18 12C-Proportion of land quality 5 0,176 0,175 19 11C-Distance public transportation 0,175 0,164 20 13C-Proportion of land quality 6 0,167 0,243 21 4C-Pharmacist in community 0,138 0,019 22 35C-food shop 0,132 0,221 23 5C-Proportion of land quality 7 0,123 0,096 24 21C-Is there an agric coop in the community? 0,115 0,375 25 1C-Proportion of land quality 3 0,107 0,178 26 7C-Road passes by the community 0,106 0,046 27 32C-Fees at lower secondary school 0,081 0,072 28 31C-post office 0,079 0,193 29 6C-Source of drinking water 0,078 0,178 30 8C-Major health service prob in commun. 0,07 0,021 31 34C-Traditional midwife in community 0,069 0,015 32 36C-Is there a lower secondary school? 0,03 0,002 33 38C-Study fees at grade 1-3 (000 dongs) 0,021 0,096 34 22C-Study fees at grade 4-5 (000 dongs) 0,021 0,079 35 28C-Traditional healer in community 0,018 0,094 36 25C-Proportion of land quality 4 0,016 0,178 37 9C-Trained midwife in community 0,009 0,001 38 39C-Clinic in community 0,005 0,259 39 2
Dimension
Louis-Marie Asselin 02-11-04 VLSS1-Communes-explo-discr.xls Appendix 3 page 35

Appendix 4 Final Data Analysis with Multiple CorrespondenceAnalysis

Homals
Credit
HOMALSVersion 1.0byData Theory Scaling System Group (DTSS)Faculty of Social and Behavioral SciencesLeiden University, The Netherlands
Case Processing Summary
120Cases Used in Analysis
Marginal Frequencies
C-Is there an agric coop in the community?
77430
AgricYAgricNMissing
MarginalFrequency
C-Where most of women give birth?
358050
homehos,cliotherMissing
MarginalFrequency
C-Clinic in community
37830
clinYesclinNOMissing
MarginalFrequency
VLSS-1 Communes Final Data Analysis24 variables 56 categories
L.-M. Asselin 02-10-30 Appendix 4 page 1D:\CF Gauss projets\Formation SISERA Dakar nov 2002\Volume 2\Homals VLSS1-COMMUNES-final.spo

C-Doctor in community
50700
Doctor-YDoctor-NMissing
MarginalFrequency
C-Distance kms to hospital
2349471
d<=3kd3-10kd>10kMissing
MarginalFrequency
C-Do hlds have electricity?
1550550
C-NoneC-A fewC-MostMissing
MarginalFrequency
C-large enterprise < 10 kms
55650
entYESentNOMissing
MarginalFrequency
C-Is there an agric ext center in the community?
31890
ExtYExtNMissing
MarginalFrequency
VLSS-1 Communes Final Data Analysis24 variables 56 categories
L.-M. Asselin 02-10-30 Appendix 4 page 2D:\CF Gauss projets\Formation SISERA Dakar nov 2002\Volume 2\Homals VLSS1-COMMUNES-final.spo

C-food shop
52680
foodsYESfoodsNOMissing
MarginalFrequency
C-Proportion of land quality 1
5741220
Land1=0Land1<25Land1>25Missing
MarginalFrequency
C-Proportion of land quality 7
5351160
Land7=0land7<25Land7>25Missing
MarginalFrequency
C-loud speaker
64560
speakYESspeakNOMissing
MarginalFrequency
C-market
56640
dailyNOdailyYESMissing
MarginalFrequency
VLSS-1 Communes Final Data Analysis24 variables 56 categories
L.-M. Asselin 02-10-30 Appendix 4 page 3D:\CF Gauss projets\Formation SISERA Dakar nov 2002\Volume 2\Homals VLSS1-COMMUNES-final.spo

C-Pharmacist in community
65550
phcistYphcistNMissing
MarginalFrequency
C-Pharmacy in community
85350
Pharm-YPharm-NMissing
MarginalFrequency
C-post office
41790
postYESpostNOMissing
MarginalFrequency
C-Primary enrolment rate
2215830
primr80primr90prir100Missing
MarginalFrequency
C-Distance public transportation
7728150
pubt3kpubt10kpubt11k+Missing
MarginalFrequency
VLSS-1 Communes Final Data Analysis24 variables 56 categories
L.-M. Asselin 02-10-30 Appendix 4 page 4D:\CF Gauss projets\Formation SISERA Dakar nov 2002\Volume 2\Homals VLSS1-COMMUNES-final.spo

C-Road passes by the community
103170
roadYESrosdNOMissing
MarginalFrequency
C-Enrol.rate at lower secondary school
3135540
s<=35s35-70s>70Missing
MarginalFrequency
C-Is there a lower secondary school?
106140
secsnosecsMissing
MarginalFrequency
C-Traditional healer in community
77430
tradheYtradheNMissing
MarginalFrequency
C-Traditional midwife in community
87330
tradmidYtradmidNMissing
MarginalFrequency
VLSS-1 Communes Final Data Analysis24 variables 56 categories
L.-M. Asselin 02-10-30 Appendix 4 page 5D:\CF Gauss projets\Formation SISERA Dakar nov 2002\Volume 2\Homals VLSS1-COMMUNES-final.spo

C-Trained midwife in community
101190
traimidYtraimidNMissing
MarginalFrequency
Iteration History
,348877 ,000010Iteration9a
Fit
Differencefrom thePreviousIteration
The iteration was terminated because convergence criteria are satisified.a.
Eigenvalues
,216,133
Dimension12
Eigenvalue
VLSS-1 Communes Final Data Analysis24 variables 56 categories
L.-M. Asselin 02-10-30 Appendix 4 page 6D:\CF Gauss projets\Formation SISERA Dakar nov 2002\Volume 2\Homals VLSS1-COMMUNES-final.spo

Discrimination Measures
,034 ,489
,291 ,201
,044 ,183,374 ,051
,186 ,159
,398 ,371
,295 ,001
,231 ,009
,276 ,134
,326 ,149
,093 ,060
,382 ,023,326 ,120
,268 ,031
,414 ,046
,209 ,175,210 ,283
,312 ,029
,133 ,125
,222 ,203
,053 ,003
,078 ,139
,026 ,172
,010 ,029
C-Is there an agric coopin the community?
C-Where most of womengive birth?
C-Clinic in communityC-Doctor in communityC-Distance kms tohospital
C-Do hlds haveelectricity?
C-large enterprise < 10kms
C-Is there an agric extcenter in the community?
C-food shopC-Proportion of landquality 1
C-Proportion of landquality 7
C-loud speakerC-marketC-Pharmacist incommunity
C-Pharmacy incommunity
C-post officeC-Primary enrolment rateC-Distance publictransportation
C-Road passes by thecommunity
C-Enrol.rate at lowersecondary school
C-Is there a lowersecondary school?
C-Traditional healer incommunity
C-Traditional midwife incommunity
C-Trained midwife incommunity
1 2Dimension
VLSS-1 Communes Final Data Analysis24 variables 56 categories
L.-M. Asselin 02-10-30 Appendix 4 page 7D:\CF Gauss projets\Formation SISERA Dakar nov 2002\Volume 2\Homals VLSS1-COMMUNES-final.spo

Discrimination Measures
Dimension 1
,5,4,3,2,10,0
Dim
ensi
on 2
,5
,4
,3
,2
,1
0,0
-,1
C-Trained mi
C-TraditionaC-Traditiona
C-Is there a
C-Enrol.rate
C-Road passe
C-Distance p
C-Primary en
C-post offic
C-Pharmacy iC-Pharmacist
C-market
C-loud speakC-Proportion
C-ProportionC-food shop
C-Is there aC-large ente
C-Do hlds ha
C-Distance k
C-Doctor in
C-Clinic inC-Where most
Quantifications
C-Is there an agric coop in the community?
77 ,138 -,52343 -,245 ,9360
AgricYAgricNMissing
MarginalFrequency 1 2
DimensionCategory Quantifications
C-Where most of women give birth?
35 -,835 ,25080 ,329 -,2275 ,600 1,8880
homehos,cliotherMissing
MarginalFrequency 1 2
DimensionCategory Quantifications
VLSS-1 Communes Final Data Analysis24 variables 56 categories
L.-M. Asselin 02-10-30 Appendix 4 page 8D:\CF Gauss projets\Formation SISERA Dakar nov 2002\Volume 2\Homals VLSS1-COMMUNES-final.spo

C-Clinic in community
37 ,316 ,64183 -,140 -,2860
clinYesclinNOMissing
MarginalFrequency 1 2
DimensionCategory Quantifications
C-Doctor in community
50 ,724 ,26770 -,516 -,1910
Doctor-YDoctor-NMissing
MarginalFrequency 1 2
DimensionCategory Quantifications
C-Distance kms to hospital
23 ,776 ,38249 ,009 -,47847 -,425 ,3121
d<=3kd3-10kd>10kMissing
MarginalFrequency 1 2
DimensionCategory Quantifications
C-Do hlds have electricity?
15 -1,237 -,23050 -,297 ,70955 ,609 -,5820
C-NoneC-A fewC-MostMissing
MarginalFrequency 1 2
DimensionCategory Quantifications
VLSS-1 Communes Final Data Analysis24 variables 56 categories
L.-M. Asselin 02-10-30 Appendix 4 page 9D:\CF Gauss projets\Formation SISERA Dakar nov 2002\Volume 2\Homals VLSS1-COMMUNES-final.spo

C-large enterprise < 10 kms
55 ,591 -,02965 -,499 ,0250
entYESentNOMissing
MarginalFrequency 1 2
DimensionCategory Quantifications
C-Is there an agric ext center in the community?
31 ,815 -,15989 -,283 ,0550
ExtYExtNMissing
MarginalFrequency 1 2
DimensionCategory Quantifications
C-food shop
52 ,601 ,41868 -,459 -,3200
foodsYESfoodsNOMissing
MarginalFrequency 1 2
DimensionCategory Quantifications
C-Proportion of land quality 1
57 -,562 ,40441 ,309 -,39022 ,884 -,3200
Land1=0Land1<25Land1>25Missing
MarginalFrequency 1 2
DimensionCategory Quantifications
VLSS-1 Communes Final Data Analysis24 variables 56 categories
L.-M. Asselin 02-10-30 Appendix 4 page 10D:\CF Gauss projets\Formation SISERA Dakar nov 2002\Volume 2\Homals VLSS1-COMMUNES-final.spo

C-Proportion of land quality 7
53 ,139 ,23751 ,100 -,28116 -,774 ,1100
Land7=0land7<25Land7>25Missing
MarginalFrequency 1 2
DimensionCategory Quantifications
C-loud speaker
64 ,579 ,14356 -,660 -,1640
speakYESspeakNOMissing
MarginalFrequency 1 2
DimensionCategory Quantifications
C-market
56 -,610 -,37064 ,535 ,3240
dailyNOdailyYESMissing
MarginalFrequency 1 2
DimensionCategory Quantifications
C-Pharmacist in community
65 ,477 ,16255 -,562 -,1910
phcistYphcistNMissing
MarginalFrequency 1 2
DimensionCategory Quantifications
VLSS-1 Communes Final Data Analysis24 variables 56 categories
L.-M. Asselin 02-10-30 Appendix 4 page 11D:\CF Gauss projets\Formation SISERA Dakar nov 2002\Volume 2\Homals VLSS1-COMMUNES-final.spo

C-Pharmacy in community
85 ,413 ,13835 -1,002 -,3350
Pharm-YPharm-NMissing
MarginalFrequency 1 2
DimensionCategory Quantifications
C-post office
41 ,635 ,58179 -,329 -,3020
postYESpostNOMissing
MarginalFrequency 1 2
DimensionCategory Quantifications
C-Primary enrolment rate
22 -,913 ,87915 -,181 ,66483 ,276 -,3530
primr80primr90prir100Missing
MarginalFrequency 1 2
DimensionCategory Quantifications
C-Distance public transportation
77 ,388 ,05128 -,441 ,10015 -1,165 -,4460
pubt3kpubt10kpubt11k+Missing
MarginalFrequency 1 2
DimensionCategory Quantifications
VLSS-1 Communes Final Data Analysis24 variables 56 categories
L.-M. Asselin 02-10-30 Appendix 4 page 12D:\CF Gauss projets\Formation SISERA Dakar nov 2002\Volume 2\Homals VLSS1-COMMUNES-final.spo

C-Road passes by the community
103 ,149 -,14417 -,897 ,8710
roadYESrosdNOMissing
MarginalFrequency 1 2
DimensionCategory Quantifications
C-Enrol.rate at lower secondary school
31 -,732 ,67535 -,013 ,06754 ,430 -,4310
s<=35s35-70s>70Missing
MarginalFrequency 1 2
DimensionCategory Quantifications
C-Is there a lower secondary school?
106 ,084 -,02114 -,634 ,1580
secsnosecsMissing
MarginalFrequency 1 2
DimensionCategory Quantifications
C-Traditional healer in community
77 ,210 ,27843 -,374 -,4990
tradheYtradheNMissing
MarginalFrequency 1 2
DimensionCategory Quantifications
VLSS-1 Communes Final Data Analysis24 variables 56 categories
L.-M. Asselin 02-10-30 Appendix 4 page 13D:\CF Gauss projets\Formation SISERA Dakar nov 2002\Volume 2\Homals VLSS1-COMMUNES-final.spo

C-Traditional midwife in community
87 -,098 ,25533 ,261 -,6730
tradmidYtradmidNMissing
MarginalFrequency 1 2
DimensionCategory Quantifications
C-Trained midwife in community
101 ,045 ,07419 -,233 -,3910
traimidYtraimidNMissing
MarginalFrequency 1 2
DimensionCategory Quantifications
Quantifications
Dimension 1
1,0,50,0-,5-1,0-1,5
Dim
ensi
on 2
2,0
1,5
1,0
,5
0,0
-,5
-1,0
C-large enterprise <
10 kms
C-Do hlds have elect
ricity?
C-Distance kms to ho
spital
C-Doctor in communit
y
C-Clinic in communit
y
C-Where most of wome
n give birth?
C-Is there an agric
coop in the communit
traimidN
traimidY
tradmidN
tradmidY
tradheN
tradheYnosecs
secs
s>70
s35-70
s<=35
rosdNO
roadYES
pubt11k+
pubt10k pubt3k
prir100
primr90
primr80
postNO
postYES
Pharm-N
Pharm-Y
phcistN
phcistYdailyYES
dailyNO
speakNO
speakYESLand7>25
land7<25
Land7=0
Land1>25Land1<25
Land1=0
foodsNO
foodsYES
ExtN
ExtYentNO entYES
C-Most
C-A few
C-None
d>10k
d3-10k
d<=3k
Doctor-N
Doctor-Y
clinNO
clinYes
other
hos,cli
home
AgricN
AgricY
VLSS-1 Communes Final Data Analysis24 variables 56 categories
L.-M. Asselin 02-10-30 Appendix 4 page 14D:\CF Gauss projets\Formation SISERA Dakar nov 2002\Volume 2\Homals VLSS1-COMMUNES-final.spo

Object Scores
-2,301 -,408-1,287 -,698
-,013 1,700-1,177 ,225-1,033 -,165-1,296 -,597-1,412 -,845-1,365 ,090
-,509 -,661-,139 -1,653
-1,268 ,040-1,186 ,627-1,167 -,889
-,445 -,751-,966 -,053,022 -,355,946 -1,089,706 ,118
1,508 -,2381,139 -,8991,115 -,492,430 -1,011
-1,694 -,212-1,123 -1,613
-,487 -,074-,008 -,798-,486 -1,855-,652 -1,017,581 ,013
-,700 -,825,254 -,422
1,772 -,050,730 -1,050
1,928 ,199,663 -1,663,893 -,886
1,261 -,4981,419 -,4211,194 -,5871,268 -1,017,397 -1,779
1,564 -,7381,410 ,265,347 -,704
1234567891011121314151617181920212223242526272829303132333435363738394041424344
1 2Dimension
VLSS-1 Communes Final Data Analysis24 variables 56 categories
L.-M. Asselin 02-10-30 Appendix 4 page 15D:\CF Gauss projets\Formation SISERA Dakar nov 2002\Volume 2\Homals VLSS1-COMMUNES-final.spo

Object Scores
,490 -,698,049 -,764,444 -,679,854 -,357,975 -,751
-,993 -,1681,430 -,573,316 -1,225,582 -,811
-,900 -,734-,103 -,857-,568 -,5711,453 -,035-,367 -1,512,471 -1,321,158 -,872
-,181 -,896-2,157 -,308
-,799 -1,569-,683 -,742-,542 -1,141-,122 ,027
-1,478 -,877,403 -,273
-2,467 ,233,007 -,424
1,707 -,203-,085 ,496
-1,056 ,4451,305 -,486
-2,028 ,099,535 -,828,546 -,180,142 -,559
1,352 ,310,459 ,882
1,290 ,597,513 -1,001,728 ,578
-,644 ,331-,774 ,3641,233 1,410
-1,093 ,282,669 1,314
4546474849505152535455565758596061626364656667686970717273747576777879808182838485868788
1 2Dimension
VLSS-1 Communes Final Data Analysis24 variables 56 categories
L.-M. Asselin 02-10-30 Appendix 4 page 16D:\CF Gauss projets\Formation SISERA Dakar nov 2002\Volume 2\Homals VLSS1-COMMUNES-final.spo

Object Scores
,561 ,735-,818 1,540,770 -,185,127 2,206
1,337 ,142-,037 ,107,736 ,844
-1,000 ,849-,046 1,830,640 ,577,630 ,833,952 1,773,515 1,665,247 2,112
1,080 1,131,155 1,861
-,453 1,547-,442 1,193,360 1,264
-,477 ,290,862 ,977,209 1,575,917 2,769
-1,722 ,927-1,616 ,889
-,139 -,250,584 2,050
-,267 2,353-1,421 1,331-1,334 ,415-1,112 1,198-1,628 1,238
8990919293949596979899100101102103104105106107108109110111112113114115116117118119120
1 2Dimension
VLSS-1 Communes Final Data Analysis24 variables 56 categories
L.-M. Asselin 02-10-30 Appendix 4 page 17D:\CF Gauss projets\Formation SISERA Dakar nov 2002\Volume 2\Homals VLSS1-COMMUNES-final.spo

VARNAME_: C_AGRCOO C-Is there an agric coop in the communit
DIM1
,2,1-,0-,1-,2-,3
DIM
2
1,2
1,0
,8
,6
,4
,2
-,0
-,2
-,4
-,6
AgricN
AgricY
VARNAME_: C_BIRTH C-Where most of women give birth?
DIM1
,8,6,4,2,0-,2-,4-,6-,8-1,0
DIM
2
2,5
2,0
1,5
1,0
,5
0,0
-,5
other
hos,cli
home
VARNAME_: C_CLINIC C-Clinic in community
DIM1
,4,3,2,10,0-,1-,2
DIM
2
,8
,6
,4
,2
0,0
-,2
-,4
clinNO
clinYes
VARNAME_: C_DOCTOR C-Doctor in community
DIM1
,8,6,4,2-,0-,2-,4-,6
DIM
2
,3
,2
,1
0,0
-,1
-,2Doctor-N
Doctor-Y
VLSS-1 Communes Final Data Analysis24 variables 56 categories
L.-M. Asselin 02-11-04 Appendix 4 page 18D:\Bureau de Québec\Projets\MIMAP-Vietnam-3\INDEXCOM04-Graph_1.spo

VARNAME_: C_DSTHOS C-Distance kms to hospital
DIM1
1,0,8,6,4,2-,0-,2-,4-,6
DIM
2
,6
,4
,2
-,0
-,2
-,4
-,6
d>10k
d3-10k
d<=3k
VARNAME_: C_ELEC C-Do hlds have electricity?
DIM1
1,0,50,0-,5-1,0-1,5
DIM
2
,8
,6
,4
,2
-,0
-,2
-,4
-,6C-Most
C-A few
C-None
VARNAME_: C_ENTERP C-large enterprise < 10 kms
DIM1
,8,6,4,2-,0-,2-,4-,6
DIM
2
,03
,02
,01
0,00
-,01
-,02
-,03
entNO
entYES
VARNAME_: C_EXTCEN C-Is there an agric ext center in the co
DIM1
1,0,8,6,4,20,0-,2-,4
DIM
2
,1
0,0
-,1
-,2
ExtN
ExtY
VLSS-1 Communes Final Data Analysis24 variables 56 categories
L.-M. Asselin 02-11-04 Appendix 4 page 19D:\Bureau de Québec\Projets\MIMAP-Vietnam-3\INDEXCOM04-Graph_1.spo

VARNAME_: C_FOODSH C-food shop
DIM1
,8,6,4,2-,0-,2-,4-,6
DIM
2
,6
,4
,2
0,0
-,2
-,4
foodsNO
foodsYES
VARNAME_: C_LAND1 C-Proportion of land quality 1
DIM1
1,0,8,6,4,20,0-,2-,4-,6-,8
DIM
2
,6
,4
,2
-,0
-,2
-,4
-,6
Land1>25Land1<25
Land1=0
VARNAME_: C_LAND7 C-Proportion of land quality 7
DIM1
,20,0-,2-,4-,6-,8-1,0
DIM
2
,3
,2
,1
-,0
-,1
-,2
-,3
Land7>25
land7<25
Land7=0
VARNAME_: C_LOUDSP C-loud speaker
DIM1
,8,6,4,20,0-,2-,4-,6-,8
DIM
2
,2
,1
0,0
-,1
-,2
speakNO
speakYES
VLSS-1 Communes Final Data Analysis24 variables 56 categories
L.-M. Asselin 02-11-04 Appendix 4 page 20D:\Bureau de Québec\Projets\MIMAP-Vietnam-3\INDEXCOM04-Graph_1.spo

VARNAME_: C_MARKET C-market
DIM1
,8,6,4,20,0-,2-,4-,6-,8
DIM
2
,4
,3
,2
,1
0,0
-,1
-,2
-,3
-,4
dailyYES
dailyNO
VARNAME_: C_PHAMAC C-Pharmacist in community
DIM1
,6,4,20,0-,2-,4-,6-,8
DIM
2
,2
,1
0,0
-,1
-,2phcistN
phcistY
VARNAME_: C_PHARM C-Pharmacy in community
DIM1
,6,4,2,0-,2-,4-,6-,8-1,0-1,2
DIM
2
,2
,1
0,0
-,1
-,2
-,3
-,4
Pharm-N
Pharm-Y
VARNAME_: C_POSTOF C-post office
DIM1
,8,6,4,20,0-,2-,4
DIM
2
,8
,6
,4
,2
0,0
-,2
-,4
postNO
postYES
VLSS-1 Communes Final Data Analysis24 variables 56 categories
L.-M. Asselin 02-11-04 Appendix 4 page 21D:\Bureau de Québec\Projets\MIMAP-Vietnam-3\INDEXCOM04-Graph_1.spo

VARNAME_: C_PRIRAT C-Primary enrolment rate
DIM1
,4,20,0-,2-,4-,6-,8-1,0
DIM
2
1,0
,8
,6
,4
,2
0,0
-,2
-,4prir100
primr90
primr80
VARNAME_: C_PUBTRA C-Distance public transportation
DIM1
,6,4,2,0-,2-,4-,6-,8-1,0-1,2-1,4
DIM
2
,2
,1
0,0
-,1
-,2
-,3
-,4
-,5
pubt11k+
pubt10k
pubt3k
VARNAME_: C_ROADS C-Road passes by the community
DIM1
,4,20,0-,2-,4-,6-,8-1,0
DIM
2
1,0
,8
,6
,4
,2
0,0
-,2
rosdNO
roadYES
VARNAME_: C_SECRAT C-Enrol.rate at lower secondary school
DIM1
,6,4,20,0-,2-,4-,6-,8
DIM
2
,8
,6
,4
,2
-,0
-,2
-,4
-,6
s>70
s35-70
s<=35
VLSS-1 Communes Final Data Analysis24 variables 56 categories
L.-M. Asselin 02-11-04 Appendix 4 page 22D:\Bureau de Québec\Projets\MIMAP-Vietnam-3\INDEXCOM04-Graph_1.spo

VARNAME_: C_SECSCH C-Is there a lower secondary school?
DIM1
,20,0-,2-,4-,6-,8
DIM
2
,2
,1
0,0
-,1
nosecs
secs
VARNAME_: C_TRADHE C-Traditional healer in community
DIM1
,3,2,1,0-,1-,2-,3-,4-,5
DIM
2
,4
,2
-,0
-,2
-,4
-,6
tradheN
tradheY
VARNAME_: C_TRADMI C-Traditional midwife in community
DIM1
,3,2,10,0-,1-,2
DIM
2
,4
,2
0,0
-,2
-,4
-,6
-,8
tradmidN
tradmidY
VARNAME_: C_TRAIMI C-Trained midwife in community
DIM1
,10,0-,1-,2-,3
DIM
2
,2
,1
0,0
-,1
-,2
-,3
-,4traimidN
traimidY
VLSS-1 Communes Final Data Analysis24 variables 56 categories
L.-M. Asselin 02-11-04 Appendix 4 page 23D:\Bureau de Québec\Projets\MIMAP-Vietnam-3\INDEXCOM04-Graph_1.spo

VLSS-1 Communes Final Data Analysis24 variables
56 categoriesDiscrimination MeasuresDimension Rank Rank
1 2 dim 1 dim 2C-Pharmacy in community 0,414 0,046 1 17C-Do hlds have electricity? 0,398 0,371 2 2C-loud speaker 0,382 0,023 3 21C-Doctor in community 0,374 0,051 4 16C-Proportion of land quality 1 0,326 0,149 5 10C-market 0,326 0,12 6 14C-Distance public transportation 0,312 0,029 7 19C-large enterprise < 10 kms 0,295 0,001 8 24C-Where most of women give birth? 0,291 0,201 9 5C-food shop 0,276 0,134 10 12C-Pharmacist in community 0,268 0,031 11 18C-Is there an agric ext center in the community? 0,231 0,009 12 22C-Enrol.rate at lower secondary school 0,222 0,203 13 4C-Primary enrolment rate 0,21 0,283 14 3C-post office 0,209 0,175 15 7C-Distance kms to hospital 0,186 0,159 16 9C-Road passes by the community 0,133 0,125 17 13C-Proportion of land quality 7 0,093 0,06 18 15C-Traditional healer in community 0,078 0,139 19 11C-Is there a lower secondary school? 0,053 0,003 20 23C-Clinic in community 0,044 0,183 21 6C-Is there an agric coop in the community? 0,034 0,489 22 1C-Traditional midwife in community 0,026 0,172 23 8C-Trained midwife in community 0,01 0,029 24 20
Appendix 4 page 24

Communes ordered according to decreasing multidimensional poverty
69 -2,467 1985 364 North Central1 -2,301 1719 272 Northern Uplands
62 -2,157 4147 904 North Central75 -2,028 4360 608 Central Coast
112 -1,722 12193 2074 Mekong River Delta23 -1,694 5614 1060 Northern Uplands
120 -1,628 22691 3885 Mekong River Delta113 -1,616 22865 3969 Mekong River Delta67 -1,478 2547 546 North Central
117 -1,421 6189 1032 Mekong River Delta7 -1,412 3967 623 Northern Uplands8 -1,365 5292 1054 Northern Uplands
118 -1,334 9019 1563 Mekong River Delta6 -1,296 2984 502 Northern Uplands2 -1,287 3308 582 Northern Uplands
11 -1,268 3620 695 Northern Uplands12 -1,186 6501 1148 Northern Uplands4 -1,177 3617 617 Northern Uplands
13 -1,167 1085 221 Red River Delta24 -1,123 6618 1354 Northern Uplands
119 -1,112 16816 2733 Mekong River Delta87 -1,093 6483 1325 Southeast73 -1,056 7110 931 Central Highlands5 -1,033 4787 900 Northern Uplands
96 -1,000 12595 2501 Southeast50 -,993 8578 1548 Red River Delta15 -,966 2570 470 Red River Delta54 -,900 4699 1130 North Central90 -,818 5531 1139 Mekong River Delta63 -,799 5356 1106 North Central85 -,774 5301 932 Central Highlands30 -,700 8957 2156 Red River Delta64 -,683 2264 555 North Central28 -,652 3505 585 Northern Uplands84 -,644 5767 994 Central Coast56 -,568 4387 820 North Central65 -,542 3860 720 North Central9 -,509 10428 1906 Northern Uplands
25 -,487 13755 2686 Northern Uplands27 -,486 9597 1958 Northern Uplands
108 -,477 7602 1407 Mekong River Delta105 -,453 13328 2773 Mekong River Delta14 -,445 6710 1461 Red River Delta
106 -,442 13886 2633 Mekong River Delta58 -,367 6533 1132 North Central
116 -,267 10497 2146 Mekong River Delta61 -,181 7626 1651 North Central10 -,139 4283 843 Northern Uplands
114 -,139 14956 2756 Mekong River Delta66 -,122 8509 1780 North Central
1234567891011121314151617181920212223242526272829303132333435363738394041424344454647484950
Code of thecommunity
CompositePovertyIndicator
Totalpopulation
Total numberof households Region
Appendix 4 page 25

Communes ordered according to decreasing multidimensional poverty
55 -,103 3454 916 North Central72 -,085 2568 551 Central Coast97 -,046 10921 2046 Southeast94 -,037 5490 1338 Southeast3 -,013 4445 844 Northern Uplands
26 -,008 10156 2085 Northern Uplands70 ,007 7941 213 Central Coast16 ,022 7013 1679 Red River Delta46 ,049 6643 1720 Red River Delta92 ,127 13129 2257 Southeast78 ,142 10733 2310 Central Coast
104 ,155 12127 2202 Mekong River Delta60 ,158 4589 978 North Central
110 ,209 16906 2771 Mekong River Delta102 ,247 3981 787 Mekong River Delta31 ,254 6221 1539 Red River Delta52 ,316 4538 1239 North Central44 ,347 6321 1631 Red River Delta
107 ,360 7213 1401 Mekong River Delta41 ,397 5910 1697 Red River Delta68 ,403 11537 2100 North Central22 ,430 4316 990 Northern Uplands47 ,444 4001 937 Red River Delta80 ,459 8760 1621 Central Highlands59 ,471 5980 1400 North Central45 ,490 8250 2086 Red River Delta82 ,513 8111 1182 Central Coast
101 ,515 13008 2356 Mekong River Delta76 ,535 8633 1900 Central Coast77 ,546 8891 1798 Central Coast89 ,561 18144 3659 Southeast29 ,581 9771 2192 Red River Delta53 ,582 4072 900 North Central
115 ,584 22011 4002 Mekong River Delta99 ,630 8180 1543 Mekong River Delta98 ,640 30542 1809 Mekong River Delta35 ,663 7232 1823 Red River Delta88 ,669 10933 2094 Southeast18 ,706 9834 1936 Red River Delta83 ,728 8254 1547 Central Coast33 ,730 7019 2109 Red River Delta95 ,736 18358 3229 Southeast91 ,770 3223 688 Mekong River Delta48 ,854 11238 2892 Red River Delta
109 ,862 11962 2069 Mekong River Delta36 ,893 7463 1534 Red River Delta
111 ,917 11267 1893 Mekong River Delta17 ,946 9825 1936 Red River Delta
100 ,952 12354 2088 Mekong River Delta49 ,975 7260 1610 Red River Delta
51525354555657585960616263646566676869707172737475767778798081828384858687888990919293949596979899100
Code of thecommunity
CompositePovertyIndicator
Totalpopulation
Total numberof households Region
Appendix 4 page 26

Communes ordered according to decreasing multidimensional poverty
103 1,080 13700 2556 Mekong River Delta21 1,115 7875 1776 Red River Delta20 1,139 8089 1825 Red River Delta39 1,194 5686 1310 Red River Delta86 1,233 15489 3011 Southeast37 1,261 6692 1894 Red River Delta40 1,268 7324 1995 Red River Delta81 1,290 16290 2169 Central Highlands74 1,305 9753 1923 Central Coast93 1,337 12559 2371 Southeast79 1,352 16848 3623 Central Coast43 1,410 12136 3034 Red River Delta38 1,419 6756 1640 Red River Delta51 1,430 10158 2547 Red River Delta57 1,453 16824 4487 North Central19 1,508 13726 3078 Red River Delta42 1,564 5225 1326 Red River Delta71 1,707 13367 2961 Central Coast32 1,772 7800 1540 Red River Delta34 1,928 9898 2145 Red River Delta
101102103104105106107108109110111112113114115116117118119120
Code of thecommunity
CompositePovertyIndicator
Totalpopulation
Total numberof households Region
Appendix 4 page 27

Graph 1
Regions in the Poverty Map
DIM1
,8,6,4,2,0-,2-,4-,6-,8-1,0
DIM
2
1,5
1,0
,5
0,0
-,5
-1,0
R7
R6
R5
R4
R3R2
R1
Second Factorial AxisThe North / South Poverty Types
L.-M. Asselin 02-11-04 Appendix 4 page 28

Graph 2
Regions and Economy/Infras.
DIM1
1,0,50,0-,5-1,0-1,5
DIM
2
1,5
1,0
,5
0,0
-,5
-1,0
Regions of Vietnam
C-Road passes by the
community
C-Distance public tr
ansportation
C-post office
C-market
C-loud speaker
C-food shop
C-large enterprise <
10 kms
C-Do hlds have elect
ricity?
R7
R6
R5
R4
R3R2
R1
rosdNO
roadYES
pubt11k+
pubt10k pubt3k
postNO
postYES
dailyYES
dailyNO
speakNO
speakYES
foodsNO
foodsYES
entNO entYES
C-Most
C-A few
C-None
Second Factorial AxisThe North / South Poverty Types
L.-M. Asselin 02-11-04 Appendix 4 page 29

Graph 3
Regions and Education
DIM1
,8,6,4,2,0-,2-,4-,6-,8-1,0
DIM
2
1,5
1,0
,5
0,0
-,5
-1,0
VARNAME_
Regions of Vietnam
C-Is there a lower s
econdary school?
C-Enrol.rate at lowe
r secondary school
C-Primary enrolment
rate
R7
R6
R5
R4
R3R2
R1
nosecssecs
s>70
s35-70
s<=35
prir100
primr90
primr80
Second Factorial AxisThe North / South Poverty Types
L.-M. Asselin 02-11-04 Appendix 4 page 30

Graph 4.1
Regions and Health Infrastructure
DIM1
1,0,50,0-,5-1,0-1,5
DIM
2
2,5
2,0
1,5
1,0
,5
0,0
-,5
-1,0
VARNAME_
Regions of Vietnam
C-Pharmacy in commun
ity
C-Distance kms to ho
spital
C-Clinic in communit
y
C-Where most of wome
n give birth?
R7
R6
R5
R4
R3R2
R1Pharm-N
Pharm-Yd>10k
d3-10k
d<=3k
clinNO
clinYes
other
hos,cli
home
Second Factorial AxisThe North / South Poverty Types
L.-M. Asselin 02-11-04 Appendix 4 page 31

Graph 4.2
Regions and Health Staff
DIM1
1,0,50,0-,5-1,0
DIM
2
1,5
1,0
,5
0,0
-,5
-1,0
VARNAME_
Regions of Vietnam
C-Trained midwife in
community
C-Traditional midwif
e in community
C-Traditional healer
in community
C-Pharmacist in comm
unity
C-Doctor in communit
y
R7
R6
R5
R4
R3R2
R1traimidN
traimidY
tradmidN
tradmidY
tradheN
tradheY
phcistN
phcistY
Doctor-N
Doctor-Y
Second Factorial AxisThe North / South Poverty Types
L.-M. Asselin 02-11-04 Appendix 4 page 32

Graph 5
Regions and Agriculture
DIM1
1,51,0,50,0-,5-1,0-1,5
DIM
2
1,5
1,0
,5
0,0
-,5
-1,0
VARNAME_
Regions of Vietnam
C-Proportion of land
quality 7
C-Proportion of land
quality 1
C-Is there an agric
ext center in the co
C-Is there an agric
coop in the communit
R7
R6
R5
R4
R3R2
R1
Land7>25
land7<25
Land7=0
Land1>25Land1<25
Land1=0
ExtN
ExtY
AgricN
AgricY
Second Factorial AxisThe North / South Poverty Types
L.-M. Asselin 02-11-04 Appendix 4 page 33

DOMAIN = Economy and Infrastructure
C-Do hlds have electricity? C-None , -5726C-A few , -1375C-Most , 2818
C-large enterprise < 10 kms entYES , 2735entNO , -2309
C-food shop foodsYES , 2784foodsNO , -2124
C-loud speaker speakYES , 2679speakNO , -3055
C-market dailyNO , -2822dailyYES , 2475
C-post office postYES , 2939postNO , -1521
C-Distance public transportation pubt3k , 1798pubt10k , -2044pubt11k+ , -5394
C-Road passes by the community roadYES , 689rosdNO , -4152
123456789101112131415161718
VARNAME_ LEVEL Value (0/1) Weight
DOMAIN = Education
Basic Questionnaire for the Composite Poverty Indicator
C-Primary enrolment rate primr80 , -4228primr90 , -838prir100 , 1276
C-Enrol.rate at lower secondary school s<=35 , -3389s35-70 , -60s>70 , 1990
C-Is there a lower secondary school? secs , 391nosecs , -2936
12345678
VARNAME_ LEVEL Value (0/1) Weight
Basic Questionnairefor the Composite Poverty Indicator
L.-M. Asselin 02-11-04 Appendix 4 page 33D:\Bureau de Québec\Projets\MIMAP-Vietnam-3\Basic Questionnaire.spo

DOMAIN = Health
C-Where most of women give birth? home , -3868hos,cli , 1523other , 2777
C-Clinic in community clinYes , 1462clinNO , -647
C-Doctor in community Doctor-Y , 3352Doctor-N , -2390
C-Distance kms to hospital d<=3k , 3593d3-10k , 40d>10k , -1967
C-Pharmacist in community phcistY , 2209phcistN , -2604
C-Pharmacy in community Pharm-Y , 1913Pharm-N , -4637
C-Traditional healer in community tradheY , 972tradheN , -1732
C-Traditional midwife in community tradmidY , -455tradmidN , 1210
C-Trained midwife in community traimidY , 206traimidN , -1079
1234567891011121314151617181920
VARNAME_ LEVEL Value (0/1) Weight
DOMAIN = Agriculture
C-Is there an agric coop in the communit AgricY , 638AgricN , -1134
C-Is there an agric ext center in the co ExtY , 3771ExtN , -1310
C-Proportion of land quality 1 Land1=0 , -2602Land1<25 , 1431Land1>25 , 4090
C-Proportion of land quality 7 Land7=0 , 643land7<25 , 463Land7>25 , -3585
12345678910
VARNAME_ LEVEL Value (0/1) Weight
Basic Questionnairefor the Composite Poverty Indicator
L.-M. Asselin 02-11-04 Appendix 4 page 34D:\Bureau de Québec\Projets\MIMAP-Vietnam-3\Basic Questionnaire.spo

Appendix 5 Multidimensional Inequality Indices

1
Output from STATA 7.0, package INEQUAL1
Graph 5.1 Lorenz curve Rural Vietnam Communes
1 Full extracts from the Log file are produced, so that the reader can see exactly which command hasbeen used.
cum
ulat
ive
prop
ortio
n of
CP
IND
Lorenz curvecumulative proportion of sample
_perc _share
0 .25 .5 .75 1
0
.25
.5
.75
1

2
Graph 5.2 Lorenz curve Southern Vietnam Communes
Graph 5.3 Lorenz curve Northern Vietnam Communes
cum
ulat
ive
prop
ortio
n of
CP
IND
Lorenz curvecumulative proportion of sample
_perc _share
0 .25 .5 .75 1
0
.25
.5
.75
1
cum
ulat
ive
prop
ortio
n of
CP
IND
Lorenz curvecumulative proportion of sample
_perc _share
0 .25 .5 .75 1
0
.25
.5
.75
1

3
INEQUALITY INDICES, NO DEMOGRAPHIC WEIGHT
ALL RURAL COMMUNES
. inequal CPIND
inequality measures of CPIND------------------------------------------------------------------------------relative mean deviation .1531104coefficient of variation .36701285standard deviation of logs .48716412Gini coefficient .20869541Mehran measure .32021582Piesch measure .1529352Kakwani measure .04463721Theil entropy measure .07444788Theil mean log deviation measure .09322898------------------------------------------------------------------------------
NORTHERN REGION
. inequal CPIND if REGION<3
inequality measures of CPIND------------------------------------------------------------------------------relative mean deviation .16452245coefficient of variation .38179454standard deviation of logs .47355409Gini coefficient .21659881Mehran measure .32953252Piesch measure .16013194Kakwani measure .04669201Theil entropy measure .0776762Theil mean log deviation measure .09241558------------------------------------------------------------------------------
CENTRAL REGION
. inequal CPIND if REGION<6 & REGION>2
inequality measures of CPIND------------------------------------------------------------------------------relative mean deviation .14947352coefficient of variation .38487863standard deviation of logs .58960337Gini coefficient .21165252Mehran measure .32655163Piesch measure .15420295Kakwani measure .05011845Theil entropy measure .084774Theil mean log deviation measure .11960289------------------------------------------------------------------------------

4
SOUTHERN REGION
. inequal CPIND if REGION>5
inequality measures of CPIND------------------------------------------------------------------------------relative mean deviation .13862376coefficient of variation .33132926standard deviation of logs .3980379Gini coefficient .18505806Mehran measure .28955798Piesch measure .1328081Kakwani measure .03585963Theil entropy measure .05854832Theil mean log deviation measure .0676148------------------------------------------------------------------------------
. lorenz CPIND

5
INEQUALITY INDICES, WEIGHT: # HOUSEHOLDS
ALL RURAL COMMUNES
. inequal CPIND [fw= S1Q04]
inequality measures of CPIND------------------------------------------------------------------------------relative mean deviation .13509426coefficient of variation .3252411standard deviation of logs .4123663Gini coefficient .18479409Mehran measure .2846507Piesch measure .13486576Kakwani measure .03577681Theil entropy measure .05883481Theil mean log deviation measure .07077489------------------------------------------------------------------------------
NORTHERN REGION
. inequal CPIND if REGION<3 [fw= S1Q04]
inequality measures of CPIND------------------------------------------------------------------------------relative mean deviation .12839965coefficient of variation .30433673standard deviation of logs .36925286Gini coefficient .1739491Mehran measure .26587567Piesch measure .12798581Kakwani measure .03095998Theil entropy measure .05071415Theil mean log deviation measure .05888592------------------------------------------------------------------------------
CENTRAL REGION
. inequal CPIND if REGION<6 & REGION>2 [fw= S1Q04]
inequality measures of CPIND------------------------------------------------------------------------------relative mean deviation .12134593coefficient of variation .306475standard deviation of logs .44294788Gini coefficient .17553689Mehran measure .26292676Piesch measure .13184194Kakwani measure .03267932Theil entropy measure .05444637Theil mean log deviation measure .07250243------------------------------------------------------------------------------

6
SOUTHERN REGION
. inequal CPIND if REGION>5 [fw= S1Q04]
inequality measures of CPIND------------------------------------------------------------------------------relative mean deviation .1454273coefficient of variation .34110567standard deviation of logs .41512565Gini coefficient .19220841Mehran measure .29114382Piesch measure .1427407Kakwani measure .0394341Theil entropy measure .06434994Theil mean log deviation measure .07512335------------------------------------------------------------------------------

7
INEQUALITY INDICES, WEIGHT: # INDIVIDUALS (POPULATION)
ALL RURAL COMMUNES
. inequal CPIND [fw= S1Q01]
inequality measures of CPIND------------------------------------------------------------------------------relative mean deviation .13857508coefficient of variation .33255324standard deviation of logs .42131143Gini coefficient .18884355Mehran measure .29061383Piesch measure .1379584Kakwani measure .03737538Theil entropy measure .06148653Theil mean log deviation measure .07397301------------------------------------------------------------------------------
NORTHERN REGION
. inequal CPIND if REGION<3 [fw= S1Q01]
inequality measures of CPIND------------------------------------------------------------------------------relative mean deviation .13995032coefficient of variation .32477286standard deviation of logs .39083004Gini coefficient .18633129Mehran measure .2820297Piesch measure .13848208Kakwani measure .03484566Theil entropy measure .05730863Theil mean log deviation measure .0662675------------------------------------------------------------------------------
CENTRAL REGION
. inequal CPIND if REGION<6 & REGION>2 [fw= S1Q01]
inequality measures of CPIND------------------------------------------------------------------------------relative mean deviation .12374636coefficient of variation .31127703standard deviation of logs .44930041Gini coefficient .17747784Mehran measure .26651732Piesch measure .13295809Kakwani measure .03367076Theil entropy measure .05612927Theil mean log deviation measure .07471267------------------------------------------------------------------------------

8
SOUTHERN REGION
. inequal CPIND if REGION>5 [fw= S1Q01]
inequality measures of CPIND------------------------------------------------------------------------------relative mean deviation .14543535coefficient of variation .33982559standard deviation of logs .41830112Gini coefficient .19042068Mehran measure .29040327Piesch measure .14042938Kakwani measure .03954641Theil entropy measure .06438089Theil mean log deviation measure .07576537------------------------------------------------------------------------------

Appendix 6 Multidimensional Poverty Indices

1
Output from STATA 7.0, package POVDECO1
POVERTY INDICES (FGT), NO DEMOGRAPHIC WEIGHT
Poverty line 3176
. povdeco CPIND , by ( BIGREG) pl(3176)
Total number of observations = 120Weighted total no. of observations = 120Number of observations poor = 72Weighted no. of obs poor = 72Mean of CPIND amongst the poor = 2089.187Mean of poverty gaps (poverty line - CPIND) amongst the poor = 1086.813
Foster-Greer-Thorbecke poverty indices, FGT(a)
---------------------------------------------- All obs | a=0 a=1 a=2----------+----------------------------------- | 0.60000 0.20532 0.10072----------------------------------------------FGT(0): headcount ratio (proportion poor)FGT(1): average normalised poverty gapFGT(2): average squared normalised poverty gap
Decompositions by subgroup--------------------------
Summary statistics for subgroup k = 1,...,K
----------------------------------------------------------------------Regions |North |Central |South | Pop. share Mean Mean|poor Mean gap|poor----------+----------------------------------------------------------- NORTH | 0.42500 2817.01880 2040.16785 1135.83215 CENTRAL | 0.28333 2649.17651 2103.97119 1072.02881 SOUTH | 0.29167 2707.82544 2141.39209 1034.60779----------------------------------------------------------------------
Subgroup FGT index estimates, FGT(a)
----------------------------------------------Regions |North |Central |South | a=0 a=1 a=2----------+----------------------------------- NORTH | 0.56863 0.20336 0.09932 CENTRAL | 0.64706 0.21841 0.11275 SOUTH | 0.60000 0.19545 0.09107----------------------------------------------
1 Full extracts from the Log file are produced, so that the reader can see exactly which command has beenused.

2
Subgroup poverty 'share', S_k = v_k.FGT_k(a)/FGT(a)
----------------------------------------------Regions |North |Central |South | a=0 a=1 a=2----------+----------------------------------- NORTH | 0.40278 0.42094 0.41908 CENTRAL | 0.30556 0.30140 0.31719 SOUTH | 0.29167 0.27766 0.26373----------------------------------------------
Subgroup poverty 'risk' = FGT_k(a)/FGT(a) = S_k/v_k
----------------------------------------------Regions |North |Central |South | a=0 a=1 a=2----------+----------------------------------- NORTH | 0.94771 0.99046 0.98608 CENTRAL | 1.07843 1.06376 1.11949 SOUTH | 1.00000 0.95196 0.90422

3
POVERTY INDICES (FGT), NO DEMOGRAPHIC WEIGHT
Poverty line 2282
. povdeco CPIND , by ( BIGREG) pl(2282)
Total number of observations = 120Weighted total no. of observations = 120Number of observations poor = 41Weighted no. of obs poor = 41Mean of CPIND amongst the poor = 1580.444Mean of poverty gaps (poverty line - CPIND) amongst the poor = 701.556
Foster-Greer-Thorbecke poverty indices, FGT(a)
---------------------------------------------- All obs | a=0 a=1 a=2----------+----------------------------------- | 0.34167 0.10504 0.04864----------------------------------------------FGT(0): headcount ratio (proportion poor)FGT(1): average normalised poverty gapFGT(2): average squared normalised poverty gap
Decompositions by subgroup--------------------------
Summary statistics for subgroup k = 1,...,K
----------------------------------------------------------------------Regions |North |Central |South | Pop. share Mean Mean|poor Mean gap|poor----------+----------------------------------------------------------- NORTH | 0.42500 2817.01880 1626.35779 655.64227 CENTRAL | 0.28333 2649.17651 1562.36780 719.63208 SOUTH | 0.29167 2707.82544 1514.89978 767.10010----------------------------------------------------------------------
Subgroup FGT index estimates, FGT(a)
----------------------------------------------Regions |North |Central |South | a=0 a=1 a=2----------+----------------------------------- NORTH | 0.37255 0.10704 0.04421 CENTRAL | 0.35294 0.11130 0.06411 SOUTH | 0.28571 0.09604 0.04007----------------------------------------------
Subgroup poverty 'share', S_k = v_k.FGT_k(a)/FGT(a)
----------------------------------------------Regions |North |

4
Central |South | a=0 a=1 a=2----------+----------------------------------- NORTH | 0.46341 0.43309 0.38631 CENTRAL | 0.29268 0.30022 0.37343 SOUTH | 0.24390 0.26669 0.24026----------------------------------------------
Subgroup poverty 'risk' = FGT_k(a)/FGT(a) = S_k/v_k
----------------------------------------------Regions |North |Central |South | a=0 a=1 a=2----------+----------------------------------- NORTH | 1.09039 1.01903 0.90896 CENTRAL | 1.03300 1.05961 1.31800 SOUTH | 0.83624 0.91436 0.82375----------------------------------------------

5
POVERTY INDICES (FGT), WEIGHT: # INDIVIDUALS (POPULATION)
Poverty line 3318
. povdeco CPIND [fw= S1Q01] , by ( BIGREG) pl(3318)
Total number of observations = 120Weighted total no. of observations = 1043520Number of observations poor = 82Weighted no. of obs poor = 626298Mean of CPIND amongst the poor = 2305.867Mean of poverty gaps (poverty line - CPIND) amongst the poor = 1012.133
Foster-Greer-Thorbecke poverty indices, FGT(a)
---------------------------------------------- All obs | a=0 a=1 a=2----------+----------------------------------- | 0.60018 0.18308 0.08632----------------------------------------------FGT(0): headcount ratio (proportion poor)FGT(1): average normalised poverty gapFGT(2): average squared normalised poverty gap
Decompositions by subgroup--------------------------
Summary statistics for subgroup k = 1,...,K
----------------------------------------------------------------------Regions |North |Central |South | Pop. share Mean Mean|poor Mean gap|poor----------+----------------------------------------------------------- NORTH | 0.33711 3050.76440 2292.89453 1025.10547 CENTRAL | 0.23535 3059.55420 2531.40796 786.59198 SOUTH | 0.42754 2717.91797 2183.73291 1134.26697----------------------------------------------------------------------
Subgroup FGT index estimates, FGT(a)
----------------------------------------------Regions |North |Central |South | a=0 a=1 a=2----------+----------------------------------- NORTH | 0.54165 0.16735 0.07395 CENTRAL | 0.65224 0.15463 0.06877 SOUTH | 0.61766 0.21115 0.10575----------------------------------------------
Subgroup poverty 'share', S_k = v_k.FGT_k(a)/FGT(a)
----------------------------------------------Regions |

6
North |Central |South | a=0 a=1 a=2----------+----------------------------------- NORTH | 0.30424 0.30813 0.28877 CENTRAL | 0.25577 0.19877 0.18749 SOUTH | 0.44000 0.49309 0.52374----------------------------------------------
Subgroup poverty 'risk' = FGT_k(a)/FGT(a) = S_k/v_k
----------------------------------------------Regions |North |Central |South | a=0 a=1 a=2----------+----------------------------------- NORTH | 0.90249 0.91406 0.85663 CENTRAL | 1.08674 0.84458 0.79664 SOUTH | 1.02914 1.15332 1.22499----------------------------------------------

7
POVERTY INDICES (FGT), WEIGHT: # INDIVIDUALS (POPULATION)
Poverty line 2282
. povdeco CPIND [fw= S1Q01] , by ( BIGREG) pl(2282)
Total number of observations = 120Weighted total no. of observations = 1043520Number of observations poor = 41Weighted no. of obs poor = 280269Mean of CPIND amongst the poor = 1597.013Mean of poverty gaps (poverty line - CPIND) amongst the poor = 684.987
Foster-Greer-Thorbecke poverty indices, FGT(a)
---------------------------------------------- All obs | a=0 a=1 a=2----------+----------------------------------- | 0.26858 0.08062 0.03513----------------------------------------------FGT(0): headcount ratio (proportion poor)FGT(1): average normalised poverty gapFGT(2): average squared normalised poverty gap
Decompositions by subgroup--------------------------
Summary statistics for subgroup k = 1,...,K
----------------------------------------------------------------------Regions |North |Central |South | Pop. share Mean Mean|poor Mean gap|poor----------+----------------------------------------------------------- NORTH | 0.33711 3050.76440 1790.05237 491.94754 CENTRAL | 0.23535 3059.55420 1647.62097 634.37909 SOUTH | 0.42754 2717.91797 1406.98962 875.01025----------------------------------------------------------------------
Subgroup FGT index estimates, FGT(a)
----------------------------------------------Regions |North |Central |South | a=0 a=1 a=2----------+----------------------------------- NORTH | 0.30275 0.06527 0.02381 CENTRAL | 0.21085 0.05861 0.03016 SOUTH | 0.27342 0.10484 0.04680----------------------------------------------
Subgroup poverty 'share', S_k = v_k.FGT_k(a)/FGT(a)
----------------------------------------------Regions |

8
North |Central |South | a=0 a=1 a=2----------+----------------------------------- NORTH | 0.38000 0.27291 0.22847 CENTRAL | 0.18476 0.17111 0.20206 SOUTH | 0.43524 0.55598 0.56947----------------------------------------------
Subgroup poverty 'risk' = FGT_k(a)/FGT(a) = S_k/v_k
----------------------------------------------Regions |North |Central |South | a=0 a=1 a=2----------+----------------------------------- NORTH | 1.12724 0.80956 0.67773 CENTRAL | 0.78505 0.72705 0.85854 SOUTH | 1.01800 1.30041 1.33197----------------------------------------------

9
POVERTY INDICES (FGT), WEIGHT: # HOUSEHOLDS
Poverty line 3321
. povdeco CPIND [fw= S1Q04] , by ( BIGREG) pl(3321)
Total number of observations = 120Weighted total no. of observations = 204088Number of observations poor = 84Weighted no. of obs poor = 126077Mean of CPIND amongst the poor = 2384.168Mean of poverty gaps (poverty line - CPIND) amongst the poor = 936.832
Foster-Greer-Thorbecke poverty indices, FGT(a)
---------------------------------------------- All obs | a=0 a=1 a=2----------+----------------------------------- | 0.61776 0.17427 0.08044----------------------------------------------FGT(0): headcount ratio (proportion poor)FGT(1): average normalised poverty gapFGT(2): average squared normalised poverty gap
Decompositions by subgroup--------------------------
Summary statistics for subgroup k = 1,...,K
----------------------------------------------------------------------Regions |North |Central |South | Pop. share Mean Mean|poor Mean gap|poor----------+----------------------------------------------------------- NORTH | 0.38214 3133.01929 2366.46851 954.53156 CENTRAL | 0.23515 3106.21313 2571.24146 749.75854 SOUTH | 0.38271 2700.18066 2290.23730 1030.76282----------------------------------------------------------------------
Subgroup FGT index estimates, FGT(a)
----------------------------------------------Regions |North |Central |South | a=0 a=1 a=2----------+----------------------------------- NORTH | 0.51341 0.14756 0.06322 CENTRAL | 0.65181 0.14715 0.06487 SOUTH | 0.70103 0.21759 0.10720----------------------------------------------
Subgroup poverty 'share', S_k = v_k.FGT_k(a)/FGT(a)
----------------------------------------------Regions |
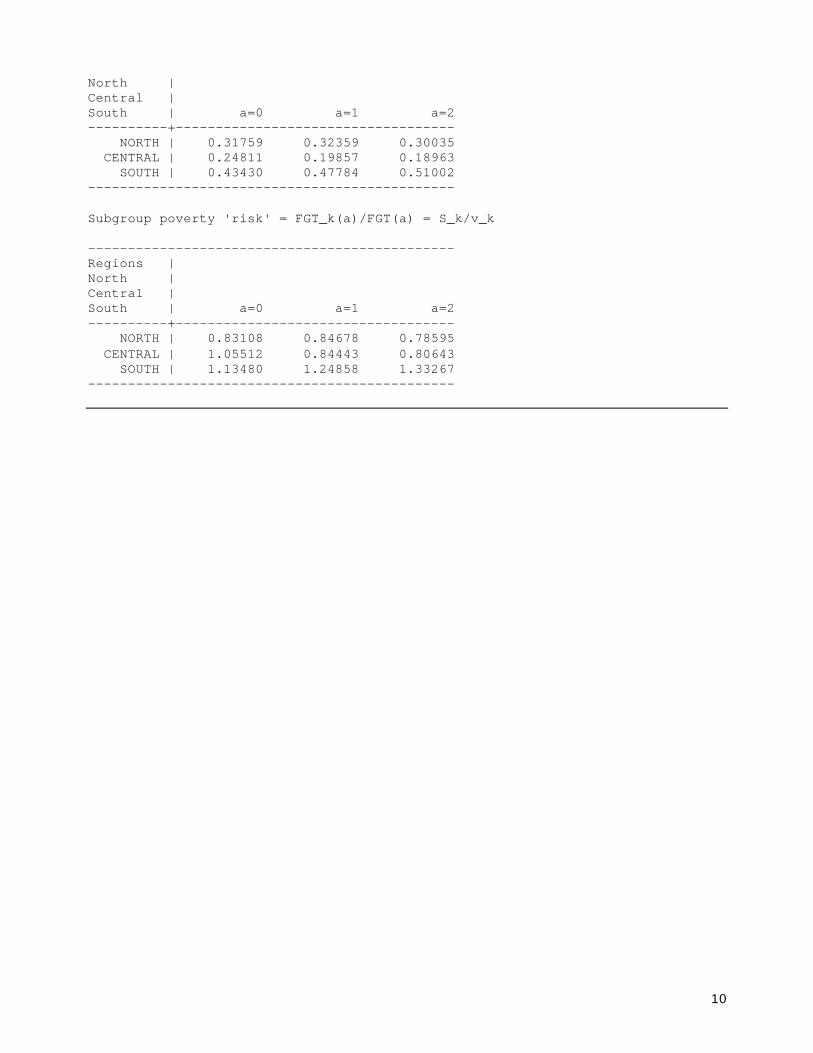
10
North |Central |South | a=0 a=1 a=2----------+----------------------------------- NORTH | 0.31759 0.32359 0.30035 CENTRAL | 0.24811 0.19857 0.18963 SOUTH | 0.43430 0.47784 0.51002----------------------------------------------
Subgroup poverty 'risk' = FGT_k(a)/FGT(a) = S_k/v_k
----------------------------------------------Regions |North |Central |South | a=0 a=1 a=2----------+----------------------------------- NORTH | 0.83108 0.84678 0.78595 CENTRAL | 1.05512 0.84443 0.80643 SOUTH | 1.13480 1.24858 1.33267----------------------------------------------

11
POVERTY INDICES (FGT), WEIGHT: # HOUSEHOLDS
Poverty line 2282
. povdeco CPIND [fw= S1Q04] , by ( BIGREG) pl(2282)
Total number of observations = 120Weighted total no. of observations = 204088Number of observations poor = 41Weighted no. of obs poor = 51575Mean of CPIND amongst the poor = 1617.263Mean of poverty gaps (poverty line - CPIND) amongst the poor = 664.737
Foster-Greer-Thorbecke poverty indices, FGT(a)
---------------------------------------------- All obs | a=0 a=1 a=2----------+----------------------------------- | 0.25271 0.07361 0.03175----------------------------------------------FGT(0): headcount ratio (proportion poor)FGT(1): average normalised poverty gapFGT(2): average squared normalised poverty gap
Decompositions by subgroup--------------------------
Summary statistics for subgroup k = 1,...,K
----------------------------------------------------------------------Regions |North |Central |South | Pop. share Mean Mean|poor Mean gap|poor----------+----------------------------------------------------------- NORTH | 0.38214 3133.01929 1806.16345 475.83661 CENTRAL | 0.23515 3106.21313 1658.12451 623.87555 SOUTH | 0.38271 2700.18066 1421.48279 860.51727----------------------------------------------------------------------
Subgroup FGT index estimates, FGT(a)
----------------------------------------------Regions |North |Central |South | a=0 a=1 a=2----------+----------------------------------- NORTH | 0.26076 0.05437 0.01945 CENTRAL | 0.20025 0.05475 0.02814 SOUTH | 0.27691 0.10442 0.04624----------------------------------------------
Subgroup poverty 'share', S_k = v_k.FGT_k(a)/FGT(a)
----------------------------------------------Regions |

12
North |Central |South | a=0 a=1 a=2----------+----------------------------------- NORTH | 0.39432 0.28226 0.23411 CENTRAL | 0.18633 0.17488 0.20845 SOUTH | 0.41935 0.54286 0.55744----------------------------------------------
Subgroup poverty 'risk' = FGT_k(a)/FGT(a) = S_k/v_k
----------------------------------------------Regions |North |Central |South | a=0 a=1 a=2----------+----------------------------------- NORTH | 1.03186 0.73863 0.61262 CENTRAL | 0.79240 0.74369 0.88648 SOUTH | 1.09575 1.41847 1.45656----------------------------------------------
. log close log: D:\Bureau de Québec\Projets\MIMAP-Vietnam-3\IneqPov1.smcl log type: smcl closed on: 26 Apr 2002, 16:18:00-------------------------------------------------------------------------------