Title of the Paper - uni-stuttgart.de
234
MIPALCON Conference Proceedings - Volume 1 MIPALCON 2010 Infrastructure Planning and Development in Developing Countries – „The Way Forward‟ First International Alumni Conference Stuttgart (Germany), 28 th September – 1 st October 2010 University of Stuttgart Master‟s Program Infrastructure Planning Pfaffenwaldring 7 70569 Stuttgart Supported by: ISBN: 978-3-9810573-9-3
Transcript of Title of the Paper - uni-stuttgart.de

MIPALCON Conference Proceedings - Volume 1 MIPALCON 2010
Infrastructure Planning and Development in Developing Countries – „The Way Forward‟
First International Alumni Conference
Stuttgart (Germany), 28th September – 1st October 2010
University of Stuttgart Master‟s Program Infrastructure Planning Pfaffenwaldring 7 70569 Stuttgart Supported by:
ISBN: 978-3-9810573-9-3

Table of Contents
Foreword
Welcome of the City of Stuttgart 3
The Evolution of Transportation Planning in Bogotá 5
Sustainable Infrastructure Planning in Post-Oil Cities - Lessons from Masdar (Abu-Dhabi) and Port Harcourt (Nigeria) for Tema (Ghana)
46
Mysore: Challenges of Infrastructure Provision 61
Ways of Infrastructure Redevelopment in Cyclone Nargis Hit Area, Myanmar 72
Numerical Modelling as A Key Tool in the Decision-Making Process for Water Resources Management
83
Private Sector Participation in Urban Water Supply in Developing Countries: The Ghana Experience
95
Influence of Environmental Degradation on Future Water Supply Cost 102
Territorial Management from A Cultural Perspective: A Review of Flood Risk Management Policies in the Bangkok Metropolitan Region
114
Breathing Walls Concept for Low Cost Comfortable Housing in Developing Countries
130
Energy Efficient Homes in Pakistan: Challenges and Potential for Energy Ef-ficient Sustainable Developments
140
Rural Energy Development Programme – a Bottom up Approach in Rural En-ergy Development in Nepal
161
Inland Waterway Transportation Development in an Environmental-friendly Way
177
Social Infrastructure Networks: The Role of the Social Infrastructure Alloca-tion on the Territorial Attractiveness
187
Remote Sensing and GIS for Urban Infrastructure Planning and Management 198
Enhancing the Local Knowledge for Improving the Infrastructure Facilities in Informal Settlements
210
Community Participation in Slum Upgrading Projects The Case of PAC – Complexo de Favelas do Alemão in Rio de Janeiro – Brazil
222

Foreword
More than 25 years after its foundation in 1983, the Master´s Program Infrastructure
Planning (MIP) has qualified more than 300 alumni who are now helping in various
ways in more than 68 developing and emerging countries all over the world. There
have been successes, setbacks and challenges but through it all a formidable force
of intellectuals and professionals had been brought up from this interdisciplinary pro-
gram. One big success factor is without doubt the multicultural background of the
alumni and the present students.
In the past there have been alumni meetings as singular events on the occasion of
the 10th and 20th anniversary of the study program, but the idea behind the
“MIPALCON” (MIP ALumni CONference) is to establish a regular sequence of
biannual alumni conferences in order to foster the continuous exchange of
knowledge and experience between the members of the MIP network. These confer-
ences shall be linked to “Networks for Mobility” - the conference of FOVUS, the
Center for Transportation Research at the University of Stuttgart.
MIPALCON 2010 as the starting point of this series brought together experiences,
challenges and best practices from various professionals who have already gone
through the MIP studies since 1983. Supported by the DAAD and selected by review
of the Scientific Advisory Committee, 15 alumni presented their current work, dis-
cussing their ideas with current MIP students, lecturers and experts from the field of
infrastructure planning. This publication contains all contributions presented at the
conference.
On behalf of the Master‟s Program Infrastructure Planning and the University of
Stuttgart I hope you will find the MIPALCON 2010 proceedings both informative and
inspiring.
Prof. Dr.-Ing. Markus Friedrich
Master‟s Program Infrastructure Planning
University of Stuttgart

2

3
Welcome of the City of Stuttgart
Wolfgang Forderer Municipality of Stuttgart, Policy office of the Mayor, Policy Planning Department Marktplatz 1 70173 Stuttgart Germany [email protected]
The City of Stuttgart has almost 600.000 inhabitants. It is the urban centre of the Met-
ropolitan Region of Stuttgart with over 3 million inhabitants and also capital of the
State of Baden-Württemberg with 10 million inhabitants.
Stuttgart is an international city and will continue to diversify more in the 21st century.
As of today, people from over 170 nations, speaking over one hundred languages
have come to live in Stuttgart during the past decades. The resulting cultural, reli-
gious, ethnic, and national diversity makes Stuttgart a "microcosm of the United Na-
tions" in the array of internationality and integration.
Stuttgart's valley location with the steeply rising slopes is unique. Surrounded by
three wooded elevations, the city is open in the east to the Neckar and thus has a
pleasant climate. Vineyards which reach into the inner city, parks, forests and or-
chards cover more than half of the 11,000 hectare large city and justify Stuttgart's
reputation as one of the most beautifully located large cities of Europe.
Charmingly situated in the heart of one of Germany's largest wine-growing regions,
this vibrant metropolis fascinates visitors from all over the world. The state capital of
Baden-Württemberg delights tourists not only by virtue of its magnificent panorama,
its impressive gardens and parks, its fine squares, splendid palaces and buildings in
a wide range of architectural styles, but also by its cultural diversity. Stuttgart's tradi-
tional festivals also enjoy world-wide popularity: the great Stuttgart Spring Festival,
the elegant Summer Festival whose white pavilions, countless fairy lights and lan-
terns make it one of Germany's most delightful city festivals, and the Stuttgart Wine
Village with some 120 lovingly decorated wine arbours. At the end of September
things really heat up during the Stuttgart Beer Festival. Stuttgart is a city that offers
excellent quality of life - a harmonious blend of high tech, high culture and high qual-
ity. Offering a wide range of cultural and leisure activities, Stuttgart has something to
suit everyone. Prominent in the Stuttgart cultural life is the State Theatre Stuttgart
with renowned plays, the world famous Stuttgart Ballet and the State Opera. In the
Wilhelma, Europe's largest zoological - botanical gardens, you can gaze at more than
10,000 animals and exotic plants.

4
The Stuttgart region is Europe's leading high-tech region and Germany's strongest
commercial metropolitan area. Independent reports continually confirm Stuttgart as
one of Germany's leading business locations.
Known around the world are large Stuttgart companies like Daimler, Bosch and Por-
sche, which stand for Swabian innovation and successful entrepreneurship and
which characterize the city as an attractive economic location.
Stuttgart has also made a name for itself as a media location. More than 150 book
and periodical publishing companies are located in the state capital. Stuttgart is now
increasing its importance as an international trade fair and congress city with the
opening of the new state trade fair grounds with around 100,000 m² hall surface and
a highly modern congress centre.
The City of Stuttgart is very active in the field of development cooperation. Stuttgart
believes that, in the age of globalization, it has the responsibility of participating in
ensuring that cities around the globe are in the position to offer their inhabitants a
future where life is worth living.
This is why in July 2005, over 150 organisations, associations and initiatives which
have their home in Stuttgart joined forces to create the "Stuttgart Partnership One
World". This new network is an alliance of partners which maintain intensive contacts
with many countries around the world. All associations, organisations, groups, and
initiatives are called upon to work towards the observation of the principles and val-
ues of the Charter of the United Nations today and in the future to make sure that the
greatest possible number of people may benefit from this Charter in their daily lives.
On the international level, Stuttgart is engaged in several projects and networks in
the field of mobility, urban planning, environment, integration, development coopera-
tion, town twinning, youth and children, culture and sports. Mayor Dr. Wolfgang
Schuster is currently the president of European Council of Municipalities and Regions
and Vice-president of United Cities and Local Governments, the world's most impor-
tant association of local authorities.
Known as the "cradle of the automobile", today Stuttgart counts on a globally unique
mobility cluster made up of many large and medium-sized companies which are con-
nected all over the world. They work closely together with local education, science
and research institutes. An example for the linking between local and international
research in the field of urban mobility is the biennial symposium "Networks for Mobil-
ity" organized by the University of Stuttgart. Regarding urban mobility, the City of
Stuttgart has initiated and coordinates the global network “Cities for Mobility” which
brings together over 600 partners in 82 countries aiming at to develop new concepts
for sustainable urban mobility in urban regions (for more information please visit
www.cities-for-mobility.org). There are also some fantastic places to know more
about the tradition and the future of the automobile: The Mercedes-Benz Museum,
the Porsche Museum and the Centre for Electro-Mobility with the worldwide first
showroom on all types of e-mobility.

5
Source: Wikipedia
The Evolution of Transportation Planning in Bogotá
Eng. Msc. Néstor Sáenz Saavedra Professor Universidad Nacional de Colombia Traffic and Transport Research Program Email: [email protected] Abstract: This paper provides a chronological overview on the evolution of the plan-ning of public transport in the City of Bogotá, the capital of Colombia in South Ameri-ca. It begins, with presenting the city with the first model of private operation that run between 1884 and 1910 to operate the tram system and its development under the public administration until 1951. In that area also trolley buses where in use. This well functioning system was followed by a private-public model, operating on bus routes and using buses with gasoline engines. These companies got their licenses from the state. The state got his income, still like today, from vehicle registration fees and from monthly payments for the route licences. This provided the municipality an income without any risk, which is assumed in part by the owner of the vehicle and directly by the driver who is paid per passenger transported This modal became very common and it served up to 90 % of public transport in Colombia. Today it makes up to 48 % (country-wide). In Bogotá, this model had the jurisdiction of the municipal corporation with the operation of electric buses and diesel between 1910 and 1991 when it dis-appeared. The document continues by highlighting the entry into the operation of a mass transit system by buses. TransMilenio came into operation in 2000 and has been consoli-dated as a transport model of high operating efficiency according. It can compete with mass transit systems as the subway. The operation of bus rapid transit (BRT) led the city administration to seek for improvements in the traditional public transport service and to integrate it with the BRT system.This leads to the Integrated Public Transport System (SITP). This system will be operated by just 13 companies, which will be responsible for the service, to buy the buses and to hire the drivers. SITP will have fixed stops and stations and will be fully integrated with TransMilenio by special interchange stations. The end of the document gives an overview on various studies conducted over the past 30 years, in order to implement a Metro in Bogotá. But ít also explains why none of the several proposals submitted by consultants and the state finally was imple-mented. With the most recent study (2010) the administration wants to implement a Metro in Bogotá, following election promises. Finally, the program for the integration of the mobility system of the City of Bogotá with the Department of Cundinamarca is described.

6
1 The City of Bogotá
Bogotá, the capital of Colombia in South America, is located on the eastern moun-
tains in the east branch of the Andes, at an altitude of 2,600 m above sea level, and
covers an area of 177 thousand hectares from which 31 correspond to the urban
area.
Source: Google Earth
Photo 1: Localization of Bogotá City
Bogotá is a linear city whose morphological development was stimulated by the
former tramway track, which became one of the most important structural elements,
not only for its effect on growth and urban design but also by changes induced in
relations between developing sectors of the city, consolidating the form of growth.
Source: Google Maps
Map 1: Map of Bogotá City
Cordillera Oriental

7
Bogotá has a population of 7.4 million inhabitants (2010) representing 16.1 % from
the total national. It has 15,000 km-lane of roads, with 895,000 cars and is served
daily by 16,000 vehicles for public passenger transport, which mobilized 1,220 million
passengers each year. In Table 1, we can see the most important basic data of the
city.
Sources: Alcaldía de Bogotá, DANE, Cámara de Comercio de Bogotá, Secretaría de Movilidad.
Table 1: Basic Data of Bogotá
Source: Alcaldía de Bogotá (http://www.bogota.gov.co/portel/libreria/php/01.010101.html)
Photo 2: Bogotá city view from the hills
Concept Reference Year Unit Total
Extension - Hectares 177.598
Population 2010 Inhabitants 7.363.782
Male 2010 Men 3.548.713
Female 2010 Women 3.815.069
Households 2005 Units 1.931.372
Dwellings 2005 Units 1.767.808
Streets 2008 Km-lane 14.781
Cars 2008 Units 895.293
Transit
Transit Buses 2009 Units 15.963
Passengers moved per year 2009 Millions 1.221
Routes 2009 Routes 498
Transport companies 2009 Companies 65
Mass transit
Trunk Vehicles 2008 Units 1.072
Passengers moved per year 2009 Passengers (millons) 435.6
Road Accidents
Traffic Accidents 2008 Cases 36.159
Deaths 2008 Victims 537
Injuries 2008 Victims 3.080

8
Source: Alcaldía de Bogotá (http://www.bogota.gov.co/portel/libreria/php/01.010101.html)
Photo 3: Night view of the Bogotá city
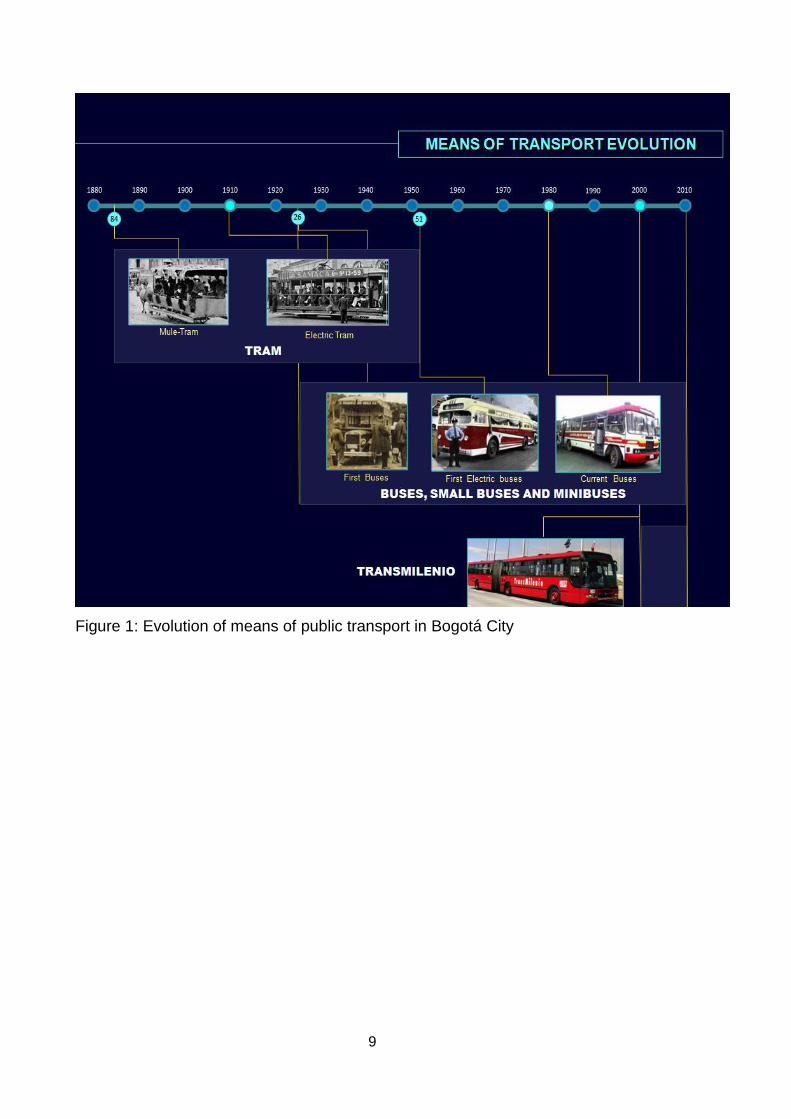
2 Means of Public Transport
The public transportation of passengers in Bogotá has evolved until today in three
systems:
1. The tram
2. Buses, small buses and minibuses, and
3. The Mass Transit System by Buses - TransMilenio.
This year (2010) is implementing the Integrated Public Transport System and studies
are being developed to organize the Comprehensive Program of Mobility of the
Capital Region - CPMCR, in order to integrate all systems, including the subway and
the future commuter rail (see Figure 1).
9
Figure 1: Evolution of means of public transport in Bogotá City

10
3 The Tram 3.1 The Beginning
Streetcars became the first system for public transportation in Bogotá. It had its origin
in 1884 through an exclusive agreement concluded between the municipal govern-
ment and a private entrepreneur who sold U.S. rights to other investors. He founded
the Bogotá City Railway Company Co. to serve a population of 90,000 inhabitants.
The scheme came into operation on the 24th of December of that year with 16 two-
axle trams pulled by mules that moved over wooden rails coated metal, with a capac-
ity of 20 passengers seated and some standing as shown in Photo 4. The route con-
nected what is now the downtown and a village in a distance of 6 kilometers which is
now the traditional neighbourhood Chapinero (see Map 2).
Source: Allen Morrison. http://www.tramz.com/co/bg/t/ts.html
Photo 4: Mule-drawn streetcars
In 1910 the electric trams came into operation (see Photo 5). In that same year, after
a citizen boycott due to dissatisfaction with the service delivered, the system returned
to public service and the operator became the Municipal Railway Company Bogotá
that operated until 1951. During this time and especially since 1923 the tramway
worked in open competition with bus companies, whose owners are accused of
forcing the demise of the tram, by burning many of the cars (see Photo 6). This took
place during the events of April 9th, 1948, when the people, enraged by the murder of
one of their leaders, led a revolt that destroyed a big part of downtown. Three years
later the tram disappeared giving way to private service buses, operating on a model
in force until today.

11
Source: Allen Morrison. http://www.tramz.com/co/bg/t/ts.html
Photo 5: Electric trains when it started in operation in 1910
Source: Allen Morrison. http://www.tramz.com/co/bg/t/ts.html
Photo 6: Tram burning in 1948
3.2 First Private Model of Operation
The obligation of the private contractor between 1884 and 1910 included the
construction of infrastructure, purchase of cars and the operation of the routes, which
became the first private model for the operation of passenger service. This service
was supported by the city with a credit of $ 12,000. The system was used by
approximately 66,000 passengers, and the fare was $ 0.02. During the operation of
the municipal company, in 1916 the Eastern Railway Company received a franchise
to operate a service from Carrera 13 to Yomasa Neighborhood (see Map 2), which
became a second private operation of the tram.
3.3 Expansion of the System
Under the municipal administration (1910 - 1951), the company improved services
and expanded lines progressively through the city as shown on Map 2. Between
1910 and 1915 the system got extended to the South on Carrera 7 to Las Cruces

12
and to the West by the Calles 10 and 15 to the Paiba Station and from 26th Street to
the Central Cemetery. Between 1910 and 1920 the service was extended to station
Paiba Ricaurte and also from Las Cruces to San Cristobal. There was also a new line
down the Avenida Carrera 10 to 1. In 1921 the system covered also the Calle 72
westbound and Carrera 13 to Calle 67. Later electric tram services were developed
to the northwest along the Avenue 68 to San Fernando, on 26th Street to University
City and to the Southeast neighbourhoods July 20, the Olaya Herrera and Santander
neighbourhoods.
Source: Allen Morrison “The Tramways of Bogotá Colombia” http://www.tramz.com/co/bg/t/tm.html
Map 2: Tracing the tram lines of Bogotá

13
4 Public Transport Passenger by Buses 4.1 The Beginning
Photo 7: The First Buses – 1923
In 1926 a first private bus company was founded, which disappeared a few years
later due to the regulations to be imposed and the "war" unleashed by the tram.
These busses often moved without any organization and with great flexibility. During
the late twenties first routes were created, but there was no obligation to comply with
them.
In 1934 the appearance of new private companies started to transport passengers in
the form of cooperatives, whose goal was to be in possession of the routes and to
operate them granted by municipal authorities. These cooperatives were formed by
bus operators (owners of buses) who bought shares of the cooperative in relation to
the number of buses they owned. Furthermore, these owners were required to pay a
monthly fee for operating on the roads and were responsible for the administration
and maintenance of the vehicles and for hiring drivers, who were paid by the number
of passengers they carried. This model of operation of the service is currently in force
with some modifications.
4.2 The Municipal Electric Bus Service "Trolleybuses"
With the unfortunate demise of the tramway in 1951, the municipal utility service en-
ters the city with an electric bus system that went to compete with private buses and
quickly filled the gap left by the tram. Between 1952 and 1958 the municipality sought
to respond to the transportation of the city with the District Transport Company, which
by 1954 had 15 trolley busses and 83 gasoline driven busses.

14
Source: Ospina Andrés, Vladimir Mosquera. “Historia de transporte público en Bogotá” (http://www.museovintage.com/transporte/1970.htm)
Photo 8: First Electrical Buses - 1951 Photo 9: Trolley bus services in 1970
4.3 City Bus Company
In 1959 the transformations of the tram company were finished by the creation of the
Urban District Transport Company with a system composed of trolley busses and
diesel buses, but with low coverage compared to private transport. In 1962 it covered
10 routes with 85 diesel buses and 25 trolley buses. In total, 46,000 passengers per
day in a city with 1.6 million inhabitants were transported. In 1970 it moved 36 million
passengers. In 1985 the number of passengers fell to 13 million and in 1990 to
5 million. After several attempts of modernization, financial problems and significant
differences between union workers and managers the company disappeared in 1991.
The municipal transport company was gradually losing its dominant position in com-
parison to private transport. For example, the share of passengers transported by the
tram fell from 75 % in 1951 to 30 % in 1953. Accordingly the share of private compa-
nies grew between 1957 and 1967 from 62 % to 92 %, and in 1973 they covered
95 % of journeys. The public model was unsuccessful due to high operating costs,
due to a disproportionate workload and in comparison with the performance delivered
to the client and due to bureaucratic management.
4.4 Public Transport Service nowadays
After with the Urban District Transport Company the last public company for public
transport dissappeared we had the following situation:
The state planned, regulated and controlled the service.
The government provided the infrastructure necessary for operation.
Private operators provided the service under market conditions.
The result of this is shown in Photo 10.

15
Photo 10: Public transport operation in Bogotá
In 2009 in Bogotá 66 companies are operating in public transport, with
15,963 vehicles (buses, small buses, minibuses, see Photos 11 - 13). They operate
498 routes throughout the city and mobilize 1,221 million passengers annually, with a
prevalence between 65 % and 85 % of motorized trips.
Photo 11: Vehicle type: Photo 12: Vehicle type: Photo 13: Vehicle type:
bus small bus mini bus
4.5 The Public Transport Problem
During years this service has suffered structural problems creating negative impacts
on users, and also negative externalities, as described in Figure 2.
The structural causes are represented by weak institutional capacity and inadequate
regulation. This is the problem's cause for the service supply, represented in over
biding routes, improper operation and outdated equipment. A second problem is
formed by the infrastructure which is overutilized, unsustainable and inequitable.
These problems lead both to negative impacts on the users with respect to travel
times, safety, comfort, reliability and the tariff and to negative externalities associated
with safety, environment, energy consumption, congestion and urban development.

16
Problems of supply of Services:1. Oversupply2. Routes and improper
operation3. Obsolete Equipment
Problems of supply infrastructure1. Underutilized2. Impaired quality3. Untenable4. Inequitable
Negative externalities related to:1. Accident2. Environment3. Energy consumption4. Congestion5. Urban development
Negative impacts on the user:1. Travel Time2. Security3. Comfort4. Reliability5. Fare
Structural Causes1. Deficient institutional
capacity 2. Inadequate regulation
Source: National Department of Planning, CONPES 3761. 2002
Figure 2: Main problems about urban transit transport in Bogotá
Source: Oscar Aristizabal “Disfuncionalidades perennes de movilidad y transporte en Bogotá. 2009
Photo 14: View of public transport operation in 1970

17
Source: Oscar Aristizabal “Disfuncionalidades perennes de movilidad y transporte en Bogotá”. 2009
Photo 15: View of public transport operation in 1990
4.6 Business Model of Public Transport
The business model was inherited from the appearance of the first companies in the
early 30s (see Figure 3). It almost has not changed and has remained essentially for
nearly eight decades.
Source: National Department of Planning, CONPES 31260, 2003
Figure 3: Business model urban public transport
The municipality, represented by Bogotá´s Secretary of Transport, grants the operat-
ing license and permits for the operation of routes to private transport companies.
These transport companies sell their permits for a fixed monthly income to the vehi-
cle owners. To operate the vehicles the vehicle owners hire vehicle drivers who are
paid per passenger mobilized. So finally the passengers have to pay several partici-
pants in the system on different levels. Since the drivers revenues finally are decisive
for the whole system the drivers try to catch as many passengers as possible. This

18
search of passengers leads to a “war for the passenger” on the road between the bus
drivers, sometimes also named “penny war”, affecting service quality and increasing
the risk.
4.7 Indicators of Urban Public Transport in Bogotá
The main indicators of the public transport system by buses, small buses and mini-
buses, which allow us to examine the operating conditions are listed in Table 2. It
highlights the fact that in total 16,168 vehicles are in daily service. These buses have
an average age of 10 years, the small buses even of 17 years. All the buses are op-
erating in total 505 routes, which have an average length of 54 km, with a average
travel speed of 23 km/h and with 1.6 persons per km transported.
Source: Cámara de Comercio de Bogotá. “Observatorio de movilidad - 2008”. Bogotá.2009.
Table 2: Public transport Indicators - 2008
In the decade of 70´s, when the metropolitan company of transport broke, a process
of privatization of the public transport in the city began in which the transit authority
adjudged routes to be served by deprived companies of transport. The majority of
them without enterprise structure, nor property of the fleet, work like companies that
affiliate buses for the operation or service in the route that was adjudged to them.
Additionally, these companies do either not have responsibility for the service they
offer nor do they have criteria of quality of the service. They solely fulfill frequencies.
This scheme of operation generated a number of problems in the public transport of
the city. This absence in the planning generated deficiencies in the quality and the
security. This created huge economic, environmental and social problems which
generated a backward movement in the organization of mobility of the city and lead
to 30 years of delay.

19
5 Mass Transit System by Buses - TransMilenio 5.1 Introduction
In order to address the poor public transport service, reflected in high passenger
travel times, accidents, high levels of insecurity, high costs and inefficient operation,
the system of rapid transit buses (Bus Rapid Transit - BRT) with the name of Mass
Transit System of the Third Millennium - TransMilenio - was launched in late 2000.
As part of the Integrated Mass Transit this system not only includes BRT in the city
but also comprises the bicycle path network, a future first subway line and the com-
muter rail.
This system of mass transport of passengers is a organized combination of infra-
structure and equipment in a scheme that serves a high volume of passengers and
responds to a significant percentage of the needs of urban mobilization.
Source: TRANSMILENIO S.A.
Photo 16: Station of the TransMilenio System
The system is based on rapid transit using articulated buses and high capacity
busways with fixed stops, which users access via bus stations. It includes a feeder
bus service that takes passengers from some remote areas of the system to inter-
mediate stations.
Under this definition, the main goals of a BRT are:
Eliminate the "penny war". This marks a radical change in the remuneration sys-
tem through the transformation from bus rental company to bus owner companies.

20
Integrate physically and operationally most of the routes of the city, taking into ac-
count the technical and financial criteria. The Integration may include different
modes of operating the buses. It also includes the integration of the tariffs.
Reorder and coordinate the routes of existing public transport services and the
new BRT routes.
Build and / or adapt the infrastructure required in the main corridors of the BRT.
Use new high-capacity vehicles with low-pollution technology which are able to
fulfil the demand.
Increase the average speed on trunk corridors to levels approaching 25 km/h, re-
ducing travel times for users.
Coordinate the implementation of BRT with the existing public transport which is
still operating and maintain the conditions for mobility and accessibility appro-
priate.
Remove old buses that pollute too much (“chatarrización”).
Apply marketing schemes and the collection of tickets flexible and economical.
Promote a comprehensive urban development, improving public space.
Strengthen and improve coordination between local authorities (Mass Transit Au-
thorities, Ministries of Transport and Traffic and Metropolitan Areas, etc.) to ensure
a better and more efficient management.
Monitor service delivery through management companies, to ensure the sustain-
ability of the system, the quality of customer service and minimum efficiency stan-
dards.
5.2 Planning Process of the IMTS (Integrated Mass Transit System)
The planning process for the design of the IMTS includes studies covering all the
relevant aspects of a project of this nature. These studies are based upon a feasibil-
ity analysis to clarify the project‟s concept. This defines the possibility of implementa-
tion where the size of the city and the urban collective transport market are key fac-
tors. The next step is the conceptual design of the IMTS, based on the city‟s detailed
mobility information surveys from which the technological and operational needs are
taken to define the system itself (see Figure 4). IMTS is supported with national re-
sources.

21
Source: Departamento Nacional de Planeación, CONPES 3260. Bogotá.2003
Figure 4: Planning process of the IMTS (Integrated Mass Transit System)
5.3 TransMilenio System Elements 5.3.1 Overview
The system consists of the rapid and organized transit of high capacity articulated
buses, throughout exclusive busways with fixed stops. Users get access to these
stops in an organized way. Some of the stations are fed with feeder buses that bring
the users from remote areas far from the network.
5.3.2 Infrastructure
The system infrastructure consists of the combination of the network‟s trunk corridors
and the different types of stations.
Photo 17: North Corridor Photo 18: Elevated Station

22
5.3.3 Network of Trunk Corridors
Nowadays, the system has 9 main trunk lines as shown on Map 3. These were
gradually incorporated in the first two phases of the service. These first two phases
are those of the three initial phases planned for the initial development of the system.
In the year 2000, when TransMilenio started its operation, The “Avenida Caracas”
and “Calle 80” corridors came into operation. In year 2001 it was the “Autopista
Norte” corridor and in year 2002 the corridor “Avenida Jiménez”. In year 2003 the
“Avenida de las Americas” corridor was incorporated and in the year 2005 it was the
time for the central sector of the NQS (Norte - Quito - Sur) corridor. In the year 2006
it was the “Suba” and the South bit of the NQS corridor. All these corridors are part of
the system‟s phases I and II.
Source: TRANSMILENIO S.A.
Map 3: Current Trunks Network
5.3.4 Stations
The TransMilenio system uses five types of stations:
Simple stations. Correspond to stopping points on the trunk lines where users
access the system and where they can buy their tickets, they are separated ap-
proximately 500 and 700 meters from each other.
23
Source: TRANSMILENIO S.A.
Photo 19: Simple station
Transfer Stations. These allow the exchange between two different trunk lines
through an underground passage, examples of these are found in the Avenida
Jimenez, which connects the Avenida Caracas and the Avenida de Las Americas
lines, and the Ricaurte station, connecting the Avenida de las Americas to the
NQS corridor.
No-exchange stations. These stations banned the exchange between the north-
southbound and south-northbound. Such type of stations are located on the
Autopista Norte and Tunal corridor. Their placement on these sectors is due to
space conditions on the road.
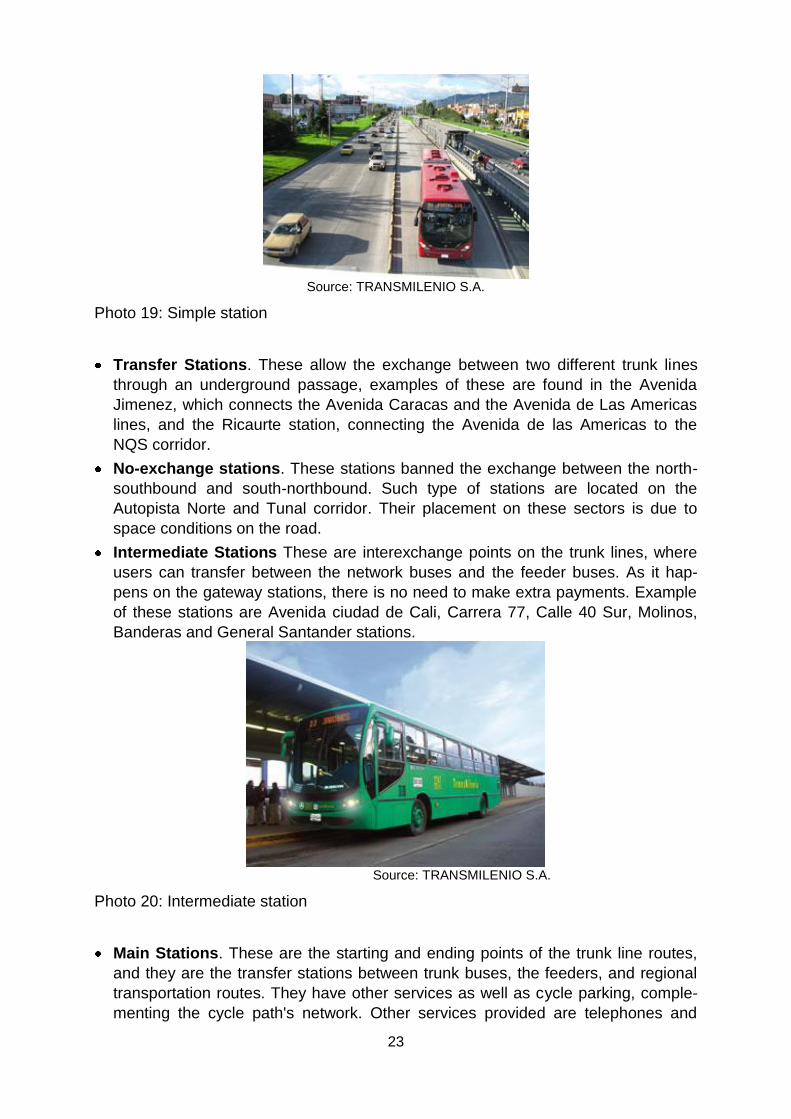
Intermediate Stations These are interexchange points on the trunk lines, where
users can transfer between the network buses and the feeder buses. As it hap-
pens on the gateway stations, there is no need to make extra payments. Example
of these stations are Avenida ciudad de Cali, Carrera 77, Calle 40 Sur, Molinos,
Banderas and General Santander stations.
Source: TRANSMILENIO S.A.
Photo 20: Intermediate station
Main Stations. These are the starting and ending points of the trunk line routes,
and they are the transfer stations between trunk buses, the feeders, and regional
transportation routes. They have other services as well as cycle parking, comple-
menting the cycle path's network. Other services provided are telephones and

24
restrooms areas. Examples of these are found on these hubs: North, Suba, Calle
80, Las Americas, South and Usme Tunal.
Source: TRANSMILENIO S.A
Photo 21: Main Station
5.3.5 Vehicles 5.3.5.1 Overview
The system is operated by two types of vehicles: high-capacity buses (articulated
buses) along the trunk lines passengers and feeder buses.
5.3.5.2 Articulated Buses
The service is provided by two types of articulated buses, mono- and bi-articulated,
according to the number of articulations they have. The majority of the service is pro-
vided by mono-articulated buses. These are 18 meters long and 2.60 meter wide and
have four 1.10 meter wide doors, placed at the left side of the bus. They have a ca-
pacity of 160 passengers, 48 of them are seated. These vehicles operate on diesel
fuel. To show that they are operating along the trunk roads they are painted in red
colour (see Photo 22).
Currently, there are circulating 5 bi-articulated buses with two articulations. These
buses are 27.2 meters long and 2.60 meters wide They have seven doors of 1.10
meters width and a capacity of 260 passengers. These buses will start operations
once Phase III of the system is terminated. They are distinguished by their yellow
and red colour (see Photo 23).
Photo 22: Articulated bus Photo 23: Bi-Articulated bus

25
5.3.5.3 Feeder Vehicles
Feeder buses are used to carry passengers to and from the main and intermediate
stations. They are single buses with three doors on the right side and a capacity of
80 passengers. The green colour indicates that they are operating on feeder lines
(see Photos 24 and 25).
Photo 24: Frontal view Feeder vehicle Photo 25: Side view Feeder vehicle
5.4 TransMilenio System Operation 5.4.1 Overview
The system operation is done through a public-private model, where all -
organization, planning, control and monitoring system as well as the infrastructure
construction - is the City‟s responsibility. The operation is carried out by the private
sector, which is obliged to bus purchasing, bus maintenance and as well as the hiring
and education of drivers.
The system provides four types of services – the express service, the super express
service and the “easyroute” service along the trunk lines and the feeder services.
5.4.2 Trunk Lines
The trunk lines are defined by exclusive corridors starting and ending at the portals or
gateway stations (“main stations”). The buses stop only to pick up passengers at
stations, according to a rigorous pre-planning and real-time control. Along the trunk
lines only TransMilenio mass transit operates. The parallel circulation of the former
public transport along these corridors is prohibited.
5.4.3 Express Services
The express services are designed to serve as fast as possible origin and destination
areas previously identified. For this purpose, the exclusive express service does not
stop at all stations but only in those of higher importance. These services have a
higher commercial speed than that of the services that stop at all the stations.

26
5.4.4 Super Express Services
Super express services stop only at some stations and travel between origin-
destination pairs with greater demand for travel, giving an extra advantage to the us-
ers who make long journeys within the system due to its lower number of stops.
Express and super express services provide a better user experience and allow a
better use of the fleet. Users are not forced to stop at all stations along the route, re-
ducing hence their travel time. It‟s also possible to make more cycles with the same
number of buses.
5.4.5 “Easy Route” Services
“Easy route” services stop at all stations along the route giving users an alternative
and quicker travel experience with shorter waiting times. This is possible due to the
frequency of the schedule.
5.4.6 Feeder Services
The feeder services are routes attracting passengers from some given areas in the
city, connecting them to the TransMilenio system. They join the trunk lines at the
main and the intermediate stations. The buses used for this operation are of medium
capacity, appropriate to the normal road and traffic conditions. The feeder system
gives access from the surrounding neighborhoods to the TransMilenio system with-
out extra payment.
The operation of these services is performed through local and non-exclusive roads.
This facilitates the integration of mainly residential areas of low and middle income
with the trunk lines. The average distance between the stops along the feeder routes
is approximately 400 meters. These stops have signs, and areas suitable for loading
and unloading of passengers and passenger waiting.
Map 4 indicates the location of the stops of the 74 feeder routes of the system. These
routes serve 515 kilometers, and are operated with 476 vehicles, attending
302 neighborhoods.

27
Source: Universidad de los Andes. “Observatorio de TransMilenio - 2008”.
Cámara de Comercio de Bogotá. Bogotá, 2009
Map 4: Stop points of feeder routes
5.4.7 Operating Companies
Seven companies perform TransMilenio‟s operation. These were created just for that
purpose, and they reunite 98 % of the private bus operators in the city. These com-
panies are chosen through a bidding process where legal, technical and financial
requirements are requested upon completion.
The winners of the bidding process are responsible for the vehicle purchasing and
the hiring of drivers, mechanics, administrative staff and extra personnel. The grant-
ing of the operation includes the administration and maintenance of garages and
parking. These are provided by the local authority. The Operators are paid based on
the mileage.
5.5 Fare Collection System
The fare collection system is carried out by two private companies. They were cho-
sen through public bidding. They provide smart cards and the equipment forming the
technological system platform, including tickets machines (smart cards), control
gates, communication equipment and other necessary equipment. The logistics to
assure the system‟s operation during the operating hours is also a responsibility of
the private companies. This includes services like ticketing, security, equipment
maintenance and money‟s bank deposit.
The following elements form the fare collection system:
Ticket selling at the stations: There are points of sale located at the entrances of
the stations, where the user can recharge the enabled cards.

28
External sales outlets: They are located in establishments and shopping centers
and have personalized attention for reloading all enabled cards.
Smart Cards automatic loading terminals (SCLT): These devices allow users to
recharge frequent traveller cards or student cards automatically.
Mobile recharge terminals: They are portable devices served by a box office op-
erator where the user can top-up the enabled cards.
Control gates and cash registers: These are the access control mechanisms, lo-
cated at the entrances of the stations for the card's validation.
5.6 TransMilenio Operational Indicators 5.6.1 Demand 5.6.1.1 Overview
In 2008, The TransMilenio system served 11 % of the daily trips, whilst the traditional
public transport served 42 % of them and 22 % were private transport trips (see Fig-
ure 5).
Source: Universidad de los Andes. “Observatorio de TransMilenio - 2008”.
Cámara de Comercio de Bogotá. Bogotá, 2009.
Figure 5: Modal share - Bogotá, 2008
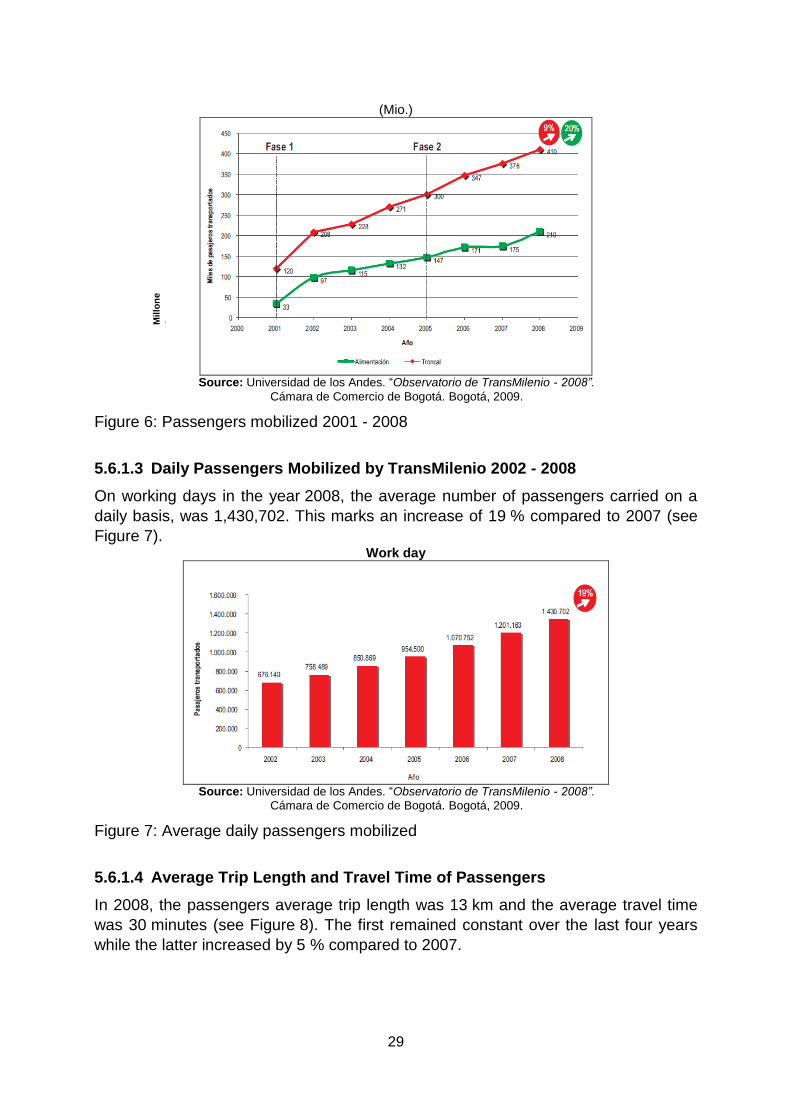
5.6.1.2 Passengers Mobilized by TransMilenio 2001 - 2008
In 2008, the TransMilenio system carried on the trunk lines 410 million passengers,
representing a 9 % increase compared to the previous year (see Figure 6). The
feeder system moved in the same year 210 million passengers, a fairly significant
increase of 20 % in comparison to the year 2007 (see also Figure 6).
29
(Mio.)
Source: Universidad de los Andes. “Observatorio de TransMilenio - 2008”.
Cámara de Comercio de Bogotá. Bogotá, 2009.
Figure 6: Passengers mobilized 2001 - 2008
5.6.1.3 Daily Passengers Mobilized by TransMilenio 2002 - 2008
On working days in the year 2008, the average number of passengers carried on a
daily basis, was 1,430,702. This marks an increase of 19 % compared to 2007 (see
Figure 7). Work day
Source: Universidad de los Andes. “Observatorio de TransMilenio - 2008”.
Cámara de Comercio de Bogotá. Bogotá, 2009.
Figure 7: Average daily passengers mobilized
5.6.1.4 Average Trip Length and Travel Time of Passengers
In 2008, the passengers average trip length was 13 km and the average travel time
was 30 minutes (see Figure 8). The first remained constant over the last four years
while the latter increased by 5 % compared to 2007.
Millo
ne
s

30
Source: Universidad de los Andes. “Observatorio de TransMilenio - 2008”.
Cámara de Comercio de Bogotá. Bogotá, 2009.
Figure 8: Average length and travel time in peak hour 2002 – 2008
5.6.1.5 Number of Passengers Carried per Year and by Trunk Line Bus
In 2008, each trunk line bus carried 31,900 passengers on average. This marks an
increase of 7 % compared to 2007. However, as shown in Figure 9, the total number
of passengers carried per bus had a downward trend between 2003 and 2007, going
from 39,197 to 29,707 passengers.
Source: Universidad de los Andes. “Observatorio de TransMilenio - 2008”.
Cámara de Comercio de Bogotá. Bogotá, 2009.
Figure 9: Total annual passengers transported per trunk bus 2001 - 2008
5.6.2 Supply 5.6.2.1 Capacity (Buses)
The capacity in the TransMilenio system in 2008 was represented by 51.546 seats
and 120.064 standing passengers with a slight increase of 0.1 % compared to the
year 2007. Figure 10 shows the evolution of the offered capacity, from 427 buses in
2002 to 609 in 2004 and 1,071 in 2007.

31
Source: Universidad de los Andes. “Observatorio de TransMilenio - 2008”.
Cámara de Comercio de Bogotá. Bogotá, 2009.
Figure 10: Evolution of system‟s installed capacity 2001 - 2008
5.6.2.2 Number of Buses Running in the System (Daily Average)
On a working day (2009), the daily average of buses running in the morning peak
hours is 1,055 buses, while in the evening peak hours this number is reduced to
1,027 buses (see Figure 11). In other hours, the average is 520 buses running in the
system. Peak hours accumulate 47 % of total daily bus trips.
Figure 11: Average number of buses running in the system - work day 2009
5.6.2.3 Yearly Mileage of the Vehicle Fleet
In 2008, the vehicle fleet travelled 81.4 million km along the trunk lines with a 9 %
increase compared to 2007. Figure 12 shows a year-to-year increase in the number
of miles driven.

32
Source: Universidad de los Andes. “Observatorio de TransMilenio - 2008”.
Cámara de Comercio de Bogotá. Bogotá, 2009.
Figure 12: Total annual travelled kilometres along the trunk lines 2001 - 2008
The daily average mileage for year 2008 peaked to 226,000 km from 208,000 km in
the year 2007, representing an increase of 8 %.
5.6.2.4 Fleet Linked to the Trunk Lines and to the Feeder System
In the past eight years, the trunk lines bus fleet grew by 2.5 times, from 427 buses in
2001 to 1,072 in 2008 (see Figure 13).
Source: Universidad de los Andes. “Observatorio de TransMilenio - 2008”.
Cámara de Comercio de Bogotá. Bogotá, 2009
Figure 13: Trunk lines fleets 2001 - 2008
The feeder bus fleet consists in 2008 out of 476 buses. The main increases were in
2005 and 2008, with 248 and 124 units (see Figure 14).

33
Source: Universidad de los Andes. “Observatorio de TransMilenio - 2008”.
Cámara de Comercio de Bogotá. Bogotá, 2009
Figure 14: Feeder bus fleet 2004 - 2008
6 Integrated Public Transport System (SITP - Sistema Integrado de Transporte Publico)
6.1 Introduction
The current city administration has launched an ambitious program to create a new
business and operational scheme of public passenger transport, which has been
called the Integrated Public Transport System - SITP. SITP will eliminate the current
structure provided by buses, small buses and minibuses and integrate this traditional
public transport with the massive transit system. This implies a special infrastructure
for the functionality of the systems, transport equipment specifications based on
technical standards and a management scheme that combines the previous two
items under a single system with the purpose of carrying 100 % of travel demand of
the citizens of Bogotá DC.
The SITP will consist of the two transport systems that operate in the city independ-
ently: the system TransMilenio and the traditional public transport. One is a high-
capacity system that operates in high demand corridors and the second is a route
system that operates at low capacity corridors handling nearly 80 % of the daily trips
in the city.
The SITP divides the city into 13 zones (see Map 5). Each will be headed by an
operating company selected through competitive bidding. This system will provide
routes to all parts of the city. The selection process will take into account with a high
priority to rank small owners of buses, small buses and minibuses, public transport
companies, and massive transit companies in Bogotá. The SITP will be given in con-
cession for 24 years.
These companies provide the service directly and will become therefore responsible
for all items included in the system. The service requires them to hire the drivers of
vehicles who will have a fixed salary and benefits.

34
Source: TRANSMILENIO S.A.
Figure 15: Sub-systems of the Integrated Transport System - SITP (IPTSP)
Source: TRANSMILENIO S.A.
Map 5: Operation zones SITP
It will create an integrated fare collection and fleet management, and payment of the
fee will be done with a smart card that can be used in different types of transport:
traditional buses, Metro and TransMilenio. There will be an integrated tariff, which

35
means the user pays for a bus ticket or TransMilenio and if they require a second trip
to reach their final destination, you need to pay only a small additional amount and
not another passage. The additional payments will be lower than the first transfer fee
and the coresponing trip can be done within a given period of time.
The buses have fixed stops with information about route frequency and timetable of
bus lines. New terminals will be built, as well as stations and stops. The maintenance
of the road infrastructure will be provided by the city.
The fleet of buses will be modernized, with high quality and less pollution. From
2010, no public transport vehicle will be more than ten years old, and lifetime may not
exceed twelve years.
6.2 Stages of Implementation of SITP
It is envisaged that the SITP be developed in four phases namely:
Phase 1 SITP: Preparation for implementation of the SITP.
Phase 1 includes the selection process for the operators and the integrated zonal
fare collection and control - (SIRCI).
Phase 2 SITP: Gradual implementation of the operation. Upon completion of
Phase 1.
The tenders for the operation and for the SIRCI zonal operation will be awarded.
The new scheme to provide customer service will gradually start aiming to com-
plete the full integration step by step.
In this phase, which initiates the operation, in areas the current TransMilenio sys-
tem is already operating the traditional public transport will be integrated to the
TransMilenio system. In other areas, the service of the current public transport
system shall be maintained until SITP operators start providing the service.
Phase 3 SITP: Integrated operation of SITP.
Once Phase 2 will have terminated the fare integration and the integration of all
existing means of public transport will make improvements to the infrastructure of
the road system to generate operational efficiencies and will continue both the on-
going
process of adjustment of the supply to the demand and the replacement of vehi-
cles. This will be done under the Medium Term Fiscal Framework.
Phase 4 SITP: Integration with rail modes.
This phase corresponds to the system integration of the other means of transport
provided in the Mobility Master Plan as part of the SITP, including the Metro. It will
start when the rail bound systems are ready to operate. At this stage, as part of
the SITP the system and all other modes will be integrated with respect of opera-
tion and fares to the Metro. This will be done under the conditions to which the
transport authorities and the private operators of the service agree. All the above
will be developed within a framework of financial sustainability, to preserve the
economic equilibrium of the integrated components and the benefits to the user of
the transport service.

36
6.3 Proposed Route Types
The routes planned for the SITP are classified into the following four groups:
Trunk Routes
o Features: Shaft structuring, long distance, high demand.
o Fare Collection Type: On Station.
o Operation: Exclusive lane left with or without bypass.
Auxiliary Routes
o Features: Support for trunk routes in corridors of intermediate demands. Trans-
mission and distribution function of demand.
o Fare Collection Type: On the bus by means of electronic payment.
o Operation: Mixed traffic.
Feeders and Complementary Routes
o Features: Power trunk routes in doorways, simple stations and intermediate
stations.
o Fare Collection Type: On the bus by means of electronic payment or backbone
station.
o Operation: Mixed traffic.
Special Routes (Urban and Rural)
o Characteristics: Attention to areas of difficult access or very low demand.
o Collection Type: On the bus by means of electronic payment.
o Operation: Mixed traffic.
The implementation of the routing architecture is a gradual process which must start
from the current situation and move towards the future, to have implemented the type
of routes aforesaid.
7 The Metro System 7.1 Introduction
It has been sixty years (it was in 1950), since the first talks, regarding the need of
building the underground system for the city, occurred. This started off when the pre-
vious tram system disappeared. The underground project has been subject to nu-
merous studies and countless technical and political debates.
Today, Bogotá is closer to the possibility of having this mass transit system, given the
City‟s Mayor position regarding this subject. Besides this was one of his campaign
promises. He has the support of the national government, although this is subject to
technical studies and the funding of the feasibility studies by the World Bank. The
studies carried out in 2009 have had serious critiques and have been validated by
major Colombian universities such as the “Universidad Nacional de Colombia” and
the “Universidad de Los Andes” with a great support from the University of Illinois.
37
7.2 Studies Chronology
In the past 30 years, a total of four studies analyzing the construction of the under-
ground system in Bogotá have been carried out. However, a decision on whether to
proceed hasn‟t been taken. These four studies are summarized below.
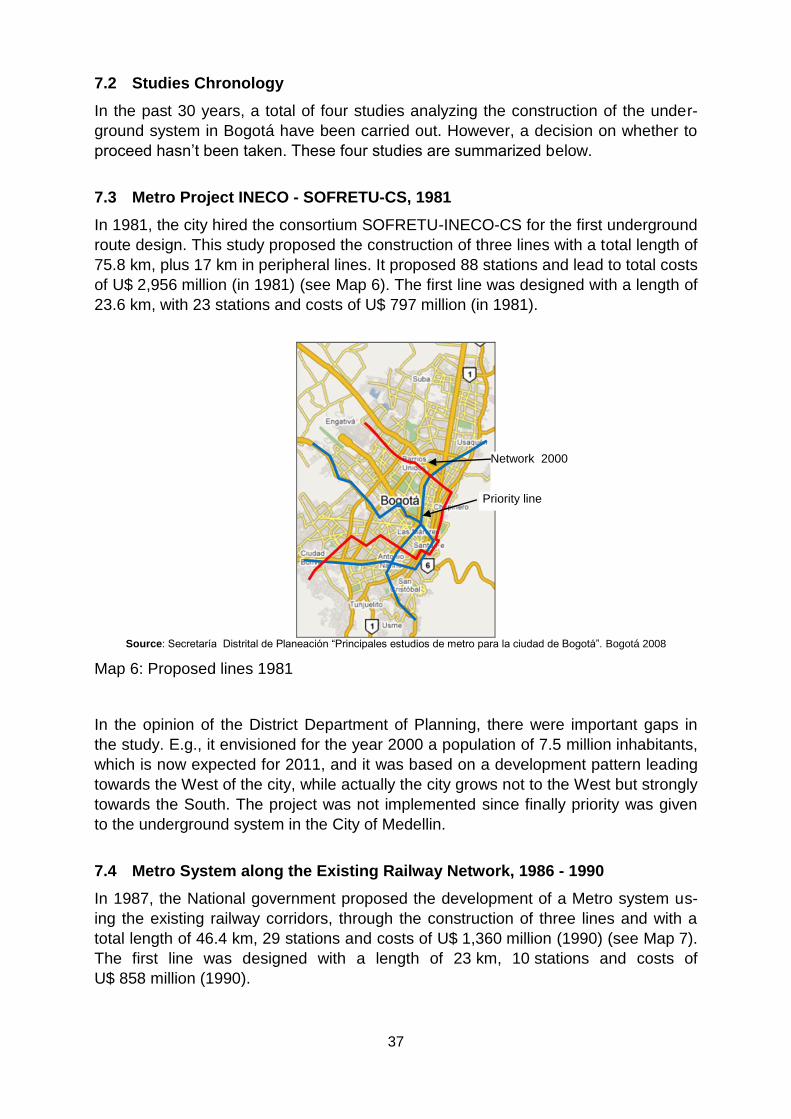
7.3 Metro Project INECO - SOFRETU-CS, 1981
In 1981, the city hired the consortium SOFRETU-INECO-CS for the first underground
route design. This study proposed the construction of three lines with a total length of
75.8 km, plus 17 km in peripheral lines. It proposed 88 stations and lead to total costs
of U$ 2,956 million (in 1981) (see Map 6). The first line was designed with a length of
23.6 km, with 23 stations and costs of U$ 797 million (in 1981).
Source: Secretaría Distrital de Planeación “Principales estudios de metro para la ciudad de Bogotá”. Bogotá 2008
Map 6: Proposed lines 1981
In the opinion of the District Department of Planning, there were important gaps in
the study. E.g., it envisioned for the year 2000 a population of 7.5 million inhabitants,
which is now expected for 2011, and it was based on a development pattern leading
towards the West of the city, while actually the city grows not to the West but strongly
towards the South. The project was not implemented since finally priority was given
to the underground system in the City of Medellin.
7.4 Metro System along the Existing Railway Network, 1986 - 1990
In 1987, the National government proposed the development of a Metro system us-
ing the existing railway corridors, through the construction of three lines and with a
total length of 46.4 km, 29 stations and costs of U$ 1,360 million (1990) (see Map 7).
The first line was designed with a length of 23 km, 10 stations and costs of
U$ 858 million (1990).
Priority line
Network 2000

38
Source: Secretaría Distrital de Planeación
“Principales estudios de metro para la ciudad de Bogotá”.
Bogotá 2008
Map 7: Proposed lines over railway tracks 1987
To implement the project in terms of "Turnkey" the Italian company InterMetro SPA
was picked out of eight international bidders. The Planning authority considered that
the proposal, submitted by the Italian consortium, was not clear in technical terms nor
financially and the forecasted costs were far below the international standards. Fur-
thermore, the system was proposed in areas of low demand.
7.5 Underground system propose in the Transportation Master Plan by JICA,
1996
In 1996, the Japanese Cooperation Agency, JICA, prepared the Transportation Mas-
ter Plan for the city. In it, a comprehensive development scheme for the city with an
integrated transport system with trunk lines was proposed. The project included as
well a public railway transportation system plus the layout of an underground corridor
that would be connected to the other subsystems (see Map 8). This line was de-
signed with a length of 32 km. The costs were estimated to U$ 2,275 million (1996).
The construction was planned to begin in 2006 and the start of operation was sched-
uled in 2016.
Línea prioritaria
Red total

39
Source: Secretaría Distrital de Planeación “Principales
estudios de metro para la ciudad de Bogotá”. Bogotá 2008
Map 8: Line proposed in 1996
The study was based on a future city developing towards the North, but the Bogotá
District in its Land Management Plan (“POT”), contrary to this study, limited the de-
velopment in that sector of the city. These decisions show a clear lack of coherence
in urban planning.
7.6 Integrated Mass Transport System - SITM (Sistema Integrado de Trans-
porte Massivo), 1997
In 1997, the consortium SYSTRA-BECHTEL-INGETEC was commissioned to de-
velop the "Integrated Mass Transit System Conceptual Design for the Savannah of
Bogotá-MITS". Within this study, an underground system with three lines was pro-
posed (see Map 9). Including a total length of 78.8 km and costs of U$ 4,171 million
(1996), the system should be supplemented by a trunk line network of 48.4 km
length.
The first metro line was designed with a length of 29.3 km, including 23 stations. The
total costs were estimated to U$ 2,450 million (1996). It included the simultaneous
implementation of a bus corridor system with a length of 29 km and costs of
U$ 174 million (1996).
As with the previous study, there wasn‟t any correlation between the study on the
integrated mass transport and the city‟s urban development. While the proposed in-
tegrated system suggested a development to the West of the city, the city‟s own de-
velopment is from the North to the South.

40
Source: Secretaría Distrital de Planeación “Principales
estudios de metro para la ciudad de Bogotá”. Bogotá 2008
Map 9: Lines proposed for integrated mass transit system - 1997
7.7 Comparison of Proposals 7.7.1 “UFL” (Underground´s First Line)
Table 3 shows the main “UFL” (Underground‟s First Line) features, suggested in the
studies presented.
Study Year Starting
Year Length
km Capacity
Pas/hour/direction
Design speed KPH
Cost
US$ Millions (1)
INECO-SOFRETU 1981 1986 23.0 44.000 28 2.200 INTERMETRO
SPA 1987 1995 23.0 22.000 (2) 44 1.928
JICA 1996 2016 32.0 42.000 3.057 SYSTRA-
BECHTEL-INGETEC
1997 2006 29.3 56.000 40 3.293
Sources: Secretaría Distrital de Planeación “Principales estudios de metro para la ciudad de Bogotá”. Bogotá
2008
Notes: (1) Costs of 2007 (2) Capacity recalculated
Table 3: Main features of the “UFL” (Underground´s First Line), proposed between
1981 and 1997
7.7.2 Studies Most Frequent Preferable Corridors
Map 10 shows the corridors that have been frequently chosen in the various mass
transport studies made in Bogotá between 1981 and 1994, according to the research
carried out by the Japanese Agency for Cooperation and within the Transportation
Master Plan of 1996.

41
Sources: Secretaría Distrital de Planeación “Principales estudios de metro para la ciudad
de Bogotá”. Bogotá 2008, con base en la investigación hecha por JICA- 1996.
Map 10: Most frequently chosen corridors in previous studies
8 Comprehensive Program of Mobility of the Capital Region - CPMCR
8.1 Introduction
As a result of the debate which arose in the technical evaluation study of the subway
system conceptualization, it was concluded that the system should be part of a com-
prehensive scheme of local and regional mobility, linking Bogotá with the Department
of Cundinamarca and a big area which is called the Capital Region, through the inte-
gration of the urban transport system in the city with the long distance commuter sys-
tem.
8.2 Expected Developments
To meet the goal of the Comprehensive Program of Mobility of the Capital Region
should the following developments in the urban and regional transport system been
undertaken:
Collective Urban Transport Integration through Integrated Public Transport
System (ITPS)
Develop the steps envisaged for the ITPS, which is in the process of award of
companies to provide service to different areas.

42
TransMilenio System Expansion
It is necessary to expand and consolidate the TransMilenio system for which the
following corridors are prioritized, as shown in Map 11: Carrera 68,
Avenida Boyacá, Avenida Primero de Mayo, Calle 13 - Calle 19 and
Avenida Ciudad de Cali.
Source: TRANSMILENIO S.A.
Map 11: Corridors established for the priority of TransMilenio
Adapting Existing Infrastructure to Integrate with the ITPS
Complementarily it is necessary to adapt the existing infrastructure to obtain an
optimal integration of TransMilenio with the rest of the system, for which it has
been anticipated:
a) Extension of capacity of simple stations of Phase I and II.
b) Extension of the corridors with Americas, Caracas, North, Tunal and connect
the corridors Tunal and NQS (see Map 12).
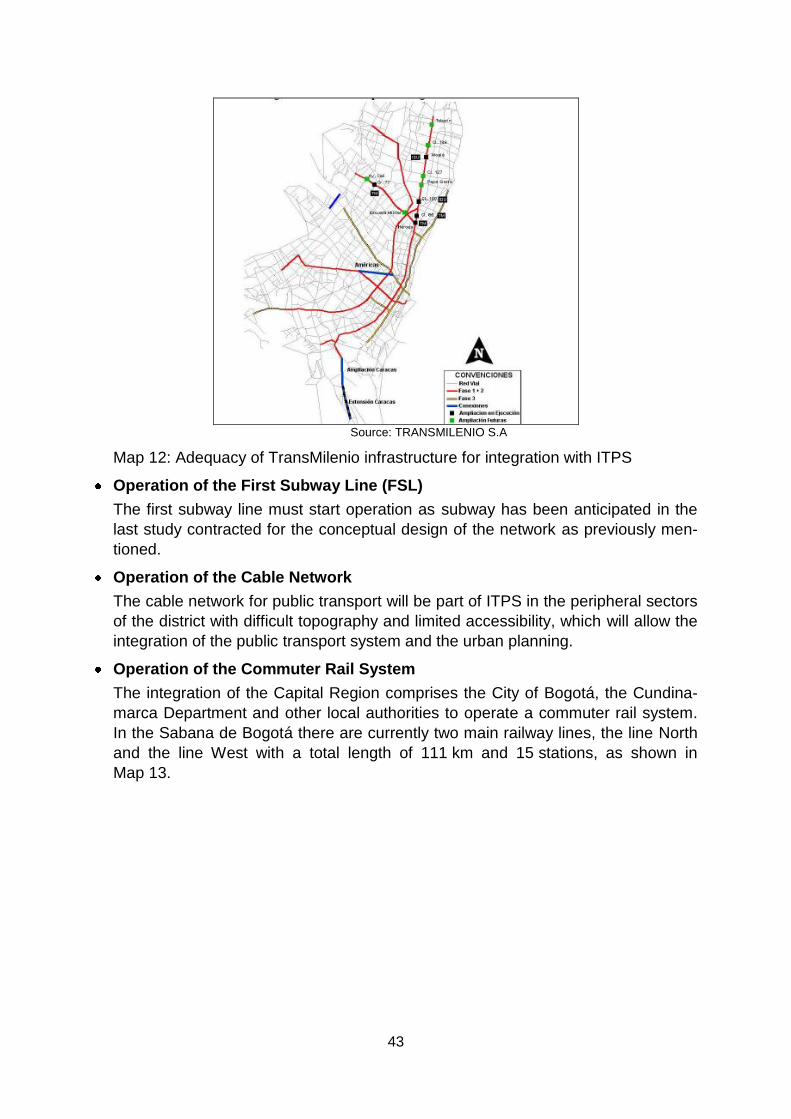
43
Source: TRANSMILENIO S.A
Map 12: Adequacy of TransMilenio infrastructure for integration with ITPS
Operation of the First Subway Line (FSL)
The first subway line must start operation as subway has been anticipated in the
last study contracted for the conceptual design of the network as previously men-
tioned.
Operation of the Cable Network
The cable network for public transport will be part of ITPS in the peripheral sectors
of the district with difficult topography and limited accessibility, which will allow the
integration of the public transport system and the urban planning.
Operation of the Commuter Rail System
The integration of the Capital Region comprises the City of Bogotá, the Cundina-
marca Department and other local authorities to operate a commuter rail system.
In the Sabana de Bogotá there are currently two main railway lines, the line North
and the line West with a total length of 111 km and 15 stations, as shown in
Map 13.

44
Source: Estudio Estructuración Técnica, Legal y Financiera del Tren de Cercanías de la
Sabana de Bogotá y el Distrito Capital. Ministerio de Transporte
Map 13: The existing railway corridors
The Western Railway system is connected with the TransMilenio at the intersec-
tion with Avenida Ciudad de Cali.
9 The Future of Mobility in Bogotá
As it has already been mentioned, the future of mobility in Bogotá begun developing
during the last fifteen years in which several studies have been conducted, important
actions like the development of the massive transport system TransMilenio have
been implemented, political, normative, technical, enterprise, environmental, social,
physical, and landscape changes took place and budget was provided to build the
basis to realize a structural change in favor of the public transport service of the city
and the Capital Region.
For the current administration, the challenge of mobility planning in Bogotá has fo-
cused on the following projects:
Beginning of the operation of Phase III of the TransMilenio System, including the
design and implementation of the village Soacha´s corridor.
The studies and designs for Public Transport System - PTS.
The coordination with Cundinamarca for the implementation and articulation of the
subway and the commuter rail system.
Linked to the above, a series of complementary projects have been developed focus-
ing on public space management, coordination and integration of intermodal disin-
centives to automobile use in order to build a high quality mobility, which is well con-
nected, more secure, accessible, efficient productive, organized, and friendly to the
Integration with TransMilenio
site

45
environment. In conclusion the City of Bogotá and th Capitol Region are directing
their efforts towards the future mobility of a more humane and sustainable city.
References [1] Sierra D Martha Jeanet. “Del tranvía al Transmilenio” Luis Ángel Arango Digital Library.
Bogotá. 2002
[2] http://www.tramz.com/co/bg/t/ts.html. Allen Morrison‟s paper.
[3] http://www.museovintage.com/transporte/. Public Transport history in Bogotá.
[4] Montezuma Ricardo. “Presente y futuro de la movilidad urbana en Bogotá”. Veeduría
Distrital. Bogotá. 2000.
[5] Departamento Nacional de Planeación. “Política para mejorar el transporte urbano de
pasajero”. COMPES 3167. Bogotá - Colombia.2002
[6] Departamento Nacional de Planeación. “Política nacional de transporte urbano y
masivo”. COMPES 3260. Bogotá - Colombia.2003
[7] Ojeda Zabala, Nancy Isabel. “El ferrocarril y la estructura lineal, Bogotá, 1889-1938”.
Architecture journal, Vol. 9, No. 1, 2007, pp. 13-17. Universidad Católica de Colombia.
Bogotá. Colombia.
[8] TRANSMILENIO S.A. “Un sistema de transporte de alta capacidad y bajo costo”
Bogotá. Colombia.
[9] TRANSMILENIO S.A. “Anexo Técnico Licitación 004 de 2009”. Bogotá. Colombia.
2009.
[10] Universidad de Los Andes.“Observatorio de Movilidad 2008”. Cámara de Comercio de
Bogotá. Bogotá - Colombia. 2009.
[11] Universidad de Los Andes. “Observatorio de TransMilenio - 2008”. Cámara de
Comercio de Bogotá. Bogotá - Colombia. 2009.
[12] Oscar Aristizabal “Disfuncionalidades perennes de movilidad y transporte en Bogotá”.
2009.
[13] Secretaría Distrital de Planeación “Principales estudios de metro para la ciudad de
Bogotá”. Bogotá.
46
Sustainable Infrastructure Planning in Post-Oil Cities -Lessons from Masdar (Abu-Dhabi) and Port Harcourt
(Nigeria) for Tema (Ghana)
Alexander Boakye Marful Institute of Urban Planning and Design of the Faculty of Architecture and Urban Planning, University of Stuttgart, Germany. Keplerstraße 11 70174 Stuttgart Germany [email protected] Abstract: In the advent of oil discovery, the boom of infrastructure development in the country is always phenomenal and if it‟s sustainably planned and properly imple-mented can change the socio-economic fortunes of the country. The case varies for various countries due to some action and inactions of its policy makers and this be-come evident in the spatial disposition of its infrastructure as well as the growth of the city as a whole. The euphoria and excitement surrounding Ghana‟s oil discovery have reach a state which calls for policy makers to take a break from the jubilation and plan for its infrastructure development in the next few decades. The type of plans instituted would determine whether important cities like Tema would develop to be like Port Harcourt of Nigeria or Masdar of Abu-Dhabi. As the treasures base of the nation, and the fact that it is the centre of the oil and gas industry-technology in Nige-ria and the West Africa sub-region; Port Harcourt holds the largest accumulation of heavy and light industry-technology in Nigeria and the West African sub-region. As a city which was original founded and planned by the colonial masters to export coal to England is also nicknamed the Garden City. It has a vibrant oil economy; offering myriad opportunities for business, investment and tourism but also have its own in-frastructural and physical development challenges that do not reflect the apparent wealth accrued from the oil. Masdar City on the other hand is a young city which was master planned by the Brit-ish Architectural firm Norman Forster and Partners in 2008 and is also growing fast due to the revenues from the 1971 oil discovery in United Arab Emirates. Abu-Dhabi, the capital state of the UAE sprang from a fishermen and hunters community by ap-plying the latest principles of sustainability, explore renewable resources of energy that has transform it to an open, industrious, progressive and tourist capital. Masdar City a part of Abu-Dhabi urban utopia (as described by some urban and development planners) represent a new type of urban setting and lifestyles that blend innovation, technology and sustainability in the harsh desert climatic condition. Just as C.A. Doxiadis planned Tema (the industrial city and largest port in Ghana) in the 1960‟s with the Garden-City concept, the construction of Masdar City is also being heralded as "the world‟s first carbon-neutral, zero-waste city". It is therefore prudent to critically interrogate the underlying issues and principles that informed the infrastructure de-velopment and planning of the two cities (Masdar and Port Harcourt) which have dic-tated the final disposition of the urban fabric. In this paper, the current trends of sustainable infrastructure planning and develop-ment in Post-Oil Cities with reference to Port Harcourt and Masdar City would be dis-cussed. The issue of relevance of Masdar City Infrastructure Development and Port

47
Harcourt Current state of Infrastructure would be critically analysed as well. Finally, recommendations from lessons gleaned from both Masdar City and Port Har-court would be made for the future infrastructure planning and development of Tema Metropolitan area when the oil revenues in Ghana start to manifest in Ghana‟s economy. Key Words: Sustainable, Infrastructure Planning, Development
1 Sustainable Infrastructure planning
Infrastructure is the basic physical and organizational structures needed for the oper-
ation of a society or enterprise,1 or the services and facilities necessary for an econ-
omy to function.2 The term typically refers to the technical structures that support a
society, such as roads, water supply, sewers, power grids, telecommunications, and
so forth. Viewed functionally, infrastructure facilitates the production of goods and
services; for example, roads enable the transport of raw materials to a factory, and
also for the distribution of finished products to markets. Infrastructure can be classi-
fied as „Hard‟ or „Soft‟ , „Material‟ or „Institutional‟ depending on its form of application.
"Hard" infrastructure refers to the large physical networks necessary for the function-
ing of a modern industrial nation, whereas "soft" infrastructure refers to all the institu-
tions which are required to maintain the economic, health, cultural and social stan-
dards of a country, such as the financial system, the education system, the health
care system, the system of government and law enforcement, as well as emergency
services3.
Thus a more systematic definition of the term „infrastructure „was undertaken by
Jochimsen4 two decades ago. He defined it as the sum of all basic material struc-
tures, institutional conditions and human resources available to society, needed for
functioning of the economic sector. “Material infrastructure” was defined as compris-
ing all buildings and physical networks (such as roads pipelines, water ways, sewer-
age systems etc.) which are directly or Para –governmental) agencies. “Institutional
infrastructure” constituted the basis for the functioning of social and economic activi-
ties and included all written and unwritten laws, regulations, administrative and plan-
ning systems, traditions and other behavioural patterns. Personal Infrastructure
(“Human Capital”) was comprised of the quantity of human resources available to a
society.
Infrastructure also comprehends such goods and services that cannot be marketed
because their use cannot be precluded to any individual. The exclusion principle is
not applicable. (E.g. roads). Hence it would be appropriate to say that Sustainable
urban infrastructure5 is a term used to describe infrastructure that facilitates a place
1 Infrastructure, Online Compact Oxford English Dictionary, http://www.askoxford.com/concise_oed/infrastructure (accessed
January 17, 2009) 2 Sullivan, arthur; Steven M. Sheffrin (2003). Economics: Principles in action. Upper Saddle River, New Jersey 07458: Pearson
Prentice Hall. pp. 474. ISBN 0-13-063085-3. http://www.pearsonschool.com/index.cfm?locator=PSZ3R9&PMDbSiteId=2781&PMDbSolutionId=6724&PMDbCategoryId=&PMDbProgramId=12881&level=4. 3 http://www.opendb.net/element/19099.php
4 Reimut Jochimsen, theorie der Infrastruktur. Grundlagen der Marktwirschaftlichen Entwicklung(Tübingen,1966; p.145)
5 http://en.wikipedia.org/wiki/Infrastructure (accessed June 20,2010)

48
or regions progress towards the goal of sustainable living. The criteria for what can
be included in this kind of urban environment varies from place to place, given differ-
ences in existing infrastructure and built form, climate and availability of local re-
sources or talents. These infrastructures are therefore the basic facilities, services,
installations, institutions and physical networks that cannot be marketed because
their use cannot be precluded to any individual but are needed for the functioning of
a community or society.
Consequently, the following could be considered as vital component or aspect of sus-
tainable urban infrastructure:
public transport networks
Distributed generation and integrated energy demand management initiatives
and programs
High efficiency buildings and other development constraints such as only per-
mitting the construction of green buildings and sustainable habitats with
energy-efficient landscaping.
connected green spaces and wildlife corridors
Low impact development practices to protect water resources.
Macro and Micro-Level Policies that have sustainability as its fundamental
Pillars.
1.1 Characteristics of Cities with Infrastructure planned with sustainability
concept as a basis
The infrastructure in many cities with great attractivity for business and tourism as
well as being liveable due to its form, function and disposition having varying underly-
ing principles that govern them. The City‟s image is largely dependent upon the type
of infrastructure that have been provided and how its supporting the society and the
local economy.
Sustainable Infrastructure should therefore:
a. Minimise resource use and ecological impacts throughout its lifecycle
b. Preserve ecosystem integrity
c. Not aggravate adverse global phenomena as climate change and ozone deple-
tion
d. Deliver economically viable goods and services
e. Maximise long-run economic growth for the entire community
f. Be financially viable
g. Be managed and operated in a sustainable way
h. Be socially inclusive
i. Contribute to meeting the Millennium Development Goals (MDG)
j. Be accepted and supported by the general population
49
1.2 How critical is sustainability to Post-Oil Cities
A Post-Oil City is a relatively large and permanent urban settlement which generally
have advanced or complex infrastructural systems which has evolved or been devel-
oped after the discovery of oil in the country of location. These cities manifest itself
by the type of investment and infrastructure that follow the city‟s development. Due to
the hysteria that follows oil find and economy, a lot of basic fundamental process that
are considered the building block of sustainability are overlooked or side-track. A vi-
sion for the city that considers the entire country as well as the welfare of the current
and future populace is critical. This is usually accompanied by a pragmatic action
plan that is built on consensus building but not necessarily democratic principles (illi-
teracy level is critical for a successful democracy). This is really important because
after the oil economy becomes a focal issue in national discourse, the people must
take ownership of this vision and implement it for the lifting up of the living standard
of the entire country. Oil and gas which is termed as black gold has also been de-
scribed as a blessing in many Arabian countries whilst turning out to be a source of a
„curse‟ in many African countries. The difference is the approach of utilization and
distribution of wealth and infrastructure that accompany the Post-Oil Cities. Whereas
some cities were built for the selfish interest of the colonial Masters who never
thought of any Post Independent states, others were developed for the people by
Patriotic citizens who thought about the future of their country.
For example:
I. Masdar, Abu-Dhabi have enjoyed oil income since 1971
II. Port Harcourt, Nigeria have benefited from oil since 1956
III. Doha, Qatar enjoyed oil income since 1949.
However one cannot say that all these cities have benefited from the presence of any
Post-Oil economy at one point in the country‟s history. Whereas Abu Dhabi and
Qatar stand out due to the tremendous infrastructure improvement that has been
built since the discovery of oil, Nigeria cannot boast of such. The basic difference is
the sustainability principle in planning and development of Infrastructure in Post-Oil
Cities. Thus it is important to emphasise that sustainability concept is crucial for the
for the rapid development of the infrastructure that affects lives in the communities
with post-oil economy. These involve strategies and their associated action plan
which involves the community strategies and that is necessary to identify infrastruc-
ture requirements that are support development opportunities and growth. The fabric
of the city contains paths, landmarks, nodes, districts and edges form the skeleton of
the city as well. (McGraw-Hill Companies, 2004; Speiregen, 1965, pg 4:3, 5). The
close interaction of this fabric with routes, open spaces and buildings form geometri-
cal, regular or irregular urban pattern in the city. Thus the Urban fabric which is under
consideration include the physical aspect of urbanism, emphasizing building types,
thoroughfares, vistas, open spaces, frontages, plazas, and streetscapes but exclud-
ing environmental, functional and socio-cultural aspects( American Planning Associa-
tion).
The influence and impacts of the POST-OIL Economy (POE) on the Urban Fabric
differ from region to region as well as Country to Country and are at times influence

50
by the geo-political scenario of the area. The POE can positively translate an area
which under normal circumstances could have suffered from urban gentrification to
become a cosmopolitan precinct. The city becomes multi-cultural and provides an
enhanced socio-economic infrastructure system that supports diverse groups of peo-
ple. More so, the POE has adequate resources to experiment various types of infra-
structure that can be synchronised with the current high technological communication
systems. However, this is usually accompanied with the proliferation of Foreign Ur-
ban style, Architectonic features and principles that do not fit in the local authentic tic
fabric that expresses the spirit and ethos of the community. In an event where here is
not adequate or proper urban management system in place, the urban fabric be-
comes a distorted impression of struggle that depicts the profile-economic inequality
that pertains in the city.
The choice of Masdar and Port Harcourt as focal case study was base on the under-
listed issues
Both Cities‟ infrastructure development depended heavily upon the Oil In-
come
They were all master planned by British Planners with Green city Concept
Port Harcourt has similar geo-physical and socio-cultural characteristics like
Tema.
Port Harcourt represent infrastructure planning with a moderate vision but
without “Soft” systems in place
Masdar represent an attractive utopian state without any major geophysical
or socio-cultural similarities
Masdar also represent also a futuristic case with adequate planning for the
“Soft” System.
2 Masdar, Abu-Dhabi as A Post-Oil City
The capital of United Arab Emirates, Abu Dhabi, sprang up half-way through the
eighteenth century as a fishermen and hunters‟ village. It was transformed when pe-
troleum was discovered there in the mid twentieth century and the United Arab Emir-
ates came into existence in 1971 (Larsen,2009). Abu Dhabi‟s economy is heavily
dependent on its vast reserves of oil and gas. According to the CIA country report
2008,the UAE is the 11the largest oil producing country in the world and nearly about
40% of the country‟s output is based on oil and gas output.
2.1 Urban Fabric and Infrastructure Development
Masdar, a roughly six-square kilometre, 50,000-person city, is touted as being the
first carbon-neutral, zero-waste, car-free city (Basantani 2008). One major advantage
to building an entirely new city is the ability to selectively employ the latest technolo-
gies and materials in order to build a city that has as little impact on the natural envi-
ronment as possible. The residential density is expected to be about140 inhabitants /
hectare but the daily density would be 245 people per hectare. The city according to
Larsen (2009) was also planned after the traditional Islamic city approach. Thus it
has narrow streets which is naturally shady due to the mutual shading effects of the
high density low rise block of buildings, and also possesses diverse open and public

51
spaces. In the case of Masdar, Larsen (2009) explains that the environmental sus-
tainability and impact of virtually every aspect of the city was carefully considered,
from the initial planning and construction stages to the eventual daily functions of the
city.
2.2 Characteristic of Infrastructure Planning and Development in Masdar
As indicated in figure 1, the infrastructure provision of which had been planned for
Masdar are in layers of Transportation, Energy, Waste Management Water provision
and management. In the area Transportation, Masdar would be one f the world‟s first
car-free scities (Biello, 2008; Stilwell et al, 2008). The master plan outlines three pri-
mary means of transportation: walking, a light rail system, and an elevated personal
rapid transit (PRT) system (Figure 1). This integrated system intends to provide a
public transit stop within two-hundred meters of any given point in the city (Basantani
2008). There would be about three thousand of the PRT Vehicles with about 85 to
100 station generation about 135,000 trips per day. Due to Masdar‟s pedestrian-
friendly design, walking and bicycling are expected to be the city‟s most popular
forms of transit (Masdar Initiative, 2008). As previously discussed, streets in Masdar
are narrow and shaded to provide a comfortable walking environment that encour-
ages humaninteraction (Masdar Initiative, 2008). Pedestrian networks in the city are
also supplemented by two electric transportation systems designed to efficiently con-
vey people further distances (McGrath, 2008; Stilwell et al,2008). The first system is
a light rail which will connect Masdar to Abu Dhabi City, the adjacent international
airport as well as other surrounding communities (Masdar Initiative, 2008). The sec-
ond transport system developed for use in Masdar is an underground personal rapid
transit system (PRT) which relies on compact podcars to shuttle people around the
city (Biello, 2008; Stilwell et al,2008). These podcars will run on a series of magnetic
tracks using electricity and will be fully automated, directly shuttling riders to a multi-
tude of stations throughout the city (Biello, 2008; Stilwell et al,2008). Convenience
was made a priority for each of these electric transport systems, with stations avail-
able within a 200 meter radius from any location in the city (Masdar Initiative, 2008).
As a city located in a harsh desert climate, a highly efficient water system is a key
element of Masdar‟s sustainability plan. Masdar will derive all of its water from a de-
salinization plant located just outside the city which will run solely on solar power
(ENN, 2008). Masdar‟s planners took great strides to lower the city‟s net water de-
mand, achieving a 60% reduction in overall water consumption (McGrath, 2008).

52
Figure 1: Infrastructure Development in Masdar. Source: Masdar Initiative, 2008
In addition, 80% of all water in Masdar will be repurified and recycled back for
household and irrigation purposes (McGrath, 2008). Masdar will also apply some of
the world‟s most advanced water recapture technologies to catch and reuse water
diverted for landscaping. (Sullivan, 2008; Stilwell et al,2008). Masdar City„ power in-
frastructure features a range of renewable energy technologies; including a range of
photovoltaic plants(PV), a concentrating solar thermal power plant (CSP), evacuated
thermal tube collectors, and a waste-to energy plant. Each technology has certain
characteristics that determine how and when the energy produced will be used, its
advantages, and disadvantages, and not least, its cost. (Nader/Energy Procedia,
2009, p.3953).
Masdar City will rely on intelligent design and innovative urban planning in order to
cut energy consumption by about 70% from that needed for a conventional city under
Abu Dhabi‟s current conditions(Nader/ Energy Procedia,2009, p.3953).The specifica-
tions for the façades of all buildings within Masdar City are extremely high. In a very
warm climate such as Abu Dhabi, the loss of cooled air entails significant energy
cost. By specifying high quality façades and shading them from the worst of the day‟s
heat, the need for cooling and for power can be greatly reduced. All Masdar City
buildings would be intelligent buildings, incorporating monitoring and control systems,
which would facilitate the most efficient possible use of resources.(Nader/ Energy
Procedia,2009, p.3953).Through a combination of careful control of materials brought
onto the site and intensive recycling and waste-to-energy technologies, Masdar City
would aim for net zero waste. Physical waste would be managed through an inte-
53
grated, user-friendly and odorless system and biodegradable materials would be
composted. (Nader/ Energy Procedia, 2009, p.3954).
3 PORT HARCOURT, NIGERIA AS A POST OIL CITY
The cities that make up the region derived the name (Niger Delta) from being si-
tuated at the mouth of the River Niger, which could be traced back to early 15th cen-
tury. Comprising the people of the region are the Ijaws (who form the largest ethnic
group in the area), the Itsekiris, Urohobos, Efiks, Ibibios and other smaller ethnic
groups (IHRHL, 2000, p.1). The colonial era gave birth to Nigeria with the Niger Delta
situated at the Southern-Eastern part of the country. As at 1975, three states were
under the region namely Rivers, Bendel and Cross River States, with two Ibo States,
Anambra and Imo as the hinterland. Following the creation of more states and a re-
definition of which areas should be included in the Niger Delta, 9 states were in-
cluded. They are Abia, Akwa Ibom, Bayelsa, Cross River, Delta, Edo, Imo, Ondo
and Rivers States. (IHRHL, 2000, p.1).
Port Harcout, the capital of River State is the second larget Port of Nigeria. This Port
was developed on a bend of the Bonny river, Where a bluff of solid land lay close to
deep water.It was laid out for the colonial government of Nigeria for effective control
of the hinterland. Apart fron that, Port Harcourt was also developed to tap the vast oil
palm resources of the south–eastern Nigeria and to facilitate marketing of the coal
which had been discovered in the udi hill near Enugu in 1912 (http://en.wiki-
pedia.org/wiki). Its therefore not surprising that with this vision for the city of Port
Harcourt, the resultant urban development that followed after the oil discovery was
notthing to near a sustainable city
3.1 Urban Fabric and Infrastructure Development
There are three significant events which directly affected the growth of Port Harcourt
btween 1946 to 1966 (http://en.wikipedia.org/wiki). These were:
a. The launching of the 10 year Colonial Development Plan in 1946, which
provided for Town planning and Village Reconstruction in Nigeria of which
Port Harcourt was a Part;
b. Political developments in Nigeria and their effect on the local adminstration of
Port Harcourt
c. The expansion of the Nigerian petroleum economy
As per these developments and influence, Port Harcourt was laid out into two
residential nuclei- an African location and the European reservation which were
separated by a neutral zone (predominantly green infrastructure). Each of these
residential nuclei developed different housing standards and general planning
standards, reflecting the double standards of the British Town planning Practice of
the Colonial Africa. The European reservation on one hand had golf courses, country
club (Port Harcourt Club) and a Hospital. Where as the African locan or zone was
characterised by crowded housing, unpaved grid-iron streets and a few green Open
spaces. This development apparently did not reflect the wealth that comes with the
oil economy but another mega-pseudo-slum in the region.

54
3.2 Characteristic of Infrastructure Planning and Development in Port Har-court
The accompanying infrastructure was also characterized by inadequate maintenance
and lack of pragmatic planning with the future growth of the city in mind. The infra-
structure apparently became inadequate for the bustling population. Unlike Masdar,
Port Harcourt was characterized with a high illiterate population adding to the prob-
lem of soft infrastructure gap in the city. Rampant civil unrest which usually becomes
violent protest is also an order of the day in the city. The activities of violent militias
has almost become like a political party fighting for the course of the people. This
consequently affects the project delivery timelines as well as the project funding as
most donors consider the area as unstable and risky to do business. As if that was
not bad enough, the old age anti-developmental problem called corruption was also
almost accepted as part of the norms and cultural practice. Every major infrastructure
project ends up being affected by corruption and hence the quality becomes affected
as well. However, in the past few years a new master plan has been drafted to sal-
vage the almost worst situation and example of a pot-oil city in the sub Saharan Afri-
can region.
Figure 2: Aerial view of portion of the City of Port Harcourt. Source: Googlemap,2010
4 Tema, Ghana as A Post Oil City
Tema is a coastal city, situated about 25km East of Accra, Ghana and it has a land
area of 368.3 sq.km and an estimated population of 0.7 million people. From the
1960s through 1980s. Tema has been transformed rapidly from a small fishing village
into an industrial nerve center of Ghana‟s economy. With a deep seaport, Tema

55
handles about 70% of all shipment to Ghana and some land locked countries in the
West African Sub-Region. Tema accommodates over 200 small, Medium and large
industries include an aluminium smelter,an oil refinery, and food processing
plants.Unlike Masdar or Port Harcourt, Tema was developed after independence and
was planned before the discovery of oil. It however has the fishing community like
both Masdar and port Harcourt prior to the oil economy and have geo-physical
features almost like that of Port Harcourt (http://www.pseau.org).
4.1 Urban Fabric and Infrastructure Development in Tema
Figure 3:Model of the Urban Structure of Tema as planned in the 1960's. Source: Doxia-
dis,1968
Tema is the largest man-made harbor in Africa, and is linked to Accra by both a
railway & highway. Tema which was planned by the Greek Town planner
C.A.Doxiadis was conceptualised after the Ebenezar Howard‟s Garden city concept
and has out grown its planned capacity. As a township, Tema is made up of several
sprawling districts, known as a 'Communities', with the centre of Tema referred to as
'Community 1'. Tema is separated from Accra by Sakumono and eastern suburbs of
Accra such as Teshie and Nungua, and the districts of Sakumono and Tema are
themselves kept separated by the Sakumono Lagoon. Tema's communities are
home to several major financial institutions, government departments, retailers,
restaurants, and hotels & guesthouses(http://www.ghanapedia.org). As shown in
figure 4 the structure has metamophose into something entirely different from the
original. It now contain areas which are well organised with adequate green
infrastructure and as well as areas which has defy all the planning regulations and
sprawled. A Mixture of the classical grid iron concept with the organic cul-de-sac
street system makes Tema one of the few areas where the House numbering and
identification is properly done.The streetscape is however littered withunplanned
commercial kiosk serving as convenient shops.All planned garages along the street
have been turned to a commercial activity. On the advent of the oil economy the

56
direction of urban development trend has become very crucial whether to follow the
path of Masdar or by default would tow the path of Port Harcourt.
Figure 4: Urban Structure of Tema in 2010. Source:Google earth,2010
4.2 Characteristic of the Trend of Infrastructure Planning and Development in Tema
Tema is the city with the most planned infrastructure system in Ghana but due to lack
of maintenance culture, almost every infrastructure network is found wanton. at-
tempts are being made recently by the Tema Development company to salvage the
situation but it require more than just money but a paradigm shift in the attitude of the
inhabitants toward the usage of the basic infrastructure system is required. The
breakdown of the solid waste management system is a typical example as many
drains have been turned into the dumping grounds in the various communities. The
electricity and Water system is quite functional apart from the national problem of
unannounced intermittent blackouts. The road network is also quite good apart from
the few bottlenecks that exist in the capital, community 1.
4.3 Lessons from Masdar
There are quite a few lessons that can be gleaned from the the Masdar City devel-
opment as information and advice for Tema as it gets to the cross-roads of develop-
ment. The Masdar city‟s $22 billion budget served as a catalyst for additional innova-
tion, which can also be considered as benefit to the economy(Todonova 2008).When
huge sums of money are allocated to a given course that is an incentive for all major
stakeholders to be part of it.. According to Rosenthal (2008), Aluminum companies
responded to the incentive by developing a more competitive product with significant-
57
ly reduced carbon emissions to prevent their product from being excluded from the
project.
Thus with adequate government policies and budget support for Tema as a post oil
city, there is a possibility of new innovations of traditional materials being enhanced
to meet the international standards for usage and promotion in the African sub re-
gion. The Aluminum Factory which has collapsed could be revived. The zero waste
strategy can be adopted and applied locally from the grassroots. Reduce Reuse and
Recycle as well as composting and waste-to energy strategy can be researched and
implemented with appropriate technology that is suitable for the Ghanaian economy.
This would also call for the central Government policy and budget support as new
recycling plant and waster trucks and companies would have to be supported with
subsidies.
Though a zero car city may be difficult, is a pragmatic green infrastructure network is
planned and implement with the necessary support, it would be pleasant for people
to ride from the origin to their destinations without suffering from the scotching sun.
The Bus Rapid Transit system may also be introduced as well as the Light Rail Sys-
tem in the Long-term. Re-usage of the waste water system can also be explored and
decentralized photovoltaic power also encouraged with the proper policy backing it.
Masdar City was developed on a solid vision and objective backed by the requisite
policy and political will to propel its execution into reality. Tema as a Post oil city
would need just that with the Research back-bone as Masdar institute provided for
Masdar City. Research into the new Technologies, Systems and Policies at Graduate
level is relevant to help maintain any new system that would be introduced into
Tema.
However, Tema should be planned with such budgets as it would promote inequality
in development in the country and foster rural-urban migration. After the oil, what will
Masdar use to sustain its bloated population desert metropolis? Tema ought to be
planned in tandem with the other adjoining cities to curtail the temptation of creating
a haven and expensive city for only the rich. Looking at the policing system in the
country, a case like Masdar in Tema would just increase the high-tech robbery and
artificial lifestyle which would only support the rich, thus causing social segregation
which was fought against during independence of Ghana. No one knows whether
Masdar would be a success or not as it‟s just an experimental project yet to be sent
through the rigorous test of time in a developing economy. Masdar development was
not planned with the people but was planned for the people with the hope that it
would satisfy the aspirations of the future inhabitants.
4.4 Lessons from Port Harcourt
Port Harcourt is a very good example of a failed city with so much of a resource
which Tema can take it as a negative example to motivate its policy makers in doing
the right thing. The militancy and rampant demonstrations just represent the results
of inadequate consensus building and public consultation before developmental pro-
ject is implemented. Tema is in a better position to avoid all the mistakes of Port Har-
court and provide adequate job opportunities for the youth and educate them which
would become difficult for them to engage in violent demonstrations. Transparency in

58
the procurement process during the development implementation would go a long
way the gain the trust of the would-have been demonstrators.
5 Conclusions
In conclusion, the way forward for Tema is to glean from the good practice of Masdar
and adapting it to suit the local environment technologically, culturally and financially.
The whole process would only work if there is good governance in place at the Met-
ropolitan and municipal level as well at the central government. Apart from that Pa-
triotism on the part of the leaders and the professionals would play a key role since it
would cause them to think about Ghanaians first before the foreigners or tourist.
Peace and stability in the political environment is also very crucial for Tema to transit
from its current state to the Post Oil city which would attract recommendation and
cited as a best practice. Suffice it to say, Tema as a post oil city would need to plan
and develop as an Afro-Green City which would be a city for the people by the
people. This Afro-Green Community would be a sustainable or Green community
with the African anthropogenic and socio-economic characteristics permeates
through the housing, built environment, transportation and connectivity, socio-
cultural, governance, environmental, economy and services (Marful,2005).
References American Planning Association, Planning and Urban Design Standards. New Jersey: John
Wiley & Sons, Inc., 2006.pg 485
Areola O., „The Spatial Growth of Ibadan City and its impact on the rural Hinterland”. In: M.O
Filani, F.O Akintola and C.O Ikporukpo (eds) Ibadan Region, Rex Charles Publication,
Ibadan. 1994.
Batty, M., and P. A. Longley, “Fractal-based description of urban form, volume 14,.” Envi-
ronment and Planning B: Planning and Design, 123-134. 1987.
Batty, Michael, and Paul Longley, 1994. FRACTAL CITIES: Geometry of Form and Function.
London: Academic Press Ltd,.
Biello, D. (2008, September 24). Eco-Cities: Urban Planning for the Future. Retrieved De-
cember 4,2008, from http://www.sciam.com/article.cfm?id=eco-cities-urban-
planning&print=true.
Bryn Nelson, 23rd February 2000, Newsday. San Francisco Chronicle..
http://www.sfgate.com/cgi-bin/article.cgi?file=/chronicle/archive/2000/02/23/MN36684.DTL
(accessed January 21st, 2010).
Campbell, S., “Green Cities, Growing Cities, Just Cities? Urban Planning Contradictions of
Sustainable Development.” Journal of American Planning Association 62,: 296-312. 1996.
Doxiadis, C. A. EKISTICS: An Introduction to the Science of Human Settlements. London:
Hutchinson. 1968.
Eglash, R., African Fractals: modern computing and indigenous design. New Brunswick:
Rutgers University Press, 1999.
Environmental News Network (ENN). Abu Dhabi unveils plans for sustainable city. (2008,
January14). Retrieved November 22, 2008, from www.enn.com/pollution/article/29161.
Fourchard L. UNDERSTANDING SLUMS: Case Studies for the Global Report on Human
Settlements; The case of Ibadan, Nigeria by -pg 2, 2003, http://www.vtpi.org/gtz_module.pdf
,accessed, January 2010.

59
Frankhauser P. “Comparing the morphology of urban patterns in Europe – a fractal ap-
proach” European Cities, Insights on outskirts, Report Cost action 10 Urban Civil Engineer-
ing, Vol.2 / 79-105, 2004.
Frankhauser P., “The Fractal Approach, a new tool for the spatial analysis of urban agglom-
erations”, Population: An English Selection, Vol.10, No.1, New Methodological Approaches in
the Social Sciences (1998), 205-240, Institut National d‟ Etudes Démographiques,1998,
http://en.wikipedia.org/wiki/Accra; accessed 10th June, 2010
http://en.wikipedia.org/wiki/Ibadan_accessed June 20, 2010
http://en.wikipedia.org/wiki/Port_Harcourt_accessed_20th_August_2010
http://www.ghanadistricts.com/districts/?r=1&_=3&sa=2995; accessed 10th June, 2010
http://www.ghanapedia.org/org/index.php?option=com_directory&listing=Tema&page=viewLi
sting&lid=39&Itemid=36_accessed_21st July_2010
http://www.pseau.org/epa/gdda/Ateliers_rencontres/4_juillet_2002/TEMA.pdf_accessed_20th
July_2010.
http://www.usea.org/Programs/CFFS/CFFSDubai/DOE_Masdar_DevelopmentOverview_Feb
09.pdf
IHRHL (Institute of Human Rights and Humanitarian law, Port Harcourt), Poverty in wealth: A
Report on the People of Niger Delta and the display of poverty in wealth; IHRHL, Port Har-
court, September 2000.
Larsen L.K., Masdar City: Project Development Overview; Presentation at the conference-
Global California 2009: Where is the money and the Market in our Challenging Global econ-
omy; Santa Barbara, CA, February 2009.
Litman, T., Sustainable Transport: A Source book for policy-makers in Developing Cities,
Module 2b, Mobility Management, Eschborn, 2002
Lloyd P C, A L Mabogunje, and B Awe The City of Ibadan. Cambridge University Press,
Cambridge. 1967.
Marful, A.B., “Green Housing Infrastructure Planning for Sub-Saharan Africa: a paradigm of
medium-low density green.” Thesis submitted in partial fulfillment of Master of Infrastructure
Planning at the University of Stuttgart. Stuttgart: University of Stuttgart, 2005
Masdar Initiative. (2008). Retrieved December 2, 2008, from http://www.masdar.ae/text/invt-
ceo.aspx.
Masdar Institute. (2008, January 1). Retrieved December 2, 2008, from
http://www.mist.ac.ae/institute/index.aspx?mi=mi.
Mcgrath, J. "Is a zero-carbon, zero-waste, zerocarcity on the horizon?".2008; Retrieved De-
cember 4,2008, from http://science.howstuffworks.com/zero-carbon-city.htm.
Nader, S. Paths to a low-carbon economy-the Masdar example; Energy Procedia 1, 3951-
3958, Elsevier Ltd, February 2009.
Office of the Deputy Prime Minister,. The Egan Review: Skills for Sustainable Communities.
London: Crown, 2004.
Oliver, Paul. SHELTER IN AFRICA. London: Barrie and Jenkins, 1976.
Ostwald, Michael J., "Fractal Architecture": Late Twentieth Century Connections between
Architecture and Fractal Geometry".” Nexus Network Journal, vol. 3, no. 1, 73-83. Winter
2001,
Roberts, Brian K. Landscape of Settlement. London: Routledge, 1996.
Speiregen, Paul D.,Making a visual Survey, an article in Urban Design, published by America
Institute of Architects and McGraw-Hill, 1965.
Stilwell B. Et al. MASDAR: Evaluating the world‟s most sustainable city. Final Project for City
and Regional planning 3840, Green cities review; December, 2008.
Sullivan, R. The Living Culture Whose Time Has Come. Ecos, 144(Aug-Sep), 8-10. ; 2008.
United Nations Development Programme (UNDP). Human Development Report. New York:
UNDP, 1992.

60
United Nations Environment Programme (UNEP)., Africa: Atlas of our Changing Environ-
ment. Malta: Progress Press Inc., 2008.
World Commission on Environment and Development (WCED)., Our Common Future. New
York: Oxford University Press, 1987.

61
Mysore: Challenges of Infrastructure Provision
Xerxes Rao SAI Consulting Engineers Private Limited SAI House, Satyam Corporate Square, Behind Rajpath Club, Bodakdev, Ahmedabad - 380 059 India [email protected], [email protected] Abstract: Our urban areas are growing rapidly and require planning and adequate servicing to avoid problems associated with unplanned and ad-hoc growth. The study reflects the sudden spurt in Mysore‟s growth due to economic development within the region. Mysore is currently faced with a tremendous pressure on its resources such as land, urban infrastructure, affordable housing and better quality of life. Currently a master plan is being prepared for Mysore region encompassing an area of 509sq.km. The paper analyses the challenges and key issues relating to the existing situation and suggests the ways to mitigate through the process of master plan preparation maintaining the heritage, culture and environment of the city. Key Words: Mysore, urban infrastructure, master plan, economic development, heri-tage, information technology (IT), Mysore City Corporation
1 Introduction
Large pressure of growing population, increased demand for basic infrastructural fa-
cilities combined with industrial activities have essentially led to rapid changes in land
use patterns in many of the urban areas in India. Planning for infrastructural facilities,
identification of residential and commercial areas without distressing the environment
is a crucial issue. A successful city cannot operate efficiently in isolation from its envi-
ronment and must offer investors security, efficiency in provision of infrastructure and
should put the needs of its citizens at the forefront of all its planning activities. In My-
sore urban planning and architectural conceptualization took place in the early nine-
teenth century. The concern for city aesthetics, spaces for public plazas, parks and
gardens, well designed markets & boulevards were planned in the overall setting of
which they formed a part. The city of Mysore has reasonably good urban infrastruc-
ture and a relatively clean and green environment. Furthermore, Mysore is less con-
gested and land value is comparatively cheaper. The city has several culture, heri-
tage and tourist attractions in and around Mysore; of which the Mysore Dasara6 being
the most prominent. The university and a range of other educational establishments
are added attractions for efficient and skilled manpower required for the growth of
local economic development.
6 Mysore Dasara is the state-festival of Karnataka which lasts for 10 days. According to a legend, Da-
sara denotes the victory of truth over evil and the day when the Goddess Chamundeshwari killed the
demon Mahishasura. Traditions of celebrating the Dasara festival are an elaborate affair & attract a
large audience including foreigners.

62
2 Changing Face of Mysore
The Government of Karnataka is promoting Mysore as an alternative destination for
Information Technology (IT) and Information Technology enabled Services (ITeS)
industries and developing it as a counter magnet to the city of Bangalore. Mysore has
become a new haven for the IT related services and is poised to play bigger role in
the economy of the city. The South Western railway has their headquarters in Mysore
and is one of the major employers in Mysore. Other factors that will change the face
of Mysore are: the doubling of the railway line, completion of the Bangalore-Mysore
Infrastructure Corridor project, operationalisation of a new airport and the up grada-
tion of the state highway to four lanes.
Mysore district has the largest concentration of industrial enterprises in the state after
Bangalore and has extensive areas under process of industrialization. There are five
existing industrial areas within Mysore and Nanjangud. These areas house varied
industries related to automobile, engineering, mechanical and knowledge based in-
dustries such as IT, ITeS and research centres. Mysore offers significant advantages
in financial impact towards cost of living and real estate prices. As per a market sur-
vey, Mysore is emerging as one of the top-ten cites for investment in the country.
However, today the need is to package and market it appropriately.
3 Project Brief
The Master Plan for Mysore Nanjangud Local Planning Area (LPA) covers an area of
509sq.km. The planning area includes two urban local bodies; Mysore City Corpora-
tion (128sq.km) and Nanjangud Town Municipal Council (11.6sq.km) along with 110
other villages. The last master plan was prepared in 1997 and is still in use today.
However due to rapid urbanisation it is outdated and paralysed by the lack of regula-
tions and policies within the existing development control regulations. An existing
plan under preparation is for 2021. High resolution satellite imagery was used for
preparation of maps.
Box 1: Statutory provision for the preparation of Master Plan in state of Karnataka, India
The Master Plan for Mysore is being prepared under the aegis of Karnataka Town & Country Planning
Act, 1961. Mysore Urban Development Authority is responsible for the preparation of Master Plan and
updating it at least every 10 years. The master plan preparation consists of a report explaining the
provisions of plan, regulations for land use zones and regulations for conservation of heritage pre-
cincts. The plan is finalised after a series of public consultations and approval from the government
4 Objectives of the Master Plan proposals To promote Mysore city as the destination for investment in nonpolluting
economic activities like IT, Bio-Technology and tourism related activities.
To promote and conserve the cultural heritage, preserve the natural
characteristics of the city and its environs through planned development.
To plan for an emerging metropolis with options for efficient public transport
system, good road network and access to state of the art urban infrastructure.

63
Suitable Planning measures to prevent the misuse of natural landscapes like
reserved forest, water bodies, natural valleys and hills.
5 Provision of Urban Infrastructure
For a city to function smoothly it is critical to evaluate the condition of its existing ser-
vice delivery capacities. Generally cities within Asia expand in an ad-hoc manner
primarily due to creation of job opportunities or an economically viable environment.
These cities grow but the urban local body do not have the service delivery spread to
its entire areas. This creates a serious threat to the citizens staying in such areas
without basic amenities thus decreasing their quality of life. Discussed below are se-
lected urban infrastructure services.
5.1 Water Supply Existing Situation
Mysore has a perennial source of water supply in the form of river Cauvery. There
are currently three operational water supply schemes using water from this river. The
first water supply system was commissioned in 1896 at Belagola which is down-
stream of the Krishnaraja Sagar dam on river Cauvery. The treated water is supplied
to various balancing reservoirs through a well defined network of various sized pipes
which the topography of Mysore supports. As of today 85 percentage of household
are covered within the water supply network and 80 percentage of households regis-
tered with Mysore City Corporation have water meters installed.
Challenges and Key Issues of existing Water Supply System
There is a lot of unaccounted for water loss due to unauthorised connections and
poorly functioning water meters. The O&M of the WTP and the water supply network
has not been sufficient primarily due to the lack of funds with MCC assigned for the
maintenance of the water supply system. Tapping the sources of unaccounted loss of
water is a mammoth but necessary task for the city. Today, there is a need for mod-
ernisation and up-gradation of network for the distribution of the water supply, provi-
sion of more over head tanks and other water distribution elements which are lack-
ing. There is no augmentation of resources today which has become a major concern
for the city‟s water supply system. The water loss is further magnified due to the use
of water stand posts within the slum areas. There is also a strong dependency on the
municipal finances for the maintenance of these systems. A proposal for privatisation
of water supply system has been initiated. However, as all things new, there is resis-
tance by some citizens, due to assumptions of higher water charges to be paid by the
users, control on illegal water usage, etc.
Mitigation through Master Plan Process
The master plan emphasis is on enhancement and provision of infrastructure ser-
vices like water supply, sewerage, storm water and solid waste management. Due
care has been taken to integrate these urban services within the process of prepara-
tion of master plan. The bulk water sources have been identified to mitigate the is-

64
sues of provision of water supply. Within the housing layouts the provision of piped
water supply has been provided. Mysore is one of the first cities in India which will
have 24x7 privatised water supply systems under the Jawaharlal Nehru National Ur-
ban Renewal Mission7 program to cater to the increased capacity of the utility ser-
vices. JUSCO (a private water utility company) has been given the contract for this
24x7 water supply system on performance based management for the next six years
on behalf of MCC. However with the privatisation; the water supply will eventually
result in restricting and minimising illegal connections, collection of water taxes and
regularisation of water to end users.
5.2 Sewerage Existing Situation
Mysore was one of the early cities in India to have an underground drainage system
dating back to 1904. There are three treatment plants which are functional covering
the entire city‟s operations with 57 percent of households connected to the under-
ground sewerage. The STPs have a capacity to treat the sewage greater than the
existing population but the total sewage going into the outfalls is less than 50% of the
sewage generated in the city. Hence the system is not being utilized to its fullest.
There is no maintenance of the sewerage lines as some of these are damaged and
need urgent repairs because of which the sewage is being dumped into the open
storm water drains along the roads. Also due to heavy maintenance costs the O&M
of this system is not carried out appropriately.
Challenges and key issues of existing Sewer System
There is a need to have new sewerage distribution system to cater to the needs of
the existing population along with 100 percent coverage. With the development of
new knowledge based industries and increase in the population the requirement for
the sewerage network is ever increasing along with a need to upgraded sewerage
network and install new pipelines. If this is not done than the issues of systematic
disposal of sewage is a concerned for the urban local bodies. Within the existing
housing layouts the piped sewerage network is constructed but there is a need for
trunk sewers to be laid within some areas of the city.
Mitigation through Master Plan Process
The master plan proposal addresses the issues of sewage by emphasizing on redis-
tribution and augmentation of the existing system. The proposals deal with the issues
of O&M of the network lines and repairing or replacing them with new ones wherever
required. The construction, rehabilitation and expansion of the underground drainage
7 The Government of India; recognising the challenge of an acute urban crisis initiated a process of
urban renewal through the launch of the Jawaharlal Nehru National Urban Renewal Mission. The aim
is to encourage reforms and fast track planned development of identified cities. Focus is to be on effi-
ciency in urban infrastructure and service delivery mechanisms, community participation & accounta-
bility of urban local bodies towards citizens.

65
system include the service connections to all households within the city area in the
first phase and later to be extended to outer areas.
5.3 Storm Water Drains Existing Situation
The storm water drains within the city of Mysore and its out growth follow well defined
valleys, which the city‟s topography supports. Within the Mysore city area the existing
roads have been provided with primary drains which are then connected to a network
of secondary drains. There are about twelve catchment areas within the city which
are responsible for the water runoff for these drains from where the water is collected
and discharged into river Cauvery through a series of tanks and canals.
Challenges of existing Storm Water Drains
The lack of inspection mechanism for monitoring the cleanliness of storm water
drains and silt deposition causes overflowing of drains which has become a major
issue. The topography of the city is such that the storm water drains into three tanks
viz., Kesare tank in north, Dalvai tank and Malalavadi tank in south. At present the
sewerage from areas without sewerage network is let into the storm water drains and
natural valleys. At many places encroachments have been made over these drains
disconnecting and blocking them. Initially the tanks were interlinked but as some of
these have been blocked; the overflow of one tank does not reach the others con-
nected to it.
Mitigation through Master Plan Process
The project includes remodeling of storm water drains, increasing the coverage of
storm water drainage network, delinking the sewerage system from the storm water
drainage system, completing the missing and blocked sewer links and desilting to
clean up the storm water drains.
5.4 Education Existing Situation
Mysore state was a pioneer in setting up of educational institutions and a fore runner
in providing quality education with one of the oldest universities in the state. Modern
education system was set up in 1833 with establishment of the free English schools
for masses. Various colleges and technical institutions were established followed by
the formation of the University of Mysore. Currently the city has five engineering col-
leges, medical institution comprising of medical studies, dental studies and Pharmacy
College. Most of these educational institutions are equally distributed so as to provide
access to education for the citizens of Mysore.
Challenges and Key issues of Existing Education System
As the Indian economy is growing at a rapid pace there is a need for skilled man-
power to support the continuous process of economic development. This need is ful-
filled through the promotion and imparting of quality education. To increase the en-

66
rollment rate, provision for better and more dedicated teachers along with setting of
better class infrastructure needs to be carried out within these institutions. There is
also requirement of funds for research and to create tie ups and interaction between
the industries and educational institutions.
Mitigation through Master Plan Process
Mysore as a city has the ingredients to develop itself as an educational hub of South
India. The necessary parcels of land for primary and high schools for each
neighbourhood have been provided. To promote the private sector participation;
higher education and research institutions are being provided with required land for
development of world class campuses and universities within the city of Mysore.
5.5 Traffic and Transport Existing Situation
Networks of national and state highway pass through Mysore connecting it to various
parts of the state and country. Mysore city has an airport facility under civil aviation
network of the country. The Mysore city railway station is a major junction providing
for transportation towards Bangalore, Mumbai and Chamrajnagar. The existing urban
road network can be grouped into a system of ring roads, include various radial roads
which emanate from Mysore towards other urban centers in the region. Large num-
bers of commercial vehicles catering to industries have now been made to use the
outer ring road which in turn has eased the traffic in inner city area and lowered the
pollution content. The parking areas within the city‟s commercial district and public
area is not sufficient and unable to cater to the growing number of vehicles in the city.
There are on-street parking facilities within some of the commercial areas. Mysore
has a city bus transportation facility, managed by state transport corporation connect-
ing many places in and around Mysore. Approximately 0.18 million passengers travel
by buses that make around 4,384 trips per day.
Challenges and Key issues of existing Traffic and Transport
Some of the important roads within the city that are major traffic generators have non
uniform widths and need to be widened to ease the traffic movement. Some of the
roads passing through the newly developed housing layouts have not yet been fin-
ished and these missing links need to be completed. There is an additional need for
parking within the CBD areas which is already congested due to heavy traffic along
with off-street parking facility. However, the existing ring road has not been com-
pleted and a link is still missing which needs to be constructed.
Mitigation through Master Plan Process
It is proposed to have a peripheral road of 45m width and is suitably aligned in the
outskirts of the planning area along some of the existing rural road network. The im-
portant regional roads and the village roads are proposed to be widened to either
24m or 18m. Suitable deviations of the existing roads are worked out to develop by-
pass links treating the rural habitats as urban villages in the plan period. The pro-

67
posed major road network outside the existing built up area have been worked out,
taking into consideration the various private housing schemes developed by the au-
thority and private sector. Multi level car parking has been proposed at various
places. These include the up-gradation of existing parking facilities and the proposals
for new parcels of land. The master plan proposes new widths for the buildings lines
which will enable to have clear building lines along the given stretches of the roads
through the provisions made within the land use and zoning regulations.
Existing Circulation Pattern Proposed Circulation Pattern
6 Housing Existing Situation
The existing housing scenario in Mysore is being governed by many factors one of
which is the high cost of land due to increase in demand for housing. The general
trend is to construct one‟s own house within the layouts formed by the planning au-
thority or by private developers. These plots within each housing layouts vary in size
with larger one‟s measuring 80mx100m to smaller one‟s going at 20mx40m. The in-
dividual houses are designed by the owners and the building permission and house
plans are to be authorized by the local body as per the development control regula-
tions. The housing layouts at large do not address the needs of the people within the
middle and lower income groups. There has been no survey either by the housing
board within the state or the authority for the housing demand and land requirements.
This will highlight a real picture of the housing needs and will be easy to release the
land for residential areas as required. Today due to the rapid economic growth there
is a lot of speculation about increased housing demand. But the existing studies sug-
gest that there are housing layouts with serviced lands which have not yet being oc-
cupied fully. Mysore is also one of the few cities in India that do not have a large slum
dwelling population.
Challenges and Key Issues in Housing
There is a need to address the key issue of affordable housing for the masses and
provision of housing for the economically weaker section. Mysore under the JnNURM
project is trying to be “slum free city”. To ensure this there is an urgent need of af-

68
fordable mass housing for various sections of the society. The biggest issue that then
arises is the provision of land within the city where there is serviced land available for
such development. If these houses are provided in far off places then the issues of
urban infrastructure and transportation will be consistent; increasing the cost of travel
and non availability of basic necessities. There have also been issues with the
change of land uses from industrial to residential. These changes affect the existing
infrastructure provision and reduce the efficiency of the existing system. There is a
growing trend in more construction of apartment buildings. Thus instead of a single
family house it is now converted into a multi-family housing.
Mitigation through Master Plan Process
As the city has developed over the past 150 years Mysore comprises of a diversity of
housing styles and residential environments. Consideration for housing issues within
the master plan incorporates urban growth, urban consolidation, neighborhood char-
acter and opportunities to facilitate new development within the existing urban fabric.
There has been focus on housing needs of the lower and the increasing middle in-
come group. The consumer preference of housing has shifted from plotted land de-
velopment to residential apartments. There are provisions for residential apartments
as part of the mixed zone development. Residential land market is very active and
the cost of land has increased fivefold. There is also provision for housing within the
existing infill areas. The new plan has a major focus on creation of neighbourhood
development through area plans focusing on providing serviced land to housing lay-
outs and its surroundings. Due care has been taken to have neighbourhood centres
at major junctions within the conurbation area.
Existing Residential areas (grey shows Proposed Residential areas the unoccupied serviced housing layouts)
7 Landuse Proposals Challenges and Key issues in Landuse
The previous master plan comprised of regulations that did not support the proposed
plan fully. The proposed land use in the existing plan was only for an area of 164
sq.km. The land use zoning was based entirely on the assumptions and estimates of

69
population for the plan period and there was no mention of compact development
and provision of integrated urban infrastructure.
In absence of the land use plan, for outgrowth areas; there was ad-hoc release of
land. The main factor for this type of development was due to the release of land by
state revenue department8 for residential and commercial uses. Hence no master
plan proposals are followed, since they are not backed by implementation of stringent
rules and provisions within the development control regulations. Due to this there
was stress on the urban development authority to extend the existing provision of
urban infrastructure facilities and hence huge capital investments.
Mitigation through Landuse Proposals
1. The old master plan of 1997 had 30 planning districts (micro level plans) while the
master plan proposals for 2021 have made provision for reorganizing some plan-
ning district and creation 45 planning districts.
2. As Mysore is a tourist destination the demand for tourism related activities are
bound to grow. Therefore the tourism related activities like international conven-
tion centers, exhibition grounds & hotels are proposed near the airport. In order to
accommodate various demands, land has been released for activities like golf
course, crafts village and theme parks; generating employment opportunities and
promotion of economic development.
3. No new area has been proposed for industrial use, as the authority has already
acquired land within Mysore urban and peri-urban areas. It is seen that some in-
dustrial plots are still vacant and future demand for industries could be met. The
plan also envisages retaining the defunct industrial land for the future.
4. For compact development and optimum utilization of land, no additional land is
required for residential purposes. The existing vacant lands, and permissions
given for change of land use, for residential use in urban areas, will take care of
these requirements even beyond the planning period of 2021. This shall easy the
O&M of infrastructure and lower the costs of provision of services to the authority.
5. From the point of view of spatial distribution of amenities, services and public util-
ity, land has been allocated for health facilities; play grounds, sports ground, fire
station, truck terminals and bus depots.
6. The radial corridors and main arteries linking the city outside the existing built up
area have been identified as Mutation Corridor Zones, for which, separate regula-
tions are framed in Development Control Regulations.
8 In India the land is released for non agricultural purpose by the State Revenue Department. The
Urban Development Authority who is preparing the master plan does not have any control for release
of these lands. There is no coordination within the two government departments during the process of
granting permission for the conversion of this land use. Hence release of urbanisable land is indepen-
dent of the process of master plan.

70
Existing Landuse Plan (2010) Proposed Landuse Plan (2021)
8 Development Control Regulations (DCR) Key Issues with Development Control Regulations
There were no regulations for heritage precincts, building line controls or proposed
road widths. The regulations for parking, physically handicapped persons, residential
and non residential development, fire protection and natural disaster mitigation were
missing within the previous DCR. There was a serious need to redefine the land use
zoning and incorporate various provisions within the existing DCR.
Box 2: Development Control Regulations
DCR is a tool for guiding and promoting development in an area in order to improve the quality of life of its citi-
zens. Development regulations include land use zoning for master plans, regulations regarding land use, usage of
buildings, plot coverage, Floor Area Ratio, setbacks, open spaces, height, number of storey, parking require-
ments, etc; for various developments on land, and for various categories of buildings.
Mitigation through Development Control Regulations
A new set of Development Control Regulations were proposed. DCR was tailored to
meet the needs keeping in mind the character and essence of Mysore.
1. The DCRs deal with the intensively, moderately and sparsely developed areas
separately and have complete separate sets of regulations for each.
2. Special Development Control Regulations have been drafted for the protection of
ancient monuments, heritage precincts and areas of heritage importance. The
regulation areas have been defined around each such identified monument, heri-
tage building and defined urban area.
3. There is a clearly defined set of provisions for various land use zones for set-
backs, road widths, floor area ratio, ground coverage, building lines for important
and through roads and parking regulations.
4. There have been very clear provisions made in case of changes of land uses
which are permissible and the land uses for which they are permissible.

71
5. Regulations for parking, physically handicapped persons, residential and non
residential development, fire protection, provisions of signages and safety meas-
ures against natural disaster are all clearly defined.
6. The DCRs have been drafted so as to have these transparent and that it should
promote development and be user centric. This will encourage people to comply
with the planning regulations laid within the premise of the master plan document
which will help use of land optimally thus ensuring maximum resource allocation.
9 Highlights of the Master Plan Proposals
Preparation of Master plan for a city is a long drawn exercise. City planning has
economic, social and physical dimensions. The master plan proposal for Mysore
takes into consideration the aspects of physical and economic development for the
future land uses. The city is to be developed in physical terms through the allocation
and organsiation of the land uses through proposals on a macro and micro level
planning. These proposals take into consideration the strengthening of the economic
base for sustainable development and make people happy through the social ap-
proach. The plan also proposes the compact development in the interest of optimum
utilization of urban infrastructure. The challenge today is with the horizontal expan-
sion and urban sprawl. The master plan also focuses on controlling the existing
change of land uses by the government outside the developed area to minimize the
housing speculation and control the land prices. Finally the need to maintain the cul-
ture and heritage of Mysore city is being addressed within this master plan in a holis-
tic way. The development control regulations and land use zoning regulations are
prepared to control development while have development promotion within new ar-
eas to make it an attractive business destination.
References Draft Report - Master Plan for Mysore Nanjangud Local Planning Area
Report on Data Collection, Analysis and Projections - Master Plan for Mysore Nanjangud
Local Planning Area
T. P. Issar, Mysore: The Royal City, UNESCO - Karnataka Archives, 1970

72
Ways of Infrastructure Redevelopment in Cyclone Nargis Hit Area, Myanmar
Than Than Thwe Urban and Regional Planning Division Department of Human Settlement and Housing Development 228-234 Bogyoke Aung San Street Botataung Township Post Office, Yangon Myanmar [email protected] Abstract: This paper is about the ways of infrastructure redevelopment in Cyclone Nargis hit area. Key Words: Infrastructure Redevelopment
1 Impacts of Cyclone Nargis Hit Area
Cyclone Nargis badly hit Myanmar delta area, Ayeyarwady division and Yangon divi-
sion, at unprecedented scale on 2-3 May in 2008. The estimated death was more
than 130, 000 people, number of affected persons were as high as 2.4 million and
estimated losses were US$ 4 billion. It was totally destroyed by 450,000 units of
houses, water sources, embankments, their main livelihoods, communication and
social amenities. The consequences of impacts such as health problems (trauma and
injury, fever, diarrhea, respiratory, etc.,) suspension of education, unemployment
generation, market disruption and environmental degradation problems became
emerged. The impacts of flood assessment detailed areas are shown on Map (1). Map 1: Flood Assessment for Cyclone Nargis Affected Area
Source: UNOSAT, satellite solutions for all

73
1.1 Post-Nargis Joint Assessment (PONJIA)
In the aftermath of the cyclone, United Nations (UN), the Association of South East
Asian Nations (ASEAN) and the Myanmar Government set up to coordinate the Tri-
partite Core Group (TCG) for relief efforts. Post Nargis Joint Assessment (PONJA)
was conducted to determine the full scale of the impacts of the cyclone and require-
ments for immediate, short and long term recovery.
1.2 Emergency Response, Recovery and Rehabilitation Committee
ASEAN, the Government of Myanmar, the United Nations, the local and international
NGO community, small community-based organizations and thousands of civic-
minded individuals made intense efforts to provide for the relief and recovery needs
of the affected population. The Government‟s disaster-related policy and decision
making authority which called National Natural Disaster Preparedness Central Com-
mittee issued “the Program for Reconstruction of Cyclone Nargis Affected Areas and
Implementation Plans for Preparedness and Protection from Future Natural Disas-
ters” on 15th August 2008. The program includes three phases: the completion of
emergency and relief measures; recovery, reconstruction and development meas-
ures and the measures for long term preparedness and protection from natural disas-
ters. Under the National Natural Disaster Preparedness Central Committee and
working committee, the government has also urgently formed response actions for 10
sub-committees; news and information, assessment and emergency relief, security,
confirmation of loss and damage, transportation and route clearance, natural disaster
reduction and emergency shelter provision, emergency communication, search and
rescue, health care and towns/villages rehabilitation and reconstruction.
2 Regional Redevelopment Action Plans
The main issues to be considered as regional redevelopment action plan takes into
account the economic based development for productive lives, community based
development for healthy and upgrading lives and environmental based quality devel-
opment for their protected lives.
2.1 Economic Based Development for Productive Lives
Livelihoods in the delta are mainly paddy rice cultivation, fishing and processing, live-
stock raising, horticulture (mostly fruit trees), small and medium scale of agro based
industries and small scale forestry activities (firewood, charcoal and timber) and salt
production. This is a fact of life for the 50% of the households work in agriculture,
20% of population who derived their main income from fishing and remaining 30% of
landless labors which called causal labors. After the storm surge about 63% of paddy
land (783,000 ha) was salinization, 85% of improper operating rice mills, 75% of fish-
ing gear losses and 50% of live stocks damage were key issues to be redeveloped.
Myanmar Government, the large companies of Myanmar and international commu-
nity are re-establishing the livelihoods of farming communities and demand for causal
agricultural labor by restoring and improving (such as technical transfer, equipments,

74
seeds and fertilizers are subsidized as quantitatively and qualitatively) sustainable
cropping on the basis of environment. These redevelopments reach in certain limits.
Both government and NGOs have strengthened livelihoods opportunities through
improved access to credit and provided micro finance loans to 120,000 households.
The activities included to restore the fisheries and aquaculture sectors, the expanded
provision of safer and improved boats, fishing gear and adapted credit system for the
needs of fishermen. Beneficiaries would be small and medium inland and shore fish-
ers, including household-based aquaculture however there was limited scale for lar-
ger scale fishers. Moreover, the rehabilitation of ice plants, cold storage facilities and
processing equipment will definitely increased labors for processing and marketing.
Mangroves play an essential role for using as roofing materials for houses and char-
coal production on the other hand these are mainly in coastal area protection for wind
break and flood retards. The delta area was suffered major impacts of Cyclone
Nargis due to the human activities; harvesting of timber for firewood and charcoal for
home consumption as well as income generation. Therefore, the areas have re-
plantation program and conservation programs started in the coastal zone manage-
ment program. (See article 2.3)
2.2 Community Based Development for Healthy and Upgrading Lives 2.2.1 New Regional Networks
The delta region is mostly rely on the water way. The Ministry of Construction has
started to rebuild damage or destroyed roads, bridges and to implement 10 new re-
gional road network projects to connect from the frontier regions to the inland areas
as a strong and safe regional network, as well as supporting routes for relief and re-
covery projects and easy flow for goods commodities (Map-2). These main networks
are started to develop as only 2 lanes and inside the townships as the safety bunds. Map 2: New Regional Road Networks in Ayeyarwady Division
Source: Road Department, Ministry of Construction
2.2.2 Resettlement Planning and Housing Sector
The National Natural Disaster Preparedness Central Committee has planned for the
new settlements in order to minimize the disaster risk for the future. For the reloca-

75
tion of survivors the necessary support to either return to their native villages or to
integrate fully at their new location. The relocation of new settlements plan were
taken into account by scenarios considered as to meet the needs of the development
and achieve the balance of social economic and physical infrastructure, to promote
cost effective provision for infrastructure services and to provide the concept of sus-
tainable development. New settlements areas are planned for long term sustainable
development; these are located on elevated land, near the regional road network,
favorable conditions for finding their livelihoods and the availability of water sources.
For instance, Labutta three miles new town, Ywa Thit village, Oat Twim village and
Aung Khaing village were planned from the Department of Human Settlement and
Housing Development.
Based on the data from the UN Habitat, 59,618 houses were newly constructed,
30,217 houses were repaired, 79,502 houses were provided by materials and
granted by cash, therefore totally 169,337 houses were developed. Towns/Villages
Rehabilitation and Reconstruction Committee have constructed 10,117 houses. In
addition, it is planned to construct 38,000 houses and to repair 268,000 houses in
2010-2011. Therefore, currently about 55% of shelter sector was recovered in the
affected areas. The provision of safer housings minimum floor area is from 160
square feet to 200 square feet and which can be expandable to 320 square feet. The
rehabilitation and reconstruction of household shelters are safer and durable which
incorporation of Disaster Risk Reduction construction techniques. Rebuilding effort
was carried out by villages themselves to get the advantages of knowledge and good
skill of safe construction methods. However, some buildings are main of a temporary
nature and have not been able integrate with Disaster Risk Reduction techniques. New Shelters in Ayeyarwady Division
2.2.3 Redevelopment of Social and Physical Infrastructure
The provisions of sufficient basic social infrastructure within the affected areas such
as schools, hospitals, primary health care centers are rebuilt some are expanded and
upgraded. The core objective is to ensure restoration and appropriately enhanced
provision of access to quality basic primary health care services, availability and the
use of services by the affected population. According to the requirements, 16 bedded
hospitals are provided the settlement which has more than 20,000 inhabitants and
primary health care centers are mostly facilitated for 10,000 inhabitants. The Gov-
ernment plans to upgrade and expand a number of hospitals: Labutta General Hospi-

76
tal from 25 bedded to 200 bedded, Pyapon General Hospital from 50 bedded to 100
bedded, Bogale General Hospital from 50 bedded to 100 bedded and Mawlamyine
Kyun General Hospital from 50 bedded to 100 bedded. In addition, 16 bedded hospi-
tals have been implemented in five townships within the areas.
Regarding the education sector, Cyclone Nargis destroyed 1,736 schools (a total of
29 high schools, 67 middle schools and 1,640 primary schools) in the Ayeyarwady
Division. Close collaboration between the Ministry of Education and international or-
ganizations have implemented rebuilding of schools and improving the quality of
learning environment. The Government plans to make them storm resistant as ap-
propriate and necessary, depending on the specific conditions prevailed in each vil-
lage. An extensive education program, 610 schools are repaired and upgraded,
1,175 schools are newly constructed in Ayeyarwady Division.
Newly Constructed Schools in Ayeyarwady Division
2.2.4 Access to Safe Drinking Water
The main source of water for rural communities in the delta is rainwater and surface
water. There were more than 5,000 ponds in the affected villages. According to the
PONJA report more than 2,000 ponds were damaged. The Government is carrying
out extensive program of rehabilitating village ponds, lakes and wells normally used
by villagers as a source of drinking water and which were flooded with sea water dur-
ing the storm. In the six month period following the cyclone, ponds and hand-dug
wells have been cleaned in 2,000 villages, aiming to restore at least one pond and
well per village. Continuously, existing water sources were improved and protected of
water ponds programs in each township. The Government and UNDP (United Na-
tions Development Program) plan to introduce new well digging program and more
effective water purification systems through out the affected region to have access to
adequate safe water.
2.2.5 Sanitation and Hygiene
Most of the households were practicing unsanitary defecation almost 40 percent in
the immediate aftermath of the cyclone, creating additional risks of communicable
disease. The provision of latrine sets is extended to households. Sanitation has been
improved by supporting local authorities and communities in tackling the problem of
solid waste and drainage disposal. To promote greater coordination, efficiency and
transparency in relation to the implementation of public health related sectoral activi-
77
ties including health, water, sanitation, hygiene (WASH) and nutrition, consideration
should be given to the setting up of Public Health Organization and Review Board for
functioning, approval of health plans and major decisions on the allocation and real
relocation of funds based on the program performance.
The WASH implementation needed to draw on all the capacities available in INGOs,
LNGOs and UN system well coordinated with on going government program. WASH
activities incorporated monitoring and evaluation mechanism through the relevant
Township Community Committee.
2.3 Environmental Based Quality Development for Protected Lives
There will be no protective lives environmental development and awareness exists in
the community. As a result of increasing vulnerability areas in delta which caused to
natural disasters and suffered many losses of human lives, livelihoods, damage of
natural resources and demolish of infrastructure. Therefore, communities should be
at the center of restoring and preserving their environment practices (biodiversity,
land use) and sound natural resource base (water, forest) for protective lives.
Regenerating natural mangrove forests and mangrove plantations along river banks
and around villages, as well as replanting village woodlots will both contribute to live-
lihoods and reduce future disaster risks. Village organizations are main partners for
implementing projects that promote sustainable natural resource management prac-
tice and environmental management (Pilot Projects, training awareness e.g. Com-
munity Forestry and Coastal Zone Management). While such a community based
approach to mangrove rehabilitation (encourage people‟s participation in planting
activities) implement 5 years plan to restore more than 12,592 ha of damaged man-
grove, comprising 2,023 ha of gap planting, 8,555 ha for natural regeneration and
2,013 ha of plantation establishment. International Tropical Timber Organization, Ja-
pan International Cooperation Agency (JICA) and FREDA also support for the reha-
bilitation and replanting community-owned in the delta also combined with sustain-
able exploitation of inshore and inland fisheries.
2.3.1 Provision of Cyclone Shelters
Cyclone shelters or storm shelters are critical components of a comprehensive DRR
strategy and can save many lives in the event of the disaster. These shelters are not
only protecting against high winds but also against suddenly rising water. The Gov-
ernment, International Organizations, INGOs, LNGOs and local donors have imple-
mented cyclone shelters for different number of population sizes designed by the
Public Works, Ministry of Construction and the Ministry of Science and Technology
and provided technical assistants from Myanmar Engineering Society. In the year of
2010, 66 cyclone shelters are constructed completely and 110 cyclone shelters are
under construction and 9 are proposed for the construction. Cyclone shelters can
include designated as public building (schools, health centers, monasteries and other
multi purposes buildings).

78
Cyclone shelters in Ayeyarwady Division
2.3.1 Disaster Risk Reduction (DRR)
Disaster impact is greater in countries where prevention, preparedness, mitigation
and response capacities are inadequate. Disaster Risk must focus not only imple-
mented on preparedness and response, but also on prevention and mitigation and
this includes issues of community awareness, early warning systems (from national
level to community level) and capacity to manage disaster risks (for the inclusion of
DRR in public education).
Asian Disaster Preparedness Centre (ADPC) supports for Myanmar Action Plan for
Disaster Risk Reduction (MAPDRR) program for future disaster risk reduction pro-
jects (2009-2015). The objectives of MAPDRR are as follows: - To build a more resilient and safer community through conceptualization, devel-
opment and implementation of appropriate disaster risk reduction programs; - To provide a framework for implementing Myanmar‟s DRR commitments at the
global and regional levels, under Hyogo Framework for Action (HFA) and ASEAN Agreement on Disaster Management and Emergency Response (AADMER)
- To provide a mechanism where the disaster risk reduction initiatives of all Gov-ernment Ministries and Departments, supported by UN organizations and other stakeholders, can be coordinated and monitored;
- To provide a conducive environment for mainstreaming DRR into development plans, and programs at National, State, Division, Township and Village Tract lev-els; and
- To support mutually beneficial partnerships between the Myanmar Government and their development cooperation partners in DRR programs.
The MAPDRR has seven components each component has 4 to 13 sub-
components/projects and total number of 64 priority projects have been identified.
The followings are seven themes of MAPDRR components: - Policy, institutional arrangements and further institutional development - Hazard, vulnerability and risk assessments - Multi hazard early warning system - Preparedness and response program at National/ States/ Divisions and Township
Level - Mainstreaming of DRR into development and mitigation - Community base disaster preparedness and risk reduction and - Public awareness education and training.
For the MAPDRR task force partners includes, 17 departments from 12 ministries, in
association with local and international NGOs, UNDP and UNOCHA (United Nations
Office for Coordination of Humanitarian Affairs) and professional associations,

79
academic institutions, Myanmar Red Cross and ASEAN which are a driving number
of disaster risk management activities in the affected areas.
Therefore, it needs disaster network which allows and encourages promoting effec-
tive coordination and communication as well developing knowledge management
with its all stakeholders in Myanmar. DRR institutions are working as the central gov-
ernment coordination body as is the National Natural Disaster Preparedness Central
Committee and regional administrative level as States and Divisions level.
3 Assessment of Vulnerability and Improvements of Disaster Risk Management System in the Affected Regions
The Department of Human Settlement and Housing Development has evaluated the
redevelopments of the most affected area of Bogalay, Labutta and Phyar Pon town-
ships, in order to assess for the hierarchy of risks taking into account 12 main ele-
ments with three dimensional aspects; physical, economic and social. There are
specified by 5 ranks and from rank 1 to rank 5 goes more critical stage of the settle-
ment. Regarding to assess, between the rank 2 and 3 express as the relative safety
stage for the settlement therefore the assessment takes the average rank as 2.5 and
for 12 ranking items. Evaluation of the result of the assessment can be defined as
three categories of risks: high (total rank>30), medium (total rank range 25 to 30) and
low (total rank <25) risk areas. The following table shows the relation of main ele-
ments and the ranking system of settlement assessment.

80
Table 1: Vulnerability Assessment of Settlement Main Ele-ments
Rank 1 Rank2 Rank 3 Rank 4
Rank 5
Population size
<1000 1000-2500 2500-5000 5000-10000 >10000
Location of settlement
dispersed along the highway
along the safety bunds
along the vil-lage road
along the river
Mode of transport
by bike by cycle by cart on foot by water way
Walking time to cyclone shelter
10 min
20 min
30 min
45 min
>1hour
Topography elevated land
flat land -low lying land -mouth of river - frontier to sea water
Type of hous-ing
-brick Nog-gin
-wood (good) -wood (poor) -Hut (good) -Hut (poor)
Information dissemination
internet access
-TV/radio announce-ment
communication centre
instrumentation method
difficult to have informa-tion
Infrastructure services
80% can be protected
60% can be protected
40% can be protected
20% can be protected
can be de-stroyed
Main Liveli-hood
80% can be protected
60% can be protected
40% can be protected
20% can be protected
can be de-stroyed
Natural Envi-ronment
80% can be protected
60% can be protected
40% can be protected
20% can be protected
can be de-stroyed
Education Awareness
Well trained Good re-sponse
Understanding Weak response No response
Natural Pro-tection
80% can be protected
60% can be protected
40% can be protected
20% can be protected
can be de-stroyed
The vulnerable assessment result indicates the hierarchy level of vulnerable risk in
each township. The summary also provides a snapshot of system condition as a
baseline for future improvements in local level and comprehensive for regional in-
vestment strategy. However, the risk level can be changed depending on the pro-
gressive developments occurring in corresponding areas.
To improve the Disaster Risk Management System, the items of settlements mitiga-
tion measures, preparedness planning, advocacy issues and next steps of task force
must be identified by the related disaster impacts. Table (2) shows the improvement
of Disaster Risk Management System for the affected areas.

81
Table 2: Improvement of Disaster Risk Management System
Impacts Mitigation Measures
Preparedness Planning
Advocacy Issues Next Steps
Losses of human lives,
-relocation of safer settlement and housing -minimum evacuation route to cyclone shelter -awareness of cyclone warning system
-develop early warning system -mangrove planta-tion for protection
-demonstration for cyclone safety (the Department of Relief and Resettlement) - store food for after cyclone - movement for old people, disable and children (emergency team)
-need to construct more safety infrastructure cyclone shelter, safety bunds
Damages of Infrastructure Roads
-Permanent road network from fron-tier region to inland region
-sub-base of the road for long term use -more alignments for frontier to inland access
-check road specifica-tion under construction and regular mainte-nance (Ministry of Con-struction)
-Study for future alignment
Losses of houses
-construct DRR techniques of houses - plantation for wind break
-on job DRR con-struction training for long term
-maintenance work for safety (involvement of communities)
- upgrade types of housing and cyclone resistance housing
Crop losses
-strengthen river banks, improve irrigation canals, install better water management sys-tem
- supervise and monitor weak points for river banks, preposition sand bags and tools coordinate and share information with other NGOs and communities
- common temporary safety storage for agri-culture products (ware-house) encourage community participation
- better and more detailed assessments needed of canals and rivers in order to prepare projects for funding
Fishing facili-ties losses
-weather forecast from radio/TV/ other access -inform departure/ arrival at local port
-permission of traveling by cyclone weather announcement
-identification of safety location for fisher men by local authorities
-education for water way safety
Disease out-break
- raise awareness of sanitation issues and environmental hygiene
- monitor health statistics and preposition hand tools
- encourage the involvement of NGOs - emergency medical treatment team
- more assessments and provision of hand tools
Losses of water re-sources
-water storage tanks for drinking water
-regular mainte-nance -training for cyclone awareness
-store rain water as emergency by communities
- establish new water sources
Schools/ Hospitals
-safety location -safety structure
-use more durable materials
-regular maintenance for safety communities by the concerned De-partments
-upgrade and ex-pand the facilities
Environmental degradation
-reduce human activities of forest and mangrove -substitute roofing material of housing and charcoal use
-re-plantation and raise forest and mangrove
-Coastal zone man-agement by the dept of forest
-Conservation for forest and man-grove
82
4 Conclusions
According to the vulnerability assessments, infrastructure redevelopment are still
needed to fulfill in the high risk settlements areas as the first priority and continuous
process of development should be implemented in the medium risk areas. In Nargis
affected areas, the main environment development outcomes will be more engaged
in Disaster Risk Reduction measures, understanding of early warning system, mitiga-
tion measures in vulnerable areas, disaster mitigation is better integrated into current
recovery and reconstruction efforts, national and local institutions developments im-
proved preparedness and mitigation policies and response mechanisms due to the
economic base, community base and environmental base of continuous infrastruc-
ture redevelopment activities.
Therefore, Disaster Risk Reduction will be covered a wide range of intervention un-
dertaken before, during and after a disaster to prevent or minimize loss of life and
property, minimize human suffering and hasten recovery in future.
References Myanmar Engineering Society, UN-Habitat, UNDP, Guidelines on Retrofitting of Rural
Houses in Myanmar
Ministry of Social Welfare, Relief and Resettlement, Relief and Resettlement Department,
Myanmar Action Plan on Disaster Risk Reduction (MAPDRR), 2009-2015
Tripartite Core Group, Post Nargis Joint Assessment, July 2008
Tripartite Core Group, Post Nargis Social Impacts Monitoring, December 2009
Tripartite Core Group, Post Nargis Periodic Review I, January 2010
Tripartite Core Group, Post Nargis Periodic Review II, January 2010
Tripartite Core Group, Post Nargis Periodic Review III, January 2010
Tripartite Core Group, Post Nargis Recovery and Preparedness Plan, December 2008
UNEP, Learning from Cyclone Nargis – A Case Study, Investing in the environment for Live-
lihoods and Disaster Risk Reduction

83
Numerical Modelling as A Key Tool in the Decision-Making Process for Water Resources Management
Oscar Herrera Granados Institute of Geotechnics and Hydro-engineering Wrocław University of Technology Wybrzeże Wyspiańskiego 27 50370 Wrocław Poland [email protected] Abstract: Once our ancestors decided to settle close to rivers, natural streams, oceans and lakes; these water bodies have been playing a crucial role in the activi-ties of human-societies. Since life depends on this vital liquid, to manage the water resources properly and in a sustainable way is transcendental for finding the harmo-ny between the water resources and the man-made constructions. In order to reach this aim; the people involved in the decision-making process for water resources management have to be supported not only by well-done directives or guidelines; but also by experts in the field of hydro-engineering.
Nowadays, the water specialists use numerical models to understand better the natu-ral phenomena that involve water dynamics. Thanks to the rapid evolution of the computer facilities; numerical modelling is becoming a rapid, efficient and “cheap” solution to predict the hazards provoked by water flow and to manage our water re-sources. The present paper takes a glance on how numerical modelling can help the hydro-engineers not only in predicting water flow, but also to analyze the interaction between water and the man-made infrastructure. Once a numerical model is set-up; the water specialist can modify it relatively easy in order to forecast different scena-rios and consequently to facilitate the work of decision-makers to choose the most convenient option from the technical point of view. Key Words: Computer Facilities, Water Dynamics, Global And/Or Project Scale.
1 Introduction
Several of the most relevant civilizations of our history decided to settle along rivers,
close to water bodies or not far away from the coastal shoreline. Once they decided
to build their villages, towns or cities; water became an element that not only have
been enhancing the beauty of the landscape, but also it became a “witness” of the
culture, customs and history of these civilizations [4]. It is possible to mention some
examples if we remember the settlements close to the Nile in Egypt, the Rhine, the
Elbe, the Thames or the Danube in Europe without forgetting the Vistula or the Odra
in Poland. Looking outside the Euro-Afro-Asian continent; the ancient Mexicans mi-
grated from the Pacific coast, (where the mythical Aztlán was supposed to be lo-
cated) to the central plateau of the country founding the Great Tenochtitlan (nowa-
days Mexico City) in the middle of a lake following the order of their God
Huitzilopochtli. Therefore, our ancestors modified the water bodies without thinking
about the consequences that these changes could provoke (in those times, there

84
were not water specialists, who could advise them about the consequences of their
decisions). The majority of the negative effects that arose after modifying the natural
water conditions are because the water is constantly in motion; e.g. the changes in
the water table still represents a problem for maintaining the floor level in the centre
of Mexico City. Nevertheless, it is a matter of fact that centuries ago the decision-
making process was completely different than in the actuality. But not everything is
fault of these historical decisions, water motion is as well the reason of many ecolog-
ical problems that are not related to any human influence, on the contrary, human
interference had mitigated the hazards that water brings with [4].
In water resources management; numerical models are actually applied to a wide
range of problems in hydrology, flood flow, groundwater flow and recently in sedi-
ment transport. The present paper highlights the importance of considering numerical
modelling as a tool that facilitates the decision-making process for water resources
management. The use of models as decision making tools often has greater value in
sensitivity analysis and in building and analyzing different scenarios [5]. Let‟s not for-
get that all models consider plenty of assumptions that in real life can not be neg-
lected. Nevertheless, these assumptions facilitate the performance of these approxi-
mations. The advantage of numerical modelling is that, once the model is set up and
established, a range of scenarios can be built and analyzed with relatively little effort.
Nevertheless, numerical models should be viewed with caution because not under-
standing them becomes a „black box‟ which may promote errors of judgment in their
application. Hence, before choosing a model, its applicability to a specific problem
must be questioned in depth.
The aim of this paper is to introduce “hydraulic modelling” to the infrastructure plan-
ner and to express the author‟s point of view on choosing the most appropriate model
to facilitate the decision-making process depending on the problem‟s characteristics,
on its complexity as well as on the hydrodynamic conditions that characterize the
involved water resources.
2 Flow modelling
Nowadays; the scientists are able to analyze the natural phenomena thanks to the
usage of models; namely physical or/and numerical. This section presents briefly the
general description of both kinds of models as tools that are used by water special-
ists to analyze hydro-engineering problems, such as flood protection, irrigation,
sediment transport or water quality. In order to make these descriptions clearer, two
examples concerning flood risk are mentioned. The first example illustrates the us-
age of physical modelling (a sluice in the Odra river in Poland) in order to perform a
flood risk assessment; and the second shows a flood forecasting system of a tropical
river system in Mexico [2] built with 1-dimensional numerical modelling.

85
2.1 Physical modelling
Physical modelling allows the water specialists to visualize water dynamics in well-established scaled constructions at the laboratory. These models are a feasible and reliable choice to analyze the interaction between hydraulic structures (built or planned to be built) and the water bodies in case of normal and catastrophic scenar-ios, such as flood waves or dam failures.
Flood risk year by year threatens countries where intense rainfall (and not only) oc-curs in small periods of time and where human interference could play a positive role to mitigate the arising hazards. In the open-air hydraulic laboratory of the Wrocław University of Technology, some experimental works were carried out in order to test the functionality of the barrage and sluice “Bartoszowicki” for the regulation of the river Odra at the entrance of the city of Wrocław.
Fig. 1 Overview of the barrage and sluice “Bartoszowicki” in Wrocław (from google earth)
The figure 1 depicts an aerial view (taken from google earth) of those hydraulic struc-
tures. In case of flood wave events, the sluice is open in order to address most of the
Odra‟s river flow to the tributary Widawa (that works as a flood alleviation channel) in
order to flood the non-urbanized areas that surround the northern part of Wrocław.
Fig. 2 View of the barrage from its downstream side at the entrance of the city

86
Fig. 3 Physical model of the barrage and sluice at the Wrocław University of Technology
A physical model was built at the laboratory to reproduce catastrophic scenarios and to check the reliability of these structures. The figure 2 depicts the view of the bar-rage from its downstream side and the figure 3 shows how the physical model looked like. The laboratorial works demonstrated that for small and medium flood wave events; the sluice should work properly. Probe of this fact is that in May 2010 (see fig. 4), these structures were used to alleviate the flooding problems of the city and the consequences were not chaotic. The water in the city centre was pretty close to the river banks, but fortunately, the river only overflew in one neighbourhood (Ko-zanów) without regretting tragic damages.
Fig. 4 Flood wave downstream the barrage “Bartoszowicki” near the city center (May 2010)
The experienced engineers are convinced that complex hydraulic problems cannot
be solved analytically or by computer modelling and in some cases it is truth. Never-
theless, to carry out physical models adequately depends on the experience of the
work team and the instrumentation of the laboratory. But, is it possible to build physi-
cal models of entire river basins to forecasts long-lasting flood waves? or to create an
adequate physical model of the man-made world islands of Dubai? Or to analyze the
changes in regional morphodynamics of the Persian Gulf because of these islands?

87
2.2 Numerical modelling
Numerical modelling is the process of approximating the solution of equations that
describe physical processes using a step-wise approximation. In the early 1970‟s, the
majority of the present numerical algorithms were invented. Nevertheless in those
times, the computers were slow and not accessible to analyze hydro-engineering
problems. Therefore, water projects had been analyzed mainly by physical modelling.
This fact drastically changed because actually there are a large number of programs,
which are capable to model hydrodynamics. These models are categorized accord-
ing to their aim, number of dimensions or to the applied numerical methods. In this
section, another example concerning flood risk is presented to describe how numeri-
cal modelling can be applied to real-world cases.
Fig. 5 Road infrastructure and tributaries in the nearby area of the city of Tuxpan
The Tuxpan River as one of the 17 main rivers that flow into the Gulf of Mexico within the Mexican territory. The population who lives in this basin had experienced many flood events along the history; the last two took place in October 1999 and seven years later in October 2006 affecting mainly the major cities located within this basin: The City of Tuxpan and El Alamo. A flood forecastng system were done in order to predict the flood extension for a probability of 2% (T=50 years). This forecasting system consist in two models: one hydrologycal [6] and one hydraulic [2]. The figure 5 depicts the GIS data base of the forecasting system close to the largest city within the basin (Tuxpan), the tributaries and the major road infrastructure.
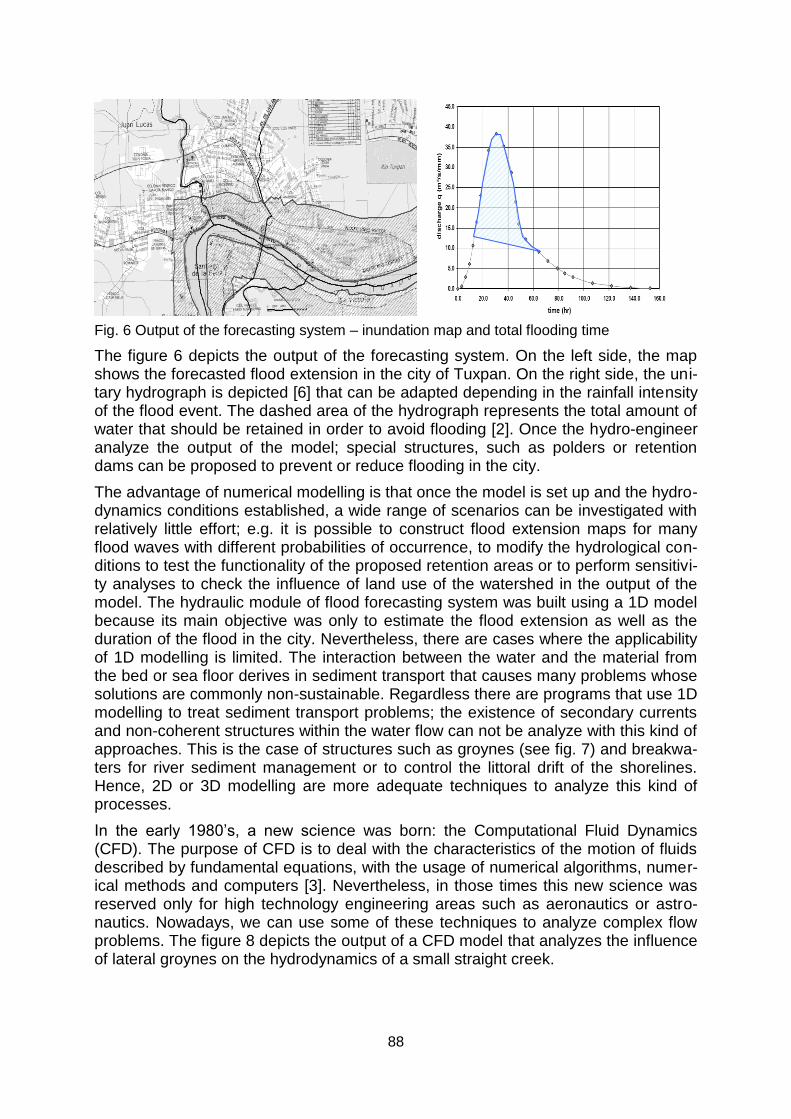
88
Fig. 6 Output of the forecasting system – inundation map and total flooding time
The figure 6 depicts the output of the forecasting system. On the left side, the map shows the forecasted flood extension in the city of Tuxpan. On the right side, the uni-tary hydrograph is depicted [6] that can be adapted depending in the rainfall intensity of the flood event. The dashed area of the hydrograph represents the total amount of water that should be retained in order to avoid flooding [2]. Once the hydro-engineer analyze the output of the model; special structures, such as polders or retention dams can be proposed to prevent or reduce flooding in the city.
The advantage of numerical modelling is that once the model is set up and the hydro-dynamics conditions established, a wide range of scenarios can be investigated with relatively little effort; e.g. it is possible to construct flood extension maps for many flood waves with different probabilities of occurrence, to modify the hydrological con-ditions to test the functionality of the proposed retention areas or to perform sensitivi-ty analyses to check the influence of land use of the watershed in the output of the model. The hydraulic module of flood forecasting system was built using a 1D model because its main objective was only to estimate the flood extension as well as the duration of the flood in the city. Nevertheless, there are cases where the applicability of 1D modelling is limited. The interaction between the water and the material from the bed or sea floor derives in sediment transport that causes many problems whose solutions are commonly non-sustainable. Regardless there are programs that use 1D modelling to treat sediment transport problems; the existence of secondary currents and non-coherent structures within the water flow can not be analyze with this kind of approaches. This is the case of structures such as groynes (see fig. 7) and breakwa-ters for river sediment management or to control the littoral drift of the shorelines. Hence, 2D or 3D modelling are more adequate techniques to analyze this kind of processes.
In the early 1980‟s, a new science was born: the Computational Fluid Dynamics (CFD). The purpose of CFD is to deal with the characteristics of the motion of fluids described by fundamental equations, with the usage of numerical algorithms, numer-ical methods and computers [3]. Nevertheless, in those times this new science was reserved only for high technology engineering areas such as aeronautics or astro-nautics. Nowadays, we can use some of these techniques to analyze complex flow problems. The figure 8 depicts the output of a CFD model that analyzes the influence of lateral groynes on the hydrodynamics of a small straight creek.
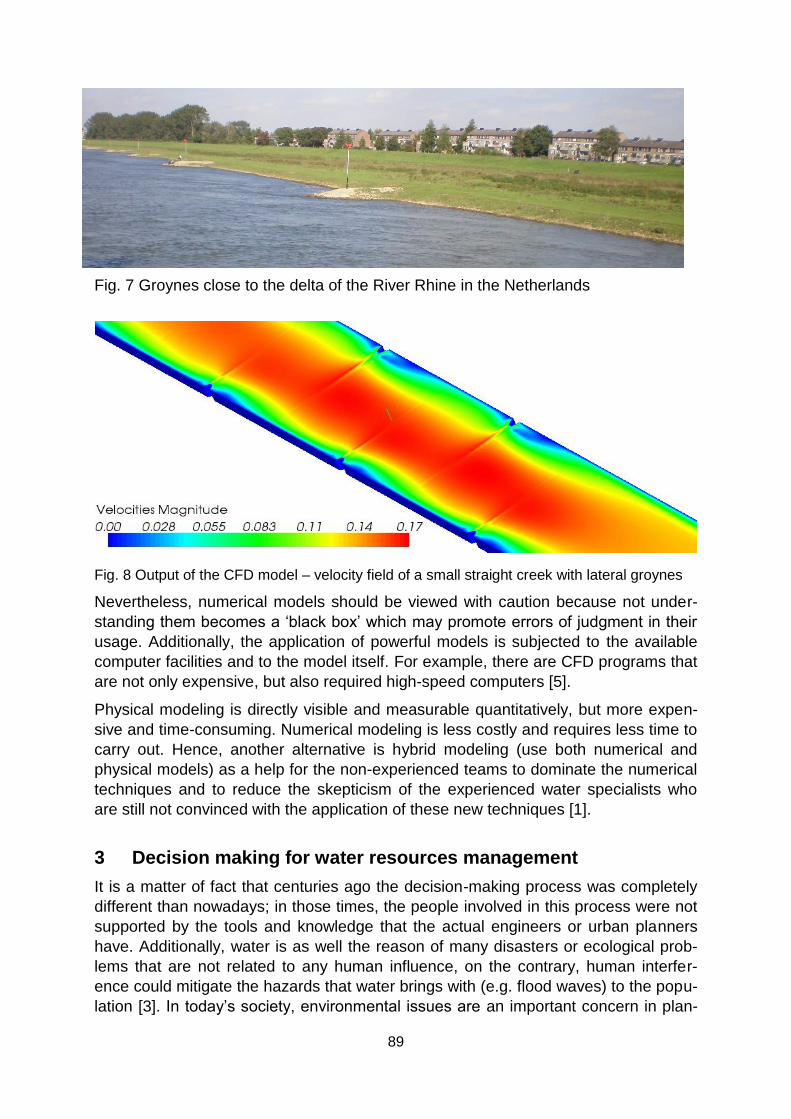
89
Fig. 7 Groynes close to the delta of the River Rhine in the Netherlands
Fig. 8 Output of the CFD model – velocity field of a small straight creek with lateral groynes
Nevertheless, numerical models should be viewed with caution because not under-
standing them becomes a „black box‟ which may promote errors of judgment in their
usage. Additionally, the application of powerful models is subjected to the available
computer facilities and to the model itself. For example, there are CFD programs that
are not only expensive, but also required high-speed computers [5].
Physical modeling is directly visible and measurable quantitatively, but more expen-
sive and time-consuming. Numerical modeling is less costly and requires less time to
carry out. Hence, another alternative is hybrid modeling (use both numerical and
physical models) as a help for the non-experienced teams to dominate the numerical
techniques and to reduce the skepticism of the experienced water specialists who
are still not convinced with the application of these new techniques [1].
3 Decision making for water resources management
It is a matter of fact that centuries ago the decision-making process was completely
different than nowadays; in those times, the people involved in this process were not
supported by the tools and knowledge that the actual engineers or urban planners
have. Additionally, water is as well the reason of many disasters or ecological prob-
lems that are not related to any human influence, on the contrary, human interfer-
ence could mitigate the hazards that water brings with (e.g. flood waves) to the popu-
lation [3]. In today‟s society, environmental issues are an important concern in plan-

90
ning projects related to water resources; e.g. discharges of pollutants into rivers and
lakes are not allowed, unless special permission is given by the appropriate authority.
3.1 Decision-making models and the Planning scale
New regulations and challenges for planning, construction and operation of hydraulic
structures has increased demands for water usage. Therefore, appropriate decision-
making processes and planning approaches are necessary to reach sustainable
management for the water resources. In an appropriate decision-making process,
there are key-points that conciliate the different interests of the people involved in this
process; one of them is the interaction of specialists from different academic back-
grounds in brainstorming exercises. Additionally and even though there are several
decision-making models for water resources management; all of them should include
public involvement as well as economic, social and environmental analysis.
Fig. 9 Multi-disciplinary work in the decision-making process
The figure 9 depicts a simple scheme showing the people from different backgrounds and interests who participate in the decision-making process. In the same figure; wa-ter engineers and universities are emphasized because they are in charged of ana-lyzing the plans, programs and alternatives from the technical point of view. They can use numerical modeling to fulfill this task. Looking at the traditional approach for planning and manage water resources in the US [8]; the decision-making has been relied on an iterative process which included the following steps:
1. Identifying problems and opportunities 2. Inventorying and forecasting conditions 3. Formulating alternative plans 4. Evaluating alternative plans 5. Comparing alternative plans 6. Selecting a plan
Numerical models represent a tool that can forecast conditions of the water re-
sources and its interaction with the man-made infrastructure. It can help the water
specialists not only to formulate plans and options, but also to evaluate and compare
these different options (scenarios) to select the most convenient of them. Therefore,
numerical models can be involved in five points of this traditional approach.
In planning, there are two important scales to be recognized: the project and the
global scale. The project scale refers to a punctual problematic to be analyzed, e.g.
planning the construction of a hydropower plant; while the global scale involves the
whole river basin that will be altered by the construction of this punctual hydropower

91
plant. Hence, before choosing a model, the water specialist has to question in depth
its applicability to a specific problem according to its planning scale.
At the project scale, physical models can be a good option for non-experienced CFD
teams or to experienced water specialists who still don‟t trust the new computer
technologies [5]. At the global scale, numerical models are a more suitable option to
analyze water dynamics. Therefore, choosing the best Computational Technique is
fundamental and depends on the characteristic of the flow and on the scale of the
analyzed phenomenon. In one hand, it is extremely expensive to calculate flood ex-
tensions using CFD; therefore a convenient model could be 1D or 2D because the
local turbulent structures are not of interest, just the flood duration and extension. On
the other hand, analyzing the turbulent stresses in the bottom of a river downstream
the mentioned hydropower plant can be done accurately only by using CFD.
3.2 Types of numerical models
Numerical models in hydro-engineering are categorized according to their aim, the
number of dimensions to be resolved or to the applied numerical methods. The first
programs that have been created were mainly 1D because the computational tools
were still a constraint to develop more powerful approximations. Nevertheless, the
actual water projects are more ambitious and more accurate models are required.
The Navier-Stokes set of equations or NSE (1) together with the continuity equation
(2) describe the motion of incompressible fluids. These equations are the basis of all
the hydrodynamic models. The NSE can be expressed as follows [3]:
i
i
kkikiikig
puuuu
,
,, (1)
0, ii
u (2)
where u is the velocity component in the i-direction, P is the pressure of the system;
is the density of the fluid in motion and is the fluid‟s kinematic viscosity. 1D and
2D models are simplifications of the NSE, while CFD techniques try to solve or ap-
proximate in different ways this set of equations. Due to the rapid development of the
computer facilities over the past 20-30 years; CFD is becoming more popular among
river engineers. Water specialists now are able to model in the computer complex
phenomena that at the laboratory would be difficult to control with the scaled models.
A sub-classification of numerical models is according to the transition of the water
flow. There are steady, unsteady or quasi-steady models. Steady models enormously
facilitate the work of the water specialist; nevertheless the output of theses models
losses accuracy. Unsteady models are very useful to analyze time-dependent phe-
nomena, such as flood waves while quasi-steady models are useful to analyze com-
plex phenomena that are time-dependent.

92
3.3 Choosing the most appropriate tool
This part of the paper presents some criteria on how the water specialist can choose
the most appropriate numerical approach according to the characteristics of the phe-
nomenon that has to be analyzed, the number of dimensions of the numerical model
and the planning scale of the problem (global or project).
As mentioned in the previous sub-section, models can be classified according to the
number of dimensions. In hydrodynamics, these dimensions are not related to the
spatial geometry of the real world, but with the number of velocity components that
are planned to be solved. 1D models are capable to estimate the water depth as well
as the averaged velocity in one direction. These models are useful to analyze global
scale problems, such as river flows through long reaches or long lasting flood waves.
3D numerical models (CFD) are powerful tools to investigate problems related to tur-
bulent flows at the project scale; such as the flow through turbines or through hydro-
power houses; to analyze the functionality of hydraulic structures (spillway design)
and to solve problems that involve complex physical phenomena such as sediment
transport, hydraulic limnology, transport or dispersion of pollutants as well as coastal
morphodynamics. It is necessary to point out that the Reynolds number is a parame-
ter that allows us to choose the best CFD technique. It is necessary as well to high-
light that there are 3D models that are still prohibitive for environmental and engi-
neering purposes, such as Direct Numerical Simulations or DNS.
Model Type Governing Eq-uations
Scale of the problems that can be analyzed
Available software (some examples)
1-D Bernoulli, 1D Saint Venant,
Global scale problems, such as river flow through a long quasi-straight reach; long lasting flood waves. Problems that involves kinematic waves and/or hydro-logic routing.
HEC-RAS, HEC-2, FEQ, DAMBRK, DWOPER, FLDWAV, MIKE 11, SOBEK, SMS.
2-D 2D Saint-venant, Laplace equation together with the Darcy‟s Law.
Global scale problems of groundwater flow. Global scale problems of river flow through medium reaches with complex geometries. Watershed man-agement and coastal morpho-dynamics.
FESWMS, RMA-2 RMA-4, RMA-6 RIVER2D, SMS MIKE 21, SOBEK MIKE FLOOD, SMS.
3-D RANS, Vorticity and Helmholtz Equations, Navier-Stokes Equation, Laplace equation.
Project scale problems with not complicated geometries (water flow through turbines and hy-dropower houses). Problems that involves complex physical phenomena such as sediment transport, hydraulic limnology, water quality and transport of pollutants. Groundwater flow and coastal morphodynamics.
CH3D-SED, FLUENT STAR-CD, FLOW3D CFX, TELEMAC, PHOENICS, OPEN-FOAM, DELFT3D.
Table 1 Type of models according to their number of dimensions

93
2D models are probably a convenient option for specialists who work independently
from universities or high education institutions. Global scale problems of groundwater
flow; global scale problems of river flow through medium reaches with complex geo-
metries are examples of phenomena that can be analyzed by 2D modelling with reli-
able outputs. Some project scale problems as well can be analyzed; nevertheless a
CFD model is more recommendable.
The table 1 summarizes the previously mentioned criteria. This table depicts as well
the governing equations according to the model type and some examples of the
available software that can be used by the water-specialists.
4 Conclusions
In the decision-making process of projects, plans and programs that involve water
resources; the role of the water specialist is fundamental in helping to choose most
adequate decision. Therefore, models are useful tools that allow the water specialist
to better analyze a wider range of scenarios of the water dynamics. Nowadays and
thanks to the rapid evolution of the computer facilities, numerical models are becom-
ing an efficient solution to forecast the hazards provoked by water motion, to study
hydrodynamics and to predict the interaction between the water bodies and the man-
made structures, which 30 years ago were only analyzed by physical modelling at the
laboratory. Nevertheless, only few of the actual numerical models can be used for
engineering or environmental purposes due to the scale of the hydro-engineering
projects and due to the extreme computational costs of several of these techniques.
The usage of numerical models should be as well supervised by water specialists. It
is a matter of fact that not experienced engineers easily apply computers to solve
hydro-engineering problems with minimum knowledge of the theory [7]. An inexperi-
enced user may produce convincing and impressive figures, but the accuracy of the
result may still not be good enough to have a value in practical engineering if the cal-
culation was not correctly carried out. Hybrid modelling can be a good option to con-
vince the experienced engineers to use the new techniques and to help the young
water specialists to enhance their knowledge about water dynamics thanks to the
interaction with their experience colleagues [1].
References [1] Carstensen, D. et-al. Hybrid Modeling as a basis for the assessment of flood protecting
assets in Urban areas: The case example of the Grimma City (In German). Five Years after
the Flood. Dresden, Oct. 8-9, 2007. pp. 189-198.
[2] Herrera-Granados, O. The Tuxpan River: A case study of the WFD as a guideline for pro-tecting tropical river systems. 7th Conference Environmental Engineering, Vilnius May 22-23 2008. pp. 530-537. [3] Herrera-Granados, O. Computational Fluid Dynamics in River Engineering: A General Overview. In, InterTech 2009, Poznań, May 20-22 2009. pp. 259-263. [4] Herrera-Granados, O. Considering the Importance of Water Dynamics in Sustainable Planning. In, Water in the Townscape, Vol. 2, 2009. pp. 101-110.

94
[5] Herrera-Granados, O. Hydraulic modelling: choosing the most appropriate tool in the de-cision-making process for water resources management. 8th Student Science Conference. Wrocław: Oficyna Wydawnicza Politechniki Wrocławskiej, 2010. pp. 19-24. [6] Navarrete, S. Estudio hidrológico de la cuenca del río Tuxpan. Diploma thesis. UNAM Mexico 2002. [7] Olsen, Nils R. B. “Numerical Modelling and Hydraulics”. The Norwegian University of Science and Technology, 2007. [8] Schilling, K.E. The Future for Water Resources Planning and Decision Making Models. U.S. Army Corps of Engineers, 2006.

95
Private Sector Participation in Urban Water Supply in Developing Countries: The Ghana Experience
Dr. Charles Amoatey Ghana Institute of Management and Public Administration (GIMPA) Email: [email protected] Tel: +233-24-9759944 Abstract: Inefficiency in urban water provision is quite widespread in the developing world. In Ghana, due to high level of losses and poor management of the water dis-tribution system only about 25% of the urban population receive continues water supply. According to the multi-donor Africa MDG assessment (2008), access to an improved water sources in the country is only 56%. With the objective of injecting some efficiency into its water supply delivery system, Ghana in 2006 began a privati-sation process under a 5-year management contract with two foreign water supply operators. The contract required the operator to, among other service standards; re-duce non-revenue water (NRW) by at least 5% annually. NRW stood at 53% at the commencement of the contract. The operator will receive compensation for meeting these standards otherwise he pays a penalty to the Grantor. This paper discusses the contract so far in the mist of public oppositions, the absence of a clear legal and regulatory framework, and tariffs well below cost recovery levels. The paper con-cludes that whiles PSP can bring some efficiency gains in service delivery; accurate baseline information and clearly defined responsibilities for operator and grantor are necessary requirements for the success of any urban water supply management con-tract.
1 Introduction
Water is a basic necessity for human survival. It is a very critical element as far our
goal to reduce poverty and improving on living standards are concern. Access to
adequate safe water directly linked to all of the eight (8) Millennium Development
Goals (MDGs). As a result of economic growth and stable political climate, Ghana is
currently under-going rapid urbanization and industrialisation. It is estimated that
nearly 44% of Ghanaians now live in urban areas, and almost half of urban residents
live in the country‟s largest cities – Accra and Kumasi. Migration from rural areas to
towns and cities is driving urban growth. With current growth rate, the urban popula-
tion is projected to reach 14 million by 2015, at which point half of Ghana‟s popula-
tion will be living in towns and cities.
The rate of urbanization outstrips current levels of urban water supply. The Ghana
Water Company Limited (and its operator, AVRL) currently operates 82 urban sys-
tems with an average daily output of 572,012 m3/day as against a daily demand of
1,049,306 m3/day. Due to high level of losses and poor management of the water
distribution system only about 25% of the urban population receive continues water
supply. Water is rationed to many consumers with only a few customers able to get
24-hour supply. In the peri-urban areas and the densely populated poor urban areas
customers receive supplies once a week or none at all. Among the urban poor, water
can be a critical resource in short supply. Census (2000) found that only four out of
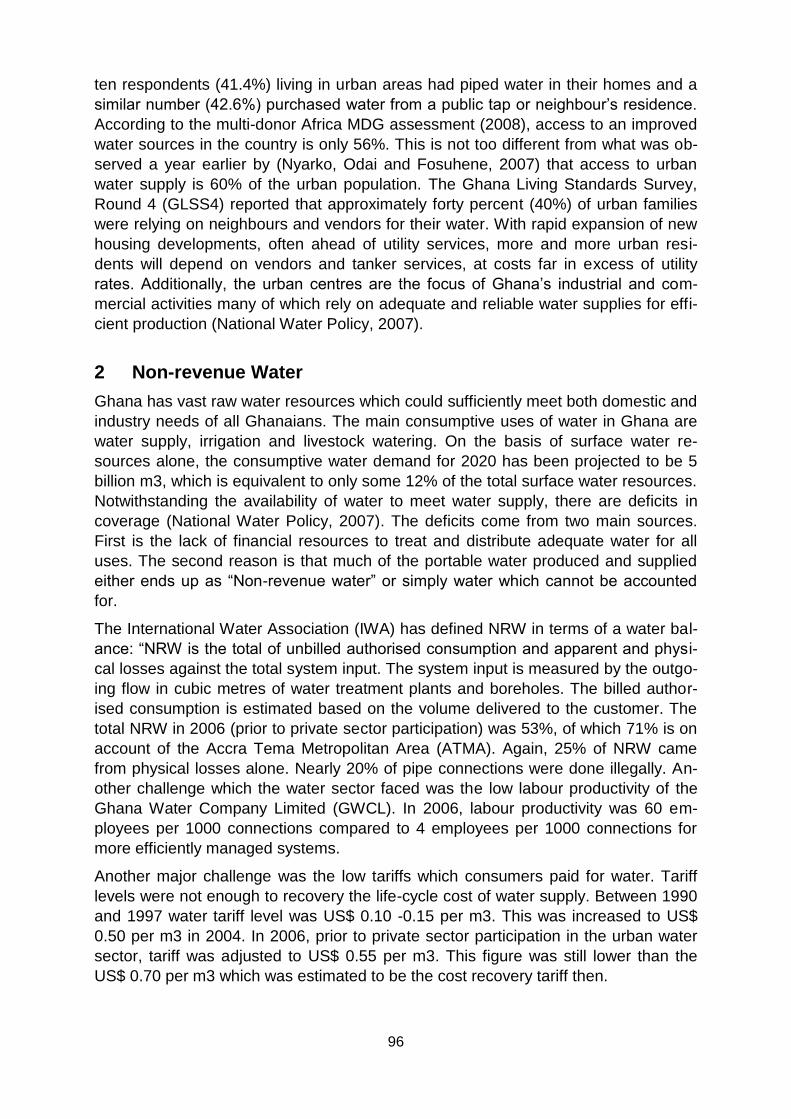
96
ten respondents (41.4%) living in urban areas had piped water in their homes and a
similar number (42.6%) purchased water from a public tap or neighbour‟s residence.
According to the multi-donor Africa MDG assessment (2008), access to an improved
water sources in the country is only 56%. This is not too different from what was ob-
served a year earlier by (Nyarko, Odai and Fosuhene, 2007) that access to urban
water supply is 60% of the urban population. The Ghana Living Standards Survey,
Round 4 (GLSS4) reported that approximately forty percent (40%) of urban families
were relying on neighbours and vendors for their water. With rapid expansion of new
housing developments, often ahead of utility services, more and more urban resi-
dents will depend on vendors and tanker services, at costs far in excess of utility
rates. Additionally, the urban centres are the focus of Ghana‟s industrial and com-
mercial activities many of which rely on adequate and reliable water supplies for effi-
cient production (National Water Policy, 2007).
2 Non-revenue Water
Ghana has vast raw water resources which could sufficiently meet both domestic and
industry needs of all Ghanaians. The main consumptive uses of water in Ghana are
water supply, irrigation and livestock watering. On the basis of surface water re-
sources alone, the consumptive water demand for 2020 has been projected to be 5
billion m3, which is equivalent to only some 12% of the total surface water resources.
Notwithstanding the availability of water to meet water supply, there are deficits in
coverage (National Water Policy, 2007). The deficits come from two main sources.
First is the lack of financial resources to treat and distribute adequate water for all
uses. The second reason is that much of the portable water produced and supplied
either ends up as “Non-revenue water” or simply water which cannot be accounted
for.
The International Water Association (IWA) has defined NRW in terms of a water bal-
ance: “NRW is the total of unbilled authorised consumption and apparent and physi-
cal losses against the total system input. The system input is measured by the outgo-
ing flow in cubic metres of water treatment plants and boreholes. The billed author-
ised consumption is estimated based on the volume delivered to the customer. The
total NRW in 2006 (prior to private sector participation) was 53%, of which 71% is on
account of the Accra Tema Metropolitan Area (ATMA). Again, 25% of NRW came
from physical losses alone. Nearly 20% of pipe connections were done illegally. An-
other challenge which the water sector faced was the low labour productivity of the
Ghana Water Company Limited (GWCL). In 2006, labour productivity was 60 em-
ployees per 1000 connections compared to 4 employees per 1000 connections for
more efficiently managed systems.
Another major challenge was the low tariffs which consumers paid for water. Tariff
levels were not enough to recovery the life-cycle cost of water supply. Between 1990
and 1997 water tariff level was US$ 0.10 -0.15 per m3. This was increased to US$
0.50 per m3 in 2004. In 2006, prior to private sector participation in the urban water
sector, tariff was adjusted to US$ 0.55 per m3. This figure was still lower than the
US$ 0.70 per m3 which was estimated to be the cost recovery tariff then.

97
In 2007, Ghana was identified as one of the countries which is off-track in meeting
MDG target on access to portable water (see figure 1 below).
Figure 1: Water supply coverage by selected African countries
Source: Presentation at the World Water Week in Stockholm, 2007
The sector had suffered from severe lack of investments and maintenance of the ex-
isting infrastructure. As at 2006, about 96% of all water supply related investment
had been funded by development partners. The figure below makes a comparison of
the water sector preparedness among selected African country.
Figure 2: Annual investment in the water sector
Source: Presentation at the World Water Week in Stockholm, 2007
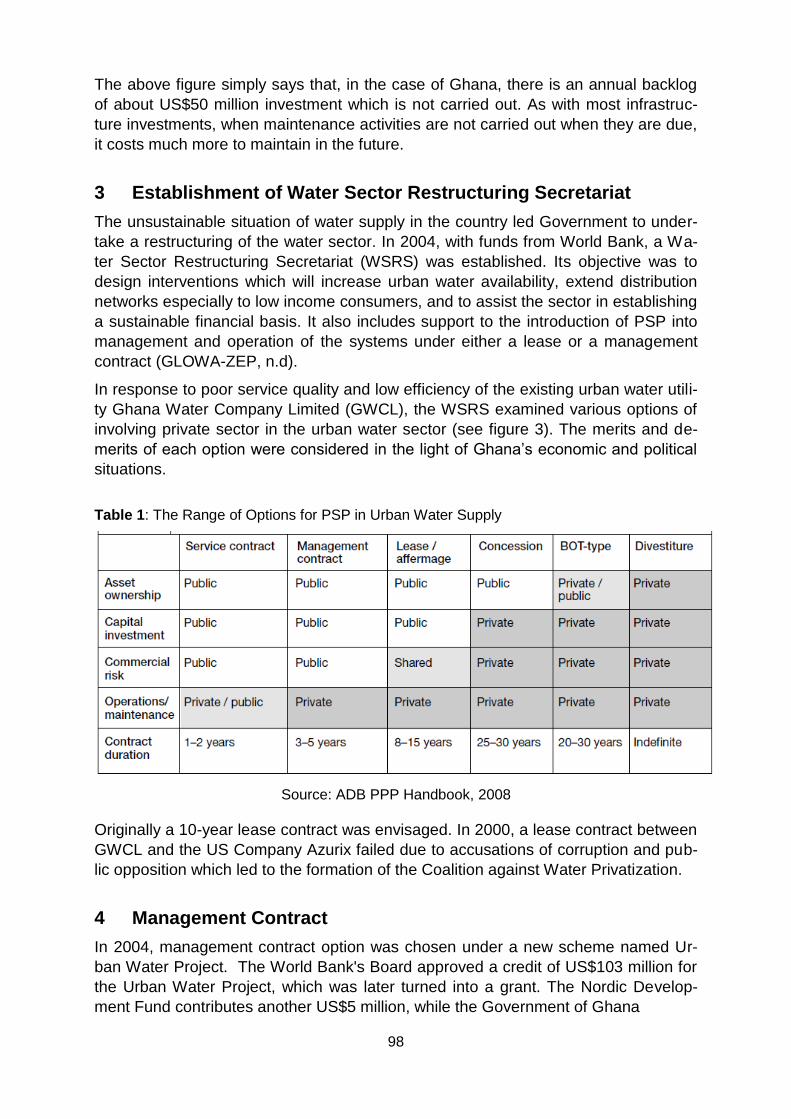
98
The above figure simply says that, in the case of Ghana, there is an annual backlog
of about US$50 million investment which is not carried out. As with most infrastruc-
ture investments, when maintenance activities are not carried out when they are due,
it costs much more to maintain in the future.
3 Establishment of Water Sector Restructuring Secretariat
The unsustainable situation of water supply in the country led Government to under-
take a restructuring of the water sector. In 2004, with funds from World Bank, a Wa-
ter Sector Restructuring Secretariat (WSRS) was established. Its objective was to
design interventions which will increase urban water availability, extend distribution
networks especially to low income consumers, and to assist the sector in establishing
a sustainable financial basis. It also includes support to the introduction of PSP into
management and operation of the systems under either a lease or a management
contract (GLOWA-ZEP, n.d).
In response to poor service quality and low efficiency of the existing urban water utili-
ty Ghana Water Company Limited (GWCL), the WSRS examined various options of
involving private sector in the urban water sector (see figure 3). The merits and de-
merits of each option were considered in the light of Ghana‟s economic and political
situations.
Table 1: The Range of Options for PSP in Urban Water Supply
Source: ADB PPP Handbook, 2008
Originally a 10-year lease contract was envisaged. In 2000, a lease contract between
GWCL and the US Company Azurix failed due to accusations of corruption and pub-
lic opposition which led to the formation of the Coalition against Water Privatization.
4 Management Contract
In 2004, management contract option was chosen under a new scheme named Ur-
ban Water Project. The World Bank's Board approved a credit of US$103 million for
the Urban Water Project, which was later turned into a grant. The Nordic Develop-
ment Fund contributes another US$5 million, while the Government of Ghana
99
provides the remaining US$12 million of the US$120 million project.
Management contracts are most likely to be useful where the main objective is to
rapidly enhance a water company‟s technical capacity and its efficiency in performing
specific tasks, or to prepare for greater private involvement. Ghana, in 2006, began a
privatisation process under a management contract with two foreign water supply
operators –namely, Aqua Vitens Rand Limited (a South African-Dutch Consortium).
AVRL will support GWCL under a five-year management contract to improve its per-
formance and rehabilitate and extend the existing urban water infrastructure. The
operator receives a base fixed fee for it services plus a compensation for achieving
specified service standards in the contract. If the specified service standards are not
met, operator received penalty deduction to the base fee.
The Project's two principal development objectives are to (World Bank, 2005): (i) significantly increase access to the piped water system in Ghana's urban cen-
ters, with an emphasis on improving access, affordability and service reliability to the urban poor; and
(ii) Restoring long term financial stability, viability and sustainability of the Ghana Water Company Limited (GWCL).
Other specific objectives included the following:
Extending reliable water supply especially to low-income areas
Making potable water affordable for low-income consumers
Increasing cost recovery
Ensuring investments based on low-cost and concession financing
Supporting further involvement of the private sector
Reducing non-revenue water
Increasing water treatment
Again, AVRL is responsible for the management of commercial services, such as:
Commercial and administrative processes relating to meter reading, billing and collection.
Applications for new connections, new subscriptions, customer files, customer disconnections and regularisation of illegal connections.
Under the terms of the management contract AVRL has access to funds for a training
programme ($ 1.5 million) and a Repair, Replacement and Rehabilitation Fund ($ 5
million). The operator is expected to propose capital investments to GWCL each
year.
The contract required the operator to achieve the following service standards (see
table 2). The technical auditor to the contract monitors the activities of the operator
and recommends appropriate compensations or penalties.

100
Table 2: Management contract service standards
Service Standard Aspect to Monitor
1. Raw Water Quality Source of raw water
Development of additional raw water sources
2. Treated Water Quality and
Pressure
Water quality, pressure levels and flow rates at headworks
and distribution system meet defined standards
3. Reduction in Non-Revenue
Water
Plan for systematic reduction of non-revenue water in ser-
vice areas by 5% annually
Calculation of non-revenue water
Reduction of leakages and illegal connection
4. Treatment Plant Operations Status of metering (specification and location)
Average daily production
Investment requirement to increase water production
Adherence to PURC Regulatory Social Policy on low income
customers
Presence of snag items
5. Customer Response Plan Response to customer inquiry
Average customer response time
Plan to reduce average customer response time
6.Customer Accounts Receiv-
able
Non-public sector accounts receivables
Non-public sector sales
5 Lessons
The management contract is currently in the final year of implementation with many
of the targets yet to be achieved. Experience with the management contract in
Ghana suggests that conferring higher degrees of management responsibility to an
operator could bring about improvements.
Comparing Ghana‟s management contract experiences with other developing coun-
tries elicits some lessons to be learnt. A good management contract should exhibit
the following characteristics: 1. Well defined roles of the Grantor and the Operator (parties of the contract); 2. Clear allocation of risks between the Grantor and the Operator; 3. Clearly defined baseline: in the case of Ghana, it appears baselines were not
sufficiently established before the commencement of the contract. It was therefore difficult to measure achievement of certain service standards.
4. Achievable performance targets: without accurate baseline information realis-tic performance target cannot be set, and finally there is need for
5. Clear linkage between incentive fees and performance of the operator.

101
References World Bank (2005): Ghana Urban Water Project. Retrieved from http://web.worldbank.org/external/projects/main?pagePK=104231&piPK=73230&theSitePK=40941&menuPK=228424&Projectid=P056256 AMCW/AfDB/EUWI/WSP/UNDP (2006): Getting Africa on Track to meet the MDGs on Water and Sanitation - A Status Overview of Sixteen African Countries, 2006, p. 27 Rahaman, Abu Shiraz; Everett, Jeff; Neu, Dean (2007). "Accounting and the move to privatize water services in Africa". Accounting, Auditing & Accountability Journal, Volume 20, Number 5, 2007, pp. 637-670(34) Asian Development Bank (2008). Structuring a PPP: Available PPP Options Public-Private Partnership (PPP) Handbook. GLOWA-ZEF (n.d). Mapping the Water Sector of Ghana An Inventory of Institutions and Actors. Uni-versity of Bonn, Germany Stockholm, (2007). Presentations at the World Water Week. Stockholm, Sweden

102
Influence of Environmental Degradation on Future Water Supply Cost
Sri Maryati Research Group for Regional and City Infrastructure System Institute of Technology Bandung Labtek IX A, Jl. Ganesha No.10 40132 Bandung Indonesia [email protected]
Suprihanto Notodarmojo Pradono Research Group for Regional and City Infrastructure System Institute of Technology Bandung Labtek IX A, Jl. Ganesha No.10 40132 Bandung Indonesia
Desiree M.Kipuw Research Group for Regional and City Infrastructure System Institute of Technology Bandung Labtek IX A, Jl. Ganesha No.10 40132 Bandung Indonesia
Abstract: Previous studies indicate that environmental conditions affect water supply
cost. It was predicted that environmental degradation that occurred recently would
increase water supply cost. The increase in the water supply cost is a challenge in
the provision of water infrastructure. This challenge requires intervention and to un-
dertake interventions, it is necessary to know the factors that influence water supply
cost.
The goal of this study was prediction and intervention of future water supply cost re-
lated to environmental conditions, whereas the objectives are 1) environmental
variables affecting water supply cost, 2) model of environmental condition and water
supply cost. Relationship structure and intensity between water-supply-environment
variables and water supply cost is observed by developing regression equations
connecting water supply cost as dependent variable and quantity as well as water-
supply- environment variables as independent variables. Influence of environmental
degradation on water supply cost is analyzed by developing several scenarios of en-
vironmental changes, namely land conversion, population growth, and customer
density. The results also show that in general the future water supply cost will in-
crease.Based on the scenario of environmental changes, a number of recommenda-
tions are proposed to anticipate the increasing future water supply cost. Keywords: Environmental, Water Supply Cost

103
1 Background
Previous studies (e.g. Husain, 1975; Clark, et.al., 1981; Meckler, 1983; Montgomery,
1985; Kawamura, 1991; Price, 1991) indicated that water supply cost is affected by a
number of environmental variables, such as water quantity, water quality, topogra-
phy, and customer density. This suggests that the decline in environmental condi-
tions that occur at this time and likely will continue to decline in the future, will in-
crease water supply cost.
Increased costs of water supply in the future due to changes in environmental condi-
tions need to be known in order to provide strategic steps to intervene the cost, par-
ticularly related to environmental conditions. This intervention will certainly vary from
one place to other places, because the cost study is casuistic. Therefore an empirical
study is needed for a particular location. In Indonesia context, this kind of study is still
very limited.The goal of this research was prediction and intervention of future water
supply cost related to environmental conditions, whereas the objectives are 1) envi-
ronmental variables affecting water supply cost, 2) model of environmental condition
and water supply cost.
2 Research Method
Theoretically, water quantity, water quality, topography, and customer density was
stated as variables affecting water supply cost. However, in practice a study have to
be done to determine what variables from the variables mentioned above, which
really affects water supply cost.Environmental variables affecting water supply cost in
this study was identified by developing regression equations connecting water supply
cost as dependent variable and water-supply-environment variables as independent
variables. Cost in this study consisted of production and distribution cost. Water-
supply-environment variables consist of water quantity, water quality, topography,
and customer density. Quantity was measured as production and distribution volume
per year (m3/year). Water quality was measured as type of water source; spring,
groundwater, and surface water. Water quality variable was stated as dummy vari-
able groundwater and surface water. Topography was measured as type of distribu-
tion system. This variable was expressed as dummy variables pumping system. Cus-
tomer density was measured as amount of customer/network length (HC/m). Produc-
tion and distribution cost function can be stated as equation (1) and (2):
Bpro(v) = f(Kpro(v), SD, AP, Pom) (1) Bdis(v) = f(Kdis(v), pdt, Pom) (2)
Where Bpro(v) is production cost (Rp/year), Kpro(v) is production volume (m3/year), AP is
surface water, SD is Deep Well, Pom is pumping system, Bdis(v) is distribution cost
(Rp/year), Kdis(v) is production volume (m3/year), pdt is customer density (SL/m).
Data for regression analysis was developed from 120 production systems and 53
distribution systems of PDAM in Kabupaten Bekasi, Kabupaten Subang, Kabupaten
Cianjur, Kota Bandung, Kabupaten Bandung, Kabupaten Kuningan, and Kabupaten

104
Ciamis. Descriptive statistics of input data for production and distribution system is
showed in Table 1 and 2.
Table 1: Descriptive Statistics of Production System
Variable Minimum Maximum Average Deviation Standard
Kpro(v) (m3/yr) 3,239 1.1E+07 863,042.3 1,529,040.79
AP 0 1
SD 0 1
Pom 0 1
Bpro (Rp/yr) 5.0E+07 2.6E+09 2.9E+08
377,391,128.6
Table 2: Descriptive Statistics of Distribution System
Variable Minimum Maximum Average Deviation Standard
Kdis(v) (l/sec) 26,946.77 1,727,849.57 432,012.70 373,864.98
Pdt (customer/m) 0.0034 0.098 0.0428 0.02289
Pom 0 1
Bdis (Rp/yr) 130,000,000
2,800,000,000
480,000,000 438,832,352
Environmental variables that have been identified in the previous step, basically in-
fluenced by conditions of wider environment. Intervention towards water supply cost
was done through intervention of this wider environmental condition. After environ-
mental variables that affect water supply cost and their relationship with wider envi-
ronmental conditions can be identified, system dynamic modeling was undertaken to
determine the effect of environmental condition to water supply cost. This modeling
used Banjaran in Kabupaten Bandung, Indonesia as case study.
3 Findings
Relationship between water supply cost and water supply environment variables are
shown by equation (3) and (4). Equation (3) is for production system and equation (4)
is for distribution system. Relationship structure between water-supply-environment
variable based on equation 1 are best explained by linear regression form (R2=0.95).
The relationship structure is expressed by equation (3).
Bpro(v) = -2.0 x 10⁷ + 219.4 Kpro(v) + 4.1 x 10⁷ SD + 1.6 x 10⁸ Pom (3)
Equation (3) states that quantity, water quality and topography influence production
cost positively.
Relationship structure between water-supply-environment variables and distribution
cost based on equation (2) are best explained by log linear regression form
(R2=0.97). The relationship structure is:
ln Bdis(v) = 8.02 + 0.78 ln Kdis(v) – 0.55 ln pdt + 0.21 Pom (4)

105
Equation (4) states that quantity and topography influence distribution cost positively,
whereas customer density influences cost negatively.
This study showed that water quantity, customer density, topography, and water
quality influence water supply cost. The results of this study corresponded with that
stated in the theory. The quantity of raw water, raw water quality, and customer den-
sity are environmental conditions that are artificial, while topography is natural. Artifi-
cial variables are influenced by environmental condition. As an example, raw water
quality is affected by land use, quantity of production is influenced by population
growth, and customer density is affected by the occurrence of urban sprawl. Fur-
thermore, the influence of the dynamics of environmental condition (population
growth, land conversion, and urban sprawl) towards water supply cost was analyzed
using system dynamic modeling. The relationship between environmental conditions,
environmental variables, and water supply cost are shown in Figure 1.
Figure 1: Relationship between Water Supply System, Environmental Variables, and
Environment
Global model of influence of environmental condition on water supply cost was de-
veloped by tracing the relationship between events (evidence) in determining the cost
and their relationship with environmental aspects. The global model is shown in
Figure 2.
Water Sup-ply
Sys-tem
Environ-ment
Water Supply System
Environment
Topo-
graphy
Land use
Popul
a- tion
Population Distribu-
tion
Produc-tion vol-
ume
Raw water
quality
Custom-ers Distri-
bution

106
Increasing number of population generates new customers. The customers require a
new network and additional production capacity. New network and additional produc-
tion capacity could increase the cost of the production system, namely raw water ret-
ribution, employee costs, chemical costs, electricity costs, land rent, maintenance,
and depreciation, and costs in the distribution system consisting of employee costs,
electricity costs, land rent, maintenance, and depreciation.
Changes in land use can alter water quality. In this study water quality parameters
observed only water turbidity. Water turbidity was used to represent water quality
since in general the largest use of chemicals is to eliminate turbidity. Increased water
turbidity can increase the cost of chemicals.
Number of
customers
Needs of new
network
Network:
- Length
- Long Growth
Installation
capacity
Land Use
- Built up Area
Turbidity
Cost of Water Supply
- Production
- Distribution
Population
Figure 2: Global Model of Environmental Condition and Water Supply Cost
In this study five sub-models were developed, namely population, customer, network,
land use, and cost model. The explanations of each model are as follows.
Population Sub-Model
In population sub-model, the number of population was only influenced by population
growth rate.The number of population was determined by population growth that
forms a positive causal loop, where a specific population growth rates can increase
the population, and increasing population can increase the population growth rate.

107
Population
+
+
Population Growth
Figure 3: Causal Loop of Population Model Customer Sub-Model
In customer sub-model, the number of customers was determined by population
growth rate and only limited by the availability of water resources capacity. Factors
that influence willingness to be a customer, such as service quality and condition of
currently owned water sources were not considered in this model.
In this sub-model, addition of new customers increased the number of customers,
and increasing the number of customers can reduce the capacity of water resources
that can be utilized (available capacity). The reduced capacity of water resources will
limit the number of new customers.
New Customer
Available Capacity
Customer
+ -
+
Figure 4: Causal Loop of Customer Sub-Model
Network Sub-Model
In network sub-model, the availability of network was determined by addition new
network and deteriorated network. In fact, addition of new networks is not solely de-
termined by the existence of new customers. Policy to expand the service is usually
the driving factor of the new network investment. Conversely, the existence of new
customers does not necessarily require the addition of new network.
New network networkDeteriorated
network
+
- Figure 5: Causal Loop of Network Sub-Model
Land-Use Sub-Model
In the land use sub-model, the model structure was based on the factors of land con-
version rate that was triggered by population growth. Conversion of land into built up
area was assumed only come from the forest. Total land use other than built up area
and forest was assumed to be fixed.

108
In this sub-model there were two main variables, namely built up area and forest. If
the area of forest and built up area were assumed to be fixed (no conversion from
other land use), increase in built up area would reduce the forest area, and vice
versa.
Forest
-
-
Built up area
Figure 6: Causal Loop of Land Use Sub-Model
Cost Sub-Model
Production costs consists of raw water retribution, employee costs, chemical costs,
electricity costs, land rent, maintenance, and depreciation, while distribution costs
consists of employee costs, electricity costs, land rent, maintenance, and deprecia-
tion.
Cost sub-model can be divided into two parts, namely production costs and distribu-
tion costs. Increased number of customers demanding increased production volume,
and with the increased volume of production, the number of customers that can be
served increases. Increased production volumes require increased design capacity,
and with the increased capacity of design, production volume can be increased. In-
creased production volume will increase the cost of the production, namely raw water
retribution, employee costs, chemical costs, electricity costs, land rent, maintenance,
and depreciation costs. Changes in land use can alter the conditions of water turbid-
ity. Increased water turbidity can increase the cost of chemicals.
Production cost
Chemical Cost
Chemicals
Turbidity
Built Up Area
Customer
Design capacity
Electricity cost depreciation
++
+
+
+
+ +
+
+
Maintenance
Cost
Employee
cost
Procuction
Volume
+
+
++
+
+
+
+
Employee
+
+retribution
+
+
Land Rent
+
+
Figure 7: Causal Loop of Production Cost

109
Distribution Cost
Maintenance
Cost
Customers
Network
Length
Distribution
Volume
Electricity
CostDepreciation
Employee
Cost
+
++
+
+
++++++
+
+++
Land
Rent
++
+
+
Figure 8: Causal Loop of Distribution Cost
In the model of distribution costs, the increasing number of customers, required in-
creased production volume and the length of network, and with increasing production
volume and the length of the network, the number of customers that can be served
increases. The increased length of the network affects the cost of employee, mainte-
nance, and land rent, while increasing network length and volume of production af-
fect electricity costs and depreciation.
Causal loop explained above was subsequently changed into model diagram and
relations between elements in the model expressed in terms of mathematical equa-
tions.Test of model behavior committed against the number of population, the num-
ber of customers, network length, and built up area within a period of time that has
historical data. In the model developed, year 2000 was used as the initial time. Data
from 2001 to 2005 was used as tested data. The test results are shown in Table 3.
Table 3: Statistical Test for Certain Model Parameter
Variable MAPE1 (%) MSE2 (units2)
Population 1,6 8.633.835
Customer 2,1 2.251,14
Network Length 3,7 9.639.437
Built Up Area 1,5 241.653
Note: 1) mean absolute percentage error, 2) mean squared error
The effect of environmental dynamics on the water supply cost was observed
through various scenarios. Basic scenario was scenario that reflects the conditions
that occur at this time. At present, the rate of land conversion from forest to built up
area was amounted to 20% per year, the population growth rate is 4% per year, and
customer density is 0.078 HC/m. Scenarios 1-3 reflect changes in the basic scenario:

110
Scenario 1: Land Conversion
Scenario 1 represented a change in land conversion rate of 20% per year to
30% per year, while other conditions remain constant. Scenario 1 was called
land conversion scenario. As known, the bigger the built up area, the higher the
turbidity level of water, and the more chemicals were needed.
Scenario 2: Population Growth
Scenario 2 represented a change in the population growth rate of 4% per year
to 5% per year, while other conditions remain constant. Scenario 2 was called
population growth scenario. This scenario affected the growth of customers to
be served (assuming the scope of services was constant).
Scenario 3: Urban Sprawl
Scenario 3 represented a change in customer density of 0.078 HC/m to
0.05 HC/m, while the other conditions fixed. Scenario 3 was called urban sprawl
scenario. The phenomenon of urban sprawl is a phenomenon that occurs in
Bandung Metropolitan Area where Banjaran is located. This phenomenon is
demonstrated by the low population density. With the assumption that the distri-
bution of customers following the spread of population, urban sprawl scenario
could affect the need for the network.
4 Discussion
In term of production costs per unit, Scenario 2, namely population growth provide
the lowest effect on water supply cost. Nevertheless this does not mean that control-
ling the population growth rate should not be done. In the case of production costs
per unit, lower costs can not be interpreted as a result of increasing population
growth rate, but as a result of increasing the growth rate of customer. Basic scenario,
scenario 1, and scenario 3 give the same effect.
Figure 9: Production Cost/Unit
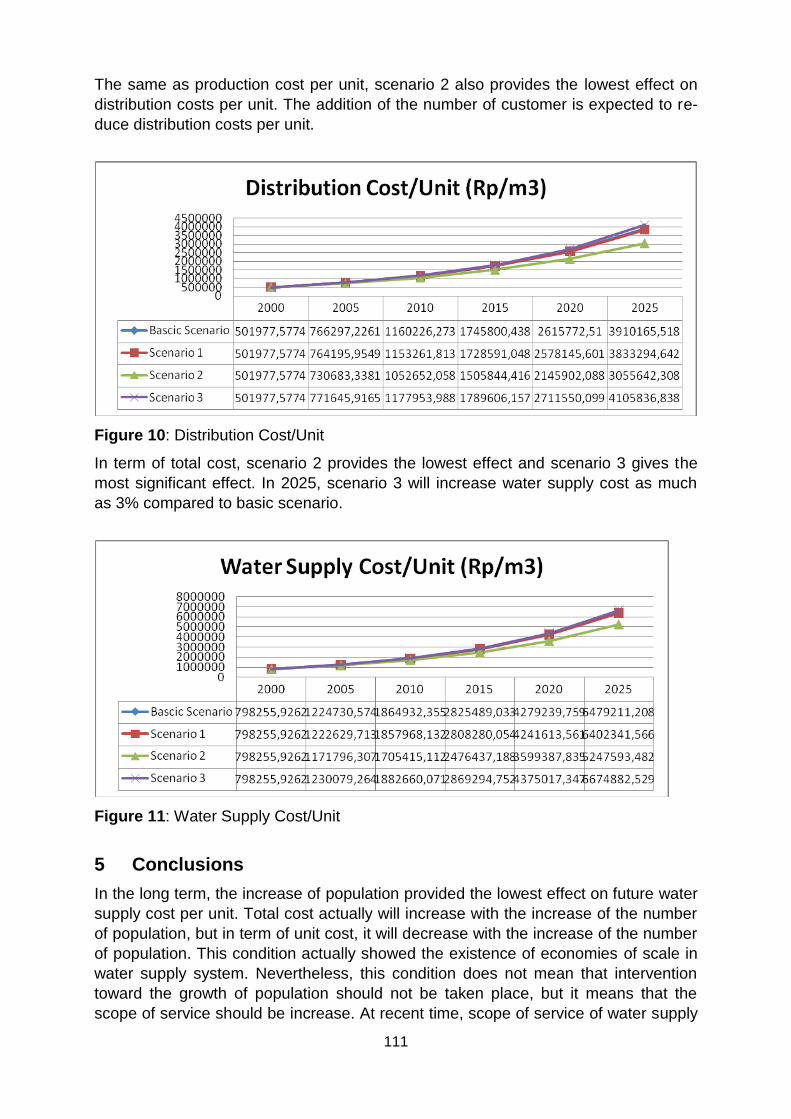
111
The same as production cost per unit, scenario 2 also provides the lowest effect on
distribution costs per unit. The addition of the number of customer is expected to re-
duce distribution costs per unit.
Figure 10: Distribution Cost/Unit
In term of total cost, scenario 2 provides the lowest effect and scenario 3 gives the
most significant effect. In 2025, scenario 3 will increase water supply cost as much
as 3% compared to basic scenario.
Figure 11: Water Supply Cost/Unit
5 Conclusions
In the long term, the increase of population provided the lowest effect on future water
supply cost per unit. Total cost actually will increase with the increase of the number
of population, but in term of unit cost, it will decrease with the increase of the number
of population. This condition actually showed the existence of economies of scale in
water supply system. Nevertheless, this condition does not mean that intervention
toward the growth of population should not be taken place, but it means that the
scope of service should be increase. At recent time, scope of service of water supply

112
is still 60% in urban area. Urban sprawl gave the most significant effect on water
supply cost. Urban sprawl influences the length of network and finally distribution
cost. Urban sprawl should be controlled by applying policy regulated population dis-
tribution.
Control of land conversion does not provide significant effects on the variables
tested, except the level of water turbidity. However the influence will take place in the
short time since the forest area which can be converted into built up area is limited.
Controlling urban sprawl (by increasing the density of customers) can only give effect
to the long decline in network, but the effect is given not for the influence of popula-
tion growth.
References Bruggink, T.H.: Public versus Regulated Private Enterprise in the Municipal Water Industry: A
Comparison of Operating Cost. Quarterly Review of Economics and Business, 1982, 22:111-
125.
Clark, R. M. and Stevie, R.G: A Water Supply Cost Model Incorporating Spatial Variables,
Land Economics, 1981, Vol.57 No.1: 18-32.
De Chiara, J., and Koppelman, L.E.: Urban Planning and Design Criteria, Van Nostrand
Reinhold, New York. 1975.
De Chiara, J., and Koppelman, L.E.: Time-Saver Standards for Site Planning. McGraw-Hill,
New York. 1984.
Feigenbaum, S. and Teeples, R.: Public versus Private Water Delivery: A Hedonic Cost Ap-
proach. The Review of Economics and Statistics, 65: 672-678. 1983.
Ford, L.T. and Warford, L.T.) : Cost Function for the Water Industry. Journal of Industrial
Economics, 1969, 18 (Nov): 53-63.
Husain, S.K.: Text Book of Water Supply and Sanitary Engineering, Oxford & IBH Publishing
Co, New Delhi. 1975.
Kawamura, S.: Integrated Design of Water Treatment Facilities, John Wiley and Sons, Inc.,
Canada. 1991.
Kim, E., and Lee, H.: Spatial Integration of Water Services and Economies of Scale, Journal
of the Applied Regional Science Conference, 1998 Volume 10 No.1: 3-18.
Kim, H.Y., and Clark, R.M.: Economies of Scale and Scope in Water Supply, Regional Sci-
ence and Urban Economics, 1988, Vol. 18: 479-502.
Kirshen, P., Larsen, A.L., Vogel, R.M., and Moomaw, W.: Lack of Influence of Climate on
Present Cost of Water Supply in the USA, Water Policy, 2004, Vol.6, 269-279.
Kirshen, P., McCluskey, M., Vogel, R., and Strzepek, K.: Global Analysis of Changes in Wa-
ter Supply Yields and Costs under Climate Change: A Case Study in China, Climatic
Change, 2005, Vol 68, p.303-330.
Linaweaver, P.F. and Clark, C.: Cost of Water Transmission, Journal of the American Water
Works Association, 1964, 56 (Dec): 1549-1609.
Lynch, K.: Site Planning, The MIT Press, Cambridge, Massachusetts, 1971.
Male, J. W., Moriarty, J. B., Stevens, T. H. and Willis, C. E.: Water Supply Cost for Small
Private Utilities, Water Resources Bulletin, 1991, 27(3), 521-526.
McGhee, T.J.: Water Supply and Sewerage. McGraw-Hill, New York, 1991.
Meckler, M.: Pumps and Pump Systems, American Society of Plumbing Engineers, 1983.
Mizutani, F., and Urakami, T.: Identifying Network Density and Scale Economies for Japa-
nese Water Supply Organizations, Regional Science, 2001, Vol. 80: 211-230.

113
Montgomery, J.M.: Water Treatment Principles and Design, John Wiley and Sons, Inc, 1985.
Sri Maryati and Suprihanto Notodarmojo: Efficiency of Sanitation Facilities in Various Scales,
The 1st IRSA International Institute, Sustainable Regional Development: The Role of Infra-
structure in Achieving MDGs, Bandung, November, 1-3, 2007.
Sri Maryati, Suprihanto Notodarmojo, Widiarto, Benny Chatib: Environmental Condition and
Cost of Water Production and Distribution, Proceeding the 1st International Conference on
Sustainable Infrastructure and Built Environment in Developing Countries; Bandung, Novem-
ber, 2-3, 2009.
Sri Maryati, Widiarto, dan Suprihanto Notodarmojo: Environmental Factors and Water Supply
Cost, POSITIONING PLANNING IN THE GLOBAL CRISES: International Conference on
Urban and Regional Planning Celebrating 50th Anniversary of Planning Education in Indone-
sia, Bandung, November, 12-13, 2009.
Sri Maryati, Suprihanto Notodarmojo, Widiarto: Influence of Environmental Degradation on
Future Water Supply Cost”, MIPALCON 2010-1st International Conference of Infrastructure
Planning and Development in Developing Countries „The Way Forward‟ Stuttgart, 28 Sep-
tember – 1st October 2010.
Stevie,R. G., Clark, R. M. and Adams, J. Q.: Managing Small Water System: a cost study,
US EPA-600/2-79-147a, 1979, Vol. 1.
Teeples, R. and David, G.: Cost of Water Delivery Systems Specification and Ownership
Effects, the Review of Economics and Statistics, 1987, Volume 69, 399-407.

114
Territorial Management from A Cultural Perspective: A Review of Flood Risk Management Policies
in the Bangkok Metropolitan Region
Suwanna Rongwiriyaphanich Department of Urbanism, Faculty of Architecture, Delft University of Technology The Netherlands [email protected] Abstract: This paper examines the applicability and limitations of the proposed ana-lytical framework. The framework was developed to facilitate an analysis of territorial development processes taken culture as an important element shaping planning processes and spatial outcomes. Five main principles underpin the proposed analyti-cal framework are the concept of social-ecological system (Folke et al. 2005), cul-ture-changing dynamics (Gullestrup 2006), Institutional Analysis and Development framework (Ostrom 2005), five dimensions of cultures (Hofstede and Hofstede 2005) and cultural theory (Thompson et al. 1990). The analysis of territorial development of the Bangkok Metropolitan Region, with special emphasis on the impacts of local cul-tures on policy initiatives and spatial outcomes in relation to flood risk management in the region, is taken as an example for investigation. The analysis shows that despite its potential subjectivity resulted by heuristic interpretation, the proposed analytical framework tends to be a promising approach. Keywords: Local Cultures, Flood Risk Management, Bangkok Metropolitan Region (BMR)
1. Introduction
Planners and policy makers have recently increased their concerns regarding effects
of climate change on sustainable development of urbanised delta regions, in which
approximately half of the world population lives and works (Aquaterra 2009). Flood
risk management is an essential issue for development of these sensitive urbanised
areas. Reformation in territorial management has been informed by transfers of tech-
nology, knowledge and policy to deal with common problems. Nevertheless, previous
experiences have shown that applying a successful policy from one case to others do
not always produce successful outcomes (Friedmann 2005; de Jong et al. 2002).
Many scholars have argued that development processes are shaped not just by de-
velopment plans and policies, but also significantly by local conditions, including cul-
tures (Friedmann 2005; Ostrom 2005).
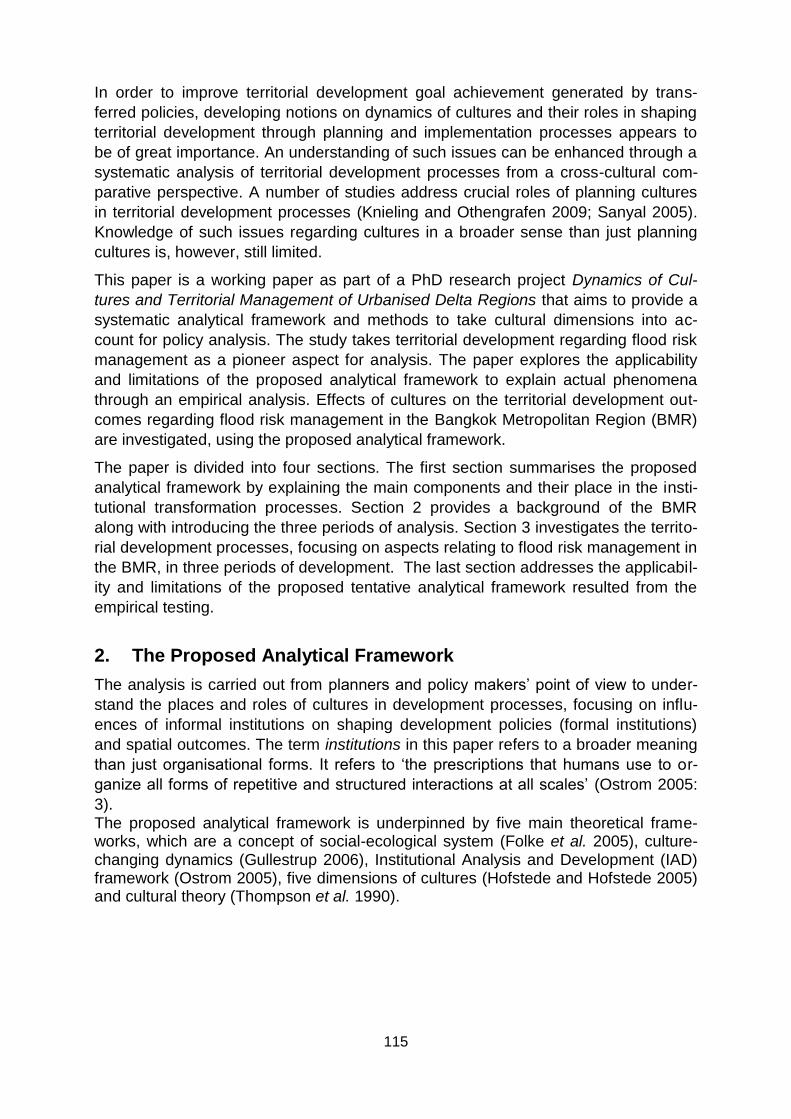
115
In order to improve territorial development goal achievement generated by trans-
ferred policies, developing notions on dynamics of cultures and their roles in shaping
territorial development through planning and implementation processes appears to
be of great importance. An understanding of such issues can be enhanced through a
systematic analysis of territorial development processes from a cross-cultural com-
parative perspective. A number of studies address crucial roles of planning cultures
in territorial development processes (Knieling and Othengrafen 2009; Sanyal 2005).
Knowledge of such issues regarding cultures in a broader sense than just planning
cultures is, however, still limited.
This paper is a working paper as part of a PhD research project Dynamics of Cul-
tures and Territorial Management of Urbanised Delta Regions that aims to provide a
systematic analytical framework and methods to take cultural dimensions into ac-
count for policy analysis. The study takes territorial development regarding flood risk
management as a pioneer aspect for analysis. The paper explores the applicability
and limitations of the proposed analytical framework to explain actual phenomena
through an empirical analysis. Effects of cultures on the territorial development out-
comes regarding flood risk management in the Bangkok Metropolitan Region (BMR)
are investigated, using the proposed analytical framework.
The paper is divided into four sections. The first section summarises the proposed
analytical framework by explaining the main components and their place in the insti-
tutional transformation processes. Section 2 provides a background of the BMR
along with introducing the three periods of analysis. Section 3 investigates the territo-
rial development processes, focusing on aspects relating to flood risk management in
the BMR, in three periods of development. The last section addresses the applicabil-
ity and limitations of the proposed tentative analytical framework resulted from the
empirical testing.
2. The Proposed Analytical Framework
The analysis is carried out from planners and policy makers‟ point of view to under-
stand the places and roles of cultures in development processes, focusing on influ-
ences of informal institutions on shaping development policies (formal institutions)
and spatial outcomes. The term institutions in this paper refers to a broader meaning
than just organisational forms. It refers to „the prescriptions that humans use to or-
ganize all forms of repetitive and structured interactions at all scales‟ (Ostrom 2005:
3). The proposed analytical framework is underpinned by five main theoretical frame-works, which are a concept of social-ecological system (Folke et al. 2005), culture-changing dynamics (Gullestrup 2006), Institutional Analysis and Development (IAD) framework (Ostrom 2005), five dimensions of cultures (Hofstede and Hofstede 2005) and cultural theory (Thompson et al. 1990).

116
2.1 Structure of the Analytical Framework
The proposed framework (see Figure 5) combines two building blocks for two action
situations that interact, which will be called hereafter as „planning situation‟ and „im-
plementing situation‟. Each building block consists of three main components,
namely conditioned factors, action arena and outcomes. The framework represents
dynamic processes, with all components performing as dependent variables.
Figure 5 Structure of the proposed analytical framework
The structure of the proposed analytical framework is based on the Institutional
Analysis and Development (IAD) framework developed by Ostrom (2005), with some
modifications. The major modification is made to the so-called exogenous variables
in the IAD framework, which is replaced by the term „conditioned factors’ in this
paper. The three elements of the exogenous variables are reclassified into four ele-
ments: physical conditions, attributes of community, informal institutions and formal
institutions. This reclassification results from the integration of the IAD framework and
concepts of culture-changing dynamics developed by Gullestrup (2006) to fit the re-
search‟s purpose.
Physical conditions refer to attributes of the bio-physical and material world of the
resource units (Ostrom 2005) - which are, in this case, land and water (in the sense
of flood) of the urbanised delta regions. Attributes of community refer to Gullestrup
(2006)‟s „difficult-to-perceive structural layers‟, which include social, economic, politi-
cal & administrative and language & communication structures. Formal institutions
refer to Gullestrup (2006)‟s formalised layers of norms and rules, such as legitimised
regulations, instructions, precepts and principles in a form of rules, laws, constitutions
and contracts. This includes legitimised rules and laws that regulate the forms of
structural layers. These three elements are called in Gullestrup (2006) as manifest
culture layers. All layers of Gullestrup (2006)‟s core culture layers are considered in
this study as informal institutions. This includes worldviews and general accepted
values and believes, both in partly legitimised or non-legitimised forms.
Conditioned factors are significant variables that structure or condition the action
arena. They are continuously changing, influenced by either endogenous or exoge-
nous change-initiating factors or both (Gullestrup 2006). In this study, exogenous

117
factors refer to the driving forces generated or conditioned by agencies or factors
outside a given territory, with special focus on technology, knowledge and policy
transfers. This includes both voluntary and imposed transfers. Endogenous factors
refer to all the changes or conditions generated by local agents or local conditions,
including effects induced by exogenous factors that turn to local conditions. Exam-
ples are changes in social class and discourses generated by economic development
or political shifts. Despite of their dynamics, the conditioned factors are assumed to
be constant within a certain period of time. This is for the purpose of analysis
(Gullestrup 2006).
Action arena refers to activities created by actors in the action situations (Ostrom
2005). As mentioned earlier, there are two linking action situations in this case. The
outcomes of one action situation lead to changes in the conditioned factors of an-
other situation (see Figure 5). Planning situation refers to processes of policy prepa-
ration, whereas implementing situation refers to processes of policy implementation.
In this study, actors are classified into four main groups: providing agent, intervening
agent, affecting agent and monitoring agent. Some situations may not comprise all
groups of actors.
Outcomes are identified according to the resource systems and units together with
the governance systems and users for the analysis. The outcomes are evaluated by
evaluative criteria, which in turn effect the adaptations of the conditioned factors and
action arena (see Figure 5). Examples of evaluative criteria are efficiency, equity and
adaptability. It is important to be clear which group will evaluate the outcomes from
which perspective. This is because evaluative criteria may differ between actors.
When outcomes are evaluated by the involved actors as productive or positive, they
may increase their commitment to following the institutions that have evolved over
time; institutional transformation takes place as a way to change the structure of the
situations in the action arena when the outcomes are evaluated as destructive or
negative (Ostrom 2005). This refers to changes created by endogenous change-
initiating factors. Institutional transformation sometimes occurs due to other reasons,
such as, the imposition of a powerful actors. This refers to changes created by ex-
ogenous change-initiating factors
2.2 Analytical Approaches and Parameters
Territorial development in this context is considered as a result of the complex and
dynamic institutional arrangements of interconnected social-ecological systems in a
given territory. This study, therefore, applies two approaches for analysing of govern-
ance, which are in terms of human-nature relationships and human-human relation-
ships. Each approach consists of different sets of parameters. Each parameter is
analysed and interpreted using common set of cultural dimensions, basing mainly on
the combination of Douglas (1970) and Thompson et al. (1990)‟s cultural theory and
part of the Hofstede (2005)‟s five dimensions of cultures. This is to make the
parameters comparable. The study applies only three dimensions of cultures, which
are power distance, integration and uncertainty avoidance.

118
The power distance (PD) indicates degree of control of a unit in the system over oth-
ers, ranging from symmetrical to asymmetrical transactions. The integration (In) indi-
cates level of contact between units in the systems, ranging from individualised to
collectivised relationship. The uncertainty avoidance (UA) refers to degree of
(in)tolerance of ambiguity, ranging from tolerance to intolerance. The application of
these dimensions still requires great efforts for further development. Some tentative
applications are, however, proposed and explained along with parameters as shown
in Table 1.
Table 1 Summarised parameters and their cultural dimensions for analysis
Human-nature relationships (H-N)
- resource management -
Human-human relationships (H-H)
- social organisation -
Parameters cul.dime. Parameters cul.dime.
Physical conditions
Land: topography, soil type, settle-ment patterns and urbanisation level (population size and density) in terms of limitation, opportunity and risk for development in relation to flood risk
Water: characteristics of rainfall, rivers and sea in terms of degree of severity, uncertainty and probability of flooding
Characteristics of land and water in terms of excludabili-ty and subtractability of flow: for instance, as public goods, common goods, club goods or private goods
Attributes of commu-nity
Civil society and private sectors: GDP and employment by sectors
Public sectors, governments and lobbyists: involving departments and their funding
PD, In Relationships between social groups and their positions in the community, presenting in accordance to the 2D dia-gram of (Thompson et al. (1990)‟s Cultural Theory
PD, In
Informal institutions
Conceptions of H-N: principles in religious, rituals, idioms, agricultural practices, meanings given to some terms such as flood
PD, In, UA
Conceptions of H-H: social and economic model of the society, idioms, the prin-ciples in religious and lan-guage
PD, In
Formal institutions
Legitimised rules, laws, constitu-tions and contracts relating to land use, flood risk, water and environ-mental management
PD, In, UA
Legitimised rules, laws, con-stitutions and contracts relat-ing to land tenure/ownership
PD, In
Develop-ment out-comes
Planning Situation: same as the formal institutions
Implementing Situation: patterns of land utilisation and land value
PD, In, UA
Planning Situation: same as the formal institutions
Implementing Situation: patterns of land te-nure/occupation
PD, In
Apart from actors, all parameters are identified in accordance to the two approaches
of analysis. Parameters for planning situations and implementing situations are sepa-
rately identified if they are different; otherwise it means they are similar. Formal insti-
tutions between both situations are generally the same set of institutions. Develop-
ment outcomes of planning situations are basically formal institutions of implementing
situations.

119
2.3 Institutional Transformation Processes and the Change-determining Fac-tors
In this study, an analysis of institutional transformation determination is mainly ap-
plied from a concept of culture-changing dynamics developed by Gullestrup (2006).
The term „cultures‟ in Gullestrup (2006) is interchangeable with the term „institutions‟
in this context. Gullestrup (2006) addressed that institutional changes are driven by
change-initiating factors, but whether and to which direction that changes will actually
occur depends on change-determining factors. Actual changes refer to changes that
take effects to a broad scale in a society across actors and across levels of institu-
tions. In this study, whether a real culture change does take place is evaluated from
reflections of the change initiatives (emphasising on changes in formal institutions) in
spatial outcomes.
The probability of actual culture change/institutional transformation (P.CC) is deter-
mined strongly by the relationships amongst four factors, which are degree of inte-
gration (DI), degree of homogeneity (DH), contents of change-initiating factors (CiF)
and culture-internal power relations (CIPR), as shown in Figure 6 and Figure 7. Fig-
ure 6 indicates two different P.CC values at a given combination of DH and DI, influ-
enced by two other factors, which are explained as follows.
The probability of actual institutional transformation is first determined by degree of
homogeneity (DH). It presumes that a community associated with more diverse
knowledge, experience and practical skills will provide more chances for change ini-
tiatives to penetrate into and reach a stage, where actual institutional transformation
can (but may or may not) take place (Gullestrup 2006). Degree of homogeneity can
be assessed from analysing attributes of the community. If the community is greatly
uniform, the content of the change-initiating factors (CiF) have to be tailor-made to fit
the existing attributes of the community (Gullestrup 2006); otherwise the change ini-
tiatives will be rejected from the community.
Figure 6 A theoretical relational diagram
of change-determining factors Source: Modified from Gullestrup (2006: 145)
Figure 7 A relationship diagram of four
determining factors and their im-
pacts on institutional transforma-
tion

120
The next step is to analyse degree of integration (DI) in terms of (i) integration of in-
formal institutions across actors and (ii) logical reflections across levels of institutions.
The more integration the cultures/institutions, the higher tendency the institutional
transformation will take place to react, either positively or negatively, towards the
change-initiating factors (Gullestrup 2006). Positive or negative reaction crucially cor-
responds with the CiF. The higher corresponding between the CiF and the existing
institutional settings, the higher probability is that positive reactions can be expected
(Gullestrup 2006), and vice versa (shown in Figure 6 as the above line and the un-
derneath line accordingly).
If the existing institutional settings are highly disintegrated, it is then essential to con-
sider culture-internal power relations (CIPR). CIPR refers to power of a specific group
to determine changes over other groups in the community. The decisive factor in a
highly disintegrated condition is degree of integration of the change initiatives to the
existing institutions of the most powerful actors.
Significant Shifts of Territorial Management In the Bangkok Metropolitan Re-
gion
The Bangkok Metropolitan Region (BMR) is located on the lower delta of the Chao
Phraya River Basin, where the river meanders through the city and extends to the
gulf of Thailand. Its territory is defined in accordance to the administrative boundary,
covering six provinces: Bangkok Metropolis, Nonthaburi, Pathumthani, Samutprakan,
Samutsakhon and Nakhonpathom (see Figure 8).
Since Bangkok was established as the capital of the kingdom in 1782, a small com-
mercial community covering an area of 4.14 km2 (BMA 2009) has developed into a
large diversified and growing industrial metropolitan region. The BMR now covers an
area of 7,761.50 km² and accommodates more than 10 million people (BMA 2009).
The region has continued to expand its connection to other more peripheral prov-
inces, particularly to the north and the east within the distance of 80 km from the
Bangkok CBD since 1990s, and consequently formulating the extended BMR.

121
Figure 8: Administrative boundary and settlements in the Bangkok Metropolitan Region in 2002
Source: Reproduced from the map provided by the National and Regional Planning Bureau, Department of Public Works and Town & Country Planning – DPT (2008)
The traditional Thai social and territorial organisations had been maintained until
around the turn of the nineteenth century. This includes the decentralised structure of
social organisation under the absolute monarchy and the Thai traditional economy,
which was based on subsistence economy. Radical shift of the Thai social and terri-
torial development started in the mid of the nineteenth century, underpinned by the
development objectives to modernise the country and the liberalised trade agree-
ments first signed in 1855 with the United Kingdom, followed by many other coun-
tries.
This resulted in a shift of the Thai economy from subsistence to export-oriented agri-
cultural economy integrating into the world market, and consequently the expansion
of land reclamation for rice production further a field, especially into swampy low-
lands. The modernisation of the country included changes in administrative structure,
social structure as well as political structure. Many strategies for territorial manage-
ment and regulation were introduced. The society dramatically adapted to the new
conditions for development through institutional arrangements. Impacts on spatial
development, resulting from these changes were not evident in this period; it became
more apparent in the following periods, soon after the World War time.
After World-War II, the country experienced another significant shift in institutions,
driven by three main forces: (i) financial and technical aid from international agen-
cies, such as the World Bank and the Asian Development Bank, (ii) dramatically in-
creasing investment of Sino-Thai communities due to political changes in China and

122
(iii) induced effects from the money spent by the American Army, which had military
camps in Thailand during the Vietnam War. These factors initiated a rise of middle
class with a high purchasing power, changing life styles of urban families and an in-
flux of rural immigrants drawn by economic development in Bangkok. These effects
were important factors driving rapid urban expansion in the BMR stared in the 1970s,
including the expansion to the former swampy lowlands initially reclaimed for agricul-
tural purposes.
The third significant shift occurred in the 1990s. This stated clearly first time in the
Seventh National Economic and Social Development Plan (1992-1996). It called for a
more balanced development, concerning social, economic and environmental as-
pects, fostered by global trends in sustainable development. Although spatial devel-
opment in this period is mainly a product of institutional arrangements in the previous
periods, significant changes have been observed both in planning sphere and spatial
outcomes.
3. Local Cultures And Territorial Development In Relation To Flood Risk Management
The results illustrating in this section are still on a process of development. It contains
not all the elements mentioned in the analytical framework. However, it provides a
good overview for an application of the proposed analytical framework to explain ac-
tual territorial development processes. The analysis is divided into three parts, ac-
cording to three development periods in the Bangkok Metropolitan Region (BMR).
The periods of development are classified according to major shifts in formal institu-
tions and their significant impacts on spatial transformation as earlier explained. They
are (i) the period of country modernisation (1850s-1940s), (ii) the beginning of inter-
national agencies and rapid growths period (1950s-1980s) and (iii) the period of re-
orientation towards balanced and sustainable development (1990s-2009).
3.1 The Period of Country Modernisation (1850s-1940s) Change initiatives and their reflections in formal institutions
This period was affected mainly by exogenous change-initiating factors, which led to
transformation of the modes of land control as well as capital and labour
(Phongpaichit and Baker 1995; Molle 2005). A significant shift in formal institutions
during this period was the administrative modernisation, taking a model from the co-
lonial apparatus of administration established by the British in India (Arghiros 2001).
The process started in 1892 to ensure effective central control of rural areas. Major
changes were related to new forms of territory division and the transformation of the
traditional administration to a more western-like ministerial system. A rather decen-
tralised with area-oriented development approach was reformed to a more central-
ised with sector-oriented development approach. As a result, common sector-
oriented development policies were created by the ministries at the national level and
implemented to the whole country.
Furthermore, a modern legislation for land ownership, of which occupancy by utilisa-
tion was replaced by title deeds, was introduced. As a result, land, which was recog-
nised as a factor of production, acquired value in itself and became a tradable com-
123
modity. Additionally, a new land policy that granted ownership of land to the land de-
velopers (concessionaires for canalised projects), subject to whether or not the land
has already been utilised and claimed, was introduced in the 1880s (Molle 2005).
This created an enormous expansion of land reclamation in the region. This expan-
sion processes were enhanced also by the gradual abolition of nai-phrai system (the
Thai traditional hierarchic social structure with some similarities and differences com-
paring to a feudal system) from 1874 to 1905, which generated increasing demand of
land. This is due to increasing of monetisation of the peasant economy brought by
the independence of phrai (commoners) and that (slaves).
After a few decades of launching the aforementioned new land policies, awareness
of potential inconsistencies in development approaches created by landlordism within
the Thai traditional mode of agricultural subsistence were raised. This led to the re-
orientation of the land policy in the beginning of the twentieth century. In 1936, the
government fixed the limit of land ownership at 50 rai (8 ha) per household (Peleggi
2007), aiming to prohibit large-scale concession of land and promote small-scale
concession to peasants.
Analysis of the conditioned factors and their influences on the change deter-mination
As mentioned earlier, the social, economic and political reforms in this period en-
couraged the rise of a middle class. The abolition of the nai-phrai system and the in-
fluences from increasing associations with westerners made the community a more
diverse society. Although the main player guiding development of the region re-
mained the state (or in other words, the aristocracy), private investors and civic soci-
ety gradually gained more power and involvement in territorial organisation. This cre-
ated a high probability to accept transferred technology as well as development con-
cepts and policies in the following periods.
The new land policies created different spatial development patterns in different parts
of the region. This depended mainly on relationships between physical conditions
and attributes of the community who occupied the land. Despite conflicts of the new
development approach with traditional conception as living in harmony with nature, a
development policy to transform swampy lowlands into cultivated lands using tech-
nology to drain and control water was implemented. This is mainly because of its
consistency to the institutions of the aristocrats, which were the most powerful in terri-
torial development of the region in this period. They played a role of both policy mak-
ers and land developers (concessionaires). They were western-trained technocrats,
and thus rather easily agreed and adopted those transferred ideas. Concessionaires
chose swampy lowlands, which remained free from occupation, as the priority areas
for development. Lands were then parcelled and rented out to tenant peasants who
were just free as a result of the abolition of phrai and that system a few years before
(Peleggi 2007). This led to urban expansion to unattended areas, starting in the
1880s.
However, this did not apply to the peasant groups, with which traditional conception
as living in harmony with nature was closely associated. This explains why they
chose the fertile with low flood prone as priority areas for their settlements, and left

124
the unfertile areas with high flood prone rented from the landlords after a few years
(Molle 2005). This is underpinned by their close relationship to physical conditions of
the land as a production factor for agricultural uses.
3.2 The Beginning of International Agencies and Rapid Growths Period
(1950s-1980s) Changes in conditioned factors resulted from development in the former period
As mentioned earlier, the former period created conditions that enhanced the rise of
middle class. It generated also an expansion of land reclamation, initially for agricul-
tural uses and became urbanised areas during this period. Settlements took place in
various high flood prone areas in the region. Those high flood prone areas were left
unattended mainly for speculative purposes at the beginning of this period; however,
urbanisation started taking place in such areas at the end of the period. This was
partly due to a great shift of the Thai economy from an export-based agricultural
economy towards a more service and manufacturing-oriented economy (Askew
2002). This reduced the level of integration regarding human-nature relationships
that was closely related to perceptions of people connecting to agricultural practices.
Change initiatives and their reflections in formal institutions
In this period, development direction was influenced by development approaches
suggested by the international development agencies and western-trained techno-
crats. These technocrats formed a significant professionalised subculture within the
customary bureaucratic polity (Askew 2002). This resulted in the establishment of
various planning agencies, including the National Economic and Social Development
Board (NESDB), the Board of Investment (BOI) as well as the Department of Public
Works and Town & Country Planning (DPT), in the 1950s. The new approaches were
associated with a higher level of controlling (PD) both in terms of human-nature rela-
tionships and human-human relationships with lower uncertainty avoidance (UA) and
degree of integration (In) of human and nature. This represented in a form of land
use plans with regulations that promoted development in flood risk areas with flood
prevention measures.
In addition, the National Economic and Social Development Plans during the 1980s
emphasised the significant of privatisation and increasing in engagement of private
sectors in development planning (NESDB 2008). This resulted in increasing of estab-
lishment and engagement of private agencies, such as chamber of commerce, in de-
velopment planning processes. In other words, spatial development during this pe-
riod was oriented by a new form of economic and political organisation in the Thai
society, led by market forces and the technocrat governments.
Analysis of the conditioned factors and their influences on the change deter-mination
In this period, the society consisted of diverse groups of actors in both planning situa-
tions and implementing situations. This created a high probability to accept the policy
initiatives. The contents of the new technocrat-oriented development approaches
were rather conform with the informal institutions of policy makers and upper-middle

125
class groups, which were the most influential groups in the society in shaping territo-
rial development in the region. Despite their inconsistency to physical conditions of
the proposed development areas in terms of flood risk, the plans were still taken into
actions.
How plans and projects were implemented was, however, another story. Rather than
shaping development through comprehensive planning, the state employed the pro-
vision of main transport networks and basic infrastructure as a principal measure to
encourage economic growth and direct spatial development (RIDA 1996). This de-
velopment strategy, of which only the main networks were constructed by the state
and the communities were in charge to extend those services to further areas on
their own, was rather similar to the strategies employed in the former periods. Yet
they associated with two main different features: (i) change in types of infrastructure
provision from canals excavation to road construction and (ii) change from commu-
nity-led organisation to private sector-led investments. This clearly showed inconsis-
tency between the change initiatives to formal institutions and the inherited informal
institutions of the state. In addition, the social structure already changed from a col-
lectivised to be more individualised society. Communities were not tightly bounded as
it was in a period of subsistence agricultural society anymore. This resulted in unde-
sired spatial development patterns created by applying a development approach that
required cooperation in a society that lacked of management cooperation.
Regarding spatial development outcomes, in the 1970s swamp areas along the new
highways, particularly to the north and the east of the existing city centre, were de-
veloped into housing estates. Settlements and development in those areas, which
were not suitable for development considering level of flood risk, took place respond-
ing to the increasing demand generated by the new middle-class households. This is
because their attributes in terms of integration to nature created by their occupation
are rather low. The changing attitudes towards land ownership as a mode of specula-
tion and saving also played an important role in spatial transformation of such flood
risk areas.
3.3 The Period of Reorientation Towards Balanced and Sustainable Develop-
ment (1990s-2009) Changes in conditioned factors resulted from development in the former period
Effects created by economic structural transformation in the former period to be more
manufacturing-oriented industry became more evident in this period. This shift re-
sulted in rapid expansion of manufacturing into peripheral areas in the region. It led
to dramatic transformation of high flood prone areas with large landholdings and
good accessibility, as a result of development policies and plans implemented in the
former periods, to facilitate the spatial demand mainly for industrial and large housing
estate developments. Many high flood prone areas were urbanised. Flood prevention
measures, such as dikes along riverbanks and polder systems, were widely con-
structed to prevent the highly economic concentration areas of the region. These
conditions lowered level of danger and uncertainty created by floods in those pre-
vented areas. By heightening the level of flood control (PD), it lowered level of inte-
gration between human and nature systems.

126
Development in the low flood prone areas did not experienced dramatic changes as it
did in the high flood prone areas. The major change was changes in land uses, from
agricultural dominant to mixed uses of agricultural and residential uses. This was
mainly due to a small landholding characteristic of the areas, which was inherited in
the areas as a result of the traditional land policies. However, the level of flood risk in
some of these areas became comparatively higher than other areas, which were
originally high flood prone. This was due to flood preventive measures to protect
such originally high flood prone areas that were developed for activities with higher
economic values than agriculture.
Considering the social structure, the number of middle class people and their power
in shaping development of the region essentially increased. This partly led to signifi-
cant shifts of formal institutions in this period as explained below.
Change initiatives and their reflections in formal institutions
The shifts in formal institutions in this period resulted from both endogenous change-
initiating factors (increasing in number and roles of middle class groups) and exoge-
nous change-initiating factors (sustainable development discourses - including green
movements, balanced development, and cooperative and participation planning). The
former extremely centralised state power gave way to a higher degree of devolution
and public engagement, as explicitly focused in the 1997 Constitution. These
changes are the consequences of the struggles of the middle class through key civic
movements in 1973 and 1992. The rise of the middle class resulted in a number of
changes, reflecting both directly in the governmental administrative reforms and
through indirect interventions. A number of NGOs-based for green movements and
public engagement initiated by the middle class were examples of such indirect in-
volvements. In other words, a bureaucratic polity was shifted towards a civic polity
and was apparently in sight since the 1990s (Arghiros 2001).
These driving forces resulted in the governance and ministerial reformations as well
as enacting of laws and regulations, aiming to enhance sustainable development.
Major relevant organisation and legislative changes regarding territorial development
in relation to flood risk management were, for examples, the Seventh National Eco-
nomic and Social Development Plan (1992-1996) – the first plan that explicitly ad-
dressed balanced and sustainable development concepts as the main objective for
development, the 1997 Constitution – which strongly enforced devolution, public par-
ticipation and citizen engagement processes, and other consequential actions, such
as the establishments and legislations of Local Administration Authorities and Minis-
try of Natural Resources and Environment, Environmental Protection Act 1992, Land
Appropriation Act 2000, Land Readjustment Act 2004, Land Development Act 2008.
Trends in spatial planning also moved towards a more civic approach. Apart from
controlling spatial development through phang-mueng-raum (a land use zoning plan
with restrictions), the Department of Public Works and Town & Country Planning
(DPT) began to cooperate with private investors through negotiation processes, soon
after the 2003 Land Readjustment Act was launched. Furthermore, the role of the
DPT under the central government was changed according to the 1999 Devolution
Act. The role of planning was greatly transferred to local authorities. The role of the
127
DPT was changed into preparing the regional and the national level as to provide
strategic development frameworks to the locals. This approach was well cooperated
by the local communities in which the customary social organisation was maintained.
Furthermore, the most recent significant change initiative was the introduction of the
philosophy of „sufficiency economy‟ by His Majesty the King. This concept was stated
first time as a development approach for the country in the Ninth National Economic
and Social Development Plan (2002-2006). The concept was applied not only to
economic field, but rather to a broader aspects of development. Regarding flood risk
management, it reflected in various new measures of dealing with flood at different
scales, such as using of flood retention at the regional scale, replanting mangrove at
the district scale and regulations and guidelines for green-blue-brown coverage ratio
at the plot scale.
Analysis of the conditioned factors and their influences on the change deter-mination
Considering the shifts of formal institutions in terms of human-nature relationships,
the concepts that increased level of integration (In) to nature resulted by the sustain-
able development concepts, were likely well accepted in planning situations. How-
ever, the degree of acceptance was different amongst actors. For instance, the DPT
noticeably applied the concepts in the most recent strategic plan for the BMR; the
preventive measures, however remained dominant in flood risk management ap-
proach of the Royal Irrigation Department. In implementing situations, the degree of
acceptance varied also amongst different actors. This highly connected to their at-
tributes of community. Actors whom their occupations were closely related to nature
were likely to accept the new approach more than actors associated with urban life
styles. In addition, those who lived in well flood-protected areas were less likely to
take the new approach as necessary.
Nevertheless, explanation of the rather high degree of acceptance of new ap-
proaches that encourage less control (PD) over nature and being more integrated
(In) to nature is quite complicate. Analysis of spatial outcomes alone does not inform
whether the acceptance resulted from the consistency of informal institution regard-
ing human-nature relationships or human-human relationships. This is doubtful be-
cause the concepts were introduced by H.M. the King, which is greatly respectful in
the society; they are also conform with the conceptions of human-nature relation-
ships representing in Buddhism – the main religious of Thai people. Further investi-
gation on relationships between effects of informal institutions on decision-makings
thus appears necessary.
Regarding the shifts of formal institutions in terms of human-human relationships, the
concepts of devolution and public engagement in planning, which lowered the level of
control (PD) and encouraged a better integration in the society (In), were currently
not quite well implemented. This was likely to cause by inconsistency between the
policy initiatives and the dominant informal institutions in the society. The customary
social organisation at all scales, from a family to the national scale, was based on a
high power distance (PD) model with different levels of integration (In) of each social
group. The inconsistency regarding power distance to the constitutional level of insti-

128
tutions of the society thus played a crucial role in preventing successful changes to
take place, despite the significant changes at the structural level.
4 Observations and Conclusions
This paper presents preliminary results of the first test of applicability of the proposed
analytical framework to explain the actual phenomena, taking territorial development
regarding flood risk management in the Bangkok Metropolitan Region (BMR) as a
pioneer case for analysis. The analysis interpreted cultures and their effects on terri-
torial development processes, mainly from spatial outcomes as well as organisation
and policy analysis. This may involve significant deviations resulting from the author‟s
interpretations. Nevertheless, the analysis shows that the proposed analytical framework tends to be a promising approach to explain territorial development processes from a cultural perspective, despite its potential subjectivity resulted by heuristic interpretation. It shows a high correlation between the four conditioned factors and development out-comes, both in terms of development policies and plans and spatial outcomes. The three cultural dimensions employed to categorise cultures regarding flood risk man-agement also help to facilitate a better understanding on determination of policy ac-ceptance according to the four change-determining factors proposed by Gullestrup (2006).
Further investigation by other methods that may help improving subjectivity of cultural
interpretations, particularly of informal institutions, appears necessary. This includes
interviews of focus groups, such as planners, policy makers and real estate develop-
ers, and questionnaires to civic sectors living in focused areas. In addition, more
case studies and issues for investigation of effects of local cultures in territorial de-
velopment processes would help to improve and assure the validity and applicability
of the proposed analytical framework for policy analysis to apply to a broader scope
of territorial management in diverse institutional settings and cultural contexts.
References Aquaterra. 2009. Aquaterra statement [Online]. Amsterdam RAI. Available at:
http://www.aquaterraforum.com/_upload/aquaterra2009/docs/AQUATERRA%20STATEMEN
T_final.pdf [Accessed August 2009].
Arghiros, D. 2001. Democracy, development and decentralization in provincial Thailand.
Richmond: Curzon.
Askew, M. 2002. Bangkok: Place, Practice and Representation. New York: Routledge.
BMA. 2009. Bangkok [Online]. Bangkok Metropolitan Administration (BMA). Available at:
http://www.bangkok.go.th/en/index.php [Accessed May 2009].
de Jong, M., Lalenis, K. and Mamadouh, V. 2002. The theory and practice of institutional
transplantation : experiences with the transfer of policy institutions. Dordrecht ; London:
Kluwer Academic Publishers.
Douglas, M. M. 1970. Natural symbols: explorations in cosmology. London: Barrie & Rockliff,
the Cresset Press.
DPT. 2008. Strategic Regional Plan: Bangkok and Vicinities. Department of Public Works
and Town & Country Planning (DPT), Ministry of Interior. Bangkok.

129
Folke, C., Hahn, T., Olsson, P. and Norberg, J. 2005. Adaptive governance of social-
ecological systems. Annual Review of Environment and Resources, 30), pp. 441-473.
Friedmann, J. 2005. Planning cultures in transition. In Sanyal, B. (ed.) Comparative planning
cultures. New York ; London: Routledge, pp.29-44.
Gullestrup, H. 2006. Cultural analysis : towards cross-cultural understanding. Aalborg:
Aalborg University Press ; Copenhagen : Copenhagen Business School Press.
Hofstede, G. H. and Hofstede, G. J. 2005. Cultures and organizations : software of the mind.
New York ; London: McGraw-Hill.
Knieling, J. r. and Othengrafen, F. 2009. Planning cultures in Europe : decoding cultural
phenomena in urban and regional planning. Farnham: Ashgate.
Molle, F. o. 2005. Elements for a political ecology of river basins development: The case of
the Chao Phraya river basin, Thailand. In: The 4th Conference of the International Water
History Association, December 2005. Paris. Available at:
http://www.iwmi.cgiar.org/assessment/files_new/research_projects/River_Basin_Developme
nt_and_Management/Elements_Chao%20Phraya%20IWHA%20Paris2_Molle.pdf [Accessed
19th April 2009].
NESDB. 2008. The National Economic and Social Development Plan [Online]. Office of the
National Economic and Social Development Board (NESDB). Available at:
http://www.nesdb.go.th/Default.aspx?tabid=62 [Accessed 17th May 2009].
Ostrom, E. 2005. Understanding institutional diversity. Princeton, N.J: Princeton University
Press.
Peleggi, M. 2007. Thailand the worldly kingdom. London: Reaktion.
Phongpaichit, P. and Baker, C. 1995. Thailand: Economy and politics. Oxford University
Press.
RIDA. 1996. OECF Research Paper No.11. The Research Institute of Development
Assistance (RIDA). Tokyo: The Overseas Economic Cooperation Fund (OECF).
Sanyal, B. 2005. Comparative planning cultures. New York ; London: Routledge.
Thompson, M., Ellis, R. and Wildavsky, A. 1990. Cultural theory. Boulder, Colo: Westview Press.

130
Breathing Walls Concept for Low Cost Comfortable Housing in Developing Countries
Sadiq Ali Centre for Sustainable Technologies, Block 26, University of Ulster at Jordanstown, BT37 0QB. U.K [email protected], [email protected]
Neil Hewitt Centre for Sustainable Technologies, Block 26, University of Ulster at Jordanstown, Shore Road, BT37 0QB. U.K [email protected]
Philip Griffiths Centre for Sustainable Technologies, Block 26, University of Ulster at Jordanstown, BT37 0QB. [email protected]
Yigsaw Yohanis Centre for Sustainable Technologies, Block 26, University of Ulster at Jordanstown, BT37 0QB. U.K [email protected]
Sina Rezwani Centre for Sustainable Technologies, University of Ulster, Block 26, Jordanstown, Shore Road, Belfast, BT37 0QB, U.K [email protected] Abstract: Most of the Developing countries are located astride the equator inheriting a hot and dry climate. Their location also makes them water deficient because of low rain. Jhal Magsi is one such location in Pakistan where the temperatures shoot up to 45-47 degrees Celsius in summer days and above 26 degrees during night. Inhabi-tants dehydrated during day hardly find environment to have a comfortable night. In such a situation „breathing walls‟ concept can help cool down houses made from lo-cal material. Normal Burnt bricks are used with mud and hay for plastering and ce-menting with a 3-4 inches gap between the inner and the outer wall gives a comfort-able living environment without any extra energy requirement. During day the outer walls get heated from the direct sun rays. Solar heat absorbed by the outer bricks warms and expands the air in the gap reducing the density and ability to transfer the heat to the inner wall. At night, the temperature falls outside thus cooling the outside wall, consequently reducing the temperature and reversing the direction of thermal conductivity in the outer wall bricks. The air inside the walls cools down as well. This temperature drop contracts the air and outer cold air gets inside the walls due to vac-uum created by the contraction of inside air through a vent placed at the top of the

131
outside wall. The gap between the walls helps contain the moisture and cold air dur-ing the day repeating the cycle. In addition, the wind catchers also help in developing limited cooling effect. few such accommodations were developed in 1992, 2000 and 2005 has proved that a temperature drop of 10-15 degrees Celsius can be achieved by breathing walls concept without cost exceeding 5-10% for the overall project. Breathing walls concept can help develop comfortable eco-friendly low cost housing in the developing as well as in developed countries by reducing the carbon footprint and recurring energy requirement for cooling or warming the houses. Key words: Breathing walls, eco-friendly, low-cost housing, cavity walls, developing countries, poverty line.
1 Introduction and Initial Concept Development 1992
This paper is based on simple and common practices in rural areas in developing
countries for communities that may be living below poverty line (Tomev 2010). In my
opinion „Poverty can be defined as a situation when any human chooses to deviate
from the ethical values and corresponding actions for acquiring food to maintain the
relationship of body and soul‟. This may be because of political, environmental or any
other reason. Morality is the first victim of poverty in most cases. Living in a comfort-
able house is everyone‟s dream. For this reason this paper will restrict to „comfortable
and affordable dwellings for the poor‟. Results from this work can be applied for multi-
storey buildings as well where possible. Realizing the need for discovering, design-
ing, implementing, comfortable and affordable living environment, this paper is being
presented as my personal experience in designing and constructing energy efficient
housing for the poor.
In constantly changing climate resulting in global warming, arising from the use of
fossil fuel has magnified thermal comfort problem. Oil producing countries may be
able to provide cheaper fuel to their citizens but the countries that have to import fuel
for energy are facing increasing energy cost thereby a difficulty to provide comfort-
able living environment for their inhabitants. This aspect alone is forcing the poor
communities to switch to alternate methods of making homes comfortable. Cost of
energy and carbon footprint are increasing in the construction industry in manufactur-
ing building materials like steel, cement, glass, plastics etc. Transportation cost to the
construction site is also on the rise due to increasing fossil fuel prices. Although sci-
entific advancements have improved efficiencies in almost all manufacturing proc-
esses; for the poor, it is still unaffordable to use industrially products for thermal com-
fort. Hence they have to resort to more basic methods of construction for achieving
thermal comfort.
In one of the community projects in Pakistan, a 10000sqft club house was designed
in a conventional manner. The climatic conditions demanded an air conditioned envi-
ronment. The community was donated with an air conditioning plant. However, the
plant‟s capacity was just half the requirement and funds were not available for an ad-
ditional plant. This challenge had created an opportunity for improving the design of
the club house. „Necessity is the mother of invention‟ is a common proverb in local
Pakistani language; I wish to add „and innovation is the father‟. This shortfall of air

132
conditioning plant presented an opportunity to improve the design midway during
construction. The idea of breathing wall was created and applied by addition of a 9
inches wall on the sun-side of the building and a soil filled roof top. This created an
environment of protecting all walls and the roof from direct sunlight. The problem was
resolved partially and the structure stands today saving recurring energy cost in par-
ticular and the cost of electricity production and carbon footprint in general. A similar
concept was adopted in designing a house in the year 2000 without using a soil filled
roof. This was a well organised practice and yielded better results.
Thermal Comfort is considered imperative to improve indoor environments in order to
optimise performance depending upon the function (work or leisure). The basic idea
is to maximise human resource output. At leisure or home when resting, thermal
comfort ensures recuperating energy by a sound sleep in a comfortable room tem-
perature, low noise levels, and quality air circulation; to ensure better oxygen levels
for recovering lost body energy from the previous day‟s work. This will ensure an op-
timised output at work resulting in improved GDP. An investigation carried out by a
team of researchers at Rensselaer Polytechnic Institute in the USA has shown a di-
rect and measureable relationship between individual comfort control and efficiency
by use of environmentally responsive workstations (ERW). The results had shown an
increase in output by 2%. Human body is an energy system that responds to internal
energy levels to the outer environmental conditions. Controlling perspiration, tem-
perature and humidity, human body can function at optimum levels.
2 History of Materials in Construction
The quest of a safe, affordable and comfortable home dates back to 7th century BCE (Pletcher 2009). It actually should have started with first family on planet Earth but those who believe in the Great Flood also accepts that much of manmade houses would have washed away without leaving evidence. Natural and readily available shelters were a common dwelling to offset adverse climatic conditions (Santamouris, Asimakopoulos 1996). Timber, Clay and subsequently clay-lime mortar using stones is the oldest cementing and construction material. Steel, plastics, glass, Portland ce-ment etc are now a common construction material. Materials used in rural areas are either burnt or sunburnt bricks and/or commonly renewable materials that either be-longs to the organic family including timber; and different types of soils in several combinations with some addition of hay, lime, and cow dung etc depending upon the cost and convenience of supply. Uses of the above are as follows;
Figure 9 Clay mortar as flooring and Wall plaster
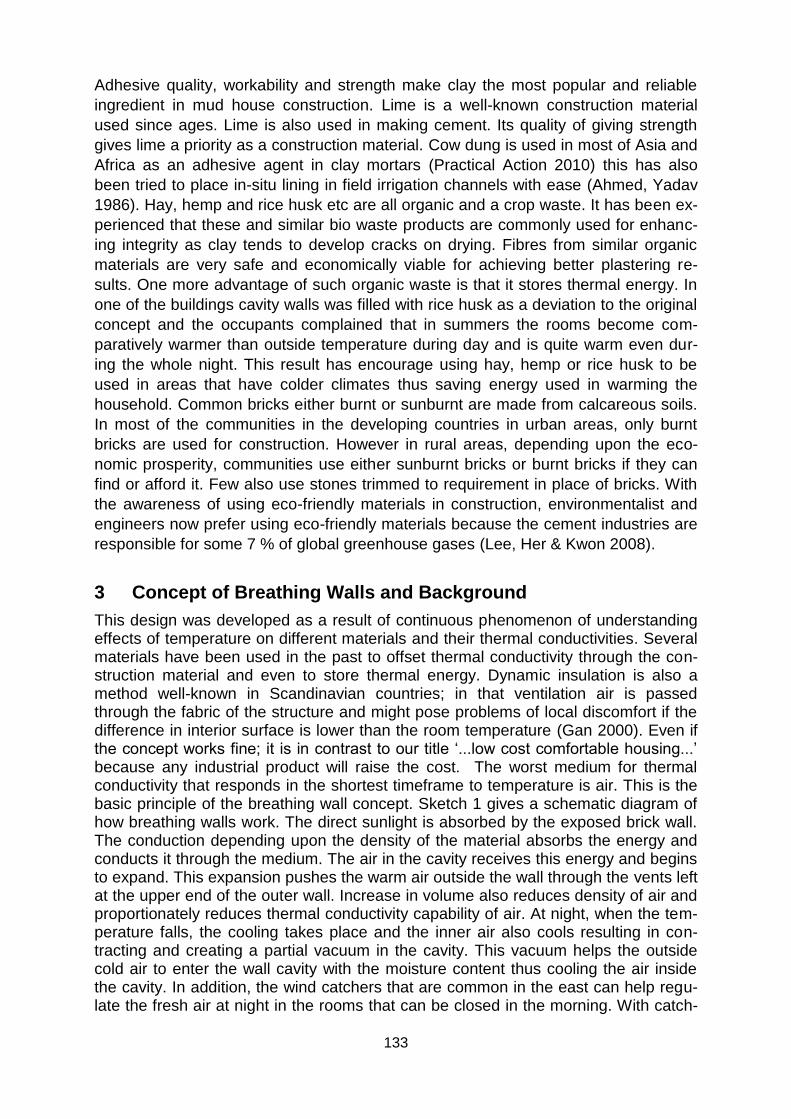
133
Adhesive quality, workability and strength make clay the most popular and reliable
ingredient in mud house construction. Lime is a well-known construction material
used since ages. Lime is also used in making cement. Its quality of giving strength
gives lime a priority as a construction material. Cow dung is used in most of Asia and
Africa as an adhesive agent in clay mortars (Practical Action 2010) this has also
been tried to place in-situ lining in field irrigation channels with ease (Ahmed, Yadav
1986). Hay, hemp and rice husk etc are all organic and a crop waste. It has been ex-
perienced that these and similar bio waste products are commonly used for enhanc-
ing integrity as clay tends to develop cracks on drying. Fibres from similar organic
materials are very safe and economically viable for achieving better plastering re-
sults. One more advantage of such organic waste is that it stores thermal energy. In
one of the buildings cavity walls was filled with rice husk as a deviation to the original
concept and the occupants complained that in summers the rooms become com-
paratively warmer than outside temperature during day and is quite warm even dur-
ing the whole night. This result has encourage using hay, hemp or rice husk to be
used in areas that have colder climates thus saving energy used in warming the
household. Common bricks either burnt or sunburnt are made from calcareous soils.
In most of the communities in the developing countries in urban areas, only burnt
bricks are used for construction. However in rural areas, depending upon the eco-
nomic prosperity, communities use either sunburnt bricks or burnt bricks if they can
find or afford it. Few also use stones trimmed to requirement in place of bricks. With
the awareness of using eco-friendly materials in construction, environmentalist and
engineers now prefer using eco-friendly materials because the cement industries are
responsible for some 7 % of global greenhouse gases (Lee, Her & Kwon 2008).
3 Concept of Breathing Walls and Background
This design was developed as a result of continuous phenomenon of understanding effects of temperature on different materials and their thermal conductivities. Several materials have been used in the past to offset thermal conductivity through the con-struction material and even to store thermal energy. Dynamic insulation is also a method well-known in Scandinavian countries; in that ventilation air is passed through the fabric of the structure and might pose problems of local discomfort if the difference in interior surface is lower than the room temperature (Gan 2000). Even if the concept works fine; it is in contrast to our title „...low cost comfortable housing...‟ because any industrial product will raise the cost. The worst medium for thermal conductivity that responds in the shortest timeframe to temperature is air. This is the basic principle of the breathing wall concept. Sketch 1 gives a schematic diagram of how breathing walls work. The direct sunlight is absorbed by the exposed brick wall. The conduction depending upon the density of the material absorbs the energy and conducts it through the medium. The air in the cavity receives this energy and begins to expand. This expansion pushes the warm air outside the wall through the vents left at the upper end of the outer wall. Increase in volume also reduces density of air and proportionately reduces thermal conductivity capability of air. At night, when the tem-perature falls, the cooling takes place and the inner air also cools resulting in con-tracting and creating a partial vacuum in the cavity. This vacuum helps the outside cold air to enter the wall cavity with the moisture content thus cooling the air inside the cavity. In addition, the wind catchers that are common in the east can help regu-late the fresh air at night in the rooms that can be closed in the morning. With catch-
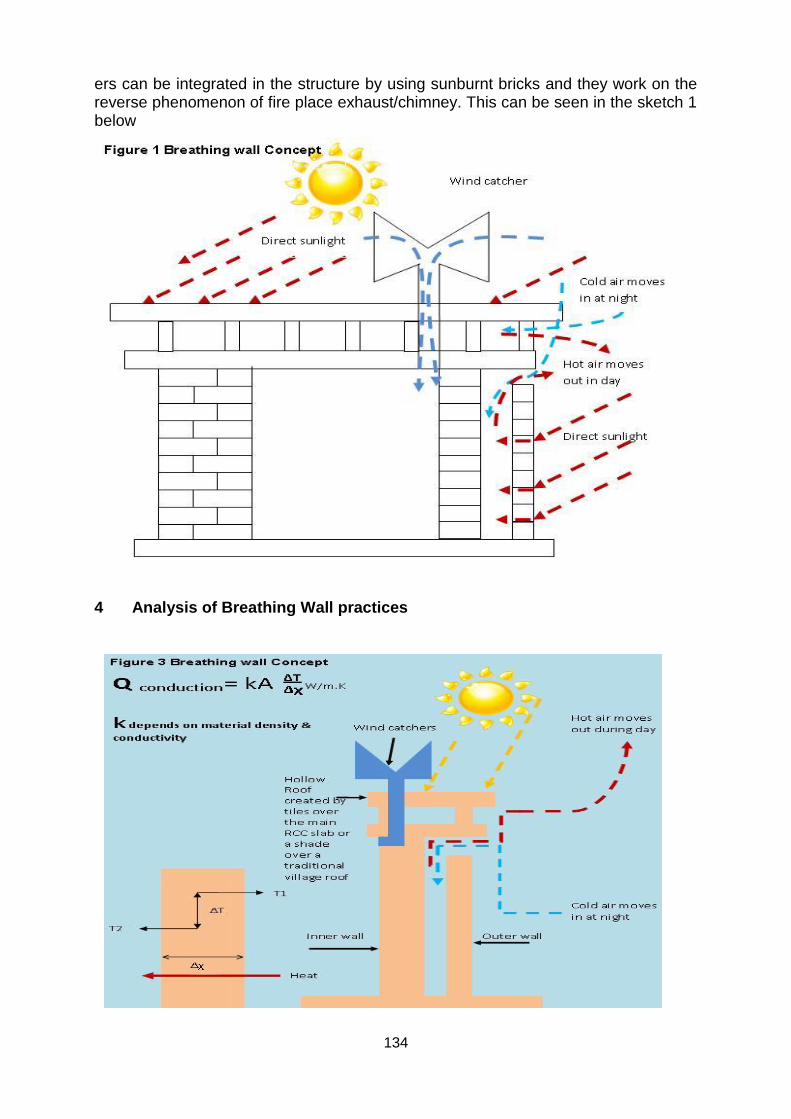
134
ers can be integrated in the structure by using sunburnt bricks and they work on the reverse phenomenon of fire place exhaust/chimney. This can be seen in the sketch 1 below
4 Analysis of Breathing Wall practices

135
It can be seen from Table-1 that brick‟s conductivity is 0.72, oak is still better with
0.17, glass is even better with 0.043 but the best material to create a cavity that re-
sists thermal conductivity is the air with just 0.026. Further, urethane rigid foam is
equal in thermal conductivity with air; however, producing foam and using it is still
expensive for the poor as it is an industrial product. Also, it will have embodied en-
ergy and transportation cost involved apart from the addition of polluting the envi-
ronment.
Table: 1 Thermal Conductivities of Some Materials at Room Temperature
Material Thermal Conductivity
Material Thermal Conductivity
Material Thermal Conductivity
Air 0.026 Silver 429 Copper 401
Urethane Rigid foam*
0.026 Aluminium 237 Iron 80.2
Mercury 8.4 Glass 1.4 Brick 0.72
Water 0.613 Human Skin 0.37 Wood (Oak) 0.17
Helium 0.152 Soft rubber 0.13 Glass fibre 0.043
Source: (Ҫ engel, Boles 2007) *embodied energy, cost of material and transportation
Table 2 gives the emissivity value of the materials. It can be seen that choice of col-
ours can also play a vital role in reducing the temperature of the walls exposed to the
direct sunlight. Red brick can be improved to have a lighter colour that may absorb
lesser thermal energy. Similarly, in concrete walls admixtures can be used to reduce
concrete density and further reduce the coefficient of thermal conductivity. It is a mat-
ter of choice with respect to location and climatic conditions that engineers and archi-
tects may design to get best possible response from the materials and the colour
combinations.
Table: 2 Emissivity of Some Materials at 300° K
Material Emissiv-ity
Material Emissiv-ity
Material Emissiv-ity
Aluminium foil 0.07 Black paint 0.98 wood 0.82-0.92
Anodised Alumin-ium
0.82 White paint 0.90 Soil 0.93-0.96
Polished copper 0.03 White paper 0.92-0.97 Water 0.96
Polished gold 0.03 Asphalt pave-ment
0.85-0.93 Vegeta-tion
0.92-0.96
Polished silver 0.02 Red Brick 0.93-0.96
Polished stainless steel
0.17 Human skin 0.95
Source: (Ҫ engel, Boles 2007)
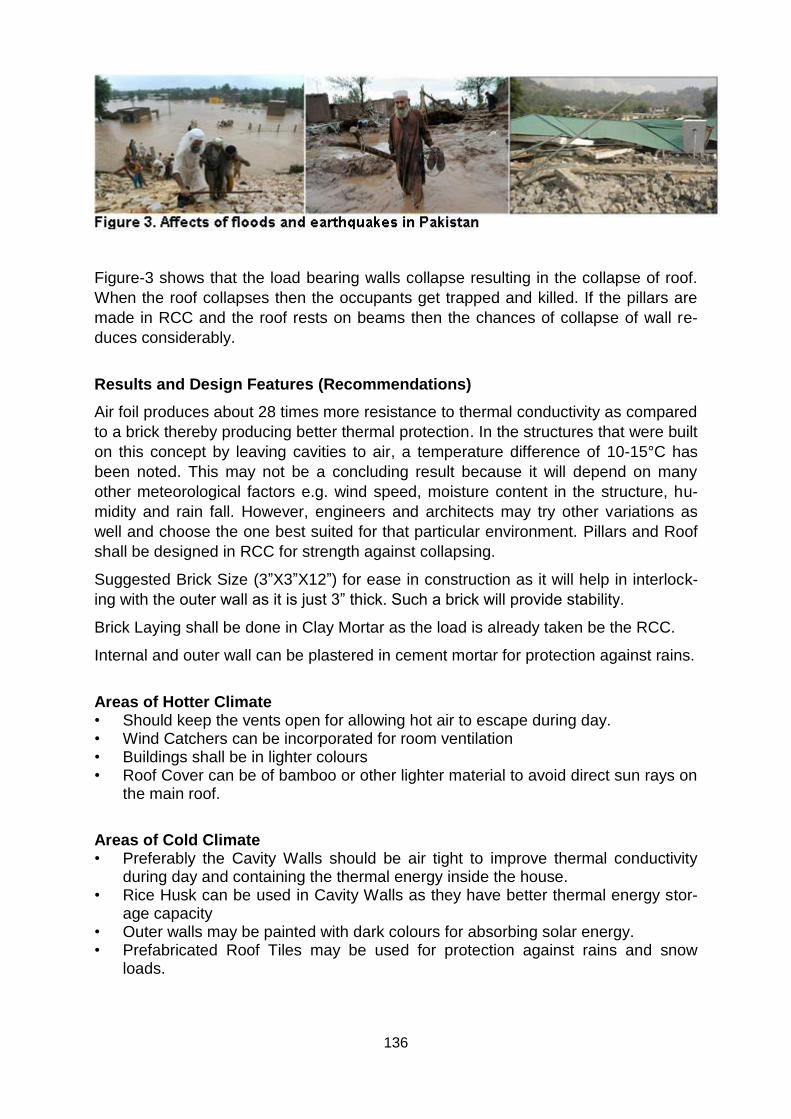
136
Figure-3 shows that the load bearing walls collapse resulting in the collapse of roof.
When the roof collapses then the occupants get trapped and killed. If the pillars are
made in RCC and the roof rests on beams then the chances of collapse of wall re-
duces considerably.
Results and Design Features (Recommendations)
Air foil produces about 28 times more resistance to thermal conductivity as compared
to a brick thereby producing better thermal protection. In the structures that were built
on this concept by leaving cavities to air, a temperature difference of 10-15°C has
been noted. This may not be a concluding result because it will depend on many
other meteorological factors e.g. wind speed, moisture content in the structure, hu-
midity and rain fall. However, engineers and architects may try other variations as
well and choose the one best suited for that particular environment. Pillars and Roof
shall be designed in RCC for strength against collapsing.
Suggested Brick Size (3”X3”X12”) for ease in construction as it will help in interlock-
ing with the outer wall as it is just 3” thick. Such a brick will provide stability.
Brick Laying shall be done in Clay Mortar as the load is already taken be the RCC.
Internal and outer wall can be plastered in cement mortar for protection against rains.
Areas of Hotter Climate • Should keep the vents open for allowing hot air to escape during day. • Wind Catchers can be incorporated for room ventilation • Buildings shall be in lighter colours • Roof Cover can be of bamboo or other lighter material to avoid direct sun rays on
the main roof.
Areas of Cold Climate • Preferably the Cavity Walls should be air tight to improve thermal conductivity
during day and containing the thermal energy inside the house. • Rice Husk can be used in Cavity Walls as they have better thermal energy stor-
age capacity • Outer walls may be painted with dark colours for absorbing solar energy. • Prefabricated Roof Tiles may be used for protection against rains and snow
loads.

137
5 Community Housing and Application in High Rise Buildings
In community housing the same method can be used by making multi-storey houses.
The framework can be made in reinforced cement concrete and the walls may be
filled in by using cavity method. For maintaining strength from the exposed faces vul-
nerable to weathering and to maintain the thermal comfort or reducing the air condi-
tioning requirement, outer walls may be plastered in cement mortar. Clay-lime mortar
may be used for brick laying for the inner walls and may be plastered with cement
mortar for finer finish. Lime mortar can also be used for inner plaster.
For high rise buildings in developed countries it is important to use lighter and
stronger material for walls. Construction industry now produces many admixtures that
can give lightweight concrete. Prefabricated thin RCC cavity walls can be used in
high rise buildings. Cavities shall be used for services like water and electricity sup-
ply.
In cold weather locations thermal energy can be stored in high rise buildings by filling
the cavities. The filler material should have capacity to retain temperature, this can
be achieved if cavities are filled with rice husk, hay or hemp packed in small bags for
easy handling. It is important to note that hemp, hay or rice husks are better off in
natural packing as compared to pressed mechanically; as it may increase thermal
conductivity with the increase in density. Locations that have comparatively hotter
climate shall leave the cavities empty for air. It is important to note that air has the
least thermal conductivity that further decreases with increase in temperature. The
temperature rise in air increases the volume and forces the air out of the wall result-
ing in reduced density and decreased ability of thermal conductivity. This leaves the
inner walls comparatively cooler because expansion is also a cooling process.
6 MIPALCON- The Way Forward-Policy Making and Implemen-tation
The recent disasters in Asia resulting in thousands of deaths due to poor housing
designs (mostly not designed by qualified civil engineers and architects) demands
that civil engineers, infrastructure planners and policy makers shall become respon-
sible for ensuring sufficient strength and quality of housing and therefore a need was
felt to share my experience with others in this field.
Almost all the developing countries have one common factor; and that is illiterate and
corrupt leadership. Efficient housing policies cannot be developed by politically moti-
vated illiterate and inefficient bureaucrats. Implementing any policy by them at grass
root level is a far cry. When a calamity strikes, international donor agencies rush to
help people in the affected areas. By then, damage to life has been done.
Whenever the funds are allocated from any national or international source, they
never reach the deserving. The international community keeps spending without the
fruits being delivered to the poor. It is especially true in the case of international aid
for the poor. I strongly suggest in the interest of the donors and the needy; that the
aid shall be associated with certain conditions of design and deliverance. The donor
agencies shall appoint their representatives to deliver rather than asking the govern-
ments to ensure deliverance. Conferences like MIPALCON 2010 can help us stan-

138
dardise the designs for community housing and all aspects of a housing colony in-
cluding and not restricting to waste management, clean water supply, health centres,
primary and secondary schools and employment. It is important that the aid-package
shall impart training for the human resource to produce skilled labour that can be
used for reconstruction of the housing through training centres. The same sufferers
can be used as labour for reconstruction and can be paid. This will help them earn a
living through labour and will maintain their interest in building the community. Estab-
lishing a cottage industry can also be part of the reconstruction plan that can help the
poor to live a respectable life. Associating local academic institutions and their re-
search and development to create sustainability should be a vision that MIPALCON
shall always have. This will help us to globally contribute to environmental improve-
ment and reduction in the production of carbon dioxide to the atmosphere and pov-
erty. Most of the scientist and researchers are of the opinion that future energy de-
mand will double in the developing countries as compared to the developed countries
(Rotty 1979). This approach will help reduce future carbon footprint in developing
countries.
7 Conclusion
Engineering and precisely civil engineering is to strike a fine balance between
strength, aesthetics, cost; and aspect of sustainable environment. It can be seen that
switching to breathing wall concept can help us reduce the cost of the house and
also add to the improvement of the environment together with reducing our energy
demand in the developing and the developed world if it can be adopted as a standard
practice for providing community houses to the needy. Planet earth has transformed
into global village as a result of scientific advancements even then we have failed to
provide a respectable and safe shelter to the poor who toil sweat to produce that
grain of wheat. I will conclude with the quote by Marion Hubbert King „our ignorance
is not so vast as our failure to use what we know’ (Hubbert 1956). I wish this design
and the suggested concept that can also be used for multi-storey buildings be ac-
cepted as a standard practice with the developed and the developing countries. This
alone will reduce the carbon footprint to a considerable extent. In most of the analy-
ses carried out for construction industry, the embodied energy is seldom taken into
account for calculating carbon dioxide. Breathing walls concept has emerged as a
logical development from the experience of construction; the suggested method for
multi-storey buildings is recommended to the architects and the engineers. Any addi-
tion or variation is possible depending on the affordability, ingenuity and aestheticism
of the designer/user.
References Ahmed, A. & Yadav, R.C. 1986, "A new method for lining of field irrigation channels", Agricul-
tural Water Management, vol. 11, no. 3-4, pp. 343-348.
Gan, G. 2000, "Numerical evaluation of thermal comfort in rooms with dynamic insulation",
Building and Environment, vol. 35, no. 5, pp. 445-453.

139
Hubbert, M.K. 1956, Nuclear Energy And The Fossil Fuels, Shell Development Company,
Huston, Texas.
Lee, K., Her, J. & Kwon, S. 2008, "Red clay composites reinforced with polymeric binders",
Construction and Building Materials, vol. 22, no. 12, pp. 2292-2298.
Pletcher, K. 2009, , History of Construction- Great Wall of China [Homepage of Encyclopedia
Britannica], [Online]. Available: http://www.britannica.com/EBchecked/topic/243863/Great-
Wall-of-China/92931/History-of-construction [2010, 20-07-10].
Practical Action 2010, 2010-last update, Alternatives to Portland Cement - Technical Infor-
mation Online - Practical Answers [Homepage of Practical Action, Schumacher Centre for
Technology & Development, Bourton on Dunsmore, Rugby CV23 9QZ, UK], [Online]. Avail-
able:
http://practicalaction.org/practicalanswers/product_info.php?products_id=208{1}1&attrib=1
[2010, 8/13/2010].
Rotty, R.M. 1979, "Growth in global energy demand and contribution of alternative supply
systems", Energy, vol. 4, no. 5, pp. 881-890.
Santamouris, M. & Asimakopoulos, D. 1996, Passive Cooling of Buildings, First edn, James
& James (Science Publishers) Limited, London.
Tomev, L. 2010, 2010-last update, Social partners agree new poverty line for 2010 [Home-
page of Institute for Social and Trade Union Research (ISTUR) Bulgaria], [Online]. Available:
http://www.eurofound.europa.eu/eiro/2009/12/articles/bg0912029i.htm [2010, 7/20/2010].
Ҫengel, Y.A. & Boles, M.A. 2007, Thermodynamics- An Engineering Approach Sixth Edition,
Sixth edn, McGraw-Hill, Singapore.
140
Energy Efficient Homes in Pakistan: Challenges and Potential for Energy Efficient
Sustainable Developments
Muhammad Riaz Akbar University of Ulster, Belfast, UK BT37 0QB [email protected]
Neil Hewitt University of Ulster, Belfast, UK BT37 0QB [email protected]
George Heaney
University of Ulster, Belfast, UK BT37 0QB [email protected]
Lay-Cheng Lim
University of Ulster, Belfast, UK BT37 0QB [email protected]
Syeda Shabnum Najaf The Urban Unit, P&D Department, Punjab, Pakistan [email protected]
Sadia Latif (Urban Planner)
Lahore Development Authority (LDA), Pakistan [email protected] Abstract: This research paper aims to analyse energy efficiency provisions for low carbon dwellings within the current legal and regulatory framework and identifies the challenges to such developments. The outcomes of this study are recommendations for the necessary policy responses to better enable Energy Efficient Homes in Paki-stan. Pakistan is facing the challenges of acute energy shortages. The local energy re-sources are minimal, and the country is heavily dependent on the import of fossil fu-els to meet domestic needs and support economic growth. However the increasing divide between the demand and supply of energy has decelerated the pace of eco-nomic development and industrialisation of the country. The domestic sector is re-sponsible for twenty percent (20%) of the total energy consumption. This level of en-ergy consumption is due to the low levels of passive energy supply, utilisation of poor building materials, urban design challenges and energy intensive sources for thermal comfort which are allowed within the current legal and regulatory framework. The main instruments to achieve energy efficient and low carbon dwellings are facing

141
challenges such as weak and poorly defined legal and regulatory frameworks, institu-tional and individual delivery capacity issues and poor enforcement mechanisms from the development agencies. There is need to adopt a holistic approach to im-prove the prevailing legal and regulatory framework, the capacity and enforcement mechanisms, on the energy efficiency and environmental performance. This will lead to lower energy consumption within the housing sector in Pakistan and an improved energy efficiency awareness and culture in the modern development initiatives. Key Words: Efficiency, Passive design, Legal and Regulatory, Capacity, Sustainable Homes
1 Introduction
“A low energy path is the best way towards a sustainable future” (WCED, 1987). This
path reflects a paradigm shift from traditional to energy efficient developments whilst
ensuring a balanced interaction among environmental, social and economic concerns
(Bell and Morse, 2003). The concept of sustainable development has gained momen-
tum and significant recognition in order to avoid expected threats of climate change
and fuel poverty across the globe. But there is still a long way in front of the policy
makers, planners, environmentalists and even the general public to achieve the req-
uisite targets of sustainable developments to improve the quality of life for current
and future generations (Khator and Fairchild, 2006). Currently, the world is con-
fronted with the challenges of higher energy consumption, CO2 emissions and unsus-
tainable development in the housing sector. The intentions of nations around the
globe are quite evident from their policies, legal and regulatory frameworks, research
and development initiatives and international commitments to engage into efforts to
conserve energy. A number of initiatives, policies and plans have been globally dis-
cussed and adopted not only to conserve energy but also to safe guard the environ-
ment from the severe impacts of climate change. The focus of sustainable economic
development is to utilise nation‟s limited resources in a sustainable, energy efficient
and environment friendly way.
Pakistan is facing the challenges of acute energy shortages (Raja et al., 1996). The
local energy resources are insufficient for its needs and the country is heavily de-
pendent on the import of fossil fuels. The intermittent electricity supply and un-
planned load shedding are becoming a culture in Pakistan whilst domestic activities
and economic growth demands excessive and continuous supply of energy. The total
installed power generation capacity in Pakistan is 19560 MW (CCP, 2010). The Wa-
ter and Power Development Authority (WAPDA), Pakistan Atomic Energy Commis-
sion (PAEC) and Karachi Electric Supply Corporation (KESC) are the responsible
agencies for power generation, transmission and distribution. About 31 % of the in-
stalled capacity is generated by Independent Power Producers (IPPs) (CCP, 2010).
Continuous and adequate energy supply is the traditional pre-requisite to ensure sus-
tainable economic growth in the country. Currently, only 65-70% of the total popula-
tion has access to electricity and the country is facing serious power shortages up to
6000 MW (CCP, 2010). The big gap between the demand and supply of energy has
decelerated the pace of economic development and industrialisation in the country.
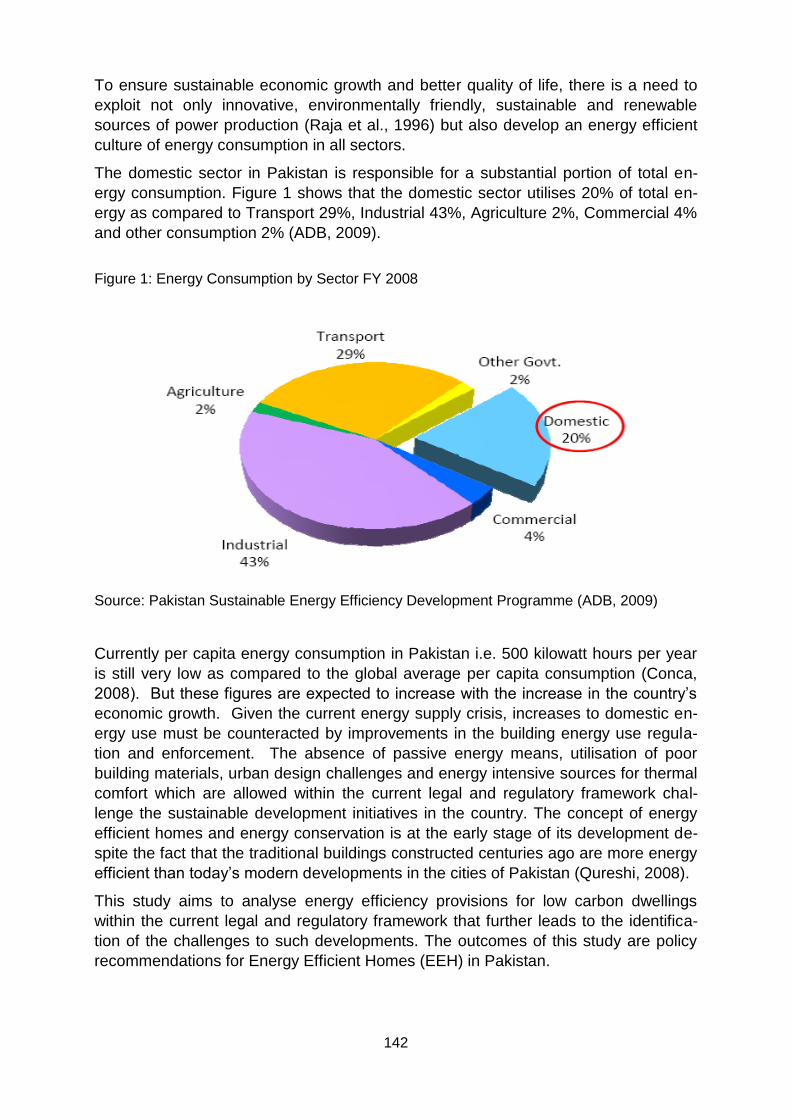
142
To ensure sustainable economic growth and better quality of life, there is a need to
exploit not only innovative, environmentally friendly, sustainable and renewable
sources of power production (Raja et al., 1996) but also develop an energy efficient
culture of energy consumption in all sectors.
The domestic sector in Pakistan is responsible for a substantial portion of total en-
ergy consumption. Figure 1 shows that the domestic sector utilises 20% of total en-
ergy as compared to Transport 29%, Industrial 43%, Agriculture 2%, Commercial 4%
and other consumption 2% (ADB, 2009).
Figure 1: Energy Consumption by Sector FY 2008
Source: Pakistan Sustainable Energy Efficiency Development Programme (ADB, 2009)
Currently per capita energy consumption in Pakistan i.e. 500 kilowatt hours per year
is still very low as compared to the global average per capita consumption (Conca,
2008). But these figures are expected to increase with the increase in the country‟s
economic growth. Given the current energy supply crisis, increases to domestic en-
ergy use must be counteracted by improvements in the building energy use regula-
tion and enforcement. The absence of passive energy means, utilisation of poor
building materials, urban design challenges and energy intensive sources for thermal
comfort which are allowed within the current legal and regulatory framework chal-
lenge the sustainable development initiatives in the country. The concept of energy
efficient homes and energy conservation is at the early stage of its development de-
spite the fact that the traditional buildings constructed centuries ago are more energy
efficient than today‟s modern developments in the cities of Pakistan (Qureshi, 2008).
This study aims to analyse energy efficiency provisions for low carbon dwellings
within the current legal and regulatory framework that further leads to the identifica-
tion of the challenges to such developments. The outcomes of this study are policy
recommendations for Energy Efficient Homes (EEH) in Pakistan.

143
2 Building Practices in Pakistan
The built environment is responsible for huge energy consumption and CO2 emis-
sions where buildings are the major part and have a substantial share in the total en-
ergy consumption in Pakistan and across the globe. According to the International
Energy Agency (2005), “30-40 per cent of the worldwide energy is being used in
buildings. Up to 90 per cent of the energy is utilised during the operational stage of
buildings, for the purposes of heating, cooling, and lighting” (Soharwardi, 2009). In
Pakistan attention is not being paid to a sustainable design for energy efficiency and
environmental performance of buildings. The main drivers for a building design in-
clude layout, aesthetics, capital cost, novelty and market resale value, whereas en-
ergy efficiency, conservation, environmental performance and higher operational
costs are totally ignored at the planning, design, construction and operational life of
the buildings (Mathur, 2007). Modern building design in Pakistan lacks energy effi-
ciency measures although traditional architecture utilises solar passive means, ther-
mal mass, shared shading, central courtyard and even street patterns to achieve
thermal comfort levels both in the winter and summer (Alamgir, 2008). Sustainability
features such as location, function, layout, materials, daylighting, waste, water con-
sumption, energy efficient appliances, energy resources, adaptability and compatibil-
ity with the surrounding environment play a significant role towards energy conserva-
tion and carbon reductions during the whole life cycle of the buildings (Younger et al.,
2008). Some of these considerations may cost more initially, but offer long-term sav-
ings (Younger et al., 2008) and better quality of life for current and future genera-
tions.
Legal and regulatory frameworks and city planning practices with effective energy
efficient considerations in the housing not only facilitates energy conservation but
also sustainable urban development in the broader context. However, energy effi-
ciency and conservation concepts are not well adopted in Pakistan‟s real estate mar-
ket despite “strong relationship between energy and planning components such as
land-use, buildings, built form, transportation, urban form, and infrastructure sys-
tems”(Duvarci and Kutluca, 2008).
3 Energy Efficiency Potential In The Housing Sector
Pakistan is facing energy shortages due to poor planning of the energy sector, low
production and inefficient consumption. The intermittent, unreliable and poor quality
of energy supply culture in the country is influencing economic growth of the country
and hindering foreign direct investment. Moreover, higher cost of energy production
through conventional methods with the technologies utilised by IPPs are responsible
for considerable investment in the energy sector. Such investments in technologies
utilising expensive imported fossil fuels e.g. oil have ensured the deceleration of eco-
nomic development. In this context, energy conservation in the domestic sector is
one of the options to reduce overall current and future energy deficits. The adoption
of energy efficiency and conservation measures can make available substantial capi-
tal resources for social and economic development of the society along with envi-
ronmental benefits (US Congress, 2008).

144
The residential sector comprises 24 million households in Pakistan (ADB, 2009) with
a 30% overall energy efficiency potential in the housing sector (ENERCON, 2008
http://www.enercon.gov.pk/). The energy consumption distribution in the residential
sector is on average 59% natural gas, 34%, electricity, 2% Oil and 5% LPG. This dis-
tribution is dominated by two main sources of energy consumption i.e. electricity and
natural gas. Electricity is mainly used to run home appliances such as lighting, fans,
motors, refrigerators and air conditioners whereas natural gas is being use for space
and water heating and cooking. Electricity consumption in domestic sector is 33,704
GWh/year (ADB, 2009) and power consumption for 9.8 million electric home appli-
ances is 3530 MW (ENERCON, 2008 http://www.enercon.gov.pk/). Energy efficient
appliances offset their initial relatively higher cost during their operational life. Accord-
ing to the Pakistan Energy Yearbook 2008, there is at least 10% potential to save
energy by introducing energy efficient appliances (ADB, 2009 and ENERCON, 2008).
Moreover, significant amounts of energy can be conserved by replacing Incandes-
cent light Bulbs (IBs 37% of the total residential points i.e. 117.4 million) with Com-
pact Fluorescent Lamps (CFLs) (ADB, 2009).
The energy efficiency potential in cooking, water and space heating appliances with
gas is 40%, 30% and 36 % respectively (ADB, 2009). This can be achieved by re-
placement of older systems, retrofitting/upgrading newer appliances and encouraging
more efficient appliance use, especially in new residential developments (Byam-
basaikhan et al. 2009). All gas based appliances in the residential sector are ex-
pected to contribute substantially to energy security and economical energy supplies
for future sustainable developments.
Energy savings can be achieved by improving building materials, wall insulation,
double or triple glazed windows, orientation (new developments), water consumption,
waste management and proper roof insulation in existing buildings and new devel-
opments. According to the ADB report on Sustainable Energy Efficiency Develop-
ment Programme of Pakistan, roof insulation can reduce up to 20% of electricity de-
mand for thermal comfort in summer (ADB, 2009).
New developments are expected to play a significant role not only to provide shelter
but also substantial energy efficiency and conservation in the housing sector. The
estimated housing demand in 2008 was 570,000 units, with the annual supply of
300,000 units and a shortfall of 270,000 units per year (NHP, 2001). With the intro-
duction of energy efficiency measures, these 300,000 new housing units also have
the potential to save 297000 MWh/year.
4 Methodology
The research method adopted in this research study is that of descriptive evaluation,
which involves both theoretical and practical considerations to strengthen analysis
and research outcomes. It provides input from three components (i.e. legal and regu-
latory arrangements, Building Energy Code of Pakistan and the institutional response
i.e. awareness survey) and comprises two phases (see Fig.-2). The first phase in-
volves the content analysis of legal, regulatory and policy arrangements for energy
efficiency, environmental performance in the housing sector at Federal, Provincial
and Local levels and Building Energy Code of Pakistan. The results from the content

145
analysis are expected to identify gaps, dissemination of federal policies into provin-
cial plans and local legislations and challenges to the Building Energy Code of Paki-
stan.
The second phase of the research method is based on institutional response through
a simple dichotomous survey to identify level of awareness of the Building Energy
Code of Pakistan and its application in the real estate market. The method of enquiry
is based on an enumeration survey that followed a structured format and closed
ended question from three different organizations involved in policy planning, capac-
ity building and professional growth, development and management activities in the
housing sector. The survey of the professional urban planners at the Urban Unit, City
and Regional Planning Department, UET Lahore and Lahore Development Authority
is to provide awareness level and dissemination of the Building Energy Code of Paki-
stan from Federal to Local level.
Figure 2: Research Methodology
The final phase of the research method analyses the results from the content analy-
sis and awareness survey, which leads to the research findings. The outcomes of
this study are a set of policy recommendations for an energy efficient culture in the
housing sector in Pakistan.
4.1 Energy Efficiency Legal and Regulatory Framework in Pakistan
The legal and regulatory framework for energy efficient homes, like other developing
nations, is in transition in Pakistan. To achieve the objective of energy conservation
in the housing sector, environmental protection, integrated land use planning, devel-
opment and management nation-wide broad principles, policies and laws have been
established at the Federal level in Pakistan through Acts, Ordinances, national policy,
planning manuals and codes. The Federal policies and acts set a broad framework
for devising provincial level policies and regional development plans. Provincial level
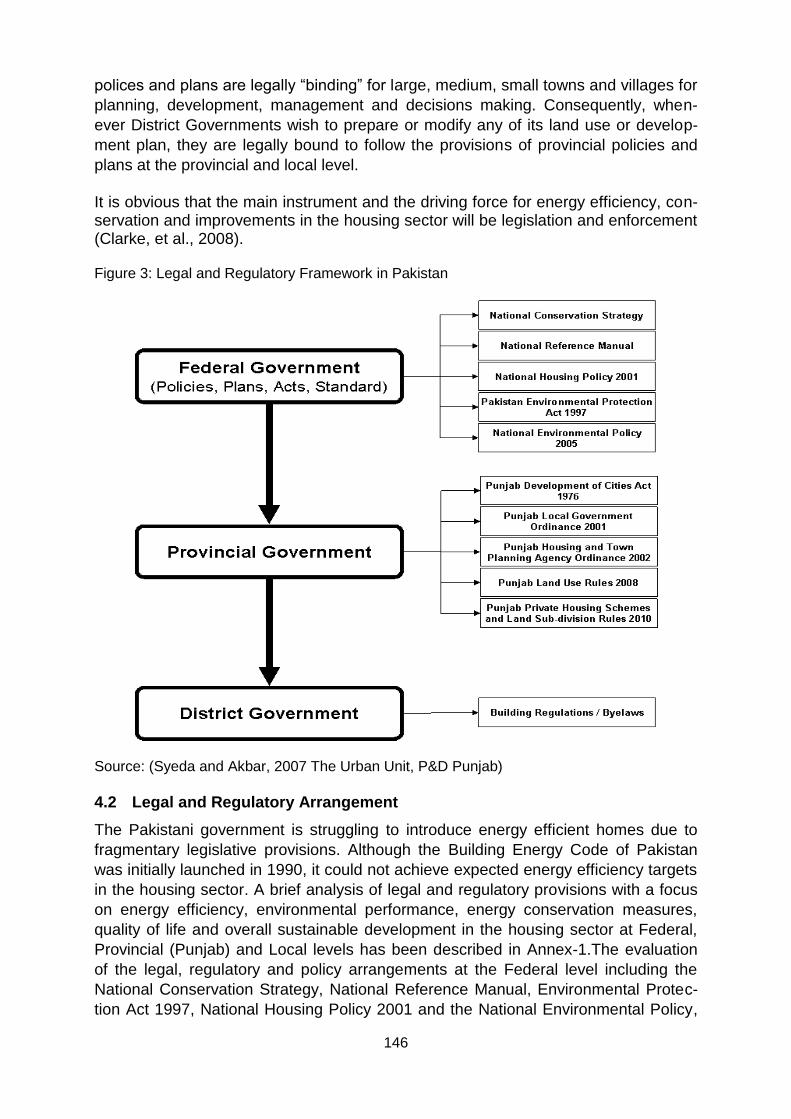
146
polices and plans are legally “binding” for large, medium, small towns and villages for
planning, development, management and decisions making. Consequently, when-
ever District Governments wish to prepare or modify any of its land use or develop-
ment plan, they are legally bound to follow the provisions of provincial policies and
plans at the provincial and local level. It is obvious that the main instrument and the driving force for energy efficiency, con-servation and improvements in the housing sector will be legislation and enforcement (Clarke, et al., 2008). Figure 3: Legal and Regulatory Framework in Pakistan
Source: (Syeda and Akbar, 2007 The Urban Unit, P&D Punjab) 4.2 Legal and Regulatory Arrangement
The Pakistani government is struggling to introduce energy efficient homes due to
fragmentary legislative provisions. Although the Building Energy Code of Pakistan
was initially launched in 1990, it could not achieve expected energy efficiency targets
in the housing sector. A brief analysis of legal and regulatory provisions with a focus
on energy efficiency, environmental performance, energy conservation measures,
quality of life and overall sustainable development in the housing sector at Federal,
Provincial (Punjab) and Local levels has been described in Annex-1.The evaluation
of the legal, regulatory and policy arrangements at the Federal level including the
National Conservation Strategy, National Reference Manual, Environmental Protec-
tion Act 1997, National Housing Policy 2001 and the National Environmental Policy,

147
cover a wide range of environmental concerns such as industrial pollution, transport
pollution, hazardous substances and sustainable development but no specific meas-
ures are adopted for energy efficient and environment friendly sustainable develop-
ments in the housing sector. Similarly, at the provincial level the legislative provisions
focus on devolution plan, environmental control, urban design, passive means of en-
ergy, indoor environment, ecological balance, beautification of administrative areas,
implementation of rules and bye-laws, provision of shelter and cost effectiveness is-
sues rather energy efficiency and conservation. Moreover, the Federal and Provincial
legal provisions provide an opportunity under different sections to make rules and
Bye-laws to carry out the purposes of the concerned law. Unfortunately subordinate
legislations have not been framed to provide an enabling environment for energy effi-
cient homes.
4.3 Building Energy Code of Pakistan
The Building Energy Code of Pakistan 1990 was initially prepared by National Energy
Conservation Centre (ENERCON), Planning and Development Division and Ministry
of Housing and Works Environment and Urban Affairs Division. The Code aimed to
provide energy efficient design and construction of buildings for optimum thermal
comfort levels and lower domestic energy consumption. Initially the Code was con-
sidered as the postscript of Building Code of Pakistan with minimum performance
standards for building walls, roofs, windows and openings, heat, ventilation and air
conditioning (HVAC) equipment and lighting. These HVAC arrangements were based
on American Society of Heating Refrigerating and Air-Conditioning Engineers (ASH-
RAE) standards. The code was non mandatory at that time but was expected to be
the part of mandatory requirements with the dissemination from federal to local lev-
els, gradual improvement in the federal, provincial and local legislations, continuous
capacity building and research and development activities. However after 20 years,
including research and development by ENERCON, Pakistan is still far from achiev-
ing optimum energy efficiency and environmental performance of the buildings. Cur-
rently, ENERCON is updating the Code according to the contemporary building re-
quirements. A draft document, based on the previous Code, has already been pre-
pared in 2009. The Code has divided the whole country in five different climatic
zones. The Code facilitates “new buildings and portions of existing buildings, new
systems and equipments and change in use of buildings” (BECP, 1990). The factors
covered in the code for energy efficient homes mainly include, “building envelopes,
building mechanical systems and equipment, including heating, ventilating, and air
conditioning (HVAC), service water heating, lighting and electrical power and motors”
(BECP, 1990).
The Code provides a basis to sustainable building standards in Pakistan. It was in-
troduced as a non statutory standard in 1990 (still having non mandatory status) and
could not disseminate to local levels due to legal, institutional, political, financial,
awareness, delivery capacity and coordination barriers between federal and local
levels. The Code is the first step to ensure energy efficiency, thermal comfort with
minimum energy consumption, carbon reductions and sustainability of new and exist-
ing buildings.

148
5 Energy Efficiency Awareness Survey
The energy efficiency awareness survey conducted in 2010 evaluated the level of
awareness and dissemination of Pakistan Building Energy Code from the Federal to
Local level during the last 20 years. The survey was simply based on a dichotomous
question, whereas Yes/No question was used to distinguish professional town plan-
ners familiar with the Pakistan Building Energy Code for energy efficiency, conserva-
tion and improved environmental performance of the buildings. The fieldwork for the
survey was performed by the professional town planners (co-authors) in the three
organisations.
Three organisations namely The Urban Unit, P&D Department (Provincial); City &
Regional Planning Department, UET Lahore (Academia); and Lahore Development
Authority (local development agency) were selected for the survey. The selection of
these three different organisations is based on their functions and unique role in
planning, development and management measures at different levels within existing
legal framework.
The survey aimed to determine the existing level of awareness among the town
planning professionals involved in policy planning and establishment of legal and
regulatory arrangements at provincial level (The Urban Unit); academia involved in
education and training of the professional qualified town planning graduates (City and
Regional Planning Department) and Professional town planners involved in the im-
plementation and enforcement of the Building Regulations and all development ac-
tivities (Lahore Development Authority). All professional Town planners across three
organizations were contacted to evaluate the level of awareness about the Pakistan
Building Energy Code.
Table 1: Energy Efficiency Awareness Survey
ENERGY EFFICIENCY AWARENESS SURVEY
SR.NO ORGANISATION LEVEL PROFESSIIONAL PLANNERS ANSWERED YES NO
1 Lahore Development Authority Local 33 22 3 19
2 CRP Department, UET Lahore Provincial 13 10 3 7
3 The Urban Unit, P&D Punjab Provincial 5 5 3 2
The results from the energy efficiency awareness survey clearly depict very low level
of awareness about the existing non statutory Building Energy Code of Pakistan. This
indicates poor networking between federal, provincial and local academic, planning
and development agencies, lack of trained professionals, individual and institutional
capacity building. The lack of professional awareness impedes public awareness
about Energy Efficiency standards, renewable technologies, orientation considera-
tion, building materials, international best practices, water consumption and energy
conservation at large. The low level of dissemination of energy efficiency measures
during the last two decades is the real dilemma for future sustainable new develop-
ments and refurbishments in Pakistan.

149
6 Analysis
Energy efficiency and conservation measures in the domestic sector have great po-
tential not only to reduce energy deficit, financial benefits to the general public and
better quality of life but also considerable capital resources for other economic devel-
opment activities. The energy efficiency potential in the domestic sector (i.e. 30%)
can be achieved by the introduction of sustainable designs, materials, insulations,
efficient electrical appliances, gas heaters and cookers. For instance there is 10% i.e.
353 MW potential to save energy from electric home appliances whereas total pro-
duction from PAEC is 462 MW. Moreover, substantial saving in electricity consump-
tions can be achieved by introducing CFLs instead of IBs and 30 to 40% savings can
be achieved in cooking, water and space heating appliances with gas (ADB, 2009).
The review of legal and regulatory provisions at Federal, Provincial (Punjab) and Lo-
cal level for energy efficiency, housing, urban planning and development reveals a
poor and deficient policy framework for energy efficiency and energy conservation in
the housing sector in Pakistan. It does not provide the enabling environment to sup-
port and disseminate energy efficiency measures in the building practices. The exist-
ing laws do provide broad statements about energy efficiency, conservation, GHG
reductions, environmental impacts and overall better quality of life, but broad provi-
sions under different Sections have not been trickled down to subordinate legislation
and standards for real applications, dissemination and enforcement. The current
situation depicts a lack of enabling laws and regulations at local levels to support and
integrate energy efficiency initiatives in the current building practices in different parts
of Pakistan. This deficiency is also being reflected from the non existence of interna-
tional best practices such as Leadership in Environmental and Energy Design
(LEED), Building Research Establishment Environmental Assessment Method
(BREEAM) and Deutsche Gesellschaft fur Nachhaltiges Bauen (DNGB) rated devel-
opments; inadequate energy efficiency standards under the current legal umbrella;
lack of energy efficient labelled appliances and goods for thermal comfort, energy
conservation and other domestic operational activities along with substantial reduc-
tion in the carbon emissions.
Laws and legal provisions have always been an effective instrument to strengthen
and provide strong foundation to institutional structures to enforce and achieve short
and long term development targets. Due to poorly defined legal and regulatory
frameworks in Pakistan, the institutional arrangement to strengthen energy efficiency
initiatives is also facing challenges. One of the major challenges is the lack of sub-
stantial financing in this sector whilst a wide range of energy efficient building materi-
als, sustainable technologies and equipment has already been integrated in the con-
struction industry in developed and developing countries. Currently, penetration of
energy efficiency, energy conservation measures and sustainable technologies are
almost negligible in the domestic sector in Pakistan. Financial institution, established
financial companies, government development agencies, real estate developers are
reluctant to invest in this sector and exploit the social, economic and environmental
potentials of energy efficient homes in Pakistan.
The relatively high energy consumption in the housing sector seems a potential for
energy efficient refurbishment and new developments. Current culture of higher en-

150
ergy consumption, lack of motivation, resistance to adopt contemporary tested en-
ergy conservation measures and sustainable technologies are upfront challenges.
Four major players namely government (federal, provincial and local), private sector
(investors, real estate developers etc.), civil society (NGOs, CBOs etc.) and general
public (Individual household) need to play active role from policy framework at fed-
eral level to on ground development at the individual dwelling unit. The government
influential and pro-active role towards energy efficient developments in terms of
comprehensive energy efficiency policy framework, legal and regulatory arrange-
ments, benchmarking for short term and long term targets, performance based finan-
cial allocations, subsidies and coordination among policy institutions and develop-
ment agencies, is inevitable to enhance motivation and energy efficiency culture in
Pakistan. Private sector including national and international financial institutions, real
estate developers and business communities are merely paying attention to integrate
energy efficiency measures and renewable sources of energy in the housing sector.
New developments are simply swallowing green fields in the name of high tech infra-
structure provisions for economic benefits with little attention to social needs and vir-
tually no attention to energy efficiency, conservation and environmental concerns at
overall development and individual dwelling unit levels. The private sector needs to
play a model role for the energy efficiency initiatives in the housing sector in Pakistan
with the introduction of innovative design solutions, materials, ecological and man-
agement measures and contemporary sustainable technologies. This will lead to sus-
tainable development with more economic benefits and market acceptability due to
consumer and environmental considerations. Civil society organisation including
Non-governmental Organisations (NGOs) and Community-based Organisations are
expected to play a significant role in terms of capacity building, localise standards,
model sustainable developments and mass awareness of energy efficiency, conser-
vation and environmental issues in the housing sector. The common people need to
adopt such initiatives not only for their own social, economic and environmental
benefits but also for future generations. The private sector needs to stimulate in-
digenous industries developing the necessary low cost materials to enable a low car-
bon building to be constructed. Moreover, the role of academia must be realised and
strengthened for professional and general capacity building at large.
The Pakistan Building Energy Code covers minimum energy efficiency, energy con-
servation and other features of sustainable developments for existing and new build-
ings in Pakistan. The Code is facing technical, legal and regulatory, economic, social
and cultural and capacity issues in the delivery of Energy Efficient Homes in Paki-
stan. These challenges include;
Non-statutory and voluntary status of Code not only causing poor usability but also poor dissemination of energy efficiency measures at lower tier legisla-tions.
Insufficient incorporation of energy efficiency measures in Building Regula-tions and Bye-Laws as envisaged in the Code according to five different cli-matic zones of Pakistan.
The code covers new buildings and refurbishments (all building types are be-ing covered). No specific energy efficiency measures have been incorporated for different land uses such as residential, offices, shops, schools, hotels, gov-ernment buildings etc.

151
No minimum acceptable level for energy efficient homes based on energy effi-ciency and sustainability features in any particular building, although there are specific standard requirements for individual components of the building such as roof, windows and HVAC etc.
No standard parameters have been incorporated to assess and evaluate en-ergy efficiency and environmental performance during design, construction and operation period of building life.
No specific standards have been elaborated for efficient building materials, equipments and appliances.
The Code does not talk about other sustainability factors such as water con-sumption, surface water runoff, location, appliances, cooking system, heating system, waste management, daylighting, ecological impact etc.
Proper attention has not been paid to the ecological factors and enhancement of the site before and after the construction.
Lack of established institutions at provincial levels to translate federal policies to provincial and local plans. More over poor coordination and culture of isola-tion in federal, provincial and local bodies is also a dilemma for such initiatives in Pakistan
Exemptions such as buildings without electricity or fossil fuel utilisation, mini-mum use of electricity and gas and equipment and portions of building sys-tems that use energy primarily for manufacturing industry and processes, warehouses, storage and agriculture need to be rectified.
Lack of awareness among the professionals and general public which lead to poor or no interest toward energy efficient homes.
No consideration to integrate gradually sustainable renewable technologies in the housing sector
Lack of individual and institutional capacity and implementation framework and feedback
Poor consideration towards international best practice sustainable develop-ment initiatives.
The Pakistan Building Energy Code is just the first step towards sustainability and
energy efficient sustainable homes in Pakistan. The real challenge is the awareness,
market acceptability, appreciation and full adoption of these measures. Moreover,
gradual contemporary improvements, preparation of technical guides and manuals,
practical sheets, educational curriculum, training manuals, professional certifications
and adoption of international best practices are demanding fronts for mainstreaming
energy efficiency in the housing sector in Pakistan.

152
7 Key Findings
The descriptive analysis of legal and regulatory framework, Building Energy Code of
Pakistan and results from the awareness survey reveals that;
Domestic sector has significant energy efficiency potential that needs to be exploited not only for social, economic and environmental benefits but also better quality of life at large.
Lack of enabling environment at the Federal, Provincial and Local levels has resulted in a fragmented and voluntary energy efficiency, legal, regulatory and policy framework
Lack of awareness about energy efficiency, conservation and environmental performance measures among the professionals in particular the academia and professional government agencies.
Lack of institutional arrangements and poor coordination among existing Fed-eral, Provincial and Local government departments and agencies.
Individual and Institutional capacity constraints to enforce energy efficiency provisions under the existing legal framework.
Limited Research and Development initiatives by professional bodies, re-search institutions, government agencies and international organizations.
Limited professional and technical expertise across Pakistan to evaluate en-ergy consumption and performance of buildings, equipments and appliances.
Lack of substantial financing in the domestic energy sector due to weak legal and policy framework, market acceptability, confidence and adoption issues.
Poor market acceptability due lower per capita income and higher capital cost of energy efficient products, materials, equipments and appliances. This shows limited awareness about low operational cost, economic and environ-mental benefits over the life time of these.
Low level of awareness regarding international best practices on energy effi-ciency.
No concept of subsidies and incentives for energy efficiency in the housing sector to achieve social, economic and environmental benefits in the broader context.
8 Conclusions and Recommendations
The analysis of legal and regulatory provisions for energy efficient homes reveals
fragmentary and weak legislative arrangements in Pakistan. Major Challenges in dis-
integrating energy efficiency parameters in the housing sector include poor dissemi-
nation of federal government initiatives into provincial plans and subordinate legisla-
tion at local level; poor institutional arrangement and delivery capacity; lack of
awareness, negligible public interest and lack of financing due to weak legal frame-
work. Moreover, Building Energy Code of Pakistan is facing technical, legal and regu-
latory, economic, and delivery capacity issues. A low level of professional and public
awareness about energy efficiency and environmental performance of the buildings
is also a barrier for future energy efficient and sustainable developments in Pakistan.
The aim of Energy Efficient Homes in Pakistan is to conserve energy, achieve sub-
stantial carbon reduction in the housing sector along with reduction in overall energy
deficit. The following set of recommendations provides a systematic road map to bet-
ter enable energy efficient culture in Pakistan.

153
Recommendation 1
Development and adoption of overarching legal, regulatory and policy framework for
Energy Efficient Homes in Pakistan. The Government intends to enact the Pakistan
Energy Efficiency and Conservation Bill, which will provide a legal framework and a
regulator role to National Energy Conservation Centre (ENERCON) to coordinate
and implement national energy conservation and energy efficiency initiatives and
policies. This will also provide a legal support to Building Energy Code of Pakistan
because under its statutory authority ENERCON will be able to develop such stan-
dards and energy efficiency parameters. The integration of these standards and
measures with the provincial and subordinate legislations especially Building Regula-
tion and Bye Laws is the pre-requisite of Energy Efficient Homes in Pakistan. There
is need to have clear and doable energy conservation and carbon reduction targets
with a comprehensive road map. This road map will enable all enforcing authorities to
gradually improve Building Regulations and Bye Laws in order to comply with energy
efficiency and environmental performance of the buildings.
Recommendation 2
Establishment of a comprehensive Institutional framework with explicit role and re-
sponsibilities from federal to local level. This framework will enable provincial gov-
ernment/departments to translate federal policies into provincial plans and legal bind-
ing for the local governments to incorporate energy efficiency measures and achieve
set targets of energy conservation at household level.
Recommendation 3
Standardisation and labelling schemes for equipment and appliances such as refrig-
erators, air conditioners, gas heaters, gas stoves, washing machines, driers etc.
Recommendation 4
Continuous research and development, training and capacity building of provincial
and local government departments and authorities. The role of educational institu-
tions (academia) and research institutions is strongly recommended for such train-
ings and research and development activities, case studies and demonstration
sites/projects on energy efficient sustainable developments.
Recommendation 5
Review and incorporate other sustainability factors such as water consumption,
waste water, waste management, renewable source of energy, local materials, loca-
tion, ecological consideration etc. in the Building Energy Code of Pakistan.
Recommendation 6
154
Prepare technical guides, and manuals, training manuals, educational curriculum,
softwares and professional certifications for Professional planners, architects, engi-
neers, and other Code Officials
Recommendation 7
Development of a robust database for existing and new buildings for better energy
efficiency solution and record.
Recommendation 8
Introduction of subsidies and incentives against substantial improvements in the en-
ergy efficiency and environmental performance of the individual building.
ACKNOWLEDGEMENT
We wish to acknowledge all efforts of founding and board members of the Real Es-
tate Initiative (REI) at the University of Ulster. Thanks are due to REI and RGS staff
members, fellow PhD researchers, Dr. Nasir Javed and Ms. Kiran Shahzadi from the
Urban Unit, Punjab, Ms. Humaira Tabassum from U.E.T Lahore and family members.
REFERENCES ADB. 2009, Pakistan: Sustainable Energy Efficiency Development Programme, Hagler Bailly
Pakistan and Econoler International, Islamabad, Pakistan.
Alamgir, S. 2008, "A Quick Design Approach Towards the Energy Efficient Buildings in Paki-
stan", Passive and Low Energy Architecture, Dublin, eds. P. Kenny, V. Brophy & J.O. Lewis,
University College Dublin, Ireland, Dublin.
Ali, M.M., Khalid, A., Khan, B., Haq, M.F., Mirza, F.A., Khaliq, F., Hussain, F., Kamal, M.,
Moinuddin., Arby, M.F., Idrees, M., Laiq, M., Akbar, M.N., Khawaja, M.S., Abbasi, M.U., Zeb,
M., Iram, N., Sabahat., Jafri, S.K., Badar, S., Ghauri, S.P., Ahmad, S., Hussain, S.Z., Rauf,
T., Hussain, T., Fazal-ur-Rehman, W. & Hussain, Z. 2009-2010, The State of Pakistan's
Economy, State Bank of Pakistan, Lahore, Pakistan.
Bell, S. & Morse, S. 2003, Measuring Sustainability-Learning From Doing, Earthscan Publi-
cations Ltd, London.
Byambasaikhan, B., Aleem, A., Chen, H., de Dios, A., Endelman, M., Jayewardene, R.,
Kawawaki, F.C., Kunzer, M., Luo, T., Noshab, F. & Tareen, A. 2009, Environmental Assess-
ment and Review Framework: Pakistan Energy Efficiency Investment Program, Asian Devel-
opment Bank (ADB).
CCP. The Analysis of Competition and Economic Development in the Power Sector, Compe-
tition Commission of Pakistan, Islamabad, Pakistan.
Clarke, J.A., Johnstone, C.M., Kelly, N.J., Strachan, P.A. & Touhy, P. 2008, "The role of built
environment energy efficiency in a sustainable UK energy economy", Energy Policy, vol. 36,
no. 2, pp. 4605-4609.
Conca, J. 2008, WIPP and Other Things Nuclear, Nuclear News.
Congress, U.S. 1992, Fueling Development: Energy Technologies for Developing Countries,
U.S. Government Printing Office, Washington, DC.
Duvarci, Y. & Kutluca, A.K. 2008, "Appraisal of Energy Efficiency of Urban Development
Plans: The Fidelity on Izmir-Balcova Case", World Academy of Science, Engineering and
Technology, Johannesburg, South Africa, pp. 359.

155
Government of Pakistan (2005), National Environmental Policy 2005, Pakistan, Islamabad,
Pakistan.
Government of Pakistan (2001), National Housing Policy 2001, Ministry of Housing & Works /
National Housing Authority, Islamabad, Pakistan.
Government of Pakistan (1997), Pakistan Environmental Protection Act 1997, Pakistan, Is-
lamabad, Pakistan.
Government of Pakistan ENERCON (1990), Building Energy Code of Pakistan 1990, Paki-
stan, Islamabad, Pakistan.
Government of Punjab (2010), The Punjab Private Housing Schemes and Land Sub-Division
Rules, Punjab, Lahore, Punjab.
Government of Punjab (2009), The Punjab Land-Use (Classification, Reclassification and
Redevelopment) Rules, Punjab, Lahore, Punjab.
Government of Punjab (2007), Model Building and Zoning Regulations for Development Au-
thorities in Punjab, City District Government, Lahore, Punjab.
Government of Punjab (2002), The Punjab Housing and Town Planning Agency Ordinance,
Punjab, Lahore, Punjab.
Government of Punjab (2001), The Punjab Local Government Ordinance, Punjab, Lahore,
Punjab.
Government of Punjab (1976), The Punjab Development of Cities Act 1976, Punjab, Lahore,
Punjab.
Hanson, A.J., Bass, S., Bouzaher, A., Samdani, G.M. & Zehra, M. 2000, Pakistan's National
Conservation Strategy: Renewing Commitment to Action, Pakistan.
Harlem, G.B. 1987, Report of the World Commission on Environment and Development: Our
Common Future, Published as Annex to General Assembly document A/42/427, New York,
USA.
Khator, R. & Fairchild, L. 2006, "The Evolution of “Sustainable Development.”", Rebecca Lee
Harris (Ed.) Globalization and Sustainable Development: Issues and Applications, pp. 13-22.
Mathur, A. 2007, "Energy Conservation Building Code: Powering Energy Conserva-
tion", IEEMA, vol. XXVII, no. 7.
Ministry of Housing & Works, Pakistan (1986), National Reference Manual on Planning and
Infrastructure Standards, Ministry of Housing & Works, Islamabad, Pakistan.
Qureshi, S. 2008, "Appropriating Traditional Wisdom for Sustainable Building De-
sign", International Seminar and Workshop on Sustainable Building Design "SBD08", eds.
M.A. Tirmizi & S.F. Sajjad, Edge Hill University, Lancashire, UK, pp. 10.
Raja, I.A., Dougar, M.G. & Abro, R.S. 1996, "Solar Energy Applications in Paki-
stan", Renewable Energy, vol. 9, no. 1-4, pp. 1128-1131.
Rizvi, S.A. 2001, December 17' 2001-last update, National Housing Policy 2001: Revitalising
the Housing Sector [Homepage of Pakistan and Gulf Economist], [Online]. Avail-
able: http://www.pakistaneconomist.com/issue2001/issue51&52/i&e3.htm [2010, 07/07].
Sohaib, Q. & Athar, R.D. 2002, Pakistan's Environmental Laws and their Compliance: A
Guide for Industrial Establishement, Law Times Publications, Lahore, Pakistan.
Soharwardi, A. 2009, Designing Buildings for Energy Efficiency, Archi Times, Karachi, Paki-
stan.
Syeda, S.N. & Akbar, M.R. 2007, Urban Planning Framework in Punjab, Research & Devel-
opment edn, Lahore, Pakistan.
Younger, M., Morrow-Almeida, H.R., Vindigni, S.M. and Dannenberg, A.L. 2008, "The Built
Environment, Climate Change, and Health Opportunities for Co-Benefits", American Journal
of Preventive Medicine, vol. 35, no. 5, pp. 517-526.

156
Annex 1
A.1 Federal Level A.1.1 National Conservation Strategy
The Pakistan National Conservation Strategy (NCS) was adopted in 1992 with the
challenges of protection, conservation, rehabilitation and improvement of the envi-
ronment, prevention and control of pollution and sustainable development. The NCS
targeted fourteen core areas along with three operating principles. These principles
include “Public partnership in development and management; integration of environ-
ment and economics in decision making and improvements in the quality of life”
(Hanson et al., 2000). The derived implementation mechanism involved seven key
stakeholders/partners from government (federal, provincial, district) and the society in
order to achieve the objectives of sustainable development. Increasing Energy Effi-
ciency, one of the core areas, targeted energy efficiency in building, retrofits and ap-
pliances and identified policies such as development of alternative energy sources
and efficient use of energy only. Moreover, practical measures such as use of fuel
efficient cookers, introduction of private sector for commercial development of local
energy sources and solar water heaters were suggested in the NCS (Sohaib and
Athar, 2002). The Strategy covered wide range of areas and sectors instead of more
focused and doable road map towards sustainable development. It put great empha-
sis on NEQS, EIAs, public awareness about environmental issues, Institutional
strengthening and protection of natural resources for better quality of life. However it
could not focus properly the “Macro-economic and sectoral economic policies,” and
housing sector in particular (Hanson et al., 2000).
A.1.2 National Reference Manual on Planning and Infrastructure Standards
The National Reference Manual is the only reference document for planning and in-
frastructure provisions for development activities in Pakistan. The concept of energy
efficient homes has not been dealt with in the manual. No specific measures have
been suggested to adopt energy efficiency and environmental performance of the
buildings. The Physical Planning Process has briefly incorporated environment and
orientation considerations to exploit wind and solar energy. General guidelines cover
planning and designing of lots in a layout plan at a neighbourhood level according to
different climatic zones (cold composite, cool composite, normal composite, warm
composite, extra dry cool, extra dry hot, inland maritime and maritime) and climatic
effects in different regions of Pakistan. These guidelines comprise plot dimensions,
building lines, plot relationship and arrangement for effective and efficient use of pas-
sive means (NRM, 1986). The basic design and layout considerations have been in-
corporated in the Manual but these standards are not legally bindings for the profes-
sionals and developers in the housing industry. Even development schemes by the
federal and provincial governments and registered developers during the last two
decades have not considered these passive considerations as guiding principles to
enhance energy efficiency and environmental performance of buildings at individual
and neighbourhood level. Moreover, the Manual has not been reviewed and updated

157
since 1986 to meet the requirements of contemporary energy efficient homes, envi-
ronmental performance and carbon reductions.
A.1.3 National Housing Policy 2001
The National Housing Policy 2001 highlighted the government‟s role to exploit re-
sources whilst facilitating and regulating development initiatives to enhance eco-
nomic activity (Rizvi, 2001). The policy has put great emphasis on “resource mobili-
sation, land availability, incentives for home ownership, incentives to developers and
constructors and promotion of research and development activities to make construc-
tion cost effective” (Ali et al. 2010 and NHP, 2001). The objective was contributing
affordability and cost effectiveness instead of energy efficiency, thermal comfort and
environmental performance of buildings. Key considerations of the Housing Policy
include revision and improvement of planning and building regulations, codes and
standards, building materials, construction technology, capacity building, coordination
among different development agencies at federal, provincial and local levels (NHP,
2001).
A.1.4 Pakistan Environmental Protection Act 1997
The Pakistan Environmental Protection Act 1997 was enacted to strengthen Envi-
ronmental Protection Agency created under 1983 ordinance for the protection, con-
servation, rehabilitation and improvement of the environment. The Act mainly fo-
cused on the implementation of Council‟s policies (established under section 3 of the
act), delegation of powers to government agencies, enforcement of NEQS, introduc-
tion of EIA / IEE review procedures, regulatory regime for hazardous wastes, re-
source generation through establishment of provincial sustainable development fund,
pollution charges and providing an appeals process for environmental cases (PEPA,
1997). The environmental concerns in terms of transport pollution, hazardous sub-
stances and industry related issues, were covered thoroughly but no specific ar-
rangement had been ensured for energy efficient and environment friendly sustain-
able developments in the housing sector.
A.1.5 National Environmental Policy 2005
The National Environmental Policy 2005 focused on energy security and to achieve
energy efficient, environmentally friendly and sustainable arrangements for the fu-
ture. The policy aimed “to protect, conserve and restore environment to improve
quality of life through sustainable development” (NEP, 2005). The policy challenged
different strategic issues such as sustainable development, cost effective and energy
efficient measures to improve economic productivity and poverty alleviation, reduc-
tion in CO2 and Green House Gas emissions, gender mainstreaming and energy
supply to rural areas. The policy provides broad general, sectoral and cross sectoral
guidelines to Federal, Provincial and Local District governments to address environ-
mental issues. The policy provides strategic direction under section 3(7) (Energy Effi-
ciency and Renewables) of the sectoral guidelines to adopt energy efficiency and
conservation measures leading to sustainable developments. No doubt the policy
has covered a wide range of sectoral and cross sectoral areas with a long shopping

158
list of initiatives and measures. These guidelines describe what is required for short
term and long term sustainable development activities but the questions are how to
do (road map, system and systematic legal and regulatory arrangement, transforma-
tion of federal policies and legislation to provincial and local rules and regulations,
integration of renewable technologies) and who will do (individual and institutional
capacity, enforcement mechanism with rational bench marking).
A.2 Provincial Level A.2.1 Punjab Development of Cities Act, 1976
The Punjab Development of Cities Act 1976 was promulgated to improve quality of
life in the cities of Punjab through a systematised planning and development. The act
emphasised on “an integrated development approach and a continuing process of
planning and development, to ensure optimum utilization of resources, economical
and effective utilization of land and to evolve policies and programmes, relating to the
improvement of the environment of housing, industrial development, traffic, transpor-
tation, health, education, water supply, sewerage, drainage, solid waste disposal and
related issues” (PDCA, 1976).” The Punjab development of Cities Act does not high-
light energy efficient buildings, domestic energy conservation and environmental per-
formance of the buildings. However, section 7(2) and 2(v) identifies few measures for
environmental improvements, development control and beautification of the areas
rather energy efficient sustainable developments.
A.2.2 Punjab Local Government Ordinance 2001
The Punjab Local Government Ordinance 2001 was promulgated to “devolve political
power and decentralise administrative and financial authority to accountable local
governments for good governance, effective delivery of services and transparent de-
cision making through institutionalised participation of the people at grass-roots level”
(PLGO, 2001). The Ordinance provides a comprehensive legal and administrative
arrangement for the devolution plan but energy conservation and energy efficiency in
the housing sector has not been specifically entertained. However, Section (40) and
6th Schedule Section (27) describes environmental control, urban design, passive
means of energy, indoor environment, ecological balance, beautification of adminis-
trative areas and implementation of rules and bye-laws. Moreover, Sections 191 and
192 facilitate the Councils to make rules and Bye-laws to carry out the purposes of
the Ordinance. But subordinate legislations have not been framed to provide an ena-
bling environment for energy efficient homes across the whole province.
A.2.3 The Punjab Housing and Town Planning Agency Ordinance, 2002
The Punjab Housing and Town Planning Agency Ordinance 2002 was enacted to
establish Punjab Housing and Town-Planning Agency. The main functions of the
Agency, as envisaged in the ordinance, are to provide shelter and to establish a
comprehensive system of Town Planning at Provincial, District, Tehsil and Union
Council levels. The Ordinance describes few functions and powers of the agency to
adopt environment friendly measures in the housing sector. The Section 4(2)(i)(ii)(iii)
159
and (vii) clearly facilitate to “develop indigenous and cost effective approaches; adopt
parameters of the national housing policy; low cost housing; and promotion of envi-
ronment for friendly and standardised construction activities”(PHATA, 2002). More-
over, under Section 4 sub-section 2 (xviii)(xix) the agency may provide technical as-
sistance to the District Governments and Tehsil Municipal Administrations and coor-
dination with the federal government for housing and town planning development ini-
tiatives (PHATA, 2002). The main focus of the Ordinance is the provision of shelter
and cost effectiveness rather energy conservation.
A.2.4 Punjab Land Use Rules 2008
The Punjab Land Use (Classification, Reclassification and Redevelopment) Rules
2008 has been framed under section 191 of the Punjab Local Government Ordinance
2001 and section 44 and 43 of LDA Act 1975 and Punjab Development of Cities Act
1976 respectively. The main objective of the Rules is the classification, re-
classification and redevelopment of the land uses in order to ensure sustainable,
harmonious and compact development in the cities. The Rules provide comprehen-
sive planning framework for different land uses and development activities in urban,
peri-urban and agriculture areas. However, energy efficiency and environmental per-
formance of existing housing stock and future dwellings has not been considered in
these Rules (PLUR, 2008).
A.2.5 Punjab Private Housing Schemes and Land Sub-Division Rules 2010
The Punjab Private Housing Schemes and Land Sub-Division Rules 2010 have been
notified under the section 191 of the Punjab Local Government Ordinance 2001.
These Rules define procedural criteria to sanction housing developments and plan-
ning standards for housing schemes and sub-divisions. These planning standards
incorporate minimum standards for open spaces or park, graveyard, commercial
area, public buildings, maximum size of residential plot, roads, solid waste manage-
ment, provisions for low income groups, tube well location, site of grid station and
green strips. There is nothing about energy efficiency, environmental performance,
exploitation of passive means for sunlight and wind by systematic and innovative ar-
rangement of streets and roads (PHS&LSR, 2001).
A.3 Local Level A.3.1 Building Regulations/Byelaws
The Building Regulations and Byelaws adopted by Development Authorities and Lo-
cal Governments in Punjab have incorporated environmental issues in the form of
environmental impact assessment, considerations for flood plain areas and environ-
mentally sensitive areas. Moreover, internal lighting and ventilation specification
(such as external openings and internal wells), fire safety precautions, emergency
exits and standard specifications for utility services such as water, drainage, sanita-
tion, solid waste management and electricity have been comprehensively elaborated
for individual and common development activities (BR, 2007). The concept of Energy
Efficient Homes is missing in the Building Regulations and Byelaws. The limited envi-

160
ronmental concerns in the Regulations are targeting better quality of life. Different
features such as optimum utilisation of passive means, design considerations, mate-
rials, integration of contemporary renewable technologies, insulation, double or triple
glazed windows, thermal bridging, embodied energy etc. contributing to energy effi-
ciency, environmental performance of the buildings and energy conservation has not
been incorporated in these Regulations.
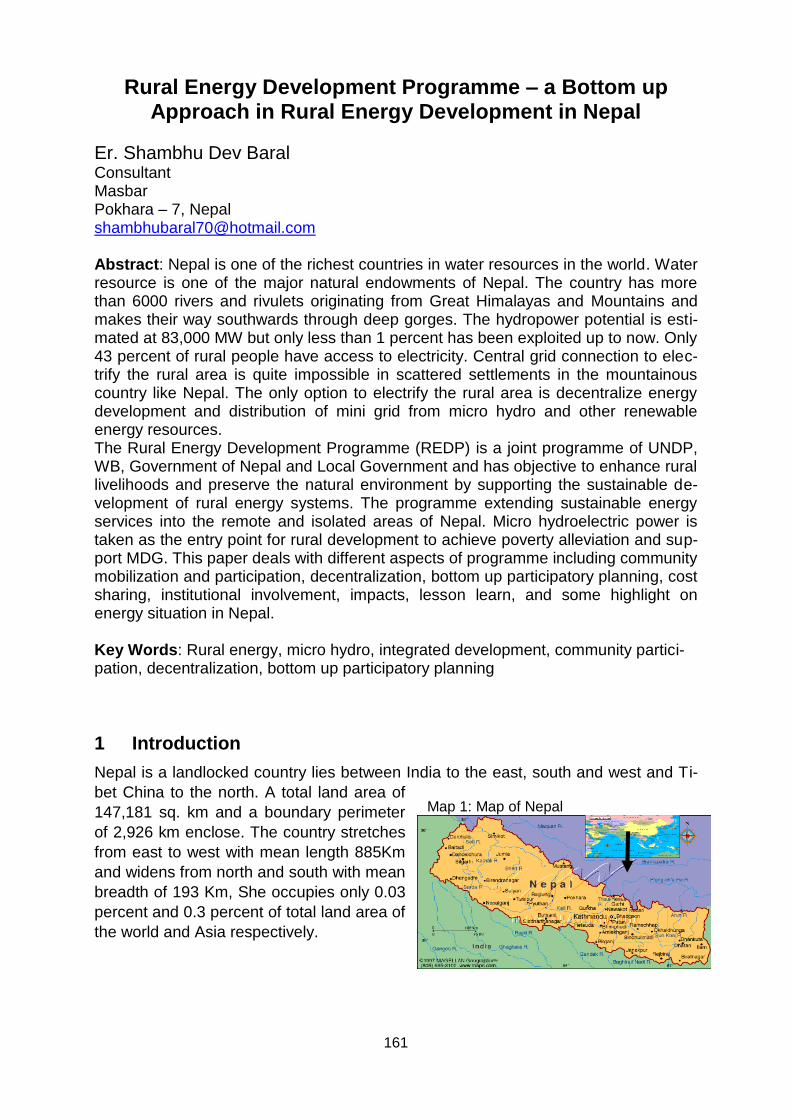
161
Map 1: Map of Nepal
Rural Energy Development Programme – a Bottom up Approach in Rural Energy Development in Nepal
Er. Shambhu Dev Baral Consultant Masbar Pokhara – 7, Nepal [email protected] Abstract: Nepal is one of the richest countries in water resources in the world. Water resource is one of the major natural endowments of Nepal. The country has more than 6000 rivers and rivulets originating from Great Himalayas and Mountains and makes their way southwards through deep gorges. The hydropower potential is esti-mated at 83,000 MW but only less than 1 percent has been exploited up to now. Only 43 percent of rural people have access to electricity. Central grid connection to elec-trify the rural area is quite impossible in scattered settlements in the mountainous country like Nepal. The only option to electrify the rural area is decentralize energy development and distribution of mini grid from micro hydro and other renewable energy resources. The Rural Energy Development Programme (REDP) is a joint programme of UNDP, WB, Government of Nepal and Local Government and has objective to enhance rural livelihoods and preserve the natural environment by supporting the sustainable de-velopment of rural energy systems. The programme extending sustainable energy services into the remote and isolated areas of Nepal. Micro hydroelectric power is taken as the entry point for rural development to achieve poverty alleviation and sup-port MDG. This paper deals with different aspects of programme including community mobilization and participation, decentralization, bottom up participatory planning, cost sharing, institutional involvement, impacts, lesson learn, and some highlight on energy situation in Nepal. Key Words: Rural energy, micro hydro, integrated development, community partici-pation, decentralization, bottom up participatory planning
1 Introduction
Nepal is a landlocked country lies between India to the east, south and west and Ti-
bet China to the north. A total land area of
147,181 sq. km and a boundary perimeter
of 2,926 km enclose. The country stretches
from east to west with mean length 885Km
and widens from north and south with mean
breadth of 193 Km, She occupies only 0.03
percent and 0.3 percent of total land area of
the world and Asia respectively.

162
Figure 1: Topographical Division
Ecologically, the country is divided into three zones: the rugged Himalayas to the
north, the central hill ranges and the Terai – the flat Gangetic plains of the south. The
altitude varies from 70 m to 8848 meters from mean sea level. Climatic conditions
vary from cool summers and severe winters in the north, to subtropical summers and
mild winters in the south. Nepal boasts of having eight of the world's 10 highest
peaks, including the world's highest peak, Mount Everest (8,850 m.), on the northern
(CBS 2008).
Total population of the country has reached about 26.9 millions (2008), out of which
86 percent lives in rural area and 14 percent lives in urban area. The population
growth rate is 2.25 percent and per capita GDP at current US $ 470.
The country is divided into 75 administrative districts. Districts are further divided into
smaller units, called Village Development committees (VDCs - total 3915) and Mu-
nicipalities (total - 58).
2 Renewable Resources and Production 2.1 Hydropower
Nepal has huge potential to generate electricity from water resources. It has more
than 6000 rivers and rivulets giving total annual runoff from the country are about 224
billion cubic meters/year. Nepal has total hydro power potential is about 83,000 MW
out of which 43,000 MW is economically viable. Unfortunately only less than 1 per-
cent of total potential has been generated so far. The first hydro power station (500
KW) was installed in 1911, called Pharping hydro power station near Kathmandu, the
capital city. Various hydropower projects generated 650 MW of electricity and only
645 MW is connected
to the national grid,
while rest of the en-
ergy generated from
small hydropower
stations and have
been providing elec-
tricity services at lo-
cal levels. The total
electricity generated
has reached 703 MW
including 53.41 MW from thermal power stations (Economic Survey 2009). Nepal's
topography gives it enormous scope for the development of hydroelectricity, which
probably provides the only realistic basis for its further economic development. Small-
scale hydro plants are the most viable option for rural electrification. Large projects,
however, in view of Nepal's limited financial resources, would probably require power
export contracts with India as a prerequisite.

163
2.2 Solar Energy
The average solar radiation varies from 3.6 to 6.2 Kwh/m2/day and sun shines for
about 300 days with an average of 6.8 light hours per day (Energy Sector Synopsis,
Report, 2010)). It is favorable condition for exploitation of solar energy in the country.
About 5 MWp of photovoltaic power is currently being used in various public and pri-
vate sectors though more than Solar Home System (SHS) till 2009. Present days
SHS have been fully commercialized and till 2009 more than 185,000 SWH have
been installed in the country.
2.3 Wind Energy
The studies by DANGRID a Danish consulting firm in 1992 reported that a potential
to generate 200 MW of electrical power with an annual energy production of 500
GWh from the wind resources along the 12 km valley between Kagbeni and Chusang
in Mustang district where wind power potential is tremendous. The Center for Energy
Studies/ IOE and with support from United Nations Environment Program/ Global
Environment Facility (UNEP/GEF) has conducted the assessment and shows a total
area of 6074km2 with a wind power density greater than 300 watt/m2 opening up the
possibility for numerous wind energy projects. Only 10% of this area has been ana-
lyzed for project feasibility. Nepal could potentially generate more than 3000 MW of
electricity from wind energy. Most potential project sites lie in conservation zones in
the mid-hills and high mountains (AEPC). AEPC has installed six wind-solar hybrid
systems which generate 400 watts of power (150 watts solar, 250 watts wind) in
Pyuthan, Mutang and Palpa. There is no signification wind energy production in the
country.
2.4 Biomass 2.4.1 Forestry
The forestry resources are only a main energy resource which is fulfilling most of the
energy need in Nepal. Forestry covers about 29 percent, and shrubs covers about 11
percent of the total land of the country and it is decreasing at the rate of 1.7 percent
for different domestic needs for example fire wood, constructional materials etc (State
of Environment 2006). Per capita fuel wood consumption in the Hills is estimated to
be 640 kg, while it is 479 kg/person/year for the Terai. The per capita timber con-
sumption per annum was estimated at 0.07 m3 /year in 1985 and is estimated to
have increased to 0.11 m3/year by the year 2000 on the basis of the national timber
demand projected to be about 2.5 million m3/year by 2000 (GoN/ADB/FINNIDA,
1998, SoE 2006). Firewood consumption is about 77 percent of total energy con-
sumption in the country.
2.4.2 Agriculture Residue and Animal Waste
Agriculture residue and animal waste play an important role in rural energy system.
Agricultural residues and animal waste used in total energy consumption is about
four percent and six percent respectively. About 10 percent of total energy fulfil by
agriculture residue and animal waste.

164
2.5 Rural HH Energy Technology 2.5.1 Biogas
Cattle rising are one of the main livelihood phenomenon associated to rural people in
Nepal. This plays very crucial role to fulfil the rural energy consumption. The potenti-
ality of producing biogas is about 1.9 million plants out of which 1 million are eco-
nomically viable (WECS 2010) up to now total 20,5820 biogas plants has been in-
stalled (BSP Nepal).
2.5.2 Improved Cook Stove Technology
There is a huge potential for biomass technologies like Improved Cooking Stoves
(ICS), Beehive briquettes, Briquetting mechanism, Gasifier. More than 331,000 ICS
have been so far installed through various government and non-government organi-
zations though the potential to install is about 3 million household.
3 Energy Consumption Pattern
Nepal is country where the most of the people
live in rural areas and where poverty is greater
compared to urban centres and valleys. Social
and economic inequalities, low economic growth,
unbalanced development approaches, discrimi-
nation, exclusion, environmental deterioration
and inappropriate policies/technologies lead to a
vicious circle of poverty, which can be perceived
as one of the key contributing factors of the cur-
rent conflict in the country. Energy consumption
per capita is extremely low, 0.34 TOE or 14.64
GJ. Nepal per capita energy consumption for
year 2005 was about one fifth of world av-
erage per capita energy consumption. On an average energy consumption in Nepal
is increasing by about 2.28% annually. Biomass-based and conventional energy re-
sources are predominant in the energy consumption, and are primarily used for cook-
ing and lighting purposes.
As of 2009, micro-hydro (including pico-hydro) electrification schemes installed in
various part of the country with the total installed capacity of about 13.9 MW covering
about 110,000 households. Similarly 331,000 households are using improved cook
stoves, 185,000 solar home (SHS) systems and 205,820 biogas plants have been
installed. Despite of high energy generation potential the country experiences elec-
tricity load shedding up to 16 hr/day in winter and 2 hr/day in summer. The energy
consumption pattern is shown in following charts.
Figure 2: Percentage of household with access to electricity

165
Figure 6: Rural Energy Consumption
Rural Area 2005
64%17%
9%2%3%1% 4%
Cooking
Livesock feed
Heating
Water boiling
Agroprocessing
Lighting
Other
4 Rural Energy Situation
The main source of rural energy is
biomass. Only 43 percent of rural
people have access to electricity
which is used mostly for lighting and
milling purposes. Central grid con-
nection to electrify the rural area is
quite impossible because of scat-
tered settlements and difficult terrain.
The only option to electrify the rural
area is decentralize energy devel-
opment from micro hydro and other
renewable energy resources and
distribute from mini grid. Development of rural Nepal largely depends on the devel-
opment of agriculture and agro-based industries. In order to develop agriculture and
agro-based industries, energy is one of the most important inputs that have to be in-
tegrated with rural development policies and programs. This is why this paper fo-
cuses on the integration of the different forms of energy and the rural development.
5 Overview of REDP
The Rural Energy Development Programme (REDP) is a pioneer programme in rural
energy sector in Nepal. It is a joint programme between Government of Nepal (GoN)
and the United Nations Development Programme (UNDP), the World Bank and Local
Government (LG). This programme was initiated on 16th August 1996 as a first
phase as a pilot programme and second phase in 2004. The programme is people‟s
central in nature and shown very good impact on rural people. After successful com-
pletion these two phases and demand from the communities and local governments,
the GoN has forced to implement the third phase of REDP. The phase three has
been effective from 1 September 2007. Decentralization, bottom up participatory
planning, participatory decision making and implementation, participatory monitoring
and evaluation activities are basic pillars for the successful implementation of the
program. REDP is supporting the Government of Nepal (GoN) to implement the Rural
Figure 4: Biomass Consumption
2008
77%
4%6%
13%Firewood
Agriculture
residues
Animal waste
Rest
Figure 5: Commerical Energy
2008
58%21%
14%7%
Petroleum
Coal
Electricity
Others

166
Energy Policy 2006 in 40 districts in this third phase. The Alternative Energy Promo-
tion Center (AEPC) of Ministry of Environment, Ministry of Science and Technology is
the government executing agency.
6 Goal
The main goal of the programme is peace building through sustainable development
based-on social capital building, economic growth and environment management.
7 Strategic Framework
REDP promotes an integrated approach to sustainable rural energy systems devel-
opment in order to have impact in the following action areas: (1) rural development;
(2) improved quality of life for women and children; (3) promotion of efficient end-use
technologies, including the promotion of the non-farm activities, and (4) conservation
and restoration of the natural environment. It is the programme policy to provide
technical assistance not only for use of UNDP resources allocated through this pro-
gramme, but also to provide technical support in promoting rural energy development
from other sources (DDC, VDC, community, donors, government agencies, and oth-
ers) at all levels - centre, district and community. The holistic development, decen-
tralization, community mobilization, and bottom up planning process are the main
strategies of the programme.
8 Objective of the Programme
The overall objective of the programme is to enhance rural livelihoods and preserve
the natural environment by supporting the sustainable development of rural energy
systems, specifically micro hydro for sustainable development and poverty reduction.
9 Working Modality - Holistic Community Development Approach
The programme has been adopted holistic community development approach as an
essential vehicle for self-governance to ensure active participation of local people at
all levels to manage and operate rural energy systems, primarily micro hydropower
and other community development initiatives in a sustainable manner by linking rural
energy with rural economic activities and ultimately impact positively on livelihood of
the rural people.

167
Organization
Development
Environment
Management
Technology
Promotion
Vulnerable Commu-
nity Empowerment
Capital Forma-
tion
Skill
Development
Figure 7: Six Principles of REDP
Community Mobilization Process
9.1 Basic Principles
There are six basic principles adopted by the programme in community mobilization
process:
Organization Develop-
ment: The program sen-
sitizes community mem-
bers to organize them-
selves and work collec-
tively to mobilize local
resources effectively for
productive uses.
Capital Formation:
Capital for development
work is mobilized
through internal and external sources. Regular saving and credit by the community
members help to create further assets for the capital formation.
Skill Enhancement: Skilled people perform their tasks more efficiently compared to
those unskilled; the programme enhancing their capacities to use and maximize the
benefits of the resources.
Technology Promotion: Introduction, adoption, operation and finally internalization
of appropriate modern technologies are considered essential for creating various
employment opportunities for the rural population, and community development.
These technologies also substitute expensive and unhealthy energy sources such as
kerosene, diesel, petrol, fuel wood, which reduces the drudgery to rural people.
Environmental Management: Long term and sustainable operation of MH schemes
depends upon the conservation and management of water sources. REDP promotes
community forestry, plantation and reforestation, watershed management, environ-
ment education and health and sanitation programs to protect the environment.
Vulnerable Community Empowerment: This process empowers vulnerable groups,
women, and ethnic groups and brings them to mainstream of development. These
groups encourage to participate in project planning, implementation and manage-
ment process.
In addition to these six principles, REDP ensures participation of male and female
beneficiaries participation, transparency, rule of law, appropriate technology, ac-
countability and consensus based on inclusive decision-making processes which en-
sues the principle of good governance at all programme stage; which are the key
success factors of the programme.

168
10 Community Mobilisation Process
Community mobilisation process is the most important part of the programme imple-
mentation process. The success of the programme is mainly depends on how effec-
tively community has been mobilised. During the community mobilisation process,
basically two organizations are formulated at grass route level. These are as follow:
Community Organisation (CO): CO is an organisation of people who live in close
proximity and share common interests and willing to work together for the common
goal. At least one male and one female member from each beneficiary household
becomes a member of the organisation. These are broad-based organizations. All
decisions are made during a weekly meeting on consensus basis. It also runs adult
education class for the members. Adult education class is mandatory for women
community organisation.
Functional Group (FG): FG is formed from two or more community organizations
who organise themselves to achieve a certain objective. A working committee is
formed which is proportionately represented by members of all COs. All member of
the group meet at least once a month. During the meeting, decisions on working
committees are made.
Management committee is formed to operate and maintain the MH schemes. It is
represented proportionately by all COs. It makes decisions on electricity distribution,
electricity tariff, employee management, operation and maintenance of the MH
schemes.
10.1 Stages of organization formation
There are four stages of formation of community organization.
Stage I: Formation of Community Organisation (CO)
The first step of community mobilization process is to sensitize VDC chairperson,
vice chairperson, Ward chairperson, members and secretary and local people. A
meeting is organised with VDC and Ward personnel in order to brief them about the
objective and principle of the REDP program. A Community Mobiliser is appointed in
the VDC and establishes a contact office in the VDC. Community Mobiliser goes to
each and every households of the VDC and aware them about the REDP program
and its objective. Public meetings are organised. It is mandatory that at least one
male and one female member from each beneficiary household are present during
the meeting. In the second meeting, representative of Community Organisation (CO)
is formed. Chairperson and manager of the CO are appointed. Baseline Survey of
the VDC is then conducted.
Stage II: Formation of Micro Hydro Functional Group (MHFG)
The matured COs are encouraged to organise themselves into MHFG. At least two
COs, one female CO and one male CO form the MHFG. A representative executive
committee is formed from all participating beneficiary COs. Proportionate representa-
tion from all COs are required. Other Functional Groups for alternative energy
sources like biogas, solar energy improved cooking stove are also formed. If needed

169
and resources are available, other Functional Group are formed together with COs
working in forest, irrigation, drinking water, skill development etc. Every month a
mass meeting is organised. It is mandatory for all members of Functional Group to
attend the meeting. COs and WC of Functional Group submit the progress report and
decisions on future activities are made.
Stage III: Legal Recognition
After six months of the successful operation of the MH plant, the group is registered
as legal entity. DDC and VDC representative and community members discuss and
decide on the registration of the group. The following are the possible registration
options:
Non Governmental Organisation (NGO); Cottage Industry; Company; Multipurpose
Cooperative; Micro hydro cooperative
Most of the functional groups are willing to register as Micro hydro cooperative.
Stage IV: Internalisation
For long term sustainability of the MH schemes, community are trained and empow-
ered to operate and maintain the scheme on their own. Responsibility of Community
Mobiliser is gradually shifted from the community.
11 Bottom up Participatory Planning Process
District energy situation/need assessment
After establishing the DDC:DEES; first of all need as-
sessment has been carried out to formulate the clear
picture of district energy situation with potential re-
sources available in the district. A participatory exercise
to assess the energy situation and needs of a district is
carried out by DDC: DEES. For this, data from various
primary and secondary sources are collected and proc-
essed and prepare a District Energy Situation Report.
VDC leaders are oriented and sensitized on role and importance of energy in com-
munity development, rural energy technologies and about REDP.
11.1 Stages of Bottom up planning process
Bottom up planning process is a unique feature adopted by REDP. Under the given
laws, policies and regulations, REDP broadly categorised the bottom up planning
process in three tiers although all other steps are integrated with in the framework of
LSGA planning process. Due to the absence of representative in local government
and insurgencies in the country, some steps have not been carried out formally. The
planning process starts at the community level and ends at the district level.
Before starting community level planning process the following activities has taken in
DDC and VDC.
LSGA 1999 and Rural Energy Policy 2006 have emphasized the bottom up planning process and given tremendous authority to local gov-ernment to plan imple-ment and operate local level projects.

170
Dissemination of directives and information, budget ceiling for next year provided
by sectoral ministries and NPC
Analysis and review of directives,
policies, guidelines, estimated
budget provided by sectoral minis-
tries/NPC.
Dissemination of information of
programme objectives, activities,
resources, and allocation of esti-
mated budget per VDC
Distribution of project request
forms and orientation to VDC
chairperson, secretary and others
to fill the form
Situation analysis, programmes &
projects analysis to be carried out
in ward/ settlement level by VDC
Community Level Planning
The planning at this level is the foun-
dation of planning process. The VDC
chairperson and the Ward chairperson
facilitate the communities in the ward
to identify energy-related problems,
agree on possible solutions and priori-
tize the projects with respect to impor-
tance, feasibility and ease of imple-
mentation. These identified energy
projects from all communities are
compiled and prioritized at ward level
and forward to VDC.
VDC Level Planning
All the energy projects identified at the community and ward levels are further dis-
cussed in VDC and Village Council (VC) level. They compile and categorize energy
projects into three categories according to their felt needs, resources, people partici-
pation, and ease to implementation.
National Planning Commission
District Council Meeting
District Development Committee Meeting
Integrated Plan Formulation Committee Meeting
Sectoral Planning Committee Meeting
(Agriculture, Social Welfare, Energy, In-formation, Infrastructure)
Ilakha Level Planning Workshop
Village Council Meeting Meeting
Village Development Committee Meeting
Ward Committee Meeting
Community Level Planning Workshop
Figure 7: Flow chart of bottom up planning process

171
Category 1: Projects that can be implemented at the community or ward level.
Category 2: Projects that can be implemented at the VDC level, and
Category 3: Projects that require external support.
After approving VDC and VC, all projects list are forward to Ilaka level for further con-
sultation and improvement.
District Level Planning
After receiving all prioritised list of projects from all Ilakas; DDC: DEES drafts the an-
nual plan and program of the district after discussions with related local bodies, line
agencies, SOs and NGOs. The draft is submitted to the District Energy Committee
(DEC) and to Integrated Coordination Committee for feedbacks. The final plan will
approve by DDC and ultimately by District Council (DC). The DDCs compile, finalise
and publish the energy plan and programs approved by DC in an annual basis. This
annual plan will ultimately forward to NPC for approval and additional resources mo-
bilisation from the central. This annual plan encompasses both planning and imple-
mentation of energy systems and also incorporates the energy and environment re-
lated activities of communities, villages and districts. Similarly DDC:DEES prepare
five year District Energy Plan and Programmes in participatory way.
12 Subsidy and Cost Sharing
Cost sharing is another important
feature of REDP projects. For sus-
tainability of the projects cost sharing
from the community and local gov-
ernment is very important. Generally
REDP provide NRs 15,000 per
household (HH) and not exceeding
NRs 1,25,000 per KW (5 to 500 KW),
similarly up to 5 KW 12,000 per HH
and not exceeding to 97,500 per KW
and similar way other RETs get sub-
sidy as according to subsidy policy of
GoN.
In general, the government subsidy / donor grant
accounts to approximately 50% of the total micro
hydro plant installation cost, DDC and VDC in-
vestment 10% and community in-kind (labor and
locally available construction materials) contribu-
tion 20%. The rest of 20% of the total cost are
mobilized by the community as cash or bank
loan. Project funds for the various activities are
channelized to Community Energy Fund (CEF) through a District Energy Fund (DEF),
which operates through the District Development Fund (DDF). CEF is managed by
Figure 8: Cost Sharing
(1996-2006)
50%
10%
20%
20%
Gov/Donor
Grant
Local Govt
Community
Community
Bank Loan
Project Management Office
District Development Fund (DDF) {District Energy Fund (DEF)}
Community Energy Fund (CEF)
Figure 9: Fund Flow

172
the community in order to encourage local ownership. The role in project manage-
ment is limited for facilitation, technical assistance, monitoring and evaluation.
13 Institutional Setup
Success factor of any project depends on it‟s institutional setup and cooperation from
other institutes. There are different committees, boards, stakeholders and institutions
involve in the implementation stage of the programme. Involving local government
institutions added more advantage to implement project activities at grassroots level.
The following actors and institutions have been involved in REDP‟s MHS programme.
Table 1: Institutions involved Central/national level District level Community level
Ministry of Environment /AEPC National Executive Agency
Programme Advisory Committee (PAC)
Secretary of MoE chair, and representatives from Ministry of finance, Ministry of Local development, Ministry of energy, Ministry of forests and Soil conservations (MoFSC), National Planning Com-mission (NPC), Department of Women (DoW), The World bank, ADDCN, NAVIN, and UNDP. Provides overall policy direction, assesses pro-gress and achievement.
Programme Executive Board (PEB)
NPD (Chair and project executive role), ARR, En-ergy, Environment and Disaster Management Unit, UNDP (Senior Supplier role) and representatives of MoF, ADDCN, and NAVIN (Senior beneficiary role). Responsible for making consensus-based management decisions, includ-ing approval of programme revision and work plans. Project Management Support Unit
National Programme Manager(NPM) Chief of Unit Professional and support staff responsible for implementation, Technical Review Committee (TRC)
Technical, financial, social and environmental evaluation and endorsement of each MHS. Agricultural Development Bank of Nepal Ltd. Nepal (ADB/N)
Provision of loans for MHS purchase. Micro Hydro Private Companies/Supplier
Engaged in manufacturing, supply, and installation of micro-hydro turbines, including other electro-mechanical components.
District Development Commit-tee (DDC) District Executive Agency
District Energy and Environ-ment Management Committee (DEEMC)
DDC chair, LDO, and energy development officer (EDO) for day-to-day implementation activi-ties. District Development Commit-tee: Disrict Energy and Environment Sec-tion (DDC:DEES)
Planning, management and implementation activities. District Energy Fund (DEF)
fund mobilization and utilization Support Organization (SO)
Local NGOs implementing the community mobilization process at commu-nity level Rural Energy Service Centre (RESC)
Private sector organization pro-viding technical (survey, fabrica-tion, repair and maintenance) support for the micro-hydro sys-tem technology.
Community Organi-zation (CO)
Broad-based grass-roots organization of community people. there are separate COs for men and women. Micro-Hydro Func-tional Group (MHFG)
Users‟ group specifi-cally for planning and management of mi-cro-hydro. Made up of members from the COs, ensuring equi-table participation. Community Energy Fund (CEF)
Mobilization and utilization of fund, Including grant, eq-uity, loan and monthly electricity tariff col-lected from consum-ers.
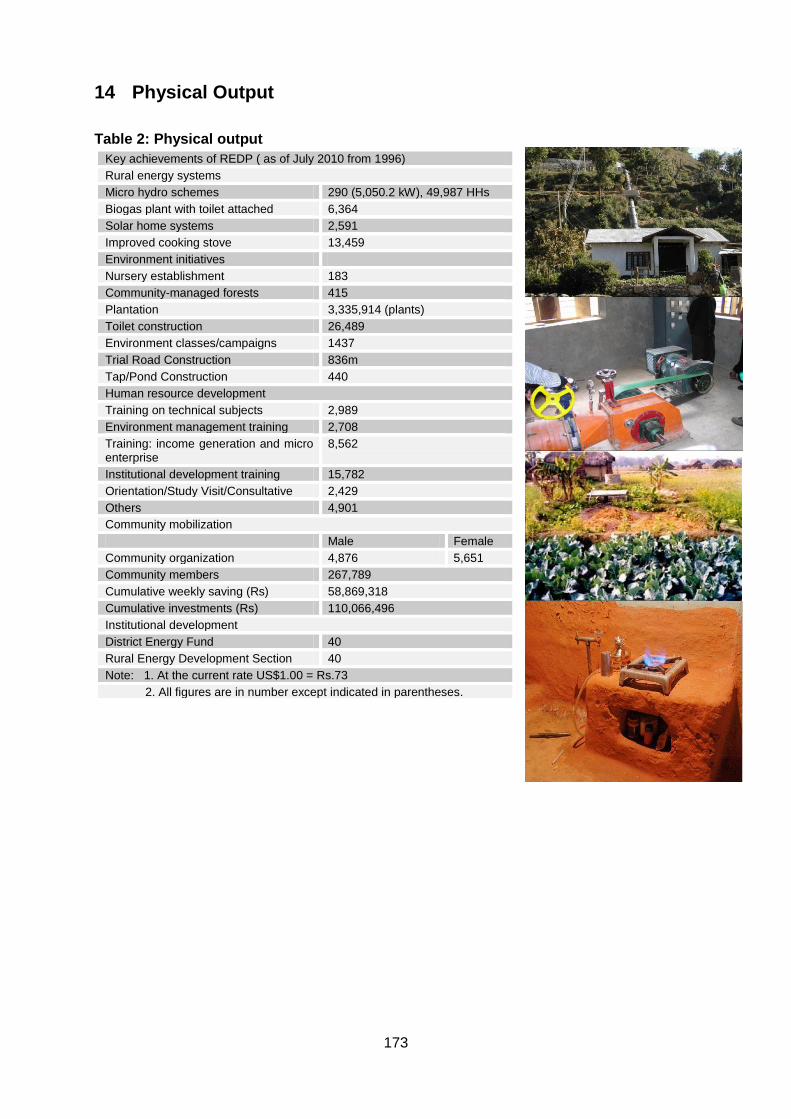
173
14 Physical Output
Table 2: Physical output
Key achievements of REDP ( as of July 2010 from 1996)
Rural energy systems
Micro hydro schemes 290 (5,050.2 kW), 49,987 HHs
Biogas plant with toilet attached 6,364
Solar home systems 2,591
Improved cooking stove 13,459
Environment initiatives
Nursery establishment 183
Community-managed forests 415
Plantation 3,335,914 (plants)
Toilet construction 26,489
Environment classes/campaigns 1437
Trial Road Construction 836m
Tap/Pond Construction 440
Human resource development
Training on technical subjects 2,989
Environment management training 2,708
Training: income generation and micro enterprise
8,562
Institutional development training 15,782
Orientation/Study Visit/Consultative 2,429
Others 4,901
Community mobilization
Male Female
Community organization 4,876 5,651
Community members 267,789
Cumulative weekly saving (Rs) 58,869,318
Cumulative investments (Rs) 110,066,496
Institutional development
District Energy Fund 40
Rural Energy Development Section 40
Note: 1. At the current rate US$1.00 = Rs.73
2. All figures are in number except indicated in parentheses.
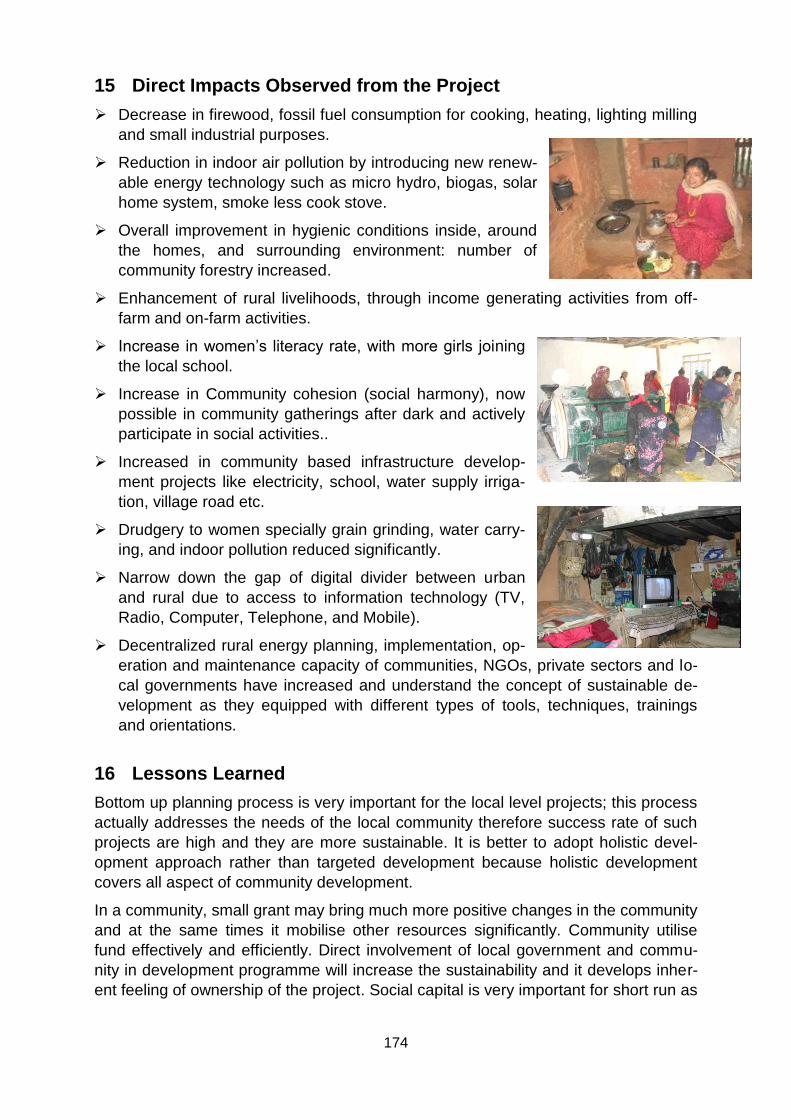
174
15 Direct Impacts Observed from the Project
Decrease in firewood, fossil fuel consumption for cooking, heating, lighting milling
and small industrial purposes.
Reduction in indoor air pollution by introducing new renew-
able energy technology such as micro hydro, biogas, solar
home system, smoke less cook stove.
Overall improvement in hygienic conditions inside, around
the homes, and surrounding environment: number of
community forestry increased.
Enhancement of rural livelihoods, through income generating activities from off-
farm and on-farm activities.
Increase in women‟s literacy rate, with more girls joining
the local school.
Increase in Community cohesion (social harmony), now
possible in community gatherings after dark and actively
participate in social activities..
Increased in community based infrastructure develop-
ment projects like electricity, school, water supply irriga-
tion, village road etc.
Drudgery to women specially grain grinding, water carry-
ing, and indoor pollution reduced significantly.
Narrow down the gap of digital divider between urban
and rural due to access to information technology (TV,
Radio, Computer, Telephone, and Mobile).
Decentralized rural energy planning, implementation, op-
eration and maintenance capacity of communities, NGOs, private sectors and lo-
cal governments have increased and understand the concept of sustainable de-
velopment as they equipped with different types of tools, techniques, trainings
and orientations.
16 Lessons Learned
Bottom up planning process is very important for the local level projects; this process
actually addresses the needs of the local community therefore success rate of such
projects are high and they are more sustainable. It is better to adopt holistic devel-
opment approach rather than targeted development because holistic development
covers all aspect of community development.
In a community, small grant may bring much more positive changes in the community
and at the same times it mobilise other resources significantly. Community utilise
fund effectively and efficiently. Direct involvement of local government and commu-
nity in development programme will increase the sustainability and it develops inher-
ent feeling of ownership of the project. Social capital is very important for short run as

175
well as for long run because it is a collective strength of the community, local and
central government.
17 Recommendation
The following recommendation has been made for further effective implementation of
programme.
Scientific subsidy polices should be introduce so the inflation and market price
can be addressed automatically.
Promote decentralise local grid system between micro hydro so that surplus and
deficit power can be managed in local communities.
Mechanism has to develop to connect power generated by micro hydro to na-
tional grid so that communities can sell surplus power and get extra income.
Benefit sharing mechanism has to development to share the benefit among the
stakeholder and the people who are not covered by the project.
Promote white LED for lighting, which is more efficient then the conventional light
so that more households will be benefited and more energy will be available for
other end use purpose.
Insurance mechanism has to introduce on renewable energy system so that
community don‟t have to worry about natural calamities and other accidents.
Increase coverage of the programme in more DDCs and VDCs so that it mini-
mised the disparity between DDCs and VDCs in rural energy sector and other so-
cial benefits that the programme offers.
18 Award and International Recognition
International community has recognised this programme as a one of the best pro-
gramme in rural energy sector. This programme has been recognized with many
internationally prestigious awards such as Energy Globe Award 2000, Austria; Pearl
of Knowledge Award 2005, Thailand; Global 100 Eco-Tech Award 2005, Japan.
19 Conclusion
Community mobilization, along with elements good governance such as participation,
transparency, rule of law, appropriate technology, accountability and consensus
based on inclusive decision-making processes are the key factors for the successful
implementation of the REDP programme, the beauty of the programme is people‟s
centre, formation of social capital, bottom up participatory planning and management
which contribute the holistic sustainable development; which enhance the rural live-
lihoods. Even a small grant, community has very good positive impact in their liveli-
hood and able to mobilize additional resource from their own and other‟s resources.

176
References ADDCN, 2005, Decentralised Rural Energy Policy
AEPC Reports
Baral, Shambhu Dev 2005, ADDCN, Handbook of renewal energy for local government
Baral, Shambhu Baral 1997, Integrated Waste Mamagement of Pokhara Municipality, Master
thesis, University of Stuttgart
Baral, Shambhu Dev 2003, Integrated Conservation Strategic of Phewa Lake, Pokhara Ne-
pal Final paper, PG Deploma in Environment Management
BSP Nepal Publications
CBS, 2008
Economic survey of Nepal, 2008
Energy Sector Synopsis, Report, 2006
HMG/ADB/FINNIDA, 1998
MoE, 2006, Rural Energy Policy
MoE, 2006, Rural Energy Subsidy Policy
MOPE 2006, Nepal‟s state of environment
MOWR, 2000, Hydro-power Development Policy, 2057 B.S. Ministry of Water Resources,
Kathmandu
Nepal Demographic and Health Surveys 2006
Proceeding of International Conference on RET for Rural Development, IoM, TU 2003
REDP, 1998, A report on an analytical study of REDP‟s rural energy planning process, Bi-
nayak Bhadra
REDP, 1998, Community mobilization guidelines
REDP, 1999, District energy planning and implementation guidelines
REDP, 2000, Annual Report 2000
REDP, 2000, Enhanced livelihoods, enhanced lives: Nepal‟s Rural Energy Development
Programme. A case study prepared by Arzu Rana-Deuba
REDP, 2000, Impact study of Rural Energy Development Programme
REDP, 2000, Independent review of Rural Energy Development Programme
REDP, 2001, Annual Report 2001
REDP, 2002, Annual Report 2002
UNDP, 1996, Project Document of REDP signed in July 1996
UNDP, 2007, Terminal Review Report, Soma Dutta
UNDP, 2007, Project Document of REDP signed in September 2007
WEC, 2007 Country report
WEC, 2006 Energy Sector Synopsis Report
WEC, 2010, Energy Sector Synopsis Report Nepal
Websites referred
http://www.wec.gov.np/
http://www.aepc.gov.np/
http:// www.redp.org.np/
http:// www.undp.org.np/
http:// www.crtnepal.org/
http://www.nea.org.np/
177
Inland Waterway Transportation Development in an Environmental-Friendly Way
Jing Tang
Port and Waterway Administration of Zhejiang Province 86 Hushubei Road, 310011,Hangzhou P.R. China [email protected] Abstract: Inland waterway transportation (IWT) is a green mode of transportation. In the past decade, the inland waterway transportation system in Zhejiang Province has been developed in an environmental-friendly way. The article presents an envi-ronmental management framework for sustainable IWT development and describes some successful practices and experiments in the IWT developing activities. Key Words: Inland waterway transportation, environment, development
1 Introduction
Economic development, infrastructure needs, environmental consideration, can be
and should be harmony with nature. In the case of river management for navigation
infrastructure and operation, decision had been always based upon specific costs
and benefits, without consideration on environmental impacts. [1] However, in the past
decade, under the national developing guideline, the development of inland waterway
transportation (IWT) system in Zhejiang Province has been undergoing a new pat-
tern, developing IWT in an environmental-friendly way.
2 Background information on IWT development in Zhejiang
Zhejiang Province locates to the south of the Yangzi River, facing the East China
Sea. It is a densely-populated area. About 51 million people live on a land area of 0.1
million km2. It is one of the richest areas in China. Its GDP in 2009 is 335 billion dol-
lars, 6570 dollars per capita. Rich precipitation helps to form many rivers and lakes in
this area. There are about 10000-km inland waterways in the Province, including the
world-famous Grand Canal. After dozens of years‟ development, there about 1000-
km inland waterway that is navigable for 500-t vessels. In 2009, the IWT system
transported 219 million tons of cargo, with an average hauling distance of 150 km.
This is 14.5% of the Province‟s freight traffic[2].
The history of IWT development of Zhejiang Province represents a general trace of
many inland waterway systems. IWT had been the major and sometimes the only
transport method before road transportation became dominant because of its advan-
tages of shiftiness and convenience. IWT left the scope of people‟s daily life, but its
slow, dirty and backward image remained. When people realized that the severe en-
vironmental effect of ever-increasing road traffic had brought about great damage to
our ecological system and living surrounding, IWT came back into the focus of a sus-

178
tainable transportation system in future. But it is not a simple return. People have
more understanding on the meaning of a successful IWT system. More consideration
on social and environmental impacts has been taken into account in the process of
development.
3 Approaches of environmental-orientated IWT development
Inland waterway transportation is a typical green mode of transportation. It has big
capacity but cost-saving. The transport capacity of a Class IV channel (navigable for
500-t vessels) equals to that of three 4-lane highways. A new 8-lane highway would
have been constructed if all the goods, transported by IWT between Zhejiang and
Shanghai, had been carried on trucks. The transport cost per ton-km for IWT is 0.064
yuan, 1/2 of railway and 1/7 of highway. It is characterized as low energy-
consumption and low emission. The energy consumption for one billion tons of goods
transported by inland waterways is 7900 tce per kilometer, 69% of that by railway
and 16% of that by highway. A study shows that if all goods transported by inland
waterway in 2006 had been shifted to highway, the additional environmental cost
would have been 7 billion yuan.
Few waterways, whether natural or man-made, have been developed and main-
tained for IWT only. They usually serve multiple purposes, such as agricultural irriga-
tion and drainage, drinking water supply, industrial processing water, waste water
discharge, fishery, recreation, hydropower generation, and flood control. Further-
more, while IWT is essential to modern society, there could be significant negative
environmental impact, including the loss of habitat. The new approach of IWT devel-
Chart 1 Map of Zhejiang Province and its inland waterways
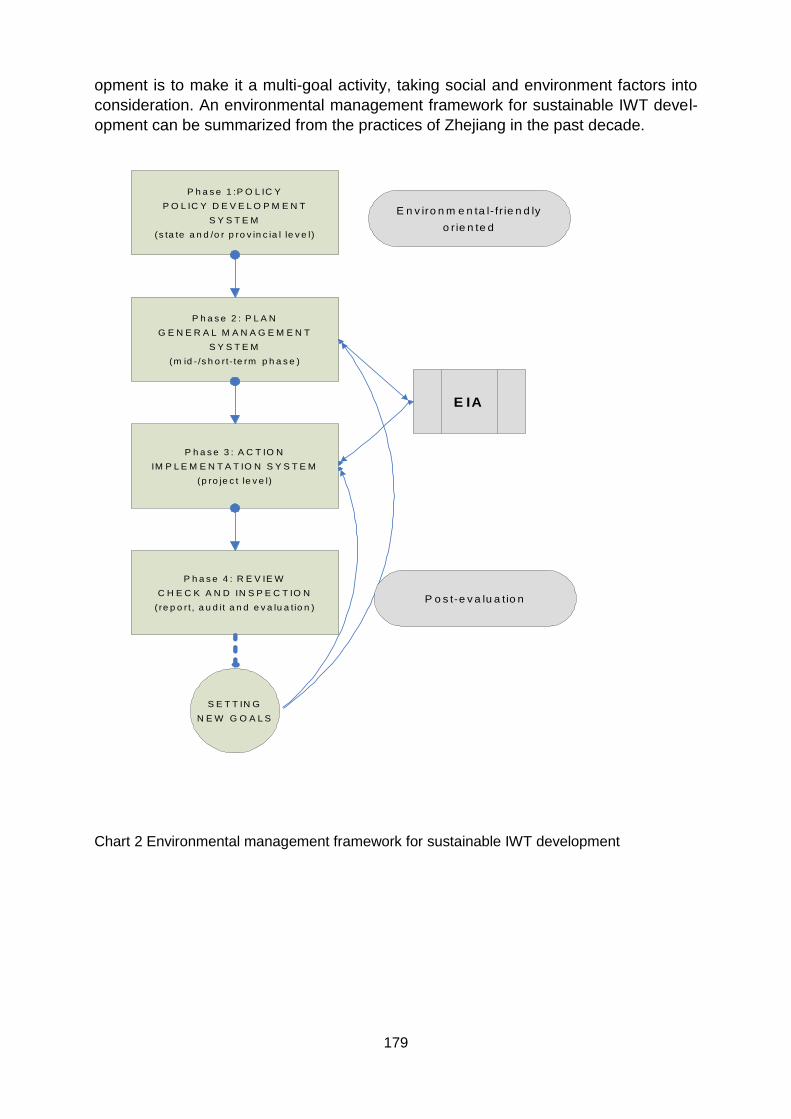
179
opment is to make it a multi-goal activity, taking social and environment factors into
consideration. An environmental management framework for sustainable IWT devel-
opment can be summarized from the practices of Zhejiang in the past decade.
Chart 2 Environmental management framework for sustainable IWT development
P h a s e 1 :P O L IC Y
P O L IC Y D E V E L O P M E N T
S Y S T E M
(s ta te a n d /o r p ro v in c ia l le v e l)
P h a s e 2 : P L A N
G E N E R A L M A N A G E M E N T
S Y S T E M
(m id - /s h o r t- te rm p h a s e )
P h a s e 3 : A C T IO N
IM P L E M E N T A T IO N S Y S T E M
(p ro je c t le v e l)
P h a s e 4 : R E V IE W
C H E C K A N D IN S P E C T IO N
(re p o rt , a u d it a n d e v a lu a tio n )
S E T T IN G
N E W G O A L S
E IA
E n v iro n m e n ta l- fr ie n d ly
o r ie n te d
P o s t-e v a lu a tio n

180
Phase 1- Policy: In the past decade, the Central Government of China set out an
important national developing guideline “to build up a resource-economical and envi-
ronmental-friendly society” in stead of the resource consuming-driven developing pat-
tern. A champion is undergoing to develop a smooth, efficient, safe and green trans-
portation system by promoting IWT system and shift more traffic from road to inland
waterway. Zhejiang Province also has decided to develop the inland waterways into
not only transport corridors, but also ecological, cultural and scenery corridors.
Phase 2 - Plan: In response to updated developing trend, the Province has drawn
out a new IWT Plan as a provincial developing strategy. For the first time, an envi-
ronmental impact assessment (EIA) was carried out at this phase. The report gives a
general research on any obvious social and environmental impacts of the IWT Plan.
Potential conflicts with other plans are searched out, and counter-measures are
composed, including changing waterway routes, strengthening flood control facilities,
introducing precautious environmental actions where risks of serious or irreversible
environmental damages are likely to take place. The Plan and EIA also set out mid-
and short-term goals for vessel standardization and modernization, waste collection
systems at ports, maritime patrol regulations, and salvage action plans.
Phase 3 - Action: An EIA is obliged to take place for each IWT project. Environ-
mental gains and losses are identified and countermeasures for potential environ-
mental risks are listed and updated at each phase of the project. A supervising sys-
tem has been established, using third-party supervision to ensure the fulfilment of all
the countermeasures. New techniques have been applied in construction and opera-
tion of the system, such as eco-bank protection, soil recycling, synchronized lift of
bridge structure, and waste and oil collection of vessels. Historical heritage and relics
protection is also a big factor in the selection of alternatives.
Phase 4 - Review: A checking procedure of environmental measures listed in EIA is
a must for the completion of the whole project. A check list provides the overall infor-
mation on how the project has fulfilled the environmental tasks during construction
period. A series of samples are collected to monitor the environmental status during
operation period, by IWT project owner and/or the environmental department.
The Loop: A closed loop for continuous environmental protection has been formed
during the IWT developing activities in the past decade. Post evaluation of IWT pro-
ject gives new ideas for further development. New goals are set out for IWT projects
in better combination between infrastructure development and ecological preserva-
tion and environmental protection.
4 Experiment and Practices 4.1 Planning industrial developing axles along inland waterways
Jiaxing has a dense inland waterway network. There are more than 50 km canals in
every 100-km2 land. Boats and barges were still the only transport tool for many vil-
lages and townships in the 1970s. Inland waterway transportation plays a very impor-
tant role in people‟s daily life and economical activities. The Municipality of Jiaxing
has made a plan on the use of waterfront and the corresponding hinterland to provide
guidelines of the layout of industry zones along inland waterways. The Plan draws
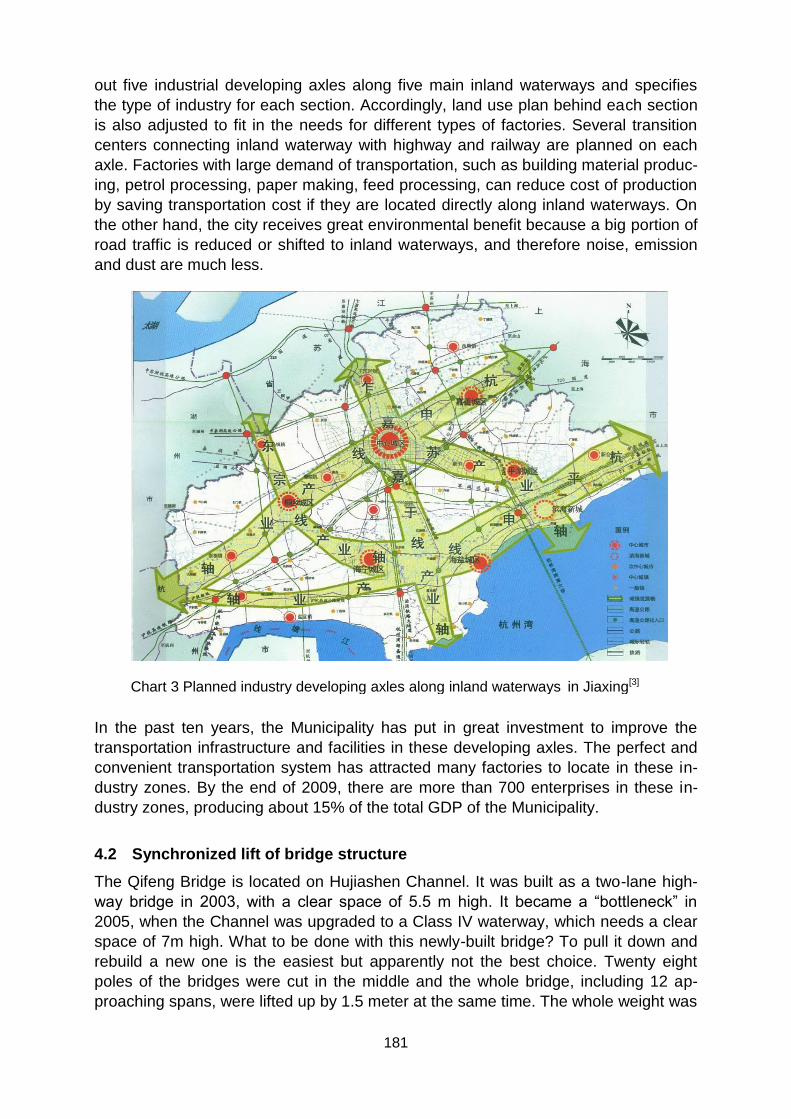
181
out five industrial developing axles along five main inland waterways and specifies
the type of industry for each section. Accordingly, land use plan behind each section
is also adjusted to fit in the needs for different types of factories. Several transition
centers connecting inland waterway with highway and railway are planned on each
axle. Factories with large demand of transportation, such as building material produc-
ing, petrol processing, paper making, feed processing, can reduce cost of production
by saving transportation cost if they are located directly along inland waterways. On
the other hand, the city receives great environmental benefit because a big portion of
road traffic is reduced or shifted to inland waterways, and therefore noise, emission
and dust are much less.
In the past ten years, the Municipality has put in great investment to improve the
transportation infrastructure and facilities in these developing axles. The perfect and
convenient transportation system has attracted many factories to locate in these in-
dustry zones. By the end of 2009, there are more than 700 enterprises in these in-
dustry zones, producing about 15% of the total GDP of the Municipality.
4.2 Synchronized lift of bridge structure
The Qifeng Bridge is located on Hujiashen Channel. It was built as a two-lane high-
way bridge in 2003, with a clear space of 5.5 m high. It became a “bottleneck” in
2005, when the Channel was upgraded to a Class IV waterway, which needs a clear
space of 7m high. What to be done with this newly-built bridge? To pull it down and
rebuild a new one is the easiest but apparently not the best choice. Twenty eight
poles of the bridges were cut in the middle and the whole bridge, including 12 ap-
proaching spans, were lifted up by 1.5 meter at the same time. The whole weight was
Chart 3 Planned industry developing axles along inland waterways in Jiaxing[3]

182
6000 tons, but with the computerized synchronizing technique, the renovation of the
Bridge was very successful, resulting in significant economic and environmental
benefits.
Chart 4 shows clearly that the synchronized lift technique saved about ten million
yuan, as well as relieved many negative impacts on the surroundings due to less
construction work and shorter construction period.
Alternative 11) Alternative 22)
Cost 12 million yuan 2.5 million yuan
Construction time 24 months 3 months
Construction waste More than 6000 tons About 50 tons
Construction site 12000 m2 300 m2
Waterway traffic stop 500 days 60 days
Traffic diversion cost 2.5 million yuan 150000 yuan
1): Alternative 1 refers to building a new bridge.
2) Alternative 2 refers to renovating the bridge using the synchronized lift technique.
4.3 Ecological bank protection
The northern part of Zhejiang is one of the earliest regions where inland waterway
transportation started. It is also a region with densely-distributed cities and towns.
Because of the limitation of space and land, the traditional bank revetment is usually
vertical, made of stone blocks. While it gives a good protection from water wash, it
takes little consideration on the ecological side and has several shortcomings:
High construction cost, because most of the construction materials need to be
excavated from stone mines and transported to working site
Long construction period and uncertainty in construction quality, because most of
the construction work is done by manpower.
Chart 4 Comparison of two alternatives[4]

183
Stopping water exchange cycle and reduce habitat in wetland for amphibious
animals, because of the vertical impermeable stone walls.
The idea of ecological bank protection is to develop IWT while wetland eco-system is
preserved. A newly-designed eco-bank structure, permeable prefabricated concrete
caisson, was constructed. The structure is mainly formed in two parts: the lower part
is a permeable caisson filled with rubbles and the upper part is a gentle slope cov-
ered with coconut fabric. Firstly, the caisson allows water to go through but stops soil,
therefore the bank is “breathable”. The space among the rubbles provides habitat for
fish and amphibious animals and growing space for water plant roots. Secondly, the
coconut fabric forms a protecting blanket before the vegetation on the slop gets
strong enough to stop erosion. As time passes the fabric degrades to become or-
ganic fertilizer for the vegetation. Thirdly, domestic plants and vegetation are se-
lected to construct a wetland biotic community. Furthermore, a 50-cm-thick layer of
soil covers the top of the caisson to guarantee the continuity of the community. Mixed
botanic groups of emergent plants, hanging plants, grass, bushes, woods and trees
have successfully re-established an artificial but stable wetland eco-system, together
with plankton, fish, amphibious animals and birds that joined in later.
The structure is economically and environmentally feasible. With cheaper and reach-
able materials and practical technique, the structure fulfils the task of bank protection
as well as preserving wetland‟s species diversity. A post evaluation presents several
advantages of the structure:
Holes in wall
Rubbles in caisson
Low top elevation
Bamboo sheet
Soil in caisson
Coconut fabirec blanket
Continous botanic community
Chart 5 Cross section of a permeable prefabricated concrete [5]
caisson

184
The prefabrication and mechanized installation of the main parts of the retaining
wall makes it possible to speed up the construction. The construction time is only
one-fourth of the traditional style. The construction quality is also much better and
easy to be controlled.
Cost for civil works is 100 yuan less per meter. Though the plants cost some in-
vestment, but when the preserved eco-system is added as an evaluating factor,
the investment is worthwhile.
Because of the use of caisson, raw rock is no more a must. Every meter of re-
taining wall needs 0.5 m3 less of stone. This means about 1,000,000 m3 of stone
can be saved to complete the upgrading works in the later five years.
4.4 Disposal and recycling of excavated and dredged soil
Earthwork is an important part of IWT upgrading construction. A study shows that
more than 50 million cubic meter of soil was produced in the past ten years, half dry
and half wet. How to deal with the soil is not only an engineering problem, but rather
an environmental concern. Improper disposal of soil can lead to environmental disas-
ters, such as soil erosion and water condemnation. Some common solutions are bor-
rowing nearby land for temporary storage, reclamation of land, making bricks, and
filling abandoned ponds. However, as the available land becomes limited and the
environmental regulations become stricter, new ideas have to be innovated to deal
with the disposal of soil and to overcome the timing, space and quality problems of
excavated and dredged soil.
Soil exchange service information center:
The concept is to set up a public website of an information platform accessible to all
potential “suppliers” and “consumers” of excavated and dredged soil from IWT pro-
jects, and some self-financing storage yards. The platform requires the “suppliers”
and “consumers” to put in data about when, where, what kind and how much soil is
supplied or needed. In return, they can use the platform as a match tool. If a real es-
tate developer finds, on the platform, that an IWT project will provide the qualified soil
just at the time when he starts the planting works, he can contact the IWT project and
work out a transfer plan directly to his construction site. Dredged soil can be stored in
a storage yard, with qualified environmental protection and processing measures,
until it gets dry enough to be used. The use of the Platform is free, but the storage
yard is a paid service.

185
Dry excavated soil for road construction:
The common material for roadbed is mining slag, a mix of rock and soil from stone
mine. As the mine resource becomes less, the cost of traditional construction method
increases. A mixture of dry excavated soil and lime can produce a good material for
roadbed. Two parallel projects were selected to start the practice, a highway project
and a waterway project. The two projects were only one km away and the construc-
tion timing was designed to ensure constant supply of soil for roadbed construction.
Under such arrangement, the excavated soil could be transported to road construc-
tion site without any storage and the transport distance was the shortest. The 10-km-
long highway used about 0.5 million cubic meter of soil, excavated from 10-km-long
waterway. A study shows that the arrangement saved about 1.6 million yuan for
transportation and 45 million yuan for borrowing land. It would have needed about
20-25 ha of land to store the soil, and more than 50,000 trucks to transport the soil
out of the construction site. Think about the cost behind and the noise, dust, emission
that would have caused by the transfer!
5 Way to go
After several years‟ hard work, a more efficient, safe and green IWT system begins to
take shape. But it is still too early to celebrate. More challenges are ahead. From the
beginning of this year, IWT Plan is being updated. The two major projects are the
Grand Canal and the Qiangtangjiang River.
The Grand Canal and its stretches have a history of more than two thousand years. It
is now applying to UNESCO for the title of World Heritage. Therefore, the big task of
the upgrading planning is to find a good balance between heritage protection and
Soil Ex-change Service In-formation Center
Storage yard data
User data
Service center
Location on GIS map
Location on GIS map
Space availability
Soil data input
Soil data
Input and inquiry
Monitoring
Data management
Inquiry tool
Chart 5 Structure of SESIC Platform [6]

186
IWT development. A detailed survey is carried out by the cultural heritage sector, in
hand with the IWT sector, to identify the scope and items of physical and non-
physical heritages and historical relics along the Canal. The primary thought is to
make a buffer zone of 400 m wide on two sides of the Canal. No construction activity,
which is not related to IWT, flood control and heritage conservation, is allowed to
take place in this protected zone.
The Qiantangjiang River is the biggest river in Zhejiang. It runs from west to east
across the Province, connecting inland areas with big seaports. Compared with the
eastern part of the Province, the mountainous western part is less developed, and a
transport corridor with big capacity is essential to local economy. Dams and locks are
designed to get enough water depth and make the river navigable for 5000-t vessels.
A big portion of the investment goes into resettlement, environmental compensation
and water facilities of this region where the ecological system is fragile and sensitive.
Dozens of studies are going on to eliminate or relieve the environmental impacts.
These are just plans, ideas in our mind. Actions will be followed. With our efforts, we
have the confidence to build our inland waterways smoother, greener and more
beautiful.
References [1] EnviroCom Report of WG 6: Guidelines for Sustainable Inland Waterway and Navigation:
PIANC, 2003, Page 6
[2]Port and Waterway Administration Bureau of Zhejiang Province: Annual Statistic Book of
Port and Waterway of Zhejiang Province (2009), Hangzhou, China: Page 108 and 109
[3]Planning Department and Transportation Department of Jiaxing Municipality: Utilizations
and Development Plan of Jiaxing Inland Waterway Coastline, Jiaxing, China: Attached Chart
1
[4]Tang Jing et al: Study Report on technique of inland waterway upgrading, Hangzhou:
2006, Page 20-21
[5]Tang Jing et al: Study Report on Bank Protection in an Environmental-Friendly Way,
Hangzhou, China: 2006, Page 21
[6]Chen Zhejiang et al: Study Report on Utilization of IWT soil, Hangzhou, China: 2008, Page
70

187
Social Infrastructure Networks: The Role of the Social In-frastructure Allocation on the Territorial Attractiveness
Santiago Sanchez Guzman Candidate Dr.TU Wien, Department of Spatial Development Infrastructure and Envi-ronmental Planning. Centre of Regional Science, Prof.Rudolf Giffinger. Gruenbergstrasse 9, Top 15 1120, Vienna Austria [email protected] Abstract: “In 2008, the world reaches an invisible but momentous milestone: For the first time in history, more than half its human population, 3,3 billion people, will be living in urban areas” UNFPA (2007).The physical expansion of the built environment has continued all around the world. The promise of the “city” as the best engine to create civilization, economic development and welfare could be one of the most visi-ble features of the XX century. The prestige of the “Urbanized” life over the wild non developed one, common in the open land can be seen as a root of strong migration phenomenon in some regions around the world. The dream of an improvement in the living standards as well as the concentration of human development opportunities may be seen as “half reality” that built contexts offer for their citizens (not matter at what real costs), configure the scenario of a territorial “competition” between urban-ized and less even non urbanized territories (Giffinger 2009)9. Under this territorial competition perspective Global cities compete not only between each others but among territorial and transnational levels, affecting the development of nations and the course of the economy. One of the key factors for the constitution of this attrac-tion poles is based on the concentration of infrastructures that together bear, drive and boost the different possible interaction between all the involved actors. It is not so difficult to imagine how important is the provision and maintenance of technical infrastructures and their networks as Transportation, basic services (Energy, water…) and telecommunications, for the performance of this built agglomerations. Neverthe-less not any built agglomeration might be called a city even an urbanized context. At this point of development none less important than technical infrastructures are the social infrastructures. Social infrastructures as retail (Markets), health, education and recreation, play a fundamental role on the sustainability, organization and consolida-tion of built environments as long as they maximize the accessibility to human re-sources, they shape the quality of the human capital and their allocation organize the territory as well as the movement (destinations) of the actors. Thus the present document seeks to underline the role of the social infrastructures on the territorial attractiveness at different regional scales; analyze the features of the different social facilities and finally is an attempt to define the networks of these infrastructures.
Key Words: Social Infrastructure, place attractiveness, infrastructure allocation.
9 Giffinger, Rudolf & Stallbohn, Mariana (2009). Challenges of metropolitan development: Strateg-
ic efforts in comparison of Barcelona and Vienna. Paper for EURA-Conference, Madrid, June
2009.

188
1 Introduction
The trend of urbanisation has continuing all over the world. According with United
Nations and other researchers we are living for the first time in a moment where more
than the half of the entire population of the world, 3,3 Billion People, is concentrated
in urban areas (UNFPA 2007)10. This fast urbanisation process has several implica-
tions and impacts at the environmental, economical and social level, influencing the
entire sustainability of a territory as well as the quality of life with in.
Impacts of cities and metropolis like Mexico City with more than 20 million inhabitants
in its metropolitan region, Sao Paulo with 17 million or even Bogota with almost 8
million are visible in their entire countries when we try to answer questions like: how
to feed their population, or how to educate them, or how to clean them.
One of the key elements associated to the sustainability of a place is the manage-
ment of their natural and human resources through the infrastructure, in order to im-
prove accessibility, distribution, use and regeneration of them in a long run.
Thus, Infrastructures understood as “the basic physical and organisational structures
needed for the operation of a society or enterprise, or the services and facilities nec-
essary for an economy (society) to function”11 are at the core of the discussion of
sustainability and quality of life in built environments as well as in a regional perspec-
tive.
Different characteristics of infrastructures like capacity, quality or accessibility to it
play an important role in analysing the level of service of it and the effectiveness in
managing the resources.
The present work deal with the allocation of social infrastructures and it impacts on
the territorial attractiveness of a place, its implications on migration, on territorial capi-
tal and territorial competition as well as on natural and human resources.
1.1 Main and related questions
The main question the present paper is dealing with and trying to answer is:
What is it that makes some built environments, places or regions more attractive than
other to live or migrate in?
Behind this core question it is possible to perceive some other important questions:
Are social infrastructures such as the related with health, education, security, sport,
recreation and culture, a factor influencing decision of resettlement of a citizen?
How do social infrastructures affect the territorial capital of a place?
Is it possible to improve or affect some how the management of resources in a place
due to the allocation of social infrastructure?
And finally which type of different strategies could be used during the planning proc-
ess as well as during analysis faces in order to improve allocation of social infrastruc-
tures?
10
United Nation Population Fund (2007). State of world population 2007. Unleashing the Potential
of Urban Growth. Seen in : http://www.unfpa.org/swp/2007/english/introduction.html , 2007-08-05 11
Sullivan, Arthur; Sheffrin, Steven M. Oxford English Dictionary 2003.

189
1.2 Topic description and relevance
According to the 2004/5 UN-Habitat report “state of the world‟s cities” by 2003 there
were 39 cities over 5 milllion in population and 6 over 10 million (UN_Habitat 2004).
Urban and rural populations of the world 1950-2050. UN 2007 WUP document
The urban population growth around the world has been and will continue being one
of the central topics on development discussions during the next years. Different evi-
dences all over the world shown how the growth of immigration in the cities maintain
a positive tendency, emptying the rural areas and densifying built environments in an
unbalanced territorial competition where at the end no one, the city or the rural, is
really winning.
Huge negative environmental impacts, high social disparity, territorial fragmentation,
urban sprawl and poverty are some of the main problems associated with Rapid ur-
ban Growth in different metropolis all over the world.
The successfully attractiveness of the urban territory sold and spread all over the
world based on the dream for better job opportunities and a better quality of life have
to be reviewed under the perspective of giving a choice to the migrants.
Concentration of most of the social infrastructures in some urban places has built
with the pass of the years a monopolised system in some countries, where inhabi-
tants do not have more options to study, go to the right medical centre or find justice
than in big cities. Therefore is it possible to say that concentration (Isolation) of social
infrastructures in urban contexts is creating big disparities between territories and
population due to the lack of accessibility those social facilities some of them have.

190
1.3 Seeks of the following paper
The following paper is an attempt to find out the role of the social infrastructure on
the territorial attractiveness at the micro and macro scales.
It also looks for understand how social infrastructures allocation affect the capital of a
region and how it influences the resources of a place.
Finally with the following paper is presented a basic organisational network structures
related to it.
The topic of the following document takes part of a wider doctorate research: “Net-
working Infrastructures: The syntax of the infra-lattices affecting territorial develop-
ment”, directed for Univ.Prof.Mg.Dr.Rudolf Giffinger at the Vienna University of Tech-
nology, Department of Spatial Development, Infrastructure and Environmental Plan-
ning, Centre of Regional Science.
2 Problem statements
Magnetism is probably one of the most relevant and effective capacities of the built
environment. Behaving as a magnet, cities and metropolis have become strength
migrant attraction poles due to the multiple possibilities they offer for different publics.
Is at the built environment where the best job opportunities are suppose to be found,
where the highest interaction between inhabitants is possible and also where the bet-
ter possibilities for human development as education and culture might be found.
The overlapping of different urban systems and networks like the one for housing,
retail or transportation during the history, the increase and constantly improvement of
those systems and the consolidation of recognisable “place personality” make easily
for citizens to feel represented with their city.
Magnetism. The attractiveness of a territory may be compare with the power of a
magnet. Image from internet free source.
Thus it is possible to talk of a territorial competition between built environments that
are attracting and winning migrants against rural environments in a kind of
synoikism12 process, where more than exchange and interaction between the two
12
Synoicism, Synoecism or Synecism is the amalgamation of villages and small towns in Ancient Hel-
las into larger political units such as a single city. The world itself means “dwelling together”, or “to
unite together under one capital city”. In the city states of Classical Greece, synoecism occurred when

191
environments emerge a dependency and monopoly of the human development pos-
sibilities.
3 Place Attractiveness
“The ability of places to attract migrants is of fundamental importance to local and
regional development” (Niedomysl 201013). There are several reasons why people
migrate, as well as there are different types of migration being the most relevant for
the present research rural – urban migration and urban – urban migrations.
The sense of place, what makes a territory attractive is a sum of different elements
with regard to its history, its socioeconomic characteristics and its geographical com-
ponent. All these elements define the capital of the built environment, and together
constitute the specific identity of every city.
Thus it is possible to imagine how some cities identities are closer to each other and
other not, producing competitiveness between some in terms of attracting specific
labour force or specific skilled professionals like “the creative class” for example
(Florida 2002, 2005).
Concentration of social infrastructures in specific built environments as a method of
allocation will, under the theoretical construct until now presented, increase the
sense of place just in those areas, motivating unidirectional in-migration.
3.1 Migration
There are several relationships between urbanisation processes and migration. Ac-
cording with Kraler14 for example “Urbanisation is closely related to migration”… and
international migration into major Urban centres has to do with Economic linkages
(global value chains), structural economic change (service economies), cities as the
political centres (international organisations) and Cities as the religious and cultural
centres. And here is really relevant to be accurate and clarify that there are different
kinds of “human mobility” associated to the urban magnetism and that not all are
here analyzed like tourism, commuting, exile and exodus (closer to the processes
relevant for the present work but traditionally used to explain migration attracted at
the industrialization period).
As said before the kind of migration relevant for the present analysis is a rural-urban
long term migration, motivated principally for the desire of human development and
the absence of social infrastructures at the origin point. This will be described at the
next chapter but it refers to territories with lack of education provision, absence of
the "demos" combined, usually by force, with and submerged the "politiea" to form one political union.
Definition took from Wikipedia. Seen in July 2010 at: http://en.wikipedia.org/wiki/Synoecism 13 Niedomysl, Thomas (2010). Towards a conceptual framework of place attractiveness: A migra-tion perspective. Geografiska Annaler: Series B, Human Geography 92 (1): 97–109. 14
Kraler, Albert (2010). Migration and urbanization: Theoretical approaches to studying migra-
tion related aspects of urbanizations. Conference made at the Vienna University of Technology,
April 20th, 2010. International Centre for Migration Policy Development.

192
cultural centres and reduced markets among other. Or in a wider way places with a
small capacity to allow interchange at the academic, cultural and sociological level.
3.2 Territorial capital and competition
Looking for a better understanding on the described territorial competition, indentify-
ing what is an urban area become relevant.
Several definitions might be used to clarify the difference between both rural and ur-
banized environments, but according to Kraler (2010 idem.) four elements play a
role in order to identifying what an urban area is: The density of the built environment
(number of houses per area), the population density (Inhabitants per square kilome-
tre), the functionality of the place (urban areas allow and promote specific functions
as business centres or infrastructures like schools, health services and markets), and
the economic sector distribution (low share of agriculture, high share of services and
industry).
Authors and researchers like Giffinger (2009) or Camagni (2007, 2009) have pro-
posed that competitiveness based on the territorial capital is one of the driving forces
of regional development15.
For Camagni “In terms of international and interregional trade theory, regions do not
compete with each other on the basis of a Ricardian “comparative advantage” princi-
ple – which guarantees each region a role in the international division of labour – but
rather on a Smithian “absolute advantage” principle, similar in nature to Porter’s con-
cept of competitive advantage (Camagni 2002)… Definition of possible growth
strategies for each region, city or territory must necessarily rely on local assets and
potential, and their full and wise – exploitation: in short, on what is increasingly called
territorial capital”16.
As seen with the concept of territorial capital, Camagni calls the attention to the use
or exploitation of local (natural) resources. Social Infrastructures are related with re-
sources but at the human development level, what means they are related to human
resources as will be presented in the next chapter.
Thus talking about from the perspective of the human development and quality of life,
allocation, growth, improvement and renovation of social infrastructures will influence
the human territorial capital of a place and therefore it competitiveness in a global
perspective.
15
Giffinger Rudolf (2009). Territorial capital: It’s meaning for urban and regional development.
International scientific conference: Regional development, spatial planning and strategic governance;
Belgrade, December 2009. 16
Camagni, Roberto (2009). Territorial capital and regional development. In Handbook of regional
growth and development theories; Capello Roberta and Nijkamp Peter editors. Edward Elgar Publish-
ing Limited, UK.
193
4 Social Infrastructures
The term infrastructure is usually associated to technical infrastructures like those
related with energy, water management, transportation, telecommunication, waste
management and monitoring.
In the present work and aiming for a systemic comprehension of the facilities involve
the term “Social Infrastructures” is proposed covering those infrastructures related to
health, education, security, justice, sport, recreation and culture.
Facilities associated as social infrastructures in the present work have been defined
from different authors with in other concepts like services or urban equipments
(scholar equipments, health equipments and so on). The intention behind involve all
them under the concept “Social Infrastructure” is oriented to watch them as a specifi-
cally system that overlap other different systems at the built environment.
4.1 Resources and Infrastructures
Using the definition of Infrastructure lived at the introduction of the present document
Technical Infrastructures are the physical and organisational structures and networks
that maximize contact (accessibility), use and distribution of natural resources.
In fact technical infrastructures are in direct contact with natural resources like water,
wind and earth and allow us a better management and use or exploitation of them.
Symmetrically Social infrastructures are understood here as the physical and organ-
isational structures and networks that maximize contact (accessibility), use and dis-
tribution of human resources. Know how (practical knowledge), Know what (facts),
Know why (science) or know who (networking), together with intangible cultural as-
sets are all social or human resources. These resources, as the natural ones should
be managed, used and exploited in a sustainable way, allowing new outcomes, im-
provements and actualization of the sociological and human environment.
While improvement, new investment and direct works on technical infrastructures will
produce direct impacts on production and natural capital, social infrastructure in-
vestments or improvement will have direct impacts on human capital.

194
Social and technical Infrastructure Diagram. Author.
4.2 Networks
By definition, the term infrastructure means not only a facility but an interconnected
system, a network. Infrastructures are organisational structures of interchange, not
just buildings or independent facilities.
Networks interconnectivity is real and visible when talking about technical infrastruc-
tures, like energy transmission lines, or highways on transportation (in transport the
infrastructure is the network itself), or in water pipelines, and so on.
But when talking about social infrastructure, networks are not so clearly defined, or
are established in other levels.
Networks play a role in social infrastructure at least in two ways: during the planning
process and in a sociological level.
Social infrastructure networks are useful during the planning process in order to allo-
cate in a systematic and coordinated manner the new facilities. Overlapping different
systems as a methodology will allow planners to check for “connectivity‟s” of the sys-
tem with the built environment.
The second kind of network associated with the social infrastructure is a social net-
work. Social networks are established for citizens but the fact that institutions are part
of an entire system will motivate them and give them already a node where to con-
nect with the others.
INFRASTRUCTURE
ENERGY
WATER MANAGEMENT
TRANSPORTATION
TELECOMUNICATION
WASTE MANAGEMENT
TECHNICAL
SOCIAL HEALTH
EDUCATION
SECURITY
JUSTICE
SPORT AND RECREATION
CULTURE
MONITORING
Physical and organizational structures and networks that maximize contact
(accessibility), use and distribution of
natural resources.
Physical and organizational structures and networks that maximize contact
(accessibility), use and distribution of
human resources.
Direct impacts in human capital
Direct impacts in natural and production capital

195
5 Role of the Social Infrastructure Allocation
The last part of the paper is dedicated to the role itself of the social infrastructures
allocation, what might be understood from two different sides: One is a general or-
ganisational role, where due to the allocation the entire context functionality is af-
fected or activated. In this role, the social infrastructure might be allocated in two
ways, centralized or distributed.
Besides organisational roles social infrastructure might be used to develop an entire
networking structure of the built environment. Here, through the allocation of social
infrastructure an overlapped planning process is carried out in order to integrate ur-
ban clusters in a network lecture.
5.1 Organisational Role
Mainly there are two place allocation methods: One based on concentration of social
infrastructures in one spatial unite. This method is developing a spatial efficiency or-
der, where investments are centralized in one big (normally) multifunctional place.
The second organizational method is a spatial distributive method, where, in stead of
a centralized organization, social infrastructures are divided all over the build envi-
ronment, looking for a spatial equity or equilibrium.
This distributive approach should be done with regard to different developments con-
cepts:
- Geometrical equilibrium: where every certain xx meters a facility should be al-
located (also possible to carry out following catchment areas capacities).
- According to population densities of the context: where facilities will not follow
a geometrical abstract grid but will react to the specific amount of inhabitants
are found on the context.
- With regard to development corridors: Distributive approach where social in-
frastructures are distributed along planned development corridors in order to
influence uses along the corridors.
- Based on transport accessibility: Allocation will react to how transport accessi-
bility analysis suggests a right place is.
5.2 Network development Role
Aiming for a continued urban experience (opposite to a fragmented experience), so-
cial infrastructure allocation might be used to regenerate the structure of built envi-
ronment, giving or assigning hierarchies to the urban clusters as a participants of a
network.
Urban network experience built among the overlapping of different systems will re-
discover for example brown fields and including them again to the built environment
experience. Consolidation of networks systems with in the urban territory are looking
for a reconstruction of the urban fabric and its continuity lecture and use.

196
Main 3 spatial network systems. Image from internet free source.
6 Conclusions and further work
A better quality of life as well as human development perspectives are reason that
influences the choice of a migrant at the moment of resettled.
Social infrastructures are not the first reason why many people migrate, but distribu-
tion of it might help with a more equity and sustainable territory, as well as with a
more balanced used of the human resources.
Social infrastructures might affect the territorial capital of place while affecting human
capital. Social infrastructures improve the way human capital is managed.
Allocation of social infrastructures is a key factor on spatial and social equity con-
struction.
The concept of territorial capital based on absolute advantages analyzed from the
perspective of the human capital and human resources still has a perspective of
analysis when talking about migration (“dynamic capital”). How does skilled and pro-
fessional migration affect the human territorial capital of a place and its absolute ad-
vantages?

197
References
- Klanten, Robert, Bourquin, Nicolas, Tissot, Tibaud, Ehmann Sven Editors (2008). Da-
ta Flow. Visualizing information in graphic design. Berlin, Germany. Gestalten.
- LLewelyn – Davies (2000): Urban Design Compendium. London. English Partner-
ships and the Housing Corporation.
- Marshall, Stephen (1998). Defining the Dimensions of Urban Design. Originally
appearing in “The Planning Factory”. London. Bartlett School of Planning. Seen in:
http://www.bartlett.ucl.ac.uk/research/marshall/publications.htm#texts , 2007-08-01
- Meuers, Henk (2003): Special issue: Land use and Sustainable Mobility, editorial.
European Journal of Transport and Infrastructure Research (ISSN 1567 7141). EJ-
TIR, 3, No. 2, pp. 109-117. Technische Universiteit Delft. Seen in http://ejtir.tudelft.nl/
2007-06-15.
- MVRDV (1999). METACITY DATATOWN. Rotterdam, Holland. 010 Publishers.
- Oswalt Philipp and Rieniets Tim, editors (2006). Atlas of Shrinking Cities. Atlas der
schrumpfenden Staedte. Berlin, Germany. HATJE CANTZ.
- University of the Arts, London. (2001): Harvard Style of Bibliographical Refer-
ences. London. Seen in: http://www.arts.ac.uk/docs/llr_harvardstyle.pdf , 2006-03-16
- Hillier, Bill (2004-2007). Space is the Machine. A configurational theory of archi-
tecture. London, United Kingdom. Space Syntax group. UCL.
- Burdett, Ricky and Sudjic, Deyan, editors (2007). THE ENDLESS CITY. The Urban
Age Project by the London School of Economics and Deutsche Bank’s Alfred
Herrhausen Society. London, New York. Phaidon Press Limited.
- Baudrillard, Jean (1981). SIMULACRA AND SIMULATION. The university of Michi-
gan Press.

198
Remote Sensing and GIS for Urban Infrastructure Planning and Management
Cláudia Maria de Almeida Brazilian National Institute for Space Research Avenida dos Astronautas, 1758 – SERE I – S. 6 12227-010 São José dos Campos Brazil [email protected] Abstract. This paper provides an overview on recent achievements in urban remote sensing and GIS, designed to support infrastructure planning and management. Some of the topics covered will deal with the usage of high spatial resolution satellite images and object-based image analysis for automatically classifying urban land cover and land use. Information on land cover and land use is precisely useful for assessing the needs for expanding the currently available technical and social infra-structure, for conducting evaluations on urban quality of life and urban microclimate, for detecting illegal urban sprawl, and for assessing the city impervious surface and the related flood-prone areas, among other topics. The elaboration of 3D city models, based on satellite images stereoscopy and/or airborne laser scanning sensors will also be handled. Such models are useful for managing the urban infrastructure, since water supply and waste water pipelines; city lighting equipments; manholes; roads network; train and subway railways and stations; TV, telephone and internet anten-nas and underground cables; urban vegetation; schools; hospitals; kindergartens and alike can all be visualized in three-dimensional mode. These 3D models are also useful in emergency situations, for they provide strategic information on fire plugs and best routes for ambulances, fireman and police vehicles. The use of digital ele-vation models combined with thermal satellite bands has been extensively explored to identify urban heat islands and subsidize environmental comfort analyses, and some examples in this regard will be as well presented. GIS databases associated with refined quantitative methods can be used for automated site suitability analysis and this topic will also be approached. Spatial analysis techniques applied to GIS data will be shown within the scope of socioeconomic studies, conceived to under-stand social exclusion in cities. Population estimates based on the use of orbital and airborne remote sensing images will be dealt with, since updated information on ur-ban population is crucial for supporting the action of civil defence in the case of natu-ral hazards and for planning new investments in social and technical infrastructure. The use of GPS equipments in buses for improving the quality of public transporta-tion is illustrated in this paper as well. And finally, the employment of remote sensing and GIS in broader fields related to the urban environment will be introduced, such as global environmental change, natural disasters and civil defence; public health; and simulation and predictions of urban growth and urban land use change based on the use of remotely sensed data, statistical techniques and computer modelling plat-forms. Key Words: Remote Sensing, Geographical Information Systems, 3D City Models, Automatic Classification of Urban Land Cover/Land Use, Dynamic Models of Urban Land Use Change.

199
1 Introduction
Remote sensing can be defined as a set of activities aimed at obtaining data on the
natural resources of the Earth and its environment by means of sensors on board of
low and high altitude platforms (e.g. balloons, rockets, aircrafts, and satellites), which
detect the electromagnetic radiation reflected or emitted by a target, converting it into
a signal that is further processed, generating imagery products (Slater, 1980).
The resulting need of processing the great amount of information derived from re-
motely sensed data in an accurate and operational manner gave rise to the creation
of Geographical Information Systems (GIS), which consist in a “set of tools for col-
lecting, storing, retrieving at will, transforming and displaying spatial data from the
real world for a particular set of purposes” (Burrough, 1986).
Since the launching of the first civil satellite – ERTS 1 (Earth Resources Technology
Satellite) by the National Aeronautics and Space Administration (NASA) in the USA
in 1972, remote sensing images have been intensively used to explore the urban and
regional environment. Along the four latest decades, the humankind witnessed re-
markable advances in the field of Earth observation technologies. A profusion of new
remote sensing satellites and constellation of satellites came into scene with ever
increasing spatial, radiometric, spectral, and temporal resolution. Equipments of
Global Positioning Systems (GPS) became more and more popular and are currently
part of our daily routine, in our mobiles and in our cars (for navigation or security rea-
sons). An amazingly growing number of GIS platforms have been created, rendering
available sophisticated algorithms for images processing, statistical spatial analysis,
spatial inference, digital cartographic mapping, generation of 3D city and relief mod-
els, and spatio-temporal simulation of dynamic geographic phenomena, amongst
other applications.
Remote sensing and GIS offer nowadays a wide range of possibilities to investigate
the urban realm and extract information on socio-economic, biophysical and technical
features within its domain. The technically savvy people ought to make the best use
of the available technology in Remote Sensing and GIS in order to provide subsidies
for urban public policies and actions as well as support decision making processes in
the scope of urban infrastructure planning and management. Some of these investi-
gation possibilities will be presented in the next sections.

200
2 Possible Applications of Remote Sensing and GIS to Urban In-frastructure Planning and Management 2.1 Site Suitability Analysis
Digital maps, in some cases derived from information directly extracted from remote
sensing images, are useful to drive site suitability analyses designed to find optimal
locations for certain kinds of land use. An example in this sense concerns a work tar-
geted to select an optimal place to shelter an intermodal freight terminal along the
Tietê Waterway located in Sao Paulo State, Brazil. Ferries in this region are meant to
transport raw sugar cane along the navigable stretch of the Piracicaba River, a tribu-
tary of Tietê. Several biophysical and socio-economic variables were jointly com-
bined in a Fuzzy Gama analysis (Figure 1) that overcame the hindrances of conven-
tional qualitative analyses usually made through the overlay of maps. Not only one
scenario is possible, but rather many scenarios, defined according to fluctuations in
the value of the Gama index (Y).
Figure 1: Site suitability analysis for the implementation of an intermodal freight terminal
along the navigable stretch of the Piracicaba River. a. Variables used in the analysis. b. Re-
sult showing categories of suitability for a 2km buffer along both margins of the navigable
stretch, within the borders of the Piracicaba municipality.
Source: Almeida et al. (2001).
2.2 Land Cover and Land Use Classification
A recent trend in automatic digital classification of urban land cover and land use is
the employment of „Object-Based Image Analysis‟ (OBIA). This methodology consists
in the usage of hierarchical semantic networks and multiple levels of classification
interrelated with them. It strives to emulate the human cognitive process, which is
based on contextual vision, for interpreting scenes. A work in this line has been car-
ried out for the city of São José dos Campos, southeast of Brazil.
The semantic net started from a pan-sharpened QuickBird image and a GIS layer
containing the city streets network, assigned to Level 3; a classification of vegetation,
a. b.

201
shadow, and built-up areas was carried out and assigned to Level 2. And observing
these two levels, a classification of urban land cover was finally executed at Level 1.
On a second stage, a binary layer referring to areas below and above a given
threshold of streets greening density was inserted as Level 6, and residential and
non-residential blocks were classified at Level 5. Observing simultaneously Levels 1,
5, and 6, a classification of homogeneous residential zones was accomplished at
Level 4.
Levels 1 to 3 concern the first stage of the classification process, taking into account
mainly spectral and geometric information, and Levels 4, 5, and 6 regard the second
stage, mostly considering class-related and topological information (Figure 2). This is
all done automatically in a way that resembles how the brain of a human interpreter
processes spatial information.
Figure 2: Levels of classification in an OBIA experiment for São José dos Campos city.
Source: Almeida et al. (2007).
2.3 Urban Socio-Economic Studies
Several analyses have been conducted in recent times on socio-economic aspects of
urban population using advanced spatial analysis tools available in GIS. One indica-
tor employed for this purpose is the so-called social exclusion/inclusion index, mainly
based on variables related to the dwellers income and level of education.
The Moran Local Index assesses spatial autocorrelation between polygons (in this
case, census districts of the town under analysis). High values indicate areas of spa-
tial association (either positive – social inclusion – or negative – social exclusion).
LISA stands for Local Indicator of Spatial Association, and the LISA Map shows clus-
ters of similar values of the attribute, either social inclusion or exclusion. The Box
Map, on its turn, classifies areas according to the status of their neighbours, indicat-
ing areas of stationarity, i.e. neighbours of a district present the same behaviour as

202
the analysed district (either positive or negative), and areas of transition, where
neighbours own a disagreeing behaviour.
The Moran Map does the same as the Box Map, but considers only the statistically
significant areas according to the LISA and the Box Map (Figure 3). All this informa-
tion provides subsidies for social public policies and actions.
Another work in the same line concerns innovative ways of spatialising socio-
economic indicators. Figure 4 shows two different ways how the human development
index (HDI) developed by UNO has been spatialised for the distinct counties of Sao
Paulo State. In the upper left box, the HDI was spatialised according to quantiles, i.e.
in a conventional discrete form. And in the lower box to the right, the same index was
spatialised in a continuous form, through a technique of statistical interpolation called
ordinary kriging, generating a surface that reveals vectors and spatial trends of in-
creasing and decreasing HDI. This is what the GIS scientists call „social topography‟.
Figure 3: Different indices for the spatial analysis of the social exclusion/inclusion in the city
of São José dos Campos, at the census districts level. a. Moran Local Index; b. Box Map; c.
LISA Map; d. Moran Map.
Source: Genovez (2002).
c. d.
a. b.

203
Figure 4: Spatialisation of the Human Development Index (HDI) for the counties of São Paulo
State: a. quantiles; b. ordinary kriging.
Source: Ramos (2002).
2.4 Urban Population Estimates
Different techniques have been employed for estimating urban population using re-
mote sensing and GIS. Amaral et al. (2006) used night-time satellite imagery from
DMSP/OLS (Defense Meteorological Satellite Program/Operational Linescan Sys-
tem) to estimate the population living in urban settlements scattered through out the
Brazilian Amazon Forest, taking into account the urbanised land area. The estimates
were cross-checked with census data and presented an R2 higher than 0.8. R2 re-
gards a statistical index, ranging from 0 to 1, which assesses the proportion of the
variability in the response variable (amount of population, in this case) that is ex-
plained by the independent variable (extent of the urbanised area identified by the
high brightness pixels in the night-time DMSP/OLS image).
To date, all of the studies based on measurement of urbanised land areas worked on
a two-dimensional basis, i.e., flat habitable areas. But a clear future trend will be to
embody the third dimension in population studies in the cases where multi-storey
residential buildings are found. This is especially true in big cities of developing coun-
tries, where there are commonly tens or even hundreds of thousands of high-rise
residential buildings.
Population estimates are precisely important in informal settlements, since they are
seen as risky areas with respect to security aspects and conventional estimates
based on field surveys are time- and money-consuming. This importance is acknowl-
edged especially nowadays, since multi-storey buildings started being built in infor-
mal settlements in Brazil.
A study on population estimates was carried out for the squatter settlement (favela)
Rio das Pedras in Rio de Janeiro. For assessing the habitable surface taking into
account the multi-storey buildings, a digital surface model (DSM) was initially built
using a stereo pair of IKONOS panchromatic images, using the Rational Polynomial
Coefficients (RPC) method. An object-based land cover classification was carried out
a.
b.

204
for the area, so as to discriminate building and paving materials in a detailed manner.
The census districts were used to calculate the projected area of the habitable sur-
face (Figure 5). For each of the districts, all areas corresponding to classes related to
the residential use were summed up (like asbestos, dark concrete). Big targets which
do not relate to the residential use, shadow on streets, clay bare soil, streams, metal-
lic roof and vegetation were excluded from the calculation.
The population of Rio de Janeiro city in 2000 was compared to the estimated popula-
tion in 2006 (produced by the Brazilian Institute for Geography and Statistics –
IBGE), assessed by field interviews to sampled dwellings. The increase percentage
for the whole city was applied to each of the districts. The population density was
calculated according to data supplied from the Pereira Passos Institute – IPP – in
Rio, as a function of the inhabitants of the squatter settlement divided by its area. It
was assumed the density remained constant. Finally, a height factor of 1.3 derived
from the DSM was generally applied to all of the districts. This factor accounted for a
30% increase in the projected area. The value of the total population in the favela
generated by the estimates from IBGE – which were the reference data – and the
total population calculated with the aid of both the DSM and the object-based classi-
fication showed to be very close to each other.
2.5 Urban Transportation Planning and Management
As to urban transportation planning and management, an initiative worthy of mention
regards the installation of GPS navigation equipments in the bus fleet of Uberlandia
city, Minas Gerais State, Brazil, which allowed the monitoring and tracking of buses
by a control centre subordinated to the local traffic engineering agency.

205
Figure 5: a. Object-based classification of urban land cover in the Favela Rio das Pedras,
Rio de Janeiro; b. partial view of the digital surface model; c. census districts with the corre-
sponding land cover classification: asbestos tiles (purple), metallic roof (pink), shadow
(black), bare soil or French tiles (red), light concrete decks (yellow), sand or grave (brown),
vegetation (green), and water streams (blue).
Source: Almeida et al. (2009).
The control centre tracks the buses along their routes and sends real-time informa-
tion on the foreseen arrival time of buses from the different lines to electronic boards
installed at the bus stops. The public buses users can access this information online,
using the specific website of the local traffic engineering agency. This facility is espe-
cially useful in case of floods and traffic jams, since the control centre can contact the
bus drivers and provide them information on alternative routes.
2.6 Urban Micro-Climate and Quality of Life
Urban micro-climate and quality of life have also been of great concern to urban re-
mote sensing in the latest years. Fuckner et al. (2009) identified urban heat islands in
central areas of São Paulo and Rio de Janeiro cities, where radiometric transforms of
thermal channels of the ASTER/Terra orbital sensor, using Planck´s and other equa-
tions, generated maps of surface temperature. They were then superimposed on
ASTER DEMs (Figure 6), and together with other satellite derived data, enabled to
assess the relations between topography, vegetation, land cover, and surface tem-
perature.
Census
Districts
a.
b. c.

206
2.7 Natural Disasters and Environmental Vulnerability
For the first time in its history, Brazil, more precisely its southern coast, faced a hurri-
cane in the year 2004 – the Katrina Hurricane, a fact which is ascribed to the current
global environmental change.
Marcelino et al. (2007) collected hundreds of GPS points on field, assessing the in-
tensity of damages in the affected areas. These data were further processed with the
ordinary kriging interpolation method, generating a continuous surface map of dam-
ages intensity. This map was then passed on to the authorities and civil defence to
support strategies planning and be used in further events, as a measure of precau-
tion for the most vulnerable areas.
Figure 6: Surface temperature maps superimposed on digital elevation models.
Source: Fuckner et al. (2009).
2.8 Spatial Dynamic Modelling of Urban Land Use
Spatial dynamic modelling is an important area in urban remote sensing and is de-
signed to simulate in a virtual environment spatial dynamic phenomena observed in
the urban environment. Changes in land use, traffic, pedestrian flows, floods, disper-
sion of air pollutants, and practically any kind of dynamic phenomenon can be mod-
elled in urban areas by means of statistical models and specific computational plat-
forms, driven by digital city maps, derived from and/or refined by satellite imagery.
Figure 7a shows the graphical user interface of a free modeling platform „Dinamica
EGO‟, developed by the Federal University of Minas Gerais, Brazil. The platform is
open for different methods of parameterisation, Bayesian, artificial neural networks,
linear and logistic regression, genetic algorithms, amongst others. Its graphical user
interface is based on flow diagrams, in which each of the operators, which corre-
spond to coloured boxes of diverse shapes seen in Figure 7a, encapsulate routines
for parameterisation, calibration, and validation. Figure 7b presents examples of ur-
ban land use change simulation scenarios for Piracicaba city, São Paulo State, Bra-
zil, for the time span from 1985 to 1999.
São Paulo
Rio

207
2.9 Epidemiology and Public Health in Urban Areas
Epidemiology and Public Health have gained greater attention in urban remote sens-
ing. An illustrative and remarkable work in this line is the one developed by the State
University of Campinas and the Federal University of Minas Gerais, Brazil, to control
a tropical disease – known as „dengue‟, which presents symptoms very close to ma-
laria (high fever, muscular pain), is also transmitted by a mosquito and can lead to
death in severe cases.
Figure 7: a. Graphical user interface of the Dinamica EGO modelling platform; b. Real urban
land use in 1999 and scenarios of urban land use change in Piracicaba (SP) in 2004.
Source: Almeida (2003); Rodrigues et al. (2007).
Traps were distributed throughout cities with a great number of cases, to which fe-
males are attracted by pheromones. Once a female mosquito gets inside the trap, it
sticks to a glue and can no longer escape.
The number of captured females is daily recorded by a GPS or a palm and is con-
tinuously inserted in a geo-database, which is then subject to processing by means
of spatial analysis tools. The generated maps showing the most risky areas are sub-
mitted to the sanitary control authorities to support the due actions in the disease
spread control and public awareness campaigns.
2.10 GIS Tools for Urban Applications
Some GIS have been especially customised according to the needs of local govern-
ment authorities, aiming to support them in the urban and regional management ac-
tivities. One of such platforms is SIGMUN, developed by the Division for Images
Processing of INPE, which was particularly envisaged to fight land tax evasion in the
coastal city of São Sebastião, São Paulo State, Brazil. The dwellers usually build
swimming-pools and nearby roofed areas after the end of the construction of their
houses and do not report on additional constructions to the town hall. Since swim-
a. b.

208
ming-pools are taxed according to their area, SIGMUN is driven by a continuously
updated orthophotos database, which helps preventing tax evasion.
3 Conclusions
As conclusive words, we can state that the information and telecommunication
changes associated with an unexampled speed of information flow in an ever in-
creasing globalized world, lead us to acknowledge the crucial role of earth observa-
tion technologies for urban planning and management, and to think up as plausible
future paths in urban remote sensing the use of forefront standing data fusion tech-
niques and advanced spatial analysis tools; of integrated 3D spatial dynamic models
(coupling, for instance, climatic and physical models) and virtual reality in planning
and public participation; of higher spatial, temporal and spectral resolution data, in-
cluding the use of increasingly sophisticated object-based image analysis and knowl-
edge-based systems and of unmanned aerial vehicles (UAVs) for the routine moni-
toring of urban environments.
References [1] Almeida, C. M.: Spatial dynamic modelling as a planning tool: simulation of urban land
use change in Bauru and Piracicaba (SP), Brazil, Ph.D. Thesis, São José dos Campos:
INPE, 2003, 321 p. INPE-10567-TDI/942/B.
[2] Almeida, C. M.; Monteiro, A. M. V.; Câmara, G.; Paiva, J. A. C.; Angelis, C. F.: Spatial
inference techniques for site suitability analysis: the case study of the waterway intermodal
terminals along the navigable stretch of the Piracicaba river, Proceedings of the X Brazilian
Symposium on Remote Sensing, São José dos Campos, Brazil: INPE, 2001, p. 887-894.
[3] Almeida, C. M.; Oliveira, C. G.; Rennó, C. D.; Feitosa, R. Q.: Object-based image analy-
sis and 3D urban modeling to support studies of informal settlements, Proceedings of the XIV
Brazilian Symposium on Remote Sensing, São José dos Campos, Brazil: INPE, 2009,
http://www.dsr.inpe.br/sbsr2009/pdf/w_claudia_almeida_urbano.pdf.
[4] Almeida, C. M.; Souza, I. M. E.; Alves, C. D.; Pinho, C. M. D.; Pereira, M. N.; Feitosa, R.
Q.: Multilevel object-oriented classification of QuickBird images for urban population esti-
mates, Proceedings of the 15th ACM GIS, Seattle, USA: ACM GIS, 2007.
[5] Amaral, S.; Monteiro, A. M.; Câmara, G.; Quintanilha, J. A.: DMSP/OLS night-time light
imagery and urban population estimates in the Brazilian Amazon, International Journal of
Remote Sensing, 2006, v. 27, p. 855-870.
[6] Burrough, P. A.: Principles of geographical information systems for land resources as-
sessment, Oxford, UK: Clarendon Press, 1986, 194 p.
[7] Fuckner, M. A.; Moraes, E. C.; Florenzano, T. G. Processing of thermal multispectral data
applied to the spatio-temporal analysis of surface temperature patterns in the metropolitan
regions of São Paulo and Rio de Janeiro, Proceedings of the XIV Brazilian Symposium on
Remote Sensing, São José dos Campos, Brazil: INPE, 2009, p. 1369-1376.
[8] Genovez, P. C. Territory and inequalities: intra-urban spatial analysis for investigating the
dynamics of social inclusion/exclusion in São José dos Campos – SP, Master´s Thesis, São
José dos Campos: INPE, 2002, 220 p. INPE-12177-TDI/973.
[9] Marcelino, E. V.; Marcelino, I. P. V. O.; Rudorff, F. M.; Goerl, R. F.: Geoinformation and
natural disasters in urban areas: the case of the Catarina Hurricane, In: Almeida, C. M.;

209
Câmara, G.; Monteiro, A. M. V., Geoinformação em urbanismo: cidade real x cidade virtual,
São Paulo, Brazil: Oficina de Textos, 2007, 368 p.
[10] Ramos, F. R. Spatial analysis of intra-urban structures: the case study of São Paulo –
SP, Master´s Thesis, São José dos Campos: INPE, 2002, 141 p. INPE-10286-TDI/905.
[11] Rodrigues, H. O.; Soares Filho, B. S.; Costa, W. L. S.: Dinamica EGO, a platform for
modelling environmental systems, Proceedings of the XIV Brazilian Symposium on Remote
Sensing, São José dos Campos, Brazil: INPE, 2007, p. 3089-3096.
[12] Slater, P. N.: Remote sensing, optics and optical systems, Boston, MA, USA: Addison-
Wesley Pub. Co., 1980, 575 p.
210
Enhancing the Local Knowledge for Improving the Infrastructure Facilities in Informal Settlements
Paulus Bawole, MIP Lecturer at Department of Architecture – Engineering Faculty, Duta Wacana Christian University, Yogyakarta - INDONESIA Jl. Dr. Wahidin No. 5 – 25, Yogyakarta - INDONESIA 55224, Yogyakarta - INDONESIA [email protected]
Abstract: Worldwide, urban areas continue to attract large number of people
due to the economic opportunities they offer. Globally, the shelter conditions of the poor are deteriorating: 1.3 billion people do not have access to clean water and the same number live on less than a dollar a day; 2.6 billion people do not have access to basic sanitation, while 5 million die from diarrhea diseases every year. Poverty will clearly dominate the international development agenda of the 21st century. Mostly in developing country like Indonesia the poor develop their informal settle-ments on vacant areas within the city such as under the bridge, along the railway track, on the cemetery, along the riverbanks, etc. They cannot reach the prize of for-mal houses developed by the government or private developer. They live in such set-tlements because they have no choice for living and protecting the family from local climate. Even though they live in bad environmental areas within the city, the forma-tion of their housing areas is an integral part of the process of growth and develop-ment of a city. Therefore the development of informal settlements should be taken into account as a part of urban planning and design. Listening to the community may provide ways to improve the understanding about the socio-culture of the people and give bright ideas how to develop their settlement. Indigenous people demonstrate great ingenuity in developing their residential neigh-borhoods and in organizing the open spaces and construction of housing. Therefore the local knowledge of the poor such as the ways, plans, designs and building mate-rials is often far better suited to local needs, incomes, climatic conditions and re-sources than the official, legal standards demanded by governments. To improve infrastructure facilities in informal settlement it is better and more sustainable, if the inhabitants are involved at the whole process of development. If the poor in informal settlements are given a chance to develop their houses and surrounding areas, they will show their great capability to improve their settlements, because they know exactly what they need and they know also their capabilities re-garding their financial and building knowledge. Secure tenure is an aspect that should be considered in advance, because according to the field research the most dangerous situation felt by the poor in informal settlements is the implementation of eviction or demolition program in their housing areas. They are afraid of the demoli-tion program because they do not have legal status of the land in which they built their houses. This paper will share experiences in improving the informal settlement based on exploration of both social and physical aspects of the settlement. Key Words: Local Knowlede, Infrastructure Facilities, Informal Settlement

211
1 Introduction
The world‟s urban population is growing fast. In Asia, 2.2 billion people (one out of
two) are expected to live in cities by 2020. Urban centers are also increasing in size
and number. Asia now has 11 megacities, each with more than 10 million people. In
addition, hundreds of towns and cities throughout the region have populations of 0.5
million to 9 million, and smaller town and cities are peopled by hundreds of millions.
Urban centers are important to national economies because they are the engines of
economic growth and the focal points for important activities like trade, commerce,
industry, and government administration. Urban centers create opportunities for jobs,
employment, and livelihood especially for the poor people. (ADB, 2004)
The development of cities in developing countries is always followed by the growth of
informal settlements. Such settlements develop always around the city centre and
their inhabitants mostly work in informal sector within the centre. Globally, the shelter
conditions of the poor are deteriorating: 1.3 billion people do not have access to
clean water and the same number live on less than a dollar a day; 2.6 billion people
do not have access to basic sanitation, while 5 million die from diarrhea diseases
every year. (Tebal and Ray, 2001) It is predicted that by the year 2020 three quar-
ters of the world‟s urban dwellers will live in the cities and towns of developing world.
It is very important to consider the growth of the informal settlements as a part of
making development strategy for the city in order to reach a sustainable development
planning.
In informal housing areas poor people develop their houses first with very simple ma-
terials such as pieces of cardboard, plastic, bamboo or wood. During certain times
the housing area along the riverbanks grows spontaneously. Because the environ-
mental quality within this area is poor, the government implements upgrading pro-
grams on the riverbanks which often gets rid of the spontaneous settlements and
move the people to other areas. (Hardoy, 1989) Sometimes if people refuse to
move, the government forces them by burning or bulldozing the settlements. Be-
cause they cannot afford the price of formal houses developed by the government or
private developer, they will try to find another vacant area and then build again their
huts. Demolishing the informal settlements does not solve the problems, but it stimu-
lates the growth of informal settlements in other areas.
In spontaneous housing areas poor people have to deal with minimal infrastructure
facilities. They have to live with bad access to the main road, bad environmental
quality, lack of playgrounds for the children, etc. This situation forces them to be
creative in using the physical facilities within the housing areas. Besides, the rela-
tionships among the inhabitants are very close, so that people will help each other if
one of them has a problem. The physical environment within the spontaneous hous-
ing areas has specific characteristics because people develop their houses and the
surrounding environment without any plan and the developments are adjusted to
their demand and capabilities. The relationship between the way the people develop
their housing areas and limited facilities available creates specific characteristics.
Hence there are many interesting places created spontaneously and the people use
them very intensive.

212
The other interesting aspect of spontaneous housing is the socio-culture of the
people who have to survive with minimal infrastructure facilities. They maintain their
life-style in a simple way and as in their former home village, all inhabitants in the
spontaneous housing know each other very well. With this life-style they can continue
to exist in a bad housing situation and carry on creative activities in several places
according to the limited facilities they have.
2 Understanding the Informal Settlements
Understanding the activities of the poor in architectural space within the informal set-
tlements is very useful for arranging a development strategy based on the character
of the inhabitants. By paying attention to the economical situation of the low income
people living in slum areas, it can be understood that they are hard workers, who are
persevering in looking for their basic necessities of life for their family. Not only the
husbands work, but also the wives work to help their husband in order to have addi-
tional incomes. Their dependence to the centre in the bustle of the city is very strong,
because in the centre they can get their income everyday. (Khudori, 2002)
Although the people come from different regions, they are able to live together in
harmony. It can be observed when one family needs help, many other families will
extend their hand to give their help. The relationship among the people living in the
informal settlement is very close. It is not limited by the difference of ethnic group,
religion and race. (Srinivas, 2008 )
2.1 The socio-cultural character of the people
By paying attention to the socio-economic situation of the low income people living in
informal settlements, it can be understood that they are hard workers, who are per-
severing in looking for their basic necessities of life for their family. Not only the hus-
bands work, but also the wives work to help their husband to have additional in-
comes. Their dependence to the centre of city bustle is very strong, because from the
centre they can get their income everyday.
Although the people in informal settlement come from different regions, they can live
together in harmony. It can be showed, when one family needs help, many other
families will extend their hand to give their help. The relationship among the people
living in the informal settlement is very close and it is not limited by the difference of
ethnic group, religion and race.
According to the field research carried out in Informal settlements along the Babura
and Deli riverbank , many young men and the fathers are not available in the settle-
ments during the day time, because mostly they are working outside the settlements
in informal sectors as pedicab (three cycles) drivers, second hand collectors, street
vendors, parking guards, etc. They are going from their house at 07.00 in the morn-
ing and coming back at 16.00 or sometimes at 18.00 in the afternoon. [see Figure 3
below] The mothers stay more in the settlements because they have to take care of
the children and also manage household activities like cooking, washing the clothes,
taking care the small children, cleaning the house, etc. (Ribbeck, 2005)

213
Figure 1. Daily Activities of the Adults, Young People and the Children in the Informal Settlements along the Babura Rivebank – Me
The social interaction among the inhabitants mostly happens in informal public
spaces inside the settlements. Even though the public spaces available are not so
wide, but the inhabitants use them very intensively by „time sharing.‟ In the morning
usually the mothers use the space for their interaction and meanwhile they take care
of their small children. At noon after coming back from the school the children play at
the same place used by the mothers before. Then in the afternoon after coming back
from their work, the young people are doing their social interaction also at the same
place. In the evening the fathers use the same place for their interactions with walk-
ing a. Usually the open spaces which have housing facilities like small mosque (mu-
shola), public well or public toilet, guarding post, and kiosks are used very inten-
sively by the inhabitants for keeping their social interactions. (Bawole, 2007)
2.2 The pattern of Settlement and Character of Building Architecture
The position of the informal settlement usually cannot be seen directly from the main
street, because it is behind a shopping complex or behind a housing area built for-
mally. The building density in informal settlements is very high and the position of
one house to the others is quite close. Most of the settlement patterns formed from
circulation is seen as untidy. In spite of that, there are certain pathways of circulation
often passed through by the inhabitants and the path can be the main circulation of
the settlement. The other small pathway like alleys or alternative small ways, called
“mouse path” can connect to main pathways or even to the main roads.
EXPLANATION :
= Sleep = Taking a Bath = Eating
= Working = Doing Activities Outside = Cooking
= Going ro School = Doing Activities inside = Studying
Mor
ning
- N
oon
Noon - N
ight
Chi
ldre
n
Men
You
ng M
en
Wom
en

214
Houses in the informal settlement have different characteristics, even though in gen-
eral they can be distinguished as permanent, semi permanent and non permanent
buildings. The architectural typology of the houses in the informal settlement is rela-
tively simple with a quadrangle ground plan and the building orientation is towards
the kampong‟s pathway or to public open spaces. There are usually two entrances to
the house; the main entrance from the front of the house and a side entrance at the
back of the house.
The roof form is dominated by the simple form of “kampong” and “panggang pe”
roofs. The other forms, like Limasan, Tajuk and Joglo, have been found only on a few
houses. Generally a house with a complex form of roof is owned by the upper low
income people or the middle class. The walls of the house have been made from
very simple material, like carton, plastic and bamboo, up to bricks with good finishing.
The floor is made from boards or from bamboo, cement, tiles, ceramic or maybe just
from soil without finishing.
Rooms inside the house are varied from a house having one room up to houses with
the rooms divided complexly. Generally the room arrangements are a public room,
like a terrace, and a guestroom on the front side; the bedroom, the workroom and
dining room in the middle part; the kitchen, bathroom and washroom located in the
back side of the house. Grass roots people use the rooms in their house in a very
flexible way. Middle to upper income people, when they have many family members,
will use the rooms more intensively and very flexibly like the grass-root people.
2.3 The Character of Open Space and Circulation
The open space in informal settlements has been formed spontaneously, because
the houses are developed without any planning. The spaces do not have certain pat-
terns and form, but the inhabitants use the open spaces very effectively. From field
observation, it has been obtained that there are some circumstances which
stimulate the activity of the inhabitants in open spaces or on the kampong‟s pathway.
One of them is the availability of open space used as an orientation of the houses. By
facing an open space, communication and social interaction among the families living
in the houses can be involved. Generally an open space will be used effectively by
the inhabitants: children, young people and adults.[see figure 2. explaining sponta-
neous public spaces] They use the open space within the settlements with time shar-
ing or by turns. The other activity stimulation is the available technical infrastructure
facilities in the space, like a public water tap, public well and also social infrastructure
facilities like a guarding house, food stall, small mosque, etc. Those facilities can
stimulate the people to carry on social interaction and communication.
Based on the field observation, the open space in the settlement is very important for
the social life of the people. Observing the socio-culture of the people living in the
informal settlement, all of the members of society, the children, youth, women and
men, always have social interaction there. If no open space exists, they will have so-
cial interaction on the public pathways near their houses. Especially for children, the
public open space has a special meaning for them to play and express their creativ-
ity. Besides, the open spaces are very necessary for the settlement with dense built-
up areas, because they function as a place for air circulation.( Bawole, 2010)

215
The facilities closely related to open space are the kampong‟s streets connecting the
houses and available open spaces. Like open spaces, the streets have also been
formed spontaneously because of the sporadic development of the houses. The
streets have no certain form and size. Nevertheless the street most often used by the
inhabitants can be categorized as a local kampong‟s main street. It is usually wider
than other connecting pathways or mouse paths. The width of the main street is
about 1.5 – 3 meters.
2.4 Infrastructure Facilities in Informal Settlements
Even though the infrastructure facilities are very poor, many families have electricity.
Only the poorest families do not use electricity. They use oil lamps as an illumination.
Since many families have electricity, electronic commodities like radio, tape recorder,
television, etc. are mostly available. As street illuminations usually the family whose
house is facing the street will provide electricity.
The other infrastructure facilities available are public taps, public well, public toilet
and drainage. Several families in informal settlements have their private clean water
facility. If they don‟t have such facility, they can take clean water from public well or
public taps. Those infrastructure facilities can stimulate the social interactions among
the inhabitants, if the facilities are laid down in public open spaces. (Herrle, 2005).
In several cases the waste water from the city flows through closed or open drainage
to the river. If the informal settlements develop along the riverbanks, the waste water
flows through them. Afterwards the people from outside see and think, that the poor
throw away their waste water directly to the river.
Two situations in which the inhabitants carry out their social Interaction in public space surrounding the houses
along the Deli river in Medan
Deli River
Public Space at Noon
Public Space in the Afternoon
Figure 2. Spontaneous Public Spaces within Informal Housing Areas along
the Deli Riverbanks

216
Figure 3. Social and Technical Infrastructure Facilities within the Informal Settle-ments along the Chode Riverbanks in Yogyakarta
3 Understanding the Activities of the Poor
According to the field observation, almost all inhabitants carry on their social interac-
tions in public spaces available in the settlements. As it mentioned before that they
use the spaces intensively by time-sharing. If there is no open space in the settle-
ment, they will use the pathway as a playground. In the afternoon, usually they will do
their activity in open spaces covered by the shadow of the building or trees. Open
space is very important for the settlements, because it can be used as both a kam-
pong pathway and spaces for air circulation within the kampong settlements. It is
very interesting to see the daily activities of the inhabitants in informal settlements
along the Chode riverbanks, Yogyakarta. [see Figure 2]
Figure 2. Two Types of Public Open Spaces Used by Inhabitants for Their Social Interactions
Public well and natural spring on the Chode riverbank as clean water facilities in which the inhabitant carry out their social
interaction
Open and closed drainage from the city which flows through the informal settlements to the Chode river
Small mosque (Moshola) on the Chode riverbank as a social infrastructure facility which stimulate the social relationship among the inhabitants
Lighting on the Kampung main street which also stimulate the social
interaction
Kampung Pathway Used as an Open Spaces for Inhabitants Social Interaction in Winongo River-
banks - Yogyakarta
Small Open Space in front of a House Used by the Young People for Their Music Activities in
Chode Riverbank - Yogyakarta

217
The inhabitants use the public spaces as a facility for maintaining their social rela-
tionship. In the morning between 07.30 –10.00, usually the woman use public open
spaces for chatting and also taking care their small children who play around. At the
same time the men go to work out side the settlements and the big children have to
go to school. Therefore woman‟s activities dominate the use of public open spaces.
The children spent their activities in public spaces after coming back from the school
at 12.00.
Young people use the public open spaces for their social relationships in the after-
noon at 15.30 up to 17.30. They share their daily experiences, play music, sport or
sometimes they play chess. Activities of the young people inside the house are only
sleeping, eating and in the evening, they are watching TV. Usually after watching tel-
evision the young people carry on their activities outside the house up to 24.00 late
night. Adult people are seldom to use the public open spaces for their social interac-
tions, because mostly they work all day long in informal sector outside the settle-
ments.
4 Enhancing the Local Knowledge for Upgrading the Informal settlements
Knowing the local knowledge created by the low-income people is better for develop-
ing strategies for settlement improvement. To understand the daily life of low-income
people in informal settlements, it can be very helpful to live together with the people,
because with living together it is easier to understand how the poor could struggle
with their living environment. They will know how the people create the public spaces
and use them intensively for social relationship. The creativity in designing architec-
tural forms is stimulated by the limitation facilities they have within the settlements.
(Cody, 1996)
Poor people demonstrate great ingenuity in developing their residential neighbor-
hoods and in organizing the open spaces and construction of housing, even if the
government regards them as illegal. They do not have a chance to live in formal set-
tlement, because they are too poor to reach the formal housing prize. In other word it
is quite difficult for them to save their money for their future better live. Since they live
in informal settlement with minimal infrastructure facilities, they have to be creative
and used the facilities within the settlements effectively. Therefore their ways, plans,
designs and building materials are often far better suited to local needs, incomes,
climatic conditions and resources than the official, legal standards demanded by
governments. (Nierman, 2005).
Enhancing the local knowledge makes the development process easy, because the
inhabitants are already familiar with their creativities in developing the settlements.
There are several circumstances that have to be prepared in order to enhance the
local knowledge for improving the living standards of the low-income people.

218
Those circumstances are:
4.1 Changing the Appreciation of Informal Settlements in the City
To regard the poor not as a problem but as a solution requires an honest good moti-
vation, because it is quite difficult to appreciate the poor activities and creativities po-
sitively. If the inhabitants improve their surrounding environment as well as their living
quality with their own effort, they will maintain the environment very well and the de-
velopment of the informal settlements will be sustainable too.
There are many institutions can involve in urban upgrading program in informal set-
tlements like funding institutions, private developer, government institutions, academ-
ic institutions, NGO‟s, etc. The first step to appreciate the informal settlements is that
all participants interested in helping the poor must have a great honest heart. Be-
sides, all participants should not take any profits or any self advantages of develop-
ment plan in informal settlements. They should have a positive thinking in regards to
face the reality in informal settlements. Afterwards there are two main actions should
be implemented concerning the development of informal settlements in the urban
areas: preventive actions and helping actions.
The preventive actions should be implemented by the government or any other insti-
tutions in order to anticipate the development of informal settlements in the city. The
most important thing of these actions is to develop other small centers in suburb and
develop as soon as possible any vacant areas inside the city especially around the
city centers. Through these actions the distribution of populations in the city can be
separated evenly up to suburb and the poor people do not have a chance to develop
their huts in vacant areas in the city, because the government or other institutions will
develop the areas in advance.
Since demolishing houses in informal settlements cannot solve the problems of the
poor settlements, the government and other institutions should help the poor in order
to develop environmental qualities of their housing areas. They have to change their
negative opinions about facing the living qualities in informal settlements. The most
important action for helping the poor in informal settlements is to give guarantees that
the governments or other institutions do not destroy the houses in informal settle-
ments. They have to carry on land consolidation programs in informal settlements, so
that the poor can improve their housing areas as well as their living qualities without
being afraid of demolishing programs.
4.2 Doing the Total Participation
Concerning the sustainable urban upgrading in informal settlements, from the begin-
ning the planning program should involve the inhabitants. Total participatory must be
carried on in order to compile the idée and thinking of the inhabitants about how to
develop their housing areas. An alternative approach for urban upgrading in informal
settlements is “Advocacy Development Planning for and with the Poor” In this ap-
proach all institutions interested in helping the poor people together with local inhabi-
tants should discuss and establish teams for doing the research, making a develop-
ment plans and also implementing them. The team will be divided into two groups:

219
team for Field Research and People Participatory. These teams will prepare every-
thing regarding the preparation of the research, the whole research, workshop with
the poor people, making development plans for the informal settlements and imple-
ment them.
The field research team will observe the physical aspects of informal settlements es-
pecially the open spaces in which the inhabitants carry on their daily activities.
Through the observation of the physical aspects, it can be understood how the peo-
ple carry on their activities in available open spaces intensively. Besides there are
also special form of pathways, alleys and also other types of open space developed
spontaneously. The information above will be compiled and analysed carefully, be-
cause it will be transformed into the basic strategy for making urban upgrading pro-
gram in informal settlements. (Wilcox, 1994)
Research about people participatory will be done in order to find out how the poor
people thinking about good environment around their housing areas, if they have a
chance to improve their living qualities. According to the experiences, if the poor
people think about having enough money, they will have also an ideal housing areas
for their daily live. Usually the data got from the participatory research are ideal ideas
and thinking that have a contradiction with the real situation of informal settlements.
Those data will be record carefully because serial workshops they will be cross
checked with the real situation gotten from the research of physical aspects. (Munt,
2008)
The further process is to carry out the serial workshops for making an urban upgrad-
ing plan. This process will be done several times until the compromises of develop-
ment strategies of urban upgrading plan can be reached. The discussion in serial
workshops will be focused on finding out the spatial form of informal settlements
that can be transformed into the strategy of urban upgrading plan. With involving the
poor people who live in informal settlements, they can be aware of the environmental
quality within their housing areas. Afterwards they will also aware about how impor-
tant to improve their living quality including the environment around the settlements.
If the implementation of urban upgrading plan in informal settlements can also in-
volve the inhabitants, the development program in informal settlements will be sus-
tainable.
4.3. Transforming the Spatial Experiences of the Poor to the Urban Upgrading Program
Spatial form in informal settlements can be seen as a public open space and path-
ways in which many people carry on their daily activities. After finding out the spatial
forms including inhabitants‟ activities inside, It is necessary to choose several active
open spaces within informal settlements and then use them as an orientation of the
plan for urban upgrading program. The active open space is chosen because it is a
centre of human activities in the settlements. The circulations connecting the open
spaces available should be considered as a pattern of the settlements. Afterwards
the houses developed along the circulations or pathways should be improved step by
step individually.

220
Technical infrastructure facilities like clean water supply, electricity, and drainage are
very important for the families in informal settlements. If it is possible the technical
infrastructure facilities should be installed in advance, because these facilities are
needed for their daily live. The development of infrastructure facilities follows the set-
tlement patterns formed by the open spaces and circulations. Social infrastructure
facilities are also needed by inhabitants, because usually these facilities are used for
social inter-actions among the inhabitants. The social infrastructure facilities like
guarding post, local government offices, religious building and any other facilities are
developed around the public open spaces.
To improve the environment qualities in informal settlements, several types of vege-
tations should be planted. In public open spaces some intermediate trees should be
planted for creating the shadows in public open spaces in which many inhabitants
carry on their daily activities. Decorative vegetations can be planted in pots and put
them in front of th house or hang them up on the roof structure. If there is no place for
planting the vegetations, every family should have pots and plant the small vegeta-
tions in the pots.
5. Conclusions
After discussing the informal settlements in Indonesian cities and the developments
strategies with enhancing the local knowledge, the conclusions will be explained in
the last part of this paper. Decent housing and living conditions are the most basic
needs of each individual. Gaining secure access to adequate accommodation is of-
ten a pre-requesit for exercising many of the fundamental rights which form the foun-
dation of all decent societies, and should be enjoyed by everyone. These include the
right of access to education, the right to work, the right to social protection, the right
to healthcare, the right to personal privacy and to family life, as well as the right of
access to basic services such as water and electricity.
Implementing the ecological approach in improving the informal settlements can help the poor people to live in environmental friendly housing areas. If the poor are given a chance to develop their houses and surrounding areas, they will show their great capability to improve their settlements, because they know exactly what they need and they know also their capabilities regarding their financial and building knowledge. Therefore secure tenure is an aspect that should be guaranteed before the ecological approach is introduced to the people, because according to the field research the most dangerous situation felt by the poor in informal settlements is the implementa-tion of eviction or demolition program in their housing areas.
Given the problems faced by the urban poor living in informal settlements there are many people and institutions who advocate that the provision of tenure through own-ership is fundamental to poverty reduction. It is argued that ownership will :
remove the possibility of arbitrary eviction;
provide households with an asset which can be used as security for credit;
provide a possibility for the poor to express their capabilities and knowledge
in order to improve their living standard
221
provide space for home-based economic activities;
foster better living conditions, a better environment (especially space, sanita-
tion and water) and improve personal security – particularly freedom from
violent crime; and
provide the conditions for the development of communities as residents have
a sense of ownership.
References [1] ACHS (Asian Coalition for Housing Rights): Housing by People in Asia, October 2003,
No. 15
[2] Bawole. Paulus: “A Collaboration of Spountaneous Architecture and Environmental De-
sign Developed by Marginalized Inhabitants” in Proceedings: Arte-Polis 3 International Con-
ference: Creative Collaboration and the Making of Place: Learning, Bandung, 2010.
[3] Bawole. Paulus. Informelle Siedlungen an Flussufern in Gefährdeten Stadtgebieten In-
donesien, Indonesien. Diss. Städtebau Institut - Fakultät Architektur u. Stadtplanung - Uni-
versität Stuttgart, 2007
[4] Cody, Eleanor. “Poverty and the Environment – A problem or a solution ?” Habitat De-
bate Vol.2 No. 2 (June 1996)
[5] Hardoy, J.E.; Cairncross, S.; Satterthwaite, D. The Poor Die Young. Earthscan Publica-
tions Limited, London, 1990.
[6] Hardoy, J.E.; Satterthwaite, D. Squatter Citizen. Earthscan Publications Limited, London,
1989.
[7] Herrle, Peter. u.a., Improvement of Sanitation and Solid Waste Management in Urban
Poor Settlement. Deutsche Gesellschaft für Technische Zusammenarbeit (GTZ) GmbH,
Eschborn, Deutschland, 2005.
[8] Khudori, Darwis. Menuju Kampung Pemerdekaan. Yayasan Pondok Rakyat, Yogyakarta,
2002
[9] Munt, Richard. Building Community Participation. 2008
(http://www.aifs.gov.au/sf/pubs/bull2/rm.html)
[10] Nierman, Manfred. Armutbekämpfung in Städten. GTZ GmbH, Eschborn, 2005.
[11] Ribbeck, Eckhart. Die Informelle Moderne: Spontanes Bauen in Mexiko-Stadt. Architek-
tur und Wirtschaftsförderungs-Verlag. Heidelberg, 2002
[12] Ribbeck, Eckhart. Die Welt Wird Stadt. Jovis Verlag GmbH, Berlin 2005.
[13] Srinivas, Hari Defining Squatter Settlements, 2008 (http://www.gdrc.org/uem/define-
squatter.html)
[14] Tebbal, Farouk and Ray, Kalyan. “Housing the Urban Poor” Habitat Debate Vol. 7 No. 3
(September 2001) : 1 – 5
[15] UNHCS (Habitat). “Human Settlements and the Urban Poor : Specific Recommenda-
tions” Habitat Debate Vol.2 No. 2 (June 1996)
[16] United Nations. Millennium Development Goals. The United Nations Department of
Public Information , 2006. (http://www.un.org/millenniumgoals/documents.html)
[17] Wilcox, David. The Guide to Effective Paticipation. Delta Press, Brighton. 1994

222
Community Participation in Slum Upgrading Projects The Case of PAC – Complexo de Favelas do Alemão17 in
Rio de Janeiro – Brazil
Mariana Peixoto de Toledo Rua Belisário Távora 302/303 bloco 1 22245-070 Rio de Janeiro Brazil [email protected] Abstract: The main objective of this paper is to discuss the relevance of community participation in infrastructure development projects implemented in slums. As a case study it will present a slum upgrading project, part of the Brazilian Federal Govern-ment Program called Growth Acceleration Program (known in Brazil by its initials PAC). This project is now being implemented in Complexo de Favelas do Alemão – one of the biggest slums in Rio de Janeiro. The infrastructure intervention of PAC has been changing, since 2007, the slum space configuration through huge interven-tions that include: construction of new housing unities, water, sewage, drainage and public lightening infrastructure, widening streets, construction of a cable-car system to improve accessibility and mobility and the implementation of social equipment. Al-though, in conceptual terms, the description of this project does not differ from other slum upgrading projects, Brazilian Government included, since 2007, the participa-tion topic as an obligatory component when implementing social-urban infrastructure in precarious settlements. Participation is part of a process that must count on the involvement of different actors to contribute for the territory`s local development and its people education by the establishment of common objectives. The methodology to execute the social work includes the involvement of different segments of the com-munity in meetings to discuss the infrastructure projects and to participate on the elaboration of a Participative Sustainable Development Plan. There is no doubt that the obligation of executing the social work has generated great opportunities for the community and also for the Government, but there are still some challenges to be faced by the next professionals who will be involved with slum upgrading projects and those who will work in some other participative planning. Some of the difficulties concern to local violence, voluntary participation, expectations and the execution pe-riod of infrastructure projects and social work. By reviewing the theory, presenting the methodology used, analyzing the results and the main challenges found in the pro-ject, this paper aims to professionals, who are working with infrastructure develop-ment in developing countries, especially in slums, aware of the importance of com-munity participation.
Key Words: infrastructure projects, community participation and social work.
17
In english: Alemão Slum Complex.

223
1 Introduction
Traditional researches might say that community participation does not play a role in
the implementation of infrastructure projects. This is because community people are
not considered to be planners. In fact, the local community citizens are the ones who
face everyday problems and can help finding solutions, especially when planning for
a slum area where complexity is higher.
Moreover, by participating in the process these people can exercise their citizenship
and be considered part of the society like those who live in the “formal city”.
The main objective of this paper is to discuss the relevance of community participa-
tion in infrastructure development projects implemented in slums. As a case study it
will present a slum upgrading project, part of the Brazilian Federal Government Pro-
gram called PAC (Growth Acceleration Program). This project is now being imple-
mented in Complexo de Favelas do Alemão – one of the biggest slums in Rio de Ja-
neiro.
By reviewing the theory, presenting the methodology used, analyzing the results and
the main challenges found in the project, this paper aims to professionals, who are
working with infrastructure development in developing countries, especially in slums,
aware of the importance of community participation. The motivation to write this pa-
per was because of the participation of the author as a professional who worked in
the project18 and the belief that community participation contributes to better results.
2 Community participation and planning
Before discussing community participation in slum upgrading projects, it is important
to discuss the concept of participation. The focus here will be only in political partici-
pation in democratic regimes; once it can be easily associated with public policies
implemented in Brazil which objective is to reduce the country‟s social disparities.
Since 1988, citizen participation is established in Brazilian Federal Constitution which
has marked the transition from an authoritarian regime to a democratic one. However
it is important to emphasize that there is a difference between political participation
and electoral participation. Participation is much more than just voting (Azevedo,
2007; Freire, 1980; Tenório, 2007). According to these authors participation broaches
the possibility of discussion, promotes educational spaces in search of rights and citi-
zenship exercise.
In Brazil and in other complex societies, participation cannot be limited to institutional
representation of the official channels (right to vote and be voted), it demands other
democracy forms, especially in local levels, as the right of citizenship (Azevedo,
2007).
Tenório (2007) says that although the representative democracies have become
successful, they do not request for much knowledge from citizens, who should just do
a minimum effort. The author believes that the participation act goes beyond voting
18
By working at Agência 21 Consulting.

224
and that integration between representative democracy and participative democracy
must exist. In his opinion, participation should guarantee an involvement among the
civil society, the public sector and the private sector in order to actively take part in
the deliberative process.
Freire (1980) says that preparing to democracy does not mean to convert an illiterate
into a voter. By working with popular education in Brazil, Freire created the liberation
pedagogy with the purpose of making low income people aware of the importance of
participating actively in politics through an educational process. The author believes,
there should be knowledge integration among educators and people. The educator
should not just work to people, but along with them.
The participation process can be considered one component of an entire educative
procedure where there is not right or wrong. In order to have a participative process,
the representatives of the public sector and population must work together, part of a
mutual learning process. “Integrated intervention projects demand a new professional
profile interested in gaining knowledge and changing behaviors, what remains is only
to know if this challenge must be faced by the academy or just by the professional
practice”. (Andrade and Toledo, 2010)
It is important to stress that participation can neither be forced nor accepted as
charity once it cannot be seen as a concession. Individuals should understand the
process and be aware of their own acts and, last but not least, participation should be
a voluntary act. (Tenório and Rozenberg, 1997)
By including participation in a public policy which aims to develop an area and im-
prove the quality of its population; participation is restricted to a geographically de-
fined territory. So, the objective of the policy can also be related to the local
development concept.
Local development is a process focused on a physical territory where the protago-
nists are a plurality of actors who play certain roles in society and who also establish
relations of common objectives and projects. (Tenório, 2007)
Participation can be seen as a voluntary act, part of a process that must count on the
involvement of different actors to contribute for the territory`s local development and
its people education by the establishment of common objectives. In order to include
participation in local development projects, a new political culture must be built to
change traditional attitudes, behaviors and procedures into a new type of planning,
much more concerned with people‟s wishes, respect and transparency.
If a classical planning is done by a group of experts who seeks a desirable future re-
ality, using sophisticated languages through institutionalized processes, on the other
hand a participative process is about a qualitative phenomenon which brings com-
munity involvement, intensity, educational impregnation and construction of a cultural
identity; that can represent new challenges to the usual scientific quantitative plan-
ning. In fact, a really participative planning is very difficult to be executed in large
scale projects, once it takes much time, even more than a government mandate. Be-
cause of that, what governments usually consider as a participative planning is just a
technical planning with some participative strategies such as: consulting local asso-

225
ciations, involving expert people related to the area and sharing responsibilities with
local organizations. (Demo, 1985)
By being aware of the importance of community participation, the challenge of mixing
technical knowledge with popular understanding and the need to insert qualitative
information into a planning, Brazilian government included, since 2007, the participa-
tion topic as an obligatory component when implementing social-urban infrastructure
in precarious settlements.
Participation included in slum upgrading projects in Brazil is considered important at
all stages of the project. “It is a process of social mobilization which represents at the
same time a specific targeted objective as well as a way to achieve other project ob-
jectives. Therefore, popular participation has its own strategic dimension. It is a
process of collective learning designed to strengthen the citizenship status of those
involved. It also possesses an operational dimension, embracing the procedures in-
corporated in the agreements relating to the implementation of the different actions,
works and services to be developed in the places where the beneficiaries of such
actions reside”. (Ministério das Cidades / Aliança das Cidades, 2010, p. 77)
It cannot be forgotten that in Brazil there is not a tradition of participative practices
and this lack of tradition is much more significant in slum areas, where an organized
civil society rarely exists. According to Demo (1985), there are four requirements to
check if a community organization can be considered valid: the representativeness of
their leadership, elected by their community members, the legitimacy of the associa-
tive process where all members follow the same rules and have the same rights,
keep the commitment and control on the basis of the organization and execute an
effective participative planning to prove organization`s capacity of the community.
3 The Growth Acceleration Program (PAC)
The Growth Acceleration Program (known in Brazil by its initials PAC) was initiated in
2007 by the Federal Brazilian Government in order to overcome the main infrastruc-
ture deficits in Brazil. The investments are concentrated in three strategic areas: lo-
gistic (roads, rails, seaports, waterways and airports), energy (generation and trans-
mission, oil, natural gas and renewable energy sources) and social-urban infrastruc-
ture (electricity, sanitation, housing, subway system and water resources).
(Ministério das Cidades – Secretaria Nacional de Habitação, 2010a)
An important part of the investments designated to the social-urban infrastructure
area, is being invested in different precarious settlements19 around the country. The
resources designated for the project come from the Federal Government and are
transferred to the State Government and the Municipality; which are responsible for
19
“Areas possessing one or more of the following features: tenure/ titling or urban irregularities; defi-
cient or dilapidated infrastructure; danger of flooding, landslides or other types of hazard; high density
of buildings; precarious building quality of housing units; long distances between housing and
workplaces; insufficient transport systems…; non-existent or less than satisfactory public services…; a
set of social problems engendering situations of extreme vulnerability; a social order based on violent
crime”. (Ministério das Cidades / Aliança das Cidades, 2010,p.11)

226
the execution of the projects. Complexo de Favelas do Alemão was one of the first
slums to be chosen because it could meet the guideline for selection which gave pri-
ority to huge complex of slums20.
4 General context of Complexo de Favelas do Alemão
The occupation of the hills and mountains that today form the Alemão Complex of
Favelas started around 1920. This was the solution of many workers who could not
afford buying or renting a house close to Rio de Janeiro city center. They needed a
place to live, even though they had to construct their houses and infrastructure by
themselves.
Although, since 1993, Alemão Complex of Favelas is considered an official district of
the city of Rio de Janeiro, its houses continued to be constructed without following
the effective rules and the majority of them do not have any regularization title.
Today there are 27,624 houses in the Complex, located in 12 different communities
where 89,912 people live21. Women are the majority of the population (52%) and re-
sponsible for 51% of the houses, which indicates that in some houses they are the
head of the family, raising their sons and daughters. Children and teenagers repre-
sent 35% of the total population of the Complex.
In regard to the population considered as a work force, almost half of them are un-
employed or have informal jobs, consequently earning inconstant incomes. It must be
said that more than 90% of the local market of Complexo de Favelas do Alemão is
informal. Even though it is possible to find there all kinds of shops and services such
as bars, construction materials, clothing stores, drugstores, markets, mechanics and
internet cafes.
Although more than 90% of the houses are constructed with masonry, result of a
consolidated occupation which counted on progressive investments of its population,
almost all the houses have problems in its interior as cracks, gutters, lack of natural
light or ventilation. Most of the houses have access to electrical light but, more than
one third of them have illegal electrical connections, made by their owners.
In regard to the public infrastructure, the same thing happens with public light, where
one fourth of the pathways count with private wooden lampposts and not with public
lampposts. More than 90% of the population has access to sewage system and wa-
ter system; but it has to be considered that 28% of the houses have just one external
faucet for the residents. Many of them say that they suffer from water supply irregu-
larity.
The waste collection, in some parts of the Complex, is done directly in the houses by
the Municipality (36%), in some other parts the garbage is thrown in public garbage
containers (41%) and in some others the community sweeperers take charge of that
20
In Alemão Complex of Favelas the State Government has the biggest volume of intervention and
resources, because of that, all the results and experiences presented in this paper are related to the
State Government intervention. 21
All data presented in this part are results of a Household Census and a Business Census done in
the Complex, as part of the project. Data were collected from July 2008 to June 2009.

227
(16%). But still, there are people who throw waste in green areas that have been
turned into illegal waste disposals.
The local geography of the Complex restricts access to vehicles. Cars can only run in
30% of the streets. The access to the rest of the houses is done through narrow
streets, stairs or pedestrian streets. The geography also contributes for the installa-
tion of drug dealing in the slum. Today, Complexo de Favelas do Alemão is one of
Rio de Janeiro‟s most violent slums.
5 The PAC-Complexo de Favelas do Alemão
The infrastructure intervention of PAC has been changing, since 2007, Complexo de Favelas do Alemão space configuration through huge interventions that include: con-struction of 920 new housing unities, water, sewage, drainage and public lightening infrastructure, widening streets, construction of a cable-car system to improve acces-sibility and mobility with seven stations inside the Complex and the implementation of social equipment such as youth center, professional center, school, library, first-aid clinic and a shopping mall. (Ministério das Cidades – Aliança das Cidades, 2010 b)
Although, in conceptual terms, the description of this project does not differ from
other slum upgrading projects, the Cities Ministry has incorporated the social work as
an obligatory component in the project, which must be executed by a contracted firm
under the supervision of the building contractor. In every slum upgrading project the
social work must initiate in the diagnosis phase, follow the execution of the works and
con-tinuing for a period of six to twelve months after the work conclusion. Together
with actions of land and property regularization, the social work corresponds to 4-8%
of assets invested in each slum. The value varies depending on the number of fami-
lies living in risk areas that have to be resettled.
Some of the specific objectives of the social work are: ensure conditions for commu-
nity involvement promote activities to improve the quality of life of beneficiary fami-
lies, foster and enhance capabilities of social groups, strengthen family and commu-
nity bonds, enabling participation of beneficiaries in decision-making and promoting
participative management aimed at ensuring the sustainability of the enterprise. As a
general guideline: "community participation should be understood as a pedagogical
process of building citizenship and citizen‟s right". (Brasil, 2009)
6 Social work methodology
The methodology presented by the Government of Rio de Janeiro State to execute
the social work has defined two main actuation areas: the Impact Management and
the Sustainable Development.
The Impact Management Area intends to minimize the negative impacts and maxi-
mize the positive ones resulting from the physical interventions. By realizing commu-
nity meetings, the Government intends to guarantee transparency during the work
phase and maintain, for a longer period, the conservation of the new infrastructures
implemented. The participants are responsible for informing other inhabitants every
service interruption occurred by the works, new front works, next families to be reset-
228
tled and benefits of the new equipment. All this have a close relation with building
contractor and to the present transformation of the slum.
The objective of Sustainable Development Area is the community organization
strength, through constructing and implementing a Sustainable Development Plan
elaborated in a participative way. The structure of the plan consists of five phases
described below:
1) Entrance in the territory, which main tasks are related to the recruitment of local
people to integrate the local field team and organization of the central team; charac-
terized by multidisciplinary professionals (social assistants, psychologists, architects,
engineers, geographers, economists, lawyers and graphic designers), mapping the
territory, identifying and inviting local leaders, community association members,
NGO`s leaders and young people;
2) Strategic knowledge which consists of knowledge production about the local reality
through survey activities such as: household census and business census, focal
groups with different segments of the community (local NGO`s, local businessmen,
professionals involved with local education, health, culture and sports, environment
and infra-structure) and a local NGO`s survey done by young people from the com-
munity who received a training capacity for that.
3) Future vision that consists on the construction by the participants of a common
future vision for the slum considering a fifteen-year period of time. The input data
come from the results of the surveys;
4) Action plan is the definition of the people needs projects and actions from different
areas in order to reach the future vision established. They will be listed in a “Map of
Projects”;
5) Implementation of some of the projects and actions in partnership with local
NGO`s22.
7 Participation results
Participation in slum upgrading projects can be analyzed from two different points of
views: the benefits from participating and the benefits that participation brings to the
project itself. But it must be said that, it is difficult to analyze them separately; once
the first one can be considered a pre-requisite for the second. In other words, if
people are not aware of the importance of participation and do not occupy the space
destined in the project for them, the project itself cannot receive the benefits from
participation of community.
In Complexo de Favelas do Alemão, it was clear that people had some difficulty to
comprehend the entire Sustainable Plan actuation area, especially when they were
22 The three main projects that are being already implemented are related to: work qualification to the
job market (professional courses), environmental and sanitation education (waste selection and recic-
lying campaign, illegal waste disposal cleanness, construction of a community organic garden, refo-
rastation campaign in Misericórdia Mountain) and a creation of a Reference Center for the Local
NGO`s (fund-raising, development of partenerships and common projects).

229
asked to think about the future. People are not used to planning or thinking ahead,
even more when their wishes are nothing but live with dignity and have their basic
rights attended by the public sector. The Government has the obligation to provide
basic services for all, as it is written in the Brazilian Constitution, but unfortunately,
the reality is quite different. Because of that, many of the times participants have
brought some topics different from those that were being discussed. As for a long
time they could not have the chance to be heard by the public sector, they wanted to
show that they have voice and much to say about their reality. Some of the questions
were about individual problems. They did not have the capacity to think collectively;
this capacity was gained through the development of the project. Another difficulty
was related with the voluntary participation. At the beginning, some people could not
recognize why they were invited to dedicate their evening time, on week days or an
entire Saturday, when the meetings occurred, to a project without earning any money
for that. Some others were already tired of contributing for surveys, without noticing
any upgrade from them.
On the other hand, by using the participative spaces, people from different communi-
ties had the opportunity to know each other, perceive that they have common wishes
and that together they can be even stronger to struggle against their problems and
claim for their rights. For some groups the opportunity of participating was stronger
noticed and better used than from others. For instance, it was visible to see the de-
termination of the local younger researchers when surveying the local NGO`s. For
the majority of them, it was the first work opportunity that they had. Moreover, for
some boys it was an option instead of working for the criminality. The families who
received a new house to live could understand and make difference between public
and private limits in order to respect the neighbours and maintain their unit blocks
well kept.
The building contractor and the Government hope that the community members also
develop a sense of belonging to the renewed Complexo de Favelas do Alemão in
order to keep the new public equipments perfectly installed and effectively in use for
a long period.
8 Brief conclusions
There is no doubt that the obligation of executing the social work has generated great opportunities for the community and also for the Government. Community has gained through exercising their citizenship, establishing collective objectives and awaken themselves to see that together they could be stronger than if they were alone. The Government could do the operational dimension of the project better and count on the cooperation of the local people to divulge and to preserve the new investments that have been done. Furthermore, now the Government has a Sustainable Devel-opment Plan with the needs and priority projects for the communities and recent data collected by the Census – this has never occurred before in a slum.
It must be admitted that citizen participation in infrastructure projects is very recent,
once before 2007 did not exist any consistent practice in this field. So, there are still
230
some challenges to be faced by the next professionals who will be involved with slum
upgrading projects and those who will work in some other participative planning.
A participative planning usually takes a long time to bring some results. So, in addi-
tion to the political time and the technical time, there is also the social time to be
aligned together. Besides that, it was clear that in order to reach better results, the
social work, (here representing the social time) has to start to be implemented to-
gether with the technical time, contributing to the working drawings and not only to
the execution. And, it could not be missed to state that unexpected facts should be
considered in the project schedule delay. One clear example is the crime and vio-
lence that usually interfere in the daily routine project.
The lack of responsibility with precarious settlements by previous Governments and
the discontinuation of public projects could have contributed for an uneffective par-
ticipation. Local social work teams should invest a significant time with mobilization
and project promotion.
Another key point that can be more emphasized is the relation with private sectors in
other to implement some of the listed projects more efficiently. Private sector should
know that slums are a potential market to be explored, as shown in Census data.
Moreover, after participating in the project and living a new reality after the physical
works conclusion, there will still be many people, but now, much more conscious and
aware of their citizenship power to plan the future time they always dreamed of.
References [1] Andrade, Sandra N. and Toledo, Mariana P.: Contribution of architects in multidisciplinary
teams – the case of PAC-Favelas in Rio de Janeiro, 19º. Architects Brazilian Congress, Re-
cife/Olinda, Brazil, 2010 [Internet]. Available from: http://www.19cba.com.br/08-
trabalhos.html [Accessed on 17 July 2010]
[2] Azevedo, S.: Estratégias de gestão, Política Habitacional e a integração urbana de as-
sentamentos precários: parâmetros conceituais, técnicos e metodológicos, Brasília, Brazil:
Ministério das Cidades, 2007, pp.76-90
[3] Brasil, Instrução Normativa no. 8, de 26 de março, 2009. [Internet]. Available in:
< http://www.cidades.gov.br/> [Accessed on 17 July 2010]
[4] Demo, P.: Planejamento Participativo – visão e revisão, Fórum Educacional.vol.9 (2)
abr./jun, 1985, pp. 3-22
[5] Freire, P.: Conscientização - Teoria e prática da libertação uma introdução ao
pensamento de Paulo Freire. São Paulo, Brasil: Moraes, 1980
[6] Governo do Estado do Rio de Janeiro - Secretaria de Estado de Assistência Social e Di-
reitos Humanos: Projeto Técnico de Trabalho Social-PAC-RJ/Complexo do Alemão, Rio de
Janeiro, Brazil, 2008.
[7] Governo do Estado do Rio de Janeiro – Escritório de Gerenciamento de Projetos do
Governo do Rio de Janeiro: Relatório Final – Censo Domiciliar e Empresarial Complexo do
Alemão, 2009 Available from: http://www.egprio.rj.gov.br/ [Accessed on 17 July 2010]
[8] Ministério das Cidades / Aliança de Cidades: Ações Integradas de Urbanização de Assen-
tamentos Precários, Brasília/São Paulo, Brazil: Gráfica e Editora Ideal Ltda., 2010
[9] Ministério das Cidades - Secretaria Nacional de Habitação: Avanços e Desafios: Política
Nacional de Habitação, Brasília, Brazil, 2010 a

231
[10] Ministério das Cidades - Secretaria Nacional de Habitação: Urbanização de favelas: a
experiência do PAC, Brasília, Brazil, 2010 b
[11] Tenório, Fernando G: Cidadania e Desenvolvimento Local, Rio de Janeiro, Brazil: Ed.
Unijuí, 2007
[12] Tenório, Fernando G. and Rozenberg, Jacob E.: Gestão Pública e cidadania: metodolo-
gias participativas em ação, Revista de Administração Pública, 1997,vol. 31, n. 4. Jul/ago.
pp. 101-125

232