Unidades fraseológicas em contratos de distribuição no par ...

Work Package: WP2
Type of document: Deliverable
Date: 01/11/13
Energy Theme; Grant Agreement No 226369
Partners: EDSO4SG, RSE, ZABALA, CEIT, ENERGYLAB
Responsible: RSE
Circulation:
Public
Confidential
Restricted
Title: ANALYSIS OF SMART-METERING
PROJECTS
Version: 2.0 Page: 1 / 118
Project Funded by the European Commission under the 7th Framework Programme
D 2.1
ANALYSIS OF SMART-METERING PROJECTS
© Copyright 2012 The Meter ON Consortium

Work Package: WP2
Type of document: Deliverable
Date: 01/11/113
Energy Theme; Grant Agreement No 308794
Title: ANALYSIS OF SMART-METERING PROJECTS
Version: 2.0 Page: 2 / 118
Project Funded by the European Commission under the 7th Framework Programme
Document History
Vers. Issue Date Content and changes
1.0 28/08/2013 Deliverable sent to MB for the approval
2.0 01/11/2013 Executive Summary added
Document Authors
Partners Contributors
RSE Renato Urban, Giuseppe Mauri
CEIT Alanova Wolfgang Wasserburger, Adela Marcoci
Document Approvers
Partners Approvers
Partner 1 Management Board
Work Package: WP2
Type of document: Deliverable
Date: 01/11/113
Energy Theme; Grant Agreement No 308794
Title: ANALYSIS OF SMART-METERING PROJECTS
Version: 2.0 Page: 3 / 118
Project Funded by the European Commission under the 7th Framework Programme
TABLE OF CONTENTS
EXECUTIVE SUMMARY ..................................................................................................................................... 7
PURPOSE ......................................................................................................................................................... 7
1 INTRODUCTION ....................................................................................................................................... 7
2 OVERVIEW OF QUESTIONAIRE RESPONDING TO METER-ON ................................................................... 8
3 CASE STUDIES ........................................................................................................................................ 17
3.1 FRANCE .................................................................................................................................................. 17 3.1.1 ERDF ................................................................................................................................................ 18
3.1.1.1 Technological analysis of the solution deployed .................................................................................... 20 3.1.1.2 Economic analysis of the solution deployed .......................................................................................... 22 3.1.1.3 Customer involvement ........................................................................................................................... 25 3.1.1.4 Other advanced solutions enabled by smart meters ............................................................................. 26
3.2 ITALY ..................................................................................................................................................... 31 3.2.1 Enel Distribuzione ........................................................................................................................... 32
3.2.1.1 Technological analysis of the solution deployed .................................................................................... 32 3.2.1.2 Economic analysis of the solution deployed .......................................................................................... 38 3.2.1.3 Customer involvement ........................................................................................................................... 40 3.2.1.4 Other advanced solutions enabled by smart meters ............................................................................. 42
3.3 ROMANIA ............................................................................................................................................... 48 3.3.1 Enel Distributie Muntenia ............................................................................................................... 49
3.3.1.1 Technological analysis of the solution deployed .................................................................................... 50 3.3.1.2 Economic analysis of the solution deployed .......................................................................................... 55 3.3.1.3 Customer involvement ........................................................................................................................... 59 3.3.1.4 Other advanced solutions enabled by smart meters ............................................................................. 60
3.4 SPAIN .................................................................................................................................................... 66 3.4.1 Endesa ............................................................................................................................................. 67
3.4.1.1 Technological analysis of the solution deployed .................................................................................... 68 3.4.1.2 Economic analysis of the solution deployed .......................................................................................... 72 3.4.1.3 Customer involvement ........................................................................................................................... 73 3.4.1.4 Other advanced solutions enabled by smart meters ............................................................................. 73
3.4.2 Iberdrola ......................................................................................................................................... 74 3.4.2.1 Technological analysis of the solution deployed .................................................................................... 75 3.4.2.2 Economic analysis of the solution deployed .......................................................................................... 78 3.4.2.3 Customer involvement ........................................................................................................................... 79 3.4.2.4 Other advanced solutions enabled by smart meters ............................................................................. 79
3.4.3 Gas Natural Fenosa ......................................................................................................................... 80 3.4.3.1 Technological analysis of the solution deployed .................................................................................... 81 3.4.3.2 Economic analysis of the solution deployed .......................................................................................... 84 3.4.3.3 Customer involvement ........................................................................................................................... 85 3.4.3.4 Other advanced solutions enabled by smart meters ............................................................................. 86
3.4.4 HC Energia ...................................................................................................................................... 87 3.4.4.1 Technological analysis of the solution deployed .................................................................................... 88 3.4.4.2 Economic analysis of the solution deployed .......................................................................................... 91 3.4.4.3 Customer involvement ........................................................................................................................... 94 3.4.4.4 Other advanced solutions enabled by smart meters ............................................................................. 95
3.5 PORTUGAL .............................................................................................................................................. 97 3.5.1 EDP Distribuição .............................................................................................................................. 98
3.5.1.1 Technological analysis of the solution deployed .................................................................................... 98

Work Package: WP2
Type of document: Deliverable
Date: 01/11/113
Energy Theme; Grant Agreement No 308794
Title: ANALYSIS OF SMART-METERING PROJECTS
Version: 2.0 Page: 4 / 118
Project Funded by the European Commission under the 7th Framework Programme
3.5.1.2 Economic analysis of the solution deployed ........................................................................................ 103 3.5.1.3 Customer involvement ......................................................................................................................... 110 3.5.1.4 Other advanced solutions enabled by smart meters ........................................................................... 112
4 MAIN FINDINGS AND CONCLUSIONS ................................................................................................... 116
COPYRIGHT .................................................................................................................................................. 118

Work Package: WP2
Type of document: Deliverable
Date: 01/11/113
Energy Theme; Grant Agreement No 308794
Title: ANALYSIS OF SMART-METERING PROJECTS
Version: 2.0 Page: 5 / 118
Project Funded by the European Commission under the 7th Framework Programme
GLOSSARY AND ACRONYMS
AMM Advanced Metering Management
BEUC The European Consumer Organisation
CEN European Committee for Standardization
CENELEC European Committee for electrotechnical standardization
DG DNO
Distributed Generation Distribution Network Operator
DSO Distribution System Operator EDSO European Distribution System Operators for Smart Grids
ESMIG European Smart Metering Industry Group
ETSI European Telecommunications Standards Institute
EV Electric Vehicles
GPRS General Packet Radio Service
GPS Global Positioning System
GSM Global System for Mobile Communications
HV,MV,LV High Voltage, Medium Voltage, Low Voltage
IEC International Electrotechnical Commission
Meter ON Supporting the development and deployment of advanced metering infrastructures in Europe
PLC Power Line Communication
Prosumer A Customer who consumes as well as produces electricity
RF Radio Frequency
SG-CG Smart Grids Coordination Group
UTC Coordinated Universal Time
V2G Vehicle-to-Grid
V2H Vehicle-to-Home
WACC Weighted Average Cost Of Capital
WAN Wide Area Network

Work Package: WP2
Type of document: Deliverable
Date: 01/11/113
Energy Theme; Grant Agreement No 308794
Title: ANALYSIS OF SMART-METERING PROJECTS
Version: 2.0 Page: 6 / 118
Project Funded by the European Commission under the 7th Framework Programme
REFERENCES
OPEN meter 2009 – Report on regulatory requirements, FP7 project,
http://tinyurl.com/nkmhv7g last accessed 21.2.2013
ERCEG 2011 – Final Guidelines of Good Practice on Regulatory Aspects of Smart Metering
for Electricity and Gas http://tinyurl.com/p9s2qht last accessed 19.02.2013
OFGEM 2011 – Vulnerable customer research by FDS International
http://tinyurl.com/pbh44qh last accessed 31.01.2013
CSE 2011 – The smart metering programme: a consumer review http://tinyurl.com/o6tx9bp
last accessed 31.01.2013
BEUC 2011 – Empowering consumers through smart metering http://tinyurl.com/p6o4c7q
last accessed 16.05.2013
KEMA 2012 – Development of Best Practice Recommendations for Smart Meter Rollout in the Energy Community http://tinyurl.com/pcc8cdm last accessed 16.05.2013
Smart Regions 2012 – European Landscape Report 2012 http://tinyurl.com/ojhxege last accessed 11.02.2013
[IBV04] Reference introduced by

Work Package: WP2
Type of document: Deliverable
Date: 01/11/113
Energy Theme; Grant Agreement No 308794
Title: ANALYSIS OF SMART-METERING PROJECTS
Version: 2.0 Page: 7 / 118
Project Funded by the European Commission under the 7th Framework Programme
EXECUTIVE SUMMARY
The analysis of the Smart Meter projects identified in the framework of WP1, “Collection”, is a necessary step in reaching the goal of the Meter-ON Project, which is drafting guidelines for the implementation of smart metering solutions.
In this document, a topic-based analysis is performed by different task for each project. Each task addresses a specific set of information domains, which is shown in the following:
Technological Analysis: focuses on the different technologies involved in smart meters;
Quantitative Analysis: puts the attention on the financing mechanisms, cost-benefits and if the company adopted a make-or-buy approach;
Qualitative Analysis: focuses on regulatory & legal framework in place in each country and in Europe;
Advanced Topics: investigates the possible applications of smart meters as a pillar of the smart grid.
Eight projects, which participated in the first data collection campaign, were analyzed.
The analysis shows that in most of the considered European countries there is a plan for the development and implementation of smart metering systems. In many countries these systems are already being rolled out or are in an advanced testing phase, confirming the fact that these systems are universally recognized as the main block for the development of smart-grid.
The greatest benefits that the smart-metering systems bring are a better monitoring of the network and the ability to easier integration of renewable energy resources and electric vehicles. They also represent the means to implement further policies for demand response.
The results of the projects’ analyses are the main input for the WP3, “Lesson Learned and Recommendations”, which will incorporate cross-topic analyses (based on the information domains described above), reviews of the practices in the investigated projects and prescriptions to foster the positive evolution of smart metering taking into consideration current economic, social and technological trends in The European Union and the world.
PURPOSE
The purpose of this deliverable is to provide a topic-based analysis for each project identified in the framework of WP1 “Collection”. Each project has been individually analysed according to different information domains as identified in deliverable 1.1 “Stakeholder list, Advisory Board composition and Relevant information domains”, and consequently, for each information domain, a summary of the different approaches or characteristics is being provided (e.g., the most adopted solutions or the most common requirement).
1 Introduction
WP2 analyses each project and deployment initiative provided by WP1. A topic-based analysis is performed by different task, each addressing a particular set of information

Work Package: WP2
Type of document: Deliverable
Date: 01/11/113
Energy Theme; Grant Agreement No 308794
Title: ANALYSIS OF SMART-METERING PROJECTS
Version: 2.0 Page: 8 / 118
Project Funded by the European Commission under the 7th Framework Programme
domains. Within WP2, each project is individually analyzed concurrently by each task. The tasks identifying missing information highlight them to WP1 and require WP1 to provide access to them (whether is possible). Performing a topic-based analysis within different topic-related tasks, ensure that the same information domain is addressed on each analyzed project; furthermore, each task is performed by a given expert group being responsible to deepen the assigned information domain for each questioned smart-metering project.
2 OVERVIEW OF METER-ON QUESTIONNAIRE
To gather information on past or ongoing smart metering projects in the framework of WP1, a data collection template has been elaborated and sent to all the project partners and affiliates to be filled in. The template addresses the most relevant topics on every considered smart meter project, including also contextual information, e.g. regarding regulatory framework, in force laws, information on the initiatives carried out to improve customer acceptance and ongoing smart grid developments.
The deliverable “Analysis of smart metering projects” relies on this questionnaire to perform a detailed assessment and interpretation of the information needed to outline the main features of each project and a summary of the main characteristics observed in the entire group of projects. The outcomes of the analysis will be considered in WP3 to draw a set of lessons learned on the basis of past experiences and recommendations for policymakers and utilities to foster the deployment of these technologies in Europe.
To accomplish the scope of the analysis, the work has been performed by taking into consideration 4 different tasks that correspond to the 4 domains of the template:
“Technological Analysis”, focuses the attention on the different technologies involved in smart meters. In particular, communication technologies, used for the communication of the meters with possible data concentrators or data repeaters, as well as with the back-end system; local communication technologies (exploited by field workers for commissioning activities as well) as by in-home devices for building automation or demand side management) and metrological technologies (as far as gas and heat utilities are concerned). In addition, cyber security and privacy analysis aims to highlight the adopted approaches to tackle the issues, in particular by outlining if authentication and encryption are foreseen in each smart metering project.
“Quantitative Analysis”, focuses the attention on the financing mechanisms, cost-benefits and if the company adopted a make-or-buy approach. Financing Mechanism Analysis aims to provide a rough cash-flow analysis for each analysed project, underlying the main economics of the projects such as capital expenditures, operational expenditures, pay-back period, tariff-incoming, services-incoming, opportunity-costs, savings, return of the investment and internal rate of return. Make-or-buy and Development Process Analysis aims to underlines which are the developing outsourcers, the equipment suppliers, the services suppliers and the contract manufacturers. When it is possible, it points out the financing mechanisms, the contracts the joint ventures and, whether is possible, the economical drivers (e.g., opportunity costs).

Work Package: WP2
Type of document: Deliverable
Date: 01/11/113
Energy Theme; Grant Agreement No 308794
Title: ANALYSIS OF SMART-METERING PROJECTS
Version: 2.0 Page: 9 / 118
Project Funded by the European Commission under the 7th Framework Programme
“Qualitative Analysis” focuses the attention on regulatory & legal framework in place in each country and in Europe to outline the framework conditions and their impact on the development of each smart metering project. Therefore for each country remuneration schemes such as Regulatory Asset Based and measurement services remuneration are considered to outline what regulators allow and require. The legal framework is also analysed to identify which legal entity is entitled and responsible for installing smart meters, operating them and providing metrological data and services. The Security of Electricity Supply Directive (2005/89/EC) addressed Smart Metering for the first time. Article 3 says that Member States shall take appropriate measures to safeguard the balance between the demand for electricity and availability of generation capacity, which may include. For each country it is shown how their regulatory and legal framework is influencing the adoption of real-time demand management technologies such as advanced metering systems, research and any other different approach taken by the authorities across the EU. User Acceptance and Customer Involvement is assessed for each project, detailing how final customers have been involved and whether possible customer empowering devices such as home displays or active demand systems were accepted or rejected by final customers.
“Advanced Topics” focuses on the possible applications of smart meters as a pillar of the smart grid. This task underlines how the smart meter and Automated Metering Infrastructures can be used for metering of electric vehicle charging points, devices for empowering customers in demand response actions such as in-home display showing metrological data and devices interacting with home appliances, for a fine-grained power quality analysis, metering of generation and, finally multi-metering, i.e., systems collecting metrological information for different utilities exploiting all possible synergies.
Overview of the technological analysis
From the analysis of the 8 projects participating to the first data collection campaign (Smart Metering project – Endesa, Iberdrola Castellon Smart Grid Deployment – Iberdrola, Linky – ERDF, Roll out smart meters in HC Distribucion – Hidrocantabrico, Inovgrid – EDP, Itac@ - Gas Natural Fenosa, Telegestore – Enel, Enel AMM pilot test – Enel Distributie Muntenia. For additional information see Deliverable D1.3) the following considerations emerge regarding the technological analysis.
Status
- 5 projects are being rolled out with an almost total involvement of customers, with the
exception of a project that involves only 1% of customers but for which it is planned to
install 10 million meter (100% of customers) by the end of 2018.
- 2 projects are in the pilot phase. One involves 864 meters while the other one
involves 300000 meters. Note that, in the event of roll-out, in the first project is
Work Package: WP2
Type of document: Deliverable
Date: 01/11/113
Energy Theme; Grant Agreement No 308794
Title: ANALYSIS OF SMART-METERING PROJECTS
Version: 2.0 Page: 10 / 118
Project Funded by the European Commission under the 7th Framework Programme
expected to install 2.6 million smart meter by 2022 while in the second project are
expected 35 million smart-meter by 2020.
- 1 project is in demonstration phase with about 30000 meters installed and the
prediction to install other 6 million during the roll-out (the date of which has not yet
been decided).
Communication
- All the projects use PLC technology, except one that uses both PLC and GPRS
technologies.
- The most used communication protocols are PRIME and METERS AND MORE
which are used in 3 projects respectively. Of the remaining 2 projects, one use both
DLMS/COSEM (PLC) and TCP-IP (GPRS), while the other one use G3-PLC.
Local interfaces
- Out of the 8 projects considered, 7 smart meters present an optical interface. In one
project there is also a serial RS-485 interface that implements the Modbus protocol
used for interfacing with the HAN. In the project in which there is no optical interface
both a numerical local interface and a tariff contact are present.
Display
- All projects have a smart meter with an alphanumerical display that can be remotely
managed by the DSO. The most used format is a 2 rows x 16 columns display. In 4
cases it is compatible with OBIS codes. In one project the display is divided in two
separated areas: one is an alphanumeric 2x16 display while the second one presents
some fixed icons. Also, in one case there is the possibility to add an external display
connected with a wired or a wireless communication.
Electrically protective device and switchgear
- Only in 3 projects the smart meter has an electrical protective device. In two cases is
an overcurrent protection that is ensured by a disconnection relay or by an internal
fuse (in this case this kind of protection is required by the regulation), while in the
remaining one case it is an overvoltage protection device.
- In all projects the smart meter has an internal switchgear. In two cases the
switchgear is a C63-type circuit breaker that is accessible from external. In the other
four cases the switchgear is a relay that is not accessible from external. In that cases
the switchgear can be rearmed via a pushbutton located in the front of the smart
meter or automatically through a mechanism that measure the impedance of the
customer’s circuit. In one case the switchgear can also be remotely rearmed by the
central system management via PLC.

Work Package: WP2
Type of document: Deliverable
Date: 01/11/113
Energy Theme; Grant Agreement No 308794
Title: ANALYSIS OF SMART-METERING PROJECTS
Version: 2.0 Page: 11 / 118
Project Funded by the European Commission under the 7th Framework Programme
Load control
- All projects make available a load management mechanism in the smart meter. In
three cases this mechanism is simply based on the disconnection of the customer’s
by the smart meter’s internal switchgear. In one case the mechanism is based upon
the activation of a secondary value of the contractual power (that is lower than the
main one). In two cases there is a “load shedding” mechanism that can be remotely
managed. Only in one case the mechanism for the load management does not work
in real time but must be scheduled.
Backup power supply
- In each project the smart meter has a backup power supply. In 6 cases out of 8 there
is an internal battery that guarantee a keep-alive time in the range of 5-15 years. In
the two remaining cases there is a capacitor or a supercap with a keep-alive time of
about 7 days.
Remote clock synchronization
- In all projects the real-time clock of the smart meter is remotely synchronized. Also in
all project but one the internal clock is compliant with the EN 62054-21 international
standard.
Prepayment mechanism
- In 4 projects out of 8 there is no prepayment mechanism. In 4 projects prepayment
parameters and credits can be managed by the central system but are not
implemented.
Contract management
- All projects offer the possibility to manage contracts both locally and remotely.
Fraud detection
- In all projects but one there is a meter’s cover-open detection mechanism.
Cyber security
- In one questionnaire there is no data available about cyber security. Supposedly
cyber security is ensured, but no information about how it is done is provided.
- All the remaining 7 projects ensure cyber security. Generally it is done by the use of
the cyber security mechanism defined in the communication protocol used. In some
project that mechanisms have been improved, for example by the insertion of further
user’s access rights, by the use of a better authentication mechanism or by permitting
the transmission of meter’s data only after a specific request by the concentrator.

Work Package: WP2
Type of document: Deliverable
Date: 01/11/113
Energy Theme; Grant Agreement No 308794
Title: ANALYSIS OF SMART-METERING PROJECTS
Version: 2.0 Page: 12 / 118
Project Funded by the European Commission under the 7th Framework Programme
- Data encryption is present in only 4 projects, but in other 2 is planned to be implemented.
Overview of the quantitative analysis
From the analysis of the 8 projects participating to the first data collection campaign (see Deliverable D1.3) the following considerations emerge regarding the quantitative analysis.
Financial Information
The information collected from the 8 projects show that the average budget of smart metering projects varies substantially, strongly depending on the kind of project under consideration (from pilot projects to roll-out). The highest budget sums up to 4500M€, (a pilot case accounting for 35.000.000 smart meters), whilst the lowest ones sum up to dozens of M€, accounting few thousands smart-meters. When budgets overcome 1000 M€, projects are only pilot or roll out, where it is planned the installation of at least 1 million of smart meters (these cases are referred to DSOs operating in Italy, France, and Spain). In most cases, the funding source is private (and the source is the DSO itself) but in one case publicly supported. The payback period ranges between 10 and 20 years, except in the case of ENEL Italy, as the projects’ payback period is around 5 years. The estimations provided by projects of their IRR are quite dispersed, but in any case higher than WACC, leading to NPVs always positive. Not enough information has been provided by projects to discuss the Discounted Rate.
Cost – Benefit
In this section we provide an overview of costs and forward looking benefits of projects focusing on the share they cover and by time capital or M€ (million euro) vs. operative or M€/year (million euro per year).
Considering capital costs, at a first sight one may notice that on average premise costs amount to 85% of the total (regardless of the project’s wideness, number of installed meters and clients). That said, two cases are particularly worth noting; EDP full roll-out (70%) and ERDF (100%), as their values diverge from others cases that slightly differ from the mean, namely most of cases indicated an amount of money corresponding to a share ranging from 80 to 90% of the total.
Considering field devices cost, data appear to be pretty heterogeneous; and in four cases field device costs exceed 10%, specifically HC allocates about 16%.
Little information is available on data communication infrastructure. In this regard from approx. 5% of capital costs up to 8,5% is allocated for communication infrastructure” in the projects under analysis
Turning to operative costs, costs allocation significantly varies. In some project costs are under 10% of capital cost, but in other project they are above 60%.
Estimated benefits are then scattered according to the beneficiary: (i) consumer, (ii) industry, (iii) country and (iv) others. Expected benefits are calculated using the same metrics; M€ or
Work Package: WP2
Type of document: Deliverable
Date: 01/11/113
Energy Theme; Grant Agreement No 308794
Title: ANALYSIS OF SMART-METERING PROJECTS
Version: 2.0 Page: 13 / 118
Project Funded by the European Commission under the 7th Framework Programme
M€/year consistently with costs. It is a well-known fact that the estimation of benefits across time is complex and requires complete information. If one focuses on consumer M€ benefits, the average share is 40% whilst business benefits’ share is approximately 60%; other beneficiaries do not cover a notable role in the 8 cases under examination. Taking into consideration the M€/year benefits the scenario is clearer as the main beneficiary results to be the industry. In facts, looking at our database, no less than 75% of the total benefits are for the industry.
Considering the selected cases one may note that: three out of eight projects are based on budgets that exceed 1.000 M€, specifically 4.500 M€ (pilot test and Roll Out), 2.100 M€ (Roll Out) and 1600 M€ (Roll Out). That said other three cases do not exceed the 100 M€ boundary. At any rate budget is commensurate to the project scale: R&D, Pilot demonstration, Roll Out. Regarding the funding type and source, all cases but one – ERDF with 100% of public funding source – declare 100% funding coming from private sector. While the source of funding ranges from (i) the company itself (e.g. Iberdrola networks, Endesa Distribución Eléctrica, Enel Distribuzione S.p.A., (ii) ERDF funding & French Turpe and (iii) a joint-venture. The average length of time required to recover the cost of investments is 12 years; the two poles are ERDF (maximum length) and Enel Distribuzione S.p.A (minimum length). Companies should accept those projects where the IRR is greater than the discount rate used (WACC). An IRR greater than the WACC suggests that the project will more than repay the capital costs (opportunity costs) incurred; considering the available information all cases present IRR>WACC.
Supply Chain configuration
Also in the supply chain section, the picture is pretty dispersed. While the level of integration ranges from “no integration” at all (the case of GNF – Spain) to “extreme” integration (Enel – Romania, and ERDF – France), some activities are in general performed internally, such as Logistics, Maintenance, and Data Management. On the other hand, Manufacturing is always performed by suppliers. When it comes to suppliers belonging to the group, the supply is performed by a single supplier showing a somehow close relationship; as for the suppliers not belonging to the group, there is a mixture of single/multiple supplier and Long/Short-Term Buyer-Supplier-Relationship (BSR) in place (please notice that the majority of the BSRs are Long-Term ones). Not enough information is provided to discuss the most relevant costs for the different Supply Chains.
As for the future (or current) roll-out projects, a few differences can be highlighted. The structure of the supply chain will not undergo big changes. In few cases, Data Communication will be performed internally, and also, the level of integration will decrease dramatically: only Logistics and Data Communication activities will perform internally, while the other activities, Manufacturing, Installation, and Maintenance will be bought from multiple suppliers.
Overview of the qualitative analysis
From the analysis of the 8 projects participating to the first data collection campaign (see Deliverable D1.3) the following considerations emerge regarding the qualitative analysis.

Work Package: WP2
Type of document: Deliverable
Date: 01/11/113
Energy Theme; Grant Agreement No 308794
Title: ANALYSIS OF SMART-METERING PROJECTS
Version: 2.0 Page: 14 / 118
Project Funded by the European Commission under the 7th Framework Programme
According to Directive 2009/72/EC1, European energy networks are subject to unbundling requirements which oblige all Member States to make certain that vertically integrated energy companies are separated into various stages of energy supply: generation, distribution, transmission and supply. The Directive aims at creating a more competitive and transparent European Energy Market that will benefit end-users by gradually integrating national markets, making supplies more secure while at the same time strengthening European Union’s competitiveness. The deadline for transposing the Directive into national legislation has been set for 03.03.2011, but as practice shows each Member State has various interpretations of the matter as shown in the below analysis.
Information regarding the current status has been collected through the project’s questionnaire and also by analyzing the available literature on the matter (accessed until March 2013). In Europe the preference of regulatory and legal instruments to promote smart metering ranges from mandating its introduction through the definition of minimum technical requirements and adding or not some financial incentives to the other extreme of removing regulatory and legal barriers, thus enabling, not mandating, smarting.
As for the customer’s side the analysis points out how the issue of the acceptance and involvement is treated in each project. The involvement of the customer is noted to be a complex point linked to the regulation in place in each Member State, where customers are expected to be engaged in these changes that affect their daily lives, but as some evidence show the information needs to be shared in a more accessible and understandable manner for them to do not see smart meters as a danger and to experience real benefits from their usage, thus ensuring that energy companies offer the best value and services.
It is observed that in some cases companies running the smart metering projects adopted a clear strategy targeting the engagement of the end-users, but in other cases it is clear how the focus was more on the technological side and how the customer was not involved at the early stage of implementation. The initiatives to engage the consumers in the smart metering implementation range from basic informative letters on the matter with updates throughout the process, to round-table meetings with the stakeholders and to large-scale surveys and Customer Service platforms to attract customers in providing their opinions and to enhance their interaction with the smart meter.
Overview of the advanced topics
From the analysis of the 8 projects participating to the first data collection campaign (see Deliverable D1.3) the following considerations emerge regarding the advanced topic analysis.
Impact of smart metering on distribution network operation
All DSOs in the study agree on the positive impact of smart metering on distribution management system. The possibility to receive real time information of the MV and LV power
1 http://eur-lex.europa.eu/LexUriServ/LexUriServ.do?uri=OJ:L:2009:211:0055:0093:EN:PDF

Work Package: WP2
Type of document: Deliverable
Date: 01/11/113
Energy Theme; Grant Agreement No 308794
Title: ANALYSIS OF SMART-METERING PROJECTS
Version: 2.0 Page: 15 / 118
Project Funded by the European Commission under the 7th Framework Programme
grids allows a better observability of the network, which leads to an easier and more flexible grid management in the Network Operation Centers. The impact on network planning is also agreed to be positive by DSOs. Thanks to the acquisition of load profiles, network calculations and planning can be improved, with more accurate load flow calculations to detect abnormal losses in the MV network. Besides, power quality and event data as well as data on technical losses can be used to plan maintenance investments.
Regarding the impact on network maintenance, different opinions come up from the European DSOs. In general smart meters can enable an optimised operation of the system by reducing costs related to maintenance operations that can be now remotely executed and consequently a faster fault detection/location and power restoration. The higher observability and the more flexible management of network elements increase their operating life. Gas Natural Fenosa, HC and EDP expect to benefit directly by the smart metering deployment. ERDF will not benefit directly, but will benefit from the communication network deployed, which will permit to move toward condition-based maintenance of the assets. Finally, the benefit is being yet evaluated for Endesa.
The impact on technical and non technical losses is also agreed to be positive. All information collected by smart meters is expected to contribute to manage losses, to avoid measurement mistakes (measures lower than real consumption), to detect wrong database records and irregular or tampered installations (frauds and thefts).
Thanks to the information on quality of service received from the meters, namely under voltage, overvoltage, harmonics and overload conditions analysis about load flows, impact of electric vehicles and distributed generation can be performed. ERDF, Enel, Enel Distributie Muntenia, Iberdrola, Gas Natural Fenosa, HC and EDP agree on these aspects to provide a higher quality of supply, better response to faults and a more balanced network. For Endesa, this benefit is currently under evaluation.
EV Charging Infrastructure
The smart metering allows the deployment of EV charging infrastructures able to manage the charges and minimize the impact of EV penetration in the power grid, maintaining the conditions of QoS and continuity of the supply. Smart meters also enable the possibility of EVs to support the power system, giving remaining energy to the grid in case of need systemically (Vehicle to Grid, V2G), or locally (Vehicle to Home, V2H).
Smart metering systems from ERDF, Enel, Enel Distributie Muntenia, EDP, Endesa, Gas Natural Fenosa and HC deal with smart charging, while systems from Endesa deal with Vehicle to Grid services, and systems from ERDF deal with Vehicle to Home services.
Distributed Generation

Work Package: WP2
Type of document: Deliverable
Date: 01/11/113
Energy Theme; Grant Agreement No 308794
Title: ANALYSIS OF SMART-METERING PROJECTS
Version: 2.0 Page: 16 / 118
Project Funded by the European Commission under the 7th Framework Programme
In order to facilitate the introduction of distributed generators, smart meters implement the ability of measuring information about the generation patterns. On this matter, for the majority of DSOs the meter is programmed to get incremental values from the six magnitudes, A+, A- and reactive energy in 4 quadrants. Smart meter can take bi-directional measures, reactive energy measures, apart from the compliance with standard AMI functions.
In the case of ERDF, the “linky” meter is generally installed for energy consumption, and a second one for electricity generation. In case of pure producers, a bidirectional meter is installed at producer premises.
Demand Response
As far as demand response is concerned the different features implemented by European DSOs are internal remotely programmable breaker and demand control algorithm on board, display on board, HAN serial interface (which enables local communication with customers devices/appliances), residual power threshold to use during active demand periods, critical and non-critical periods of demand management, mobile peak tariffs, remote reduction of the power threshold, real time communication between the meter and the connected applications (TIC), remote reduction of the available power until disconnection, load control relay.
Regarding the participation of consumers, there is a diversity of opinions coming from European DSOs. A consolidated position for Enel, Iberdrola and EDP is to establish a direct link between the utility and the customers, and give them information on their consumption.
The most common interfaces provided by European DSOs are web interface, dedicated in-home displays, personal computers, and smart phones.
DSOs are currently developing different projects all around Europe to test demand response applications. GNF demand response services are being tested in PRICE project, leaded by the company, where some demand response features are developed, but always separating the consumer and DSO side. EDP is actively working in the EcoGrid European project. ERDF has several ongoing demand response projects: GreenLys, NiceGrid and Grid4EU, IssyGrid, Houat et Hoedic and Address, Smart Grid Vendée. Enel is also working on demand response projects such as ADDRESS, Energy@Home, ADVANCED, Enel Info.
Regarding regulatory framework, different actions are undertaken in the analyzed countries, most of them developing different patterns of timely tariffs. The Spanish NRA has carried out the initiative of the off-peak tariff and super off-peak tariff, trying to promote demand side management. In France, Time-of-use is available for all customers, and Critical Peak Pricing for customers connected in 3-phases. In Italy, a mandatory ToU 2-bands tariff exists (peak / midlevel+offpeak).
Other services
Regarding other advanced metering solutions there is a common trend of all DSOs enquired to neither develop heat nor water smart metering solutions. On this matter yet Enel is working on a solution for smart gas metering with advanced functionalities, taking the

Work Package: WP2
Type of document: Deliverable
Date: 01/11/113
Energy Theme; Grant Agreement No 308794
Title: ANALYSIS OF SMART-METERING PROJECTS
Version: 2.0 Page: 17 / 118
Project Funded by the European Commission under the 7th Framework Programme
opportunities of the solution already deployed in the electricity sector, being the deadline imposed by NRA the end of 2018 for gas meters. This solution applies to Enel Distributie Muntenia as well, with a deadline of 80% gas meters installed by 2020 in Romania. EDP has also on-going plans to evaluate a possible solution for gas metering, where the deadline is 80% in 2020. Conversely, heat, gas or water metering is not currently developed at Endesa, Iberdrola and HC.
3 CASE STUDIES
3.1 France
Regulatory framework and market overview
National Regulation on smart meter In France the regulatory authority (CRE) set that by 2016 95% of smart meters must be installed. In 2007, the “Commission de Régulation de l’Énergie” (CRE) benchmarked Automated Meter Management/Automated Meter Reading (AMM/AMR) projects through seven states in the United States and Europe, with the objective of building a compelling business case to trade French low-voltage meters for smart meters. On 6 June 2007, CRE outlined the policy to be followed for electricity metering at installations connected to low-voltage public distribution grids for a power level of 36 kVA or less.
In August 2010 France also issued a decree which has accelerated the country’s deployment of smart meters (Decree No. 2010-1022 of 31 August 2010). According to this 95% of smart meter deployment by end of 2016 is required, surpassing EU’s given overall number of 80% by 2020. This covers over 35 million smart meters, most of which are owned by ERDF (Electricité Réseau Distribution France) which is the main DSO in France.
Another key fact is that all meters installed in France from 2012 need to be smart meters, allowing daily data collection and consumers have the right to obtain the data shared with authorized parties.
The DSO is responsible for meter installation, meter maintenance, meter reading and meter data management while the customer is the owner of the meter data.
In 2008 unbundling started eventually in the ITO form in France, or legal unbundling which is the minimum EU requirement. TSOs have pursued their efforts as regards their operational independence from the parent companies. Although the legal framework regarding the unbundling rules, i.e. the independence of the TSOs and the competences of CRE in this regard remains unchanged, the TSOs already started to prepare for the future changes in the national legal framework due to the transposition of the 3rd energy package.

Work Package: WP2
Type of document: Deliverable
Date: 01/11/113
Energy Theme; Grant Agreement No 308794
Title: ANALYSIS OF SMART-METERING PROJECTS
Version: 2.0 Page: 18 / 118
Project Funded by the European Commission under the 7th Framework Programme
According to CRE DSOs are striving to improve their independence vis-à-vis their parent companies but progress has still to be made (CRE 2010 National Report to DG ENER).
Distributors and customers shares for each distributor In France, Electricité Réseau Distribution France (ERDF), a 100% subsidiary of EDF Group since 1st January 2008, is the largest DSO. Together with ERDF, six other DSOs cover over 98% of French sites and national electricity consumption: Electricité de Strasbourg, Gaz et Electricité de Grenoble, URM (ex Usine d’Electricité de Metz), SICAE de l’Oise, Sorégies Deux-Sèvres (ex Régie du Sieds) and Sorégies.
France has a little over 35 million electricity customers served by around 160 DSOs. ERDF operates 95% of continental grids. The rest of the continental territory is operated by local companies among which 4 have more than 100,000 customers. In Corsica and in overseas territories, EDF SEI is the DSO for more than 1 million customers. Most of the local distribution companies are owned by municipal governments.
Distributors replying to the questionnaire Electricité Réseau Distribution France (ERDF) is the only DSO that has replied to the questionnaire.
3.1.1 ERDF
The ERDF smart meter project has started in 2007 and it’s expected to finish the deployment by 2020. At the moment it involves about 300.000 customers, 90% of which are residential. It’s foreseen that in 2020 there are 35.000.000 meters installed, that correspond at 100% of the total customer of ERDF. The average contractual power is 6 kVA for customers without electric heating, and 9 kVA for customers with electric heating while the average residential yearly consumption is 2400 kWh for customer with a 6 kVA contractual power and 8500 kWh for customer with a 9kVA contractual power. An overview of the ERDF Power Grid, can be seen hereafter.

Work Package: WP2
Type of document: Deliverable
Date: 01/11/113
Energy Theme; Grant Agreement No 308794
Title: ANALYSIS OF SMART-METERING PROJECTS
Version: 2.0 Page: 19 / 118
Project Funded by the European Commission under the 7th Framework Programme
ERDF: Overview of the Power Grid
Yearly energy distributed (TWh) 340 TWh (370 TWh including losses)
HV,MV and LV voltage levels 60 kV / 20 kV / 400 & 230 V
Number of HV/MV substations 2 000
Number of MV/LV substations 740 000
Average residential contractual power (KW)
‐ 6 kVA (for customers without electric heating) ‐ 9 kVA for customer with electric heating
Average residential yearly consumption (KWh)
‐ 2 400 kWh for a customer with a 6 kVA contractual power
‐ 8 500 kWh for a customer with a 9 kVA contractual power

Work Package: WP2
Type of document: Deliverable
Date: 01/11/113
Energy Theme; Grant Agreement No 308794
Title: ANALYSIS OF SMART-METERING PROJECTS
Version: 2.0 Page: 20 / 118
Project Funded by the European Commission under the 7th Framework Programme
3.1.1.1 Technological analysis of the solution deployed
ERDF: AMI Architecture
The architecture of the Advanced Metering Infrastructure is based on Data Concentrator which are installed in MV/LV substation (see Figure 1). Each Data concentrator manages up to 1500 meters connected to the low voltage network using PLC, on the other side connect to the WAN using GPRS communication provided by a third party Telco. The current first roll-out stage uses PLC based on G1-PLC protocol with SFSK modulation, however for the second roll-out stage plans are for using G3-PLC communication protocol with OFDM modulation. Clock of data concentrators can be remotely synchronized by the IS. Alarms are sent by a push mechanism to the central system, and require between 1 and 2 minute to be transmitted. Data concentrators are operable with phase-to-neutral system and have a self-consumption of 20 W. The adopted communication solution allows 94% of reading success rate and 94% success rate of load profile acquisition. The data transmitted during each reading operation include 14 register (10 for energy supply, and 4 for distribution), load profile (with a programmable integration period), maximal power and miscellaneous information. The reading operation is daily based, but data remains available in the meter for two months, and can be recovered, on request, at any time.
Figure 1: ERDF (link) AMI
ERDF: Main Features of Electricity Smart Meters (single and three phases) Single phase and three phase meter share the same communication technology. The data transmitted during each reading operation include 14 register (10 for energy supply, and 4 for distribution), load profile (with a programmable integration period), maximal power and miscellaneous information. The reading operation is performed

Work Package: WP2
Type of document: Deliverable
Date: 01/11/113
Energy Theme; Grant Agreement No 308794
Title: ANALYSIS OF SMART-METERING PROJECTS
Version: 2.0 Page: 21 / 118
Project Funded by the European Commission under the 7th Framework Programme
on a daily base, but the data remains available in the meter for two months, and can be recovered, on request, at any time. The meter doesn’t have any electrically protective device but it has an internal breaker with a maximum cut-off current of 120A for the single phase type and 80 A for the three phase type. It can be manually rearmed. The meter has a capacitor as a power supply backup that ensures a keep-alive time of 7 days. It has an internal display but offer the possibility to connect an external one with a wired or wireless connection. The meter offer the possibility to program an infra-day billing profile with an integration profile of half an hour and can be programmed with several tariff programs that could be annual, weekly or daily. It also offer the possibility to control the load, even if not in real time but in a scheduled way. The meter also has a fraud detection mechanism that detects unauthorized cover open. The frauds alarms are send to the central system in real-time.
SINGLE PHASE THREE PHASE
Meter average life Expected : 20 years
Presence of internal switchgear
Yes, an internal breaker with one cutting pole and a maximum cut-off current of 120 A. It can be manually rearmed.
Yes, an internal breaker with three cutting pole and a maximum cut-off current of 80 A. It can be manually rearmed.
List of international standard that meter is compliant to
- NF EN 50470-1:2007 - DIRECTIVE 2004/22/EC - ISO/IEC 15417 - NF EN 62053-23:2003 - EN 61000-4-30 - ERDF-CPT-Linky-SPEC-FONC Meter parameters - ITU-T G.9955 - ITU-T G.9956 - Recommendation JEDEC JESD 210° - WELMEC 7.2: Issue 2 - IEC 62053-23 - NF EN 62054-21 - EN 61000-4-30
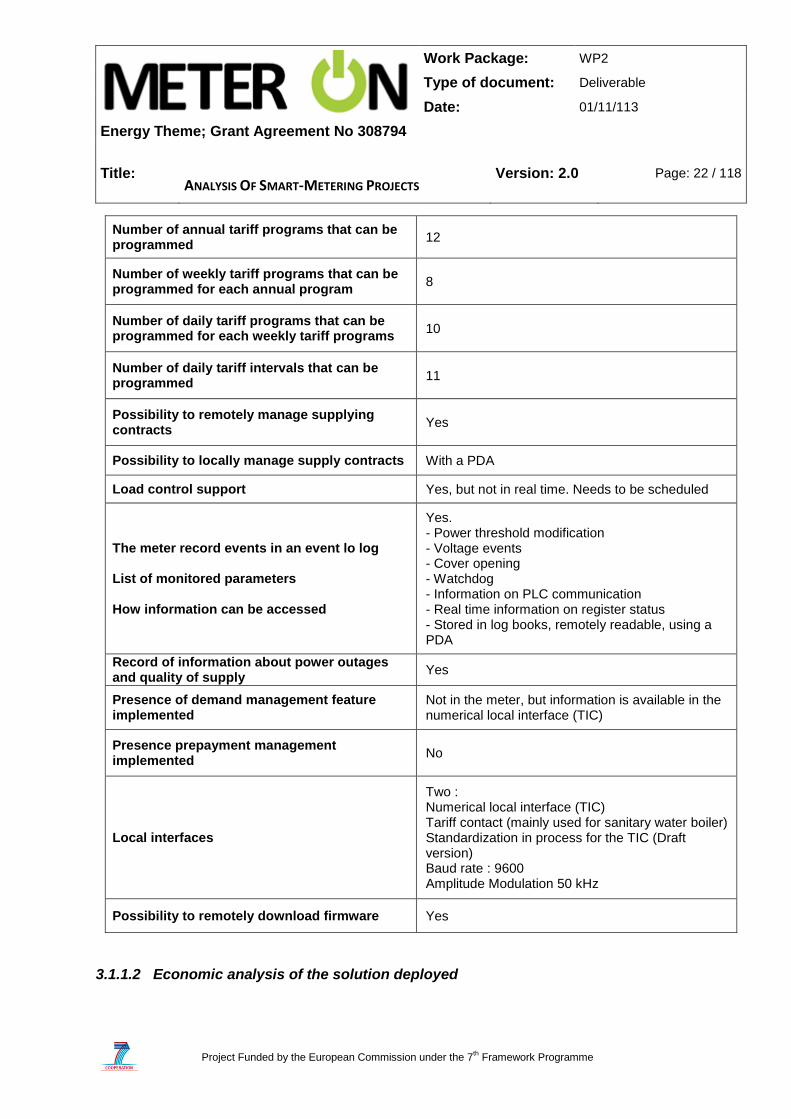
ERDF: Main Functions of Electricity Smart Meters (single and three phases)
Single phase and three phase meter has identical main functionalities.
SINGLE PHASE THREE PHASE
Frequency for reading Daily
Active energy measurement bi-directional
Reactive energy measurement detected in 4 quadrants
Work Package: WP2
Type of document: Deliverable
Date: 01/11/113
Energy Theme; Grant Agreement No 308794
Title: ANALYSIS OF SMART-METERING PROJECTS
Version: 2.0 Page: 22 / 118
Project Funded by the European Commission under the 7th Framework Programme
Number of annual tariff programs that can be programmed
12
Number of weekly tariff programs that can be programmed for each annual program
8
Number of daily tariff programs that can be programmed for each weekly tariff programs
10
Number of daily tariff intervals that can be programmed
11
Possibility to remotely manage supplying contracts
Yes
Possibility to locally manage supply contracts With a PDA
Load control support Yes, but not in real time. Needs to be scheduled
The meter record events in an event lo log List of monitored parameters How information can be accessed
Yes. - Power threshold modification - Voltage events - Cover opening - Watchdog - Information on PLC communication - Real time information on register status - Stored in log books, remotely readable, using a PDA
Record of information about power outages and quality of supply
Yes
Presence of demand management feature implemented
Not in the meter, but information is available in the numerical local interface (TIC)
Presence prepayment management implemented
No
Local interfaces
Two : Numerical local interface (TIC) Tariff contact (mainly used for sanitary water boiler) Standardization in process for the TIC (Draft version) Baud rate : 9600 Amplitude Modulation 50 kHz
Possibility to remotely download firmware Yes
3.1.1.2 Economic analysis of the solution deployed

Work Package: WP2
Type of document: Deliverable
Date: 01/11/113
Energy Theme; Grant Agreement No 308794
Title: ANALYSIS OF SMART-METERING PROJECTS
Version: 2.0 Page: 23 / 118
Project Funded by the European Commission under the 7th Framework Programme
Costs & Benefits
Cost Category Detailed Cost Actor
Incurring Cost
%
In premise cost
Meters (€) DSO 41,67%
Installation of Meters (€) DSO 58,33%
Total
100,00%
The first aim of the analysis is to simplify data regarding main costs and benefits coming from the questionnaire. Considering the structure of the questionnaire’s section dedicated to costs and benefits, we aim at resuming results using a classification of costs and benefits consistently with their nature; M€/year or M€ without changing totals, in an effort to provide unbiased information. This is a peculiar case as in premise cost corresponds to 100% of total (M€), the share of meters is approximately 41,7% whilst installation of meters the remainder 58,3%. Assessment of benefits and identification of beneficiaries require forward-looking statements. In this descriptive summary we classify benefits according to beneficiary’s category and, consistently with the costs section, M€/year against M€. About the total yearly benefits; consumers are not mentioned and business add up to 100%, specifically, via reduction of meter reading and operations cost (47,62%) and reduction in commercial losses (52,38%).
Benefit Category Detailed Benefit Beneficiary %
Business Benefits
Reduction of meter reading and operations cost (reading, billing, customer care) (€/year)
DSO 47,62%
Reduction in commercial losses (thefts, frauds, …) (€/year)
DSO 52,38%
Total
100,00%

Work Package: WP2
Type of document: Deliverable
Date: 01/11/113
Energy Theme; Grant Agreement No 308794
Title: ANALYSIS OF SMART-METERING PROJECTS
Version: 2.0 Page: 24 / 118
Project Funded by the European Commission under the 7th Framework Programme
Supply Chain
SC of the Project in Progress:
SC MACRO TIER
RESPONDENT SUPPLIERS
BELONGING TO THE GROUP
OTHER SUPPLIERS COST PER UNIT
Manufacturing 3; also supplying
competitors; Tendering
Logistics X
Installation X 10; also supplying
competitors; LT BSR & Tendering
Maintenance X
Data Comm. X 3; also supplying
competitors
Data Management
X
The project in progress is being deployed by means of an extreme Supply Chain (SC) vertical integration. Among the 6 main necessary macro-tiers (Manufacturing and assembly, Logistics, Installation, Maintenance, Data Communication, Data Management), 5 out of 6 (Logistics, Installation, Maintenance, Data Communication, Data Management) are performed internally. Manufacturing and assembly is performed by multiple suppliers also supplying competitors, with a Buyer-Supplier-Relationship started by means of a tender. Both Installation and Data Communication are also performed by multiple suppliers also supplying competitors, with long-term Buyer-Supplier-Relationship in the case of Data Communication, and with a Buyer-Supplier-Relationship started by means of a tender for the Installation.
As far as it concerns the costs related to each macro-tier within the project in progress, no information is provided.
SC of the Roll-out:
SC MACRO TIER
RESPONDENT SUPPLIERS BELONGING
TO THE GROUP OTHER
SUPPLIERS COST PER
UNIT
Manufacturing X; Tendering
Logistics X

Work Package: WP2
Type of document: Deliverable
Date: 01/11/113
Energy Theme; Grant Agreement No 308794
Title: ANALYSIS OF SMART-METERING PROJECTS
Version: 2.0 Page: 25 / 118
Project Funded by the European Commission under the 7th Framework Programme
Installation X X; Tendering
Maintenance X X; Tendering
Data Comm. X X; Tendering
Data Management
X X; Tendering
The SC for the future roll-out is expected to be slightly different from the one in progress, with the same level of vertical integration, but also supplying from suppliers not belonging to the group for almost all the macro-tiers (5 out of 6, Manufacturing and assembly, Installation, Maintenance, Data Communication, Data Management). As far as it concerns the costs related to each macro-tier within the roll-out, no information is provided.
3.1.1.3 Customer involvement
As ERDF serves basically the whole of France they have various initiatives in order to involve their customers: marketing analysis and surveys, round tables with customers, local communication (Street, public markets), free call center for further information
A more specific project on this theme is the partnership between ERDF and Grand Lyon Habitat (2012-2014). The main goals of the experimentation that involves 1000 customers are:
- Size the future customer information system (frequency and rhythms of use) - Adjust the contents of the service and the ergonomics - Work the pedagogy of the service, the media tools - Optimize the individual and collective accompaniment - Prepare the After-Sales Service - Prepare the necessary partnerships of nearness to accompany the handling of the
meter and the service
The NRA - CRE in France has not scheduled yet monitoring of customer satisfaction.
Current status of installation and use of smart metering
The Linky smart metering project has started in 2007 and it is expected to complete the deployment plan by 2020. At the moment the project involves about 300.000 customers, 90% of which are residential. It’s foreseen that in 2020 there will be around 35 million meters installed, that correspond to 100% of the total customer of ERDF. The average contractual power is 6 kVA for customers without electric heating, and 9 kVA for customers with electric heating while the average residential yearly consumption is 2400 kWh for customer with a 6 kVA contractual power and 8500 kWh for customer with a 9kVA contractual power.
Vulnerable customer focus

Work Package: WP2
Type of document: Deliverable
Date: 01/11/113
Energy Theme; Grant Agreement No 308794
Title: ANALYSIS OF SMART-METERING PROJECTS
Version: 2.0 Page: 26 / 118
Project Funded by the European Commission under the 7th Framework Programme
At the moment there is an experimentation running in Social Housing in Lyon, with free web information and customer support - Watt & Moi https://www.watt-et-moi.fr/ .
Currently only some primary results have been processed, the final ones to be available mid 2014.
Opt out focus
As per the responder no problem regarding opting out emerged during the experimental stage of the project where 300 000 meters were deployed in 2011.
3.1.1.4 Other advanced solutions enabled by smart meters
Impact on distribution network operation
ERDF smart metering deployment is expected to have two major impacts on the management of the grid:
- Distributor’s view on the LV network will be considerably increased by getting in “soft real time” information down to the end consumer. It will give to the distributor the ability to automatically detect and pinpoint outage on the LV grid.
- The equipment – hubs, deployed in every secondary substation primarily for the smart metering, will offer a communication channel to remotely access to currently local existing technical data (e.g.: fault detection) at a low marginal price, enabling the distributor to be more reactive in case of MV outage. This communication channel will also convey information from new sensors producing data to improve network calculation and load and voltage management.
This deployment will provide access to accurate and detailed data from the end consumers. Regarding network planning, this data could be split in three categories:
- Useful data to precise / amend inputs of the models (e.g.: discrepancy between database and real individuals grid connection points are automatically detected, individual measured load curves will replace / refine the current load profiles used as a proxy).
- Potential inputs for the models currently not available and therefore ignored (e.g.: nowadays the customer connection phases to the grid are not listed but will be automatically detected by the smart metering system).
- Data currently calculated through the models which will become measurable thanks to smart metering (e.g.: voltage drop at end consumption point).
Those data will create additional value into the network planning process by:
- Decreasing the level of uncertainty of the inputs (cf. above point number 1) and models (more available inputs to feed the models: cf. above point number 2 and direct feedback on the model accuracy –measurement of the gap between calculation and reality allow a better calibration of the models above point number 3) will translate into better informed investment decisions and reduction of the safety margin applied and therefore a better quality for a better price.

Work Package: WP2
Type of document: Deliverable
Date: 01/11/113
Energy Theme; Grant Agreement No 308794
Title: ANALYSIS OF SMART-METERING PROJECTS
Version: 2.0 Page: 27 / 118
Project Funded by the European Commission under the 7th Framework Programme
- Adding new operational processes to solve power quality issues. The use of the knowledge of the real customer connection phase allows balancing the load in-between LV network phases in order to reduce losses and to improve the end users’ power quality. Network maintenance will not benefit directly from ERDF smart metering system, but it will benefit from the information and communication technologies deployed on the grid for this purpose. This new communication channel, available to new sensors (e.g.: temperature transformer), will permit to better monitor the equipment and to move towards condition-based maintenance, in which assets are maintained when required rather than according to fixed schedules.
Regarding technical losses, smart metering, with its phase detection system for single phase consumers, allows a better balancing of the network, and a reduction of losses.
In case of non technical losses:
- The roll-out of smart metering will structurally rejuvenate the fleet of meters and brings new remote control functionalities to improve operational actions to reduce non technical losses (for example in case customers move from one DSO to another)
- All information collected by these new smart meters will contribute to manage losses drift extensions (existing and new sources of non technical losses) by adding new accurate information to existing database and targeting profitable field actions.
Examples:
- increased reliability in data collecting and recording - reduced discrepancies between field power threshold and data bases information - meter cover detection, with real time transmission - a daily basis meter collection, with load shape, allows, thanks to algorithms, a
strong customer consumption analysis
Although there are certain limitations of smart meters regarding quality issues (accuracy of the measure, range of observed events), they will significantly improve the distributor ability to measure, with a customers’ point of view, the quality of supply, namely: disruptions of supply and voltage excursions, especially on LV networks.
This enhanced knowledge of the quality of supply on the grid is the required material to:
- Improve the customer relationship, by offering to the distributor the ability to play again the events at the connection point, and therefore to exchange on the basis of objective data and to quickly get a first sense of the problem and engage the most appropriate actions.
- Detect the structurally weakest areas and prioritize investments thanks to the planning tools, in order to improve and guarantee a good quality of supply.
- Participate to the daily operational management of the LV grid by:

Work Package: WP2
Type of document: Deliverable
Date: 01/11/113
Energy Theme; Grant Agreement No 308794
Title: ANALYSIS OF SMART-METERING PROJECTS
Version: 2.0 Page: 28 / 118
Project Funded by the European Commission under the 7th Framework Programme
Detecting sudden appearances of voltage excursions, which may be a fault or warning signs of a fault
Helping to make better informed decisions in order to offer the best quality of supply when it’s come to choose between different options for a temporary repair.
Core of the EV charging infrastructure
Electric Vehicle charging will be behind connection point (and metering). Therefore, no specific service could be proposed by DNO. On the other hand, generic services to allow innovative tariffs of other demand response services will be enabled – vehicle being a usage as other usages.
ERDF position on G2V is that:
- DNO has to enable G2H (Grid To Home), - Regulated market will enable H2V (Home to Vehicle).
Examples of Vehicle to home services:
- Thanks to radio data transmitter, the meters communicates with in-door applications
- Furthermore, 8 applications can be enslaved to the grid, or to the supplier - Allows peak shaving
Examples of Smart Charging:
- The meter could be installed in charging slots, and deliver the same services Support of Distributed Generation
From an economical point of view, the interest of producers is to sell 100% of the generated electricity. A Linky meter is generally installed for energy consumption, and a second one for electricity generation. The DSO is responsible of the metering (installation, commissioning, maintenance ...).
Capacity of enabling Demand Response
ERDF´s Demand Response foreseen features enabled by the meter are:
- Mobile peak tariffs. 3 calendars available - 8 different applications can be enslaved to the grid (heating system, water boiler,
electric vehicle charging slot…) - Remote reduction of the power threshold - Real time communication between the meter and the connected applications (TIC) - BEMS can be connected in real time to the meter
Work Package: WP2
Type of document: Deliverable
Date: 01/11/113
Energy Theme; Grant Agreement No 308794
Title: ANALYSIS OF SMART-METERING PROJECTS
Version: 2.0 Page: 29 / 118
Project Funded by the European Commission under the 7th Framework Programme
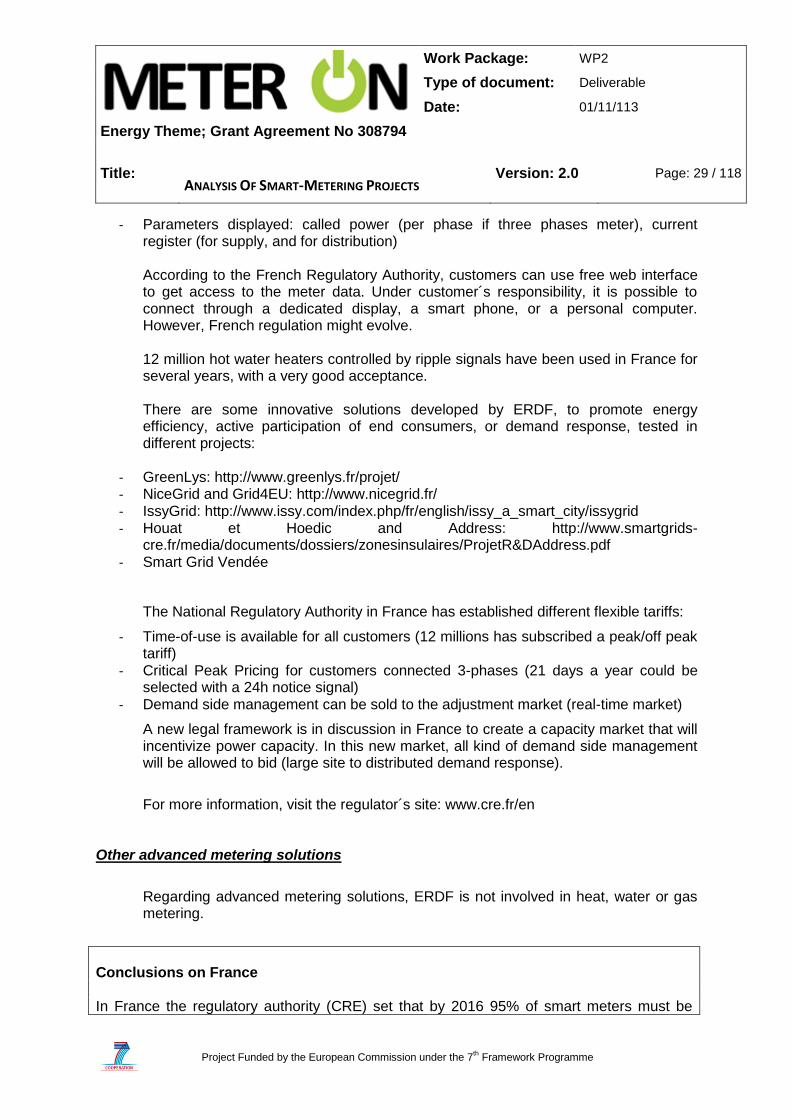
- Parameters displayed: called power (per phase if three phases meter), current register (for supply, and for distribution) According to the French Regulatory Authority, customers can use free web interface to get access to the meter data. Under customer´s responsibility, it is possible to connect through a dedicated display, a smart phone, or a personal computer. However, French regulation might evolve. 12 million hot water heaters controlled by ripple signals have been used in France for several years, with a very good acceptance. There are some innovative solutions developed by ERDF, to promote energy efficiency, active participation of end consumers, or demand response, tested in different projects:
- GreenLys: http://www.greenlys.fr/projet/ - NiceGrid and Grid4EU: http://www.nicegrid.fr/ - IssyGrid: http://www.issy.com/index.php/fr/english/issy_a_smart_city/issygrid - Houat et Hoedic and Address: http://www.smartgrids-
cre.fr/media/documents/dossiers/zonesinsulaires/ProjetR&DAddress.pdf - Smart Grid Vendée
The National Regulatory Authority in France has established different flexible tariffs:
- Time-of-use is available for all customers (12 millions has subscribed a peak/off peak tariff)
- Critical Peak Pricing for customers connected 3-phases (21 days a year could be selected with a 24h notice signal)
- Demand side management can be sold to the adjustment market (real-time market)
A new legal framework is in discussion in France to create a capacity market that will incentivize power capacity. In this new market, all kind of demand side management will be allowed to bid (large site to distributed demand response).
For more information, visit the regulator´s site: www.cre.fr/en
Other advanced metering solutions
Regarding advanced metering solutions, ERDF is not involved in heat, water or gas metering.
Conclusions on France In France the regulatory authority (CRE) set that by 2016 95% of smart meters must be

Work Package: WP2
Type of document: Deliverable
Date: 01/11/113
Energy Theme; Grant Agreement No 308794
Title: ANALYSIS OF SMART-METERING PROJECTS
Version: 2.0 Page: 30 / 118
Project Funded by the European Commission under the 7th Framework Programme
installed. Of these, the majority will be installed by ERDF, that is the most important DSO in France, and is the only one that replied to the questionnaire. At current roll-out stage the used communication protocol is G1-PLC with SFSK modulation, but for the second roll-out stage is planned to use G3-PLC communication protocol with OFDM modulation. The total project budget is financed entirely from public funds. As ERDF serves basically the whole of France they have various initiatives in order to involve their customers such as:
Marketing analysis, surveys
Round table with customers
Local communication (Street, public markets …)
Free call center for further information
ERDF smart metering deployment is expected to have two major impacts on the management of the grid:
Distributor’s view on the LV network will be considerably increased by getting in “soft real time” information down to the end consumer
The equipment – hubs, deployed in every secondary substation primarily for the smart metering, will offer a communication channel to remotely access to currently local existing technical data.

Work Package: WP2
Type of document: Deliverable
Date: 01/11/113
Energy Theme; Grant Agreement No 308794
Title: ANALYSIS OF SMART-METERING PROJECTS
Version: 2.0 Page: 31 / 118
Project Funded by the European Commission under the 7th Framework Programme
3.2 Italy
Regulatory framework and market overview
National Regulation on smart meter
Italy is one of the most experienced countries in Europe when it comes to large scale deployment of smart meters. The roll-out plan was implemented on a voluntary basis, well before the Regulator decided to put in place the legislative framework in 2006 (Enel roll-out program started in 2001). Italy’s practical case shows a mix of regulatory tools used to promote the rollout of smart metering such as mandatory roll-out obligations, financial penalties for non-replacements, clear specification of minimum requirements by the regulator.
In Italy the metering service is performed by DSOs who own the meter and are fully responsible for its installation, maintenance, reading and data management activities. After an extensive public consultation, and a thorough, open dialogue with distribution companies and meter manufacturers as well, the Italian Regulator issued a decision at end of 2006 that introduced mandatory roll-out of smart meters for all DSOs by 2011. In regulating smart metering, the Italian regulatory authority (AEEG) was pursuing four different objectives:
(i) enable competition in electricity supply for LV customers; (ii) exploit the value for customers of the smart metering investments; (iii) give customers a price signal that was aligned with the cost of the electricity; and (iv) gather information for load profiling within the dispatching service. The main features of the regulation of smart metering endorsed by AEEG are:
1. Definition of minimum functional requirements 2. An installation and commissioning timetable for all DSOs organized into four
phases based on the percentage of LV customers with smart meter installed 3. Rules for metering tariffs allowing cost recovery of installations 4. An incentive for DSOs that use their smart meters to record interruptions at
single customer level is set 5. Performance indicators of AMM systems (advanced metering management)
have been introduced
Distributors and customers shares for each distributor A number of 143 DSOs operate the electricity distribution networks in Italy. Enel Distribuzione is the largest distribution system operator, covering 86% of Italy’s electricity demand.
Distributors replying to the questionnaire For this analysis one Italian DSO has replied - Enel Distribuzione.

Work Package: WP2
Type of document: Deliverable
Date: 01/11/113
Energy Theme; Grant Agreement No 308794
Title: ANALYSIS OF SMART-METERING PROJECTS
Version: 2.0 Page: 32 / 118
Project Funded by the European Commission under the 7th Framework Programme
3.2.1 Enel Distribuzione
In the second half of the 90’s Enel Distribuzione, the largest Italian DSO, launched a project, named Telegestore, aimed at building a comprehensive Automated Metering Infrastructure (AMI) for its entire customer base (over 30 million LV customers). The implementation phase started in 2001 and Telegestore is now a system made of 32 million electronic meters, more than 350,000 data concentrators (located in MV/LV substations) and some thousands of meters in selected secondary substations, fully dedicated to energy service applications. As of today, Telegestore is still the frontrunner smart metering application in the international context. The Telegestore system is the result of a voluntary strategic choice of Enel Distribuzione, based on a business case in which different productivity and efficiency aspects were considered. In particular, the main driving force behind the decision to implement Automated Metering Infrastructure by Enel was the improvement of the quality of commercial and technical services, while achieving a reduction of operational costs and losses (both technical and not technical).
Overview of the Power Grid
Yearly energy distributed (TWh) 245.2 TWh
HV,MV and LV voltage levels MV network: 15 and 20 KV
LV: 230 – 400 V
Number of HV/MV substations; Approx. 2000
Number of MV/LV substations; Approx 410.000
Average residential contractual power (KW) 3 kW
Average residential yearly consumption (KWh) 2170 kWh2
3.2.1.1 Technological analysis of the solution deployed
ENEL Distribuzione: AMI Architecture The architecture of the remote meter management system is showed in the following picture
2 Source: AEEG RELAZIONE ANNUALE SULLO STATO DEI SERVIZI E SULL’ATTIVITÀ SVOLTA, 2012

Work Package: WP2
Type of document: Deliverable
Date: 01/11/113
Energy Theme; Grant Agreement No 308794
Title: ANALYSIS OF SMART-METERING PROJECTS
Version: 2.0 Page: 33 / 118
Project Funded by the European Commission under the 7th Framework Programme
Figure 2: Enel Distribuzone AMI
The Remote Management system includes the following set of interconnected devices:
A Central System: for the collection of data and meter management;
The Concentrator: A device installed in the secondary substation that collects all the data from electronic meters (data sink). It manages the communication in both direction: towards the remote metering central system via public telecommunication network and towards the electronic meters via private Distribution Line Carrier powerline communication.
The meter: An integrated device for energy measurement, data communication and supply management;
The remote metering system communicates via the public telecommunication network (GSM/GPRS, PSTN & Satellites) with a LV concentrator installed in every MV/LV substation (see following picture).

Work Package: WP2
Type of document: Deliverable
Date: 01/11/113
Energy Theme; Grant Agreement No 308794
Title: ANALYSIS OF SMART-METERING PROJECTS
Version: 2.0 Page: 34 / 118
Project Funded by the European Commission under the 7th Framework Programme
The main functionalities are:
Storage and Remote Reading: of energy consumption and power imported and exported by the customer, including load profiles for customer clusterization;
Remote Management of contractual parameter variations, multitariff management, maximum allowed power demand management, billing periods, etc;
Remote switch-off of breaker / switch disconnector, integrated into the case of the meter, due to contract termination and enabling to re-connection in case of the activation of a new one;
Collection of data related to quality of service of LV network and monitoring of tampering diagnostics;
Management of “Load shedding” to solve network/secondary substation overloads and power leakages;
Diagnostics management of meters functionalities in order to remotely detect failures or tampering attempts;
Bad-payer management for reduction on non-technical losses; Key factors of this architectural choice can be summarized as follows:
Availability of data transmission link (DLC) at each customer point without requiring any additional physical infrastructure;
Support to the offer of new services to electrical customers;
Distributed intelligence spread all over the field that can be used for future improvement;
Support to synergetic development of multi metering (gas, water, heat) applications.
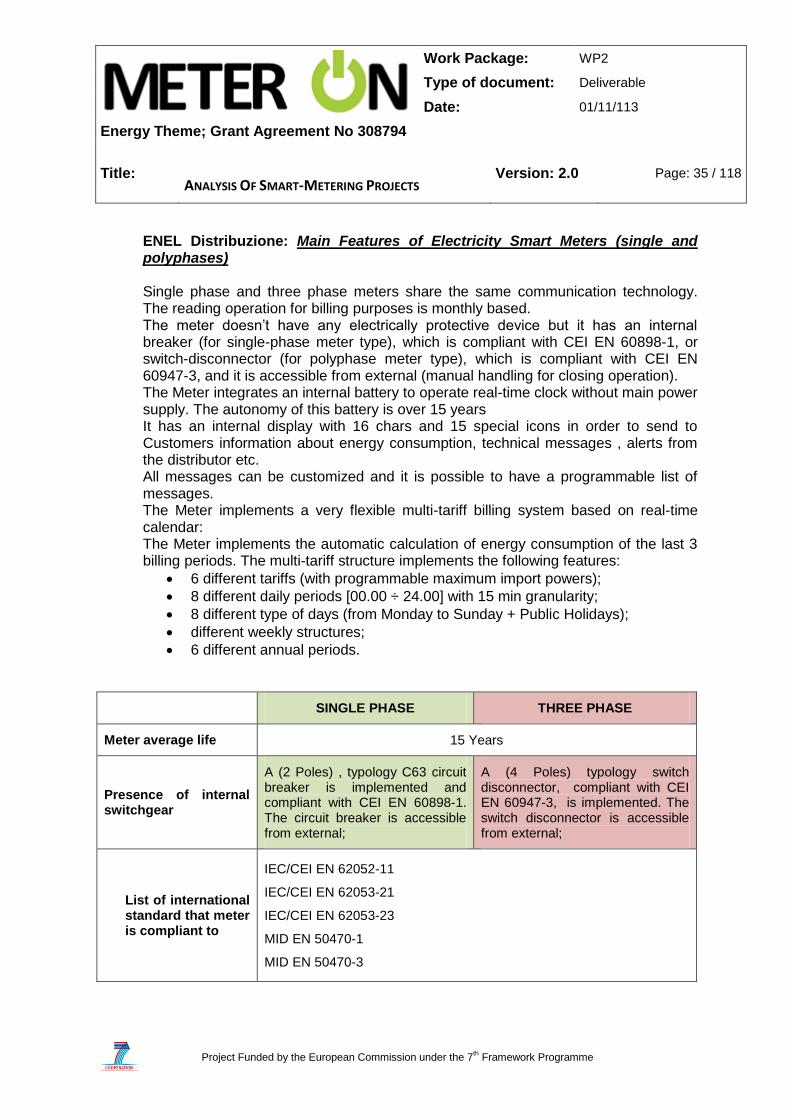
Work Package: WP2
Type of document: Deliverable
Date: 01/11/113
Energy Theme; Grant Agreement No 308794
Title: ANALYSIS OF SMART-METERING PROJECTS
Version: 2.0 Page: 35 / 118
Project Funded by the European Commission under the 7th Framework Programme
ENEL Distribuzione: Main Features of Electricity Smart Meters (single and polyphases) Single phase and three phase meters share the same communication technology. The reading operation for billing purposes is monthly based. The meter doesn’t have any electrically protective device but it has an internal breaker (for single-phase meter type), which is compliant with CEI EN 60898-1, or switch-disconnector (for polyphase meter type), which is compliant with CEI EN 60947-3, and it is accessible from external (manual handling for closing operation). The Meter integrates an internal battery to operate real-time clock without main power supply. The autonomy of this battery is over 15 years It has an internal display with 16 chars and 15 special icons in order to send to Customers information about energy consumption, technical messages , alerts from the distributor etc. All messages can be customized and it is possible to have a programmable list of messages. The Meter implements a very flexible multi-tariff billing system based on real-time calendar: The Meter implements the automatic calculation of energy consumption of the last 3 billing periods. The multi-tariff structure implements the following features:
6 different tariffs (with programmable maximum import powers);
8 different daily periods [00.00 ÷ 24.00] with 15 min granularity;
8 different type of days (from Monday to Sunday + Public Holidays);
different weekly structures;
6 different annual periods.
SINGLE PHASE THREE PHASE
Meter average life 15 Years
Presence of internal switchgear
A (2 Poles) , typology C63 circuit breaker is implemented and compliant with CEI EN 60898-1. The circuit breaker is accessible from external;
A (4 Poles) typology switch disconnector, compliant with CEI EN 60947-3, is implemented. The switch disconnector is accessible from external;
List of international standard that meter is compliant to
IEC/CEI EN 62052-11
IEC/CEI EN 62053-21
IEC/CEI EN 62053-23
MID EN 50470-1
MID EN 50470-3

Work Package: WP2
Type of document: Deliverable
Date: 01/11/113
Energy Theme; Grant Agreement No 308794
Title: ANALYSIS OF SMART-METERING PROJECTS
Version: 2.0 Page: 36 / 118
Project Funded by the European Commission under the 7th Framework Programme
ENEL Distribuzione: Main Functions of Electricity Smart Meters (single and polyphases)
Single phase and three phase meter have identical main functionalities.
SINGLE PHASE THREE PHASE
Frequency for reading Monthly
Active energy measurement
bi-directional
Reactive energy measurement
measured in 4 quadrants
Number of annual tariff programs that can be programmed
The multi-tariff structure implements the following features:
6 different tariffs (with programmable maximum import
powers);
8 different daily periods [00.00 ÷ 24.00] with 15 min
granularity;
8 different type of days (from Monday to Sunday + Public
Holidays);
different weekly structures;
6 different annual periods.
Number of weekly tariff programs that can be programmed for each annual program
Number of daily tariff programs that can be programmed for each weekly tariff programs
Number of daily tariff intervals that can be programmed
Possibility to remotely manage supplying contracts
Yes, the management of the available power is implemented according to following criteria:
An automatic disconnection, performed by an internal circuit breaker/switch disconnector, is activated in the following cases: when positive active power consumption is exceeding the available (contractual) power or when the contract validity period is expired.
Possibility to locally manage supply contracts
Yes by hand-Held Unit through the ZVEI optical port.
Activate/Deactivate the Supply;
Programmed Reduction;

Work Package: WP2
Type of document: Deliverable
Date: 01/11/113
Energy Theme; Grant Agreement No 308794
Title: ANALYSIS OF SMART-METERING PROJECTS
Version: 2.0 Page: 37 / 118
Project Funded by the European Commission under the 7th Framework Programme
Load control support Yes, a “Load shedding” mechanism can be remotely managed to solve network/secondary substation overloads and power leakages
The meter record events in an event lo log
List of monitored parameters
How information can be accessed
The Meters store some information on unauthorized access attempts, parameter changes made, etc.
The timestamp of the last event is recorded
The information can be collected remotely, by means of Data Concentrator, or locally, by means of Hand Held Unit
Record of information about power outages and quality of supply
Yes,
the Meter monitors and logs the following data about voltage interruptions on LV network:
Date, time, length of last interruptions;
Number and length of short, long and transient voltage
interruptions;
Set of data for current and previous billing period
Furthermore the meter monitors and logs the following data about voltage variations on LV network according to IEC/CEI EN 50160:
number of average voltage samples within and outside a
programmable range;
maximum and minimum average voltage;
set of data for current and previous monitoring periods
(commonly 7 days period);
Presence of demand management feature implemented
No
Presence of prepayment management implemented
Yes, Prepayment parameters and credits can be managed by the Central System.
If the maximum debit is reached the energy supply is disconnected; the meter provides the Customer with warnings when the credit is below a programmable threshold.
The Operator can define days in which the disconnetion for debit limit is not active (e.g. Sunday)
Local interfaces The Meter is equipped by a CLC EN 50065-1 compliant DLC

Work Package: WP2
Type of document: Deliverable
Date: 01/11/113
Energy Theme; Grant Agreement No 308794
Title: ANALYSIS OF SMART-METERING PROJECTS
Version: 2.0 Page: 38 / 118
Project Funded by the European Commission under the 7th Framework Programme
modem
The Meter integrates an optical communication interface compliant with IEC/CEI EN 62056-21 Mode C
Possibility to remotely download firmware
Yes
3.2.1.2 Economic analysis of the solution deployed
Costs & Benefits
Cost Category Detailed Cost Actor
Incurring Cost
%
In premise cost
Meters (€) DSO
95%
Installation of Meters (€) DSO
Field devices costs
Data collectors (€) DSO
95%
Installation of data collectors (€) DSO
Subtotal
95%
Other Costs Optional
IT system development, R&D costs and other expenses DSO 5%
Additional opex for Personnel, TLC and IT systems DSO /
Subtotal
5%
Total
100%
The first aim of the analysis is to simplify data regarding main costs and benefits coming from the questionnaire. Considering the structure of the questionnaire’s section dedicated to costs and benefits, we aim at resuming results using a classification of costs and benefits consistently with their nature; M€/year or M€ without changing totals, in an effort to provide unbiased information. The mentioned macro categories, yearly (M€/year) and unit of money (M€), frequently coincide with opex and capex; however some exceptions may occur.

Work Package: WP2
Type of document: Deliverable
Date: 01/11/113
Energy Theme; Grant Agreement No 308794
Title: ANALYSIS OF SMART-METERING PROJECTS
Version: 2.0 Page: 39 / 118
Project Funded by the European Commission under the 7th Framework Programme
In premise cost and field devices costs put together make 95% and are associated with the production and installation of smart meters and concentrators. No comparison with other cases is possible because two categories, in premise and in field costs, are merged. Other costs, namely: IT system development, R&D costs and other expenses cover the remaining 5% of costs.
Assessment of benefits and identification of beneficiaries require forward-looking statements. In this descriptive summary we classify benefits according to beneficiary’s category and, consistently with the costs section, M€/year against M€.
About total yearly benefits, no reliable information is available to monetize consumer benefits; on this basis benefits are divided into (i) business which accounts for 75% and (ii) country-wide in terms of global CO2 reduction - Ton CO2 and € if applicable. A remarkable share i.e. 25% is dedicated to other benefits such as logistics and purchasing (15%) and customer service (10%).
However, also due to the M€/year savings, considering the average tariff (taking 2012 in comparison to tariff prices as in 1996) the share related to the network operations remunerated in the tariff is observed to have dropped dramatically for the customer(-47%).
Furthermore, the entire energy value chain seems to have enjoyed significant benefits :
Reduction of technical and commercial losses;
Transparency and operational efficiency in customer relationship management as well as savings in billing;
Introduction of Time of Use tariffs influencing consumption behavior;
Support to market liberalization, where 3 million switching operations have been performed only in 2012.
Benefit Category Detailed Benefit Beneficiary %
Business Benefits
Reduction of meter reading and operations cost (reading, billing, customer care) (€/year)
DSO 35%
Reduction in commercial losses (thefts, frauds, …) (€/year)
n.a. 40%
Subtotal
75,00%
Other Benefits
Logistics and purchasing DSO 15%
Customer Services DSO 10%
Subtotal
25,00%
Total
100%

Work Package: WP2
Type of document: Deliverable
Date: 01/11/113
Energy Theme; Grant Agreement No 308794
Title: ANALYSIS OF SMART-METERING PROJECTS
Version: 2.0 Page: 40 / 118
Project Funded by the European Commission under the 7th Framework Programme
Supply Chain
SC of the Project in Progress (roll-out already completed):
SC MACRO TIER
RESPONDENT SUPPLIERS BELONGING
TO THE GROUP OTHER
SUPPLIERS COST PER
UNIT
Manufacturing X X
Logistics X
Installation X
Maintenance X
Data Comm. X
Data Management
X
The project is being deployed by means of a relevant Supply Chain (SC) vertical integration. Among the 6 main necessary macro-tiers (Manufacturing and assembly, Logistics, Installation, Maintenance, Data Communication, Data Management), 3 out of 6 (Logistics, Maintenance, Data Management) are performed internally. As for the other macro-tiers (Manufacturing and assembly, Installation, Data Communication), they are performed from suppliers not belonging to the group. ENEL Distribuzione (3 out of 3, Manufacturing, Installation, Data Communication) designs the smart meters and sub-contracts the manufacturing to Contract Electronic Manufacturers, that implements the production process according to ENEL’s requirements, (in the case of Manufacturing multiple suppliers also supplying competitors; in the case of Data Communication single supplier) not belonging to the group. As far as it concerns the Buyer-Supplier Relationships (BSR) currently in place, the ones in place for Manufacturing are short-term ones. As far as costs related to each macro-tier within the project in progress are concerned, no information is provided.
3.2.1.3 Customer involvement
ENEL Distribuzione: Current status of installation and use of smart metering in Italy
Following AEEG’s mandatory obligations on the installation of smart metering, all distribution companies started their own substitution projects and most customers (also those located outside Enel’s licensed areas) are now equipped with smart meters. According to the data provided by DSOs to AEEG the status of installation and commissioning appears to be respected.

Work Package: WP2
Type of document: Deliverable
Date: 01/11/113
Energy Theme; Grant Agreement No 308794
Title: ANALYSIS OF SMART-METERING PROJECTS
Version: 2.0 Page: 41 / 118
Project Funded by the European Commission under the 7th Framework Programme
In 2011 in Italy, over 30 million customers benefit from smart metering and AMM systems performing the following “daily” functions:
• Supply activation/deactivation • Monthly/bimonthly readings (-> billings and other purposes)) • Change of the contractual power • Reduction of the contractual power (bad payers) • Disconnection / reconnection (bad payers) • Switching
This implies, for example that, thanks to smart meter capabilities, non-paying household customer have now the right to be served with a vital minimum power equal to 0,5 kW for 10 days before being totally disconnected; as for the market, smart meters allow an exact spot reading in case of supplier switching at low cost as this reading is managed remotely with no need of crew in place.
In terms of exploiting the value of the smart metering system, the most courageous regulatory decision adopted in Italy was the mandatory introduction of a Time-of-Use (ToU) electricity price for all LV customers (in fact, to those who are served in the “universal supply regime”, i.e., household and small business customers who have not yet switched to a different retailer). This requirement has been put in place since July, 1st 2010, will by fully phased-in by end-2011, and probably represents the largest experiment in the world of time-of-use pricing. The aim of the initiative is for small users to be exposed to cost-reflective prices, as to provide them with information on the economic value of the choices they make about electricity use. Clearly, the initiative is expected to indirectly influence also manufacturers of electrical appliances, in particular those producing high-consumption goods.
Customer initiatives At the beginning of 2008 Enel carried out a large market test involving thousands of customers in more than 50 cities, building up a high representative cluster of the Italian market. In order to guarantee unconditioned test results, Enel outsourced the management of this market test to a market research institute particularly experienced in the identification of representative panels in the Italian market. This third party designed and run the market test according to Enel requirements and analyzed the final customer feedbacks. In the market test customers were provided with a device similar to the Smart Info connected to a display. This market test was designed to: - Verify the energy services customer acceptance - Evaluate the impacts on the customer energy behaviours - Test in field the technical solutions and the operative procedures.
According to Enel Distribuzione the feedback analysis demonstrated that: - The display has a strong appeal on the customers which asked for more specific and
personalized services - The service has impact on the energy customer behaviours. Better results can be
achieved integrating metering data with information additional sources.

Work Package: WP2
Type of document: Deliverable
Date: 01/11/113
Energy Theme; Grant Agreement No 308794
Title: ANALYSIS OF SMART-METERING PROJECTS
Version: 2.0 Page: 42 / 118
Project Funded by the European Commission under the 7th Framework Programme
- These services are technically feasible integrated in an infrastructure fully operational over the whole grid.
ENEL Distribuzione: Vulnerable customer focus
In all the countries in which Enel Group operates, there are forms of support (often linked to government initiatives) to favor some sectors of the population in meeting electricity and gas costs, so as to allow equal access to energy.
Enel Group companies contribute financially for vulnerable customers, in accordance with the law, and offer services that are free of charge (such as meter and electricity-system checks) or which offer extendible payment terms (such as installations).
Moreover, In case of bad payers, the customer is not completely cut off, but the available
power is reduced to 15% of the contractual amount. This allows essential services (lighting,
refrigeration) to be maintained until the arrears are paid.
ENEL Distribuzione: Opt out focus
As the smart meter is property of the DSO, there is no possibility to opt out.
3.2.1.4 Other advanced solutions enabled by smart meters
Impact on distribution network operation Enel Distribution Management System supports operators and technicians in the evaluation of electrical behaviour of the network, providing very fast and effective tools. In order to maintain data consistency with the real network, load description data need to be uploaded. The Smart Metering system impacts directly in this issue. Based on real data stored in the meters, a set of load curves is calculated representing different clusters of customers (residential, industrial, etc.). As a result, load curves of each MV/LV transformer are calculated based on the number and typology of customers connected downstream.
Regarding the impact on technical and non-technical losses, a remarkable energy recovery turned out in the first phase of the massive deployment, due to:
- Replacement of worn-out meters: some meters turned out to work correctly no longer and measured a lower than real consumption
- Wrong database records (i.e. Current transformer rates incorrectly reported) - Detection of irregular and tampered installations: frauds and thefts - Easy accessibility to the meters data: elimination of long dated consumption
estimations
In 2006, the yearly energy recovered had been 1.5 TWh (around 0.75% of the overall energy distributed in Italy). The impact on quality of supply is also remarkable. The development of the AMM system, as well as remote control and automation of more than 100.000 MV/LV

Work Package: WP2
Type of document: Deliverable
Date: 01/11/113
Energy Theme; Grant Agreement No 308794
Title: ANALYSIS OF SMART-METERING PROJECTS
Version: 2.0 Page: 43 / 118
Project Funded by the European Commission under the 7th Framework Programme
substations, Work Force Management system and the optimization of asset management lead to a drastic cost per customer reduction and an improved quality of service.
Core of the EV charging infrastructure Enel solution enables the diffusion and the use of electric vehicles, with state of the art recharging technologies, thanks to ad-hoc development of recharging infrastructure, which includes the following features:
- Availability in all private and public areas where end users traditionally park their vehicles
- Safe and user-friendly charging points - A variety of secure payment procedures - Compliance with current free energy market regulations, allowing customers access
to the energy plans provided by their energy suppliers The charging points leverage on Enel’s technology, including the Enel smart meter as a kernel which provides all certified metering and data acquisition functionalities, as well as guaranteeing final customer billing management. Other functionalities implemented to fulfill the new infrastructure requirements will be supported by an additional electronic board which support all EV recharging processes, including data communication with the EV using power line carrier technology, and manage data communication with the central clearinghouse. Enel has developed two different charging stations in order to satisfy customer needs for recharging: a street pole, to charge in public spaces, and the Wall Box, a custom solution to charge at home. The Enel solution for electric mobility includes the following Smart Grid functionalities:
- Smart grid integration of the charging systems allows flexibility of the charging according to the energy availability, storage of eventual energy overproduction and voltage control assuring the quality of service
- Open platform grid infrastructure for EV recharge purposes accessible to all market players and customers
- Development of customer identification technologies and communication between vehicle and electricity network
- Enabling new advanced services to manage the billing and recharge process - Charging of Electric vehicles with RECS certified energy (Renewable Energy
Certificate System) Enel Distribuzione promotes the “DSO business model”, in which the DSO is responsible for EV charging infrastructure deployed for public/private use as a grid extension, providing points of recharging (PoR) with embedded smart-metering and communication systems, enabling the marketplace services.

Work Package: WP2
Type of document: Deliverable
Date: 01/11/113
Energy Theme; Grant Agreement No 308794
Title: ANALYSIS OF SMART-METERING PROJECTS
Version: 2.0 Page: 44 / 118
Project Funded by the European Commission under the 7th Framework Programme
The DSO, in addition to the usual services (such as grid access, metering services), provides and maintains the recharging infrastructures, and enables smart grids functionalities through them and ICT middleware, establishing a connection between the EV point of recharging (PoR) and the energy marketplace. Support of Distributed Generation
Electricity generated by a consumer/producer in an eligible on-site plant and injected into the grid can be used to offset the electricity withdrawn from the grid.
Renewable electricity generators are equipped with one or two meters, the first one to determine the electricity generation which qualifies for feed-in rates, and the second one to determine usage (net-metering) and grid-delivery compensation.
In case of pure producers, a bidirectional meter is installed at customer premise.
Capacity of enabling Demand Response Enel´s Demand Response foreseen features enabled by the meter are:
- Breaker and demand control algorithm on board - Remote reduction of the available power until disconnection - Display on board - Interval metering for customers with available power of more than 55 kW - Time of Use tariffs applied to customers with power less than 55kW (peak/off-
peak/midlevel)
The fully deployed smart metering system has opened the way for the development of innovative solutions to promote energy efficiency, increase the consumers’ consumption awareness and optimize consumption behaviours.

Work Package: WP2
Type of document: Deliverable
Date: 01/11/113
Energy Theme; Grant Agreement No 308794
Title: ANALYSIS OF SMART-METERING PROJECTS
Version: 2.0 Page: 45 / 118
Project Funded by the European Commission under the 7th Framework Programme
By a full exploitation of the potential of a consolidated smart metering infrastructure, Enel has developed a new generation of solutions aimed to establish a direct link between the utility and the customers. Smart Info® provides an easier access to the information collected from the meter to customers. This device uses a standard and open communication protocol to transmit the consumption information collected from the meter inside the residential network. This information shall enable clients to be aware of their usage of electricity, allowing them to take actions in order to pursuit a more efficient and sustainable energy use. The Smart Info® shall also play the role of a key element for the development of a domestic network, where the home appliances will be able to communicate among each other and with automatic load control systems.
Enel Info+ trial has been carrying out in Italy by Enel distribuzione from December 2012 to December 2014. The Trial is part of the “Isernia Project”, a project financed by the AEEG (“Autorità per l’Energia Elettrica e il Gas”) that foresees the installation of a model of smart grid on the grid connected to the Primary substation of Carpinone (a little town in the Isernia district).
The scope of the project is to demonstrate whether giving to end users a feedback on their energy consumption can address more efficient energy behaviours.
A group of residential consumers (whereof 100 prosumers) will be involved in the project, providing them with the Smart Info® device and several interfaces:
- Smart Info® Manager: which provides information on current, historical, tendency
consumption, tariff time bands notification, power limits alarms, contractual data visualization, messages from System Operator;
- Smart Info® Display: which provides a detailed analysis of load profile, comparisons in time and energy efficiency suggestions;
- Smart Info® Mobile, which provides customers with access to all the information mentioned above.
"Prosumers", are receiving an additional Enel smart info in order to manage both production and consumption metering data. Enel is actively working on other several European demand response projects:
1. ADDRESS (2007-2013): a large-scale Integrated Project co-founded by the European Commission under the 7th Framework Programme. The goal of the project is to enable Active Demand: the active participation of small and commercial consumers in power system markets and provision of services to the different power system participants. ADDRESS develops technical solutions both at the consumers’ premises and at the power system level, to enable active demand and to allow real-time response to requests from other power system participants. This also implies the identification of possible barriers against active demand deployment and proposing solutions to remove these barriers. In particular, a scalable and open communication architecture makes it possible to deal in real time

Work Package: WP2
Type of document: Deliverable
Date: 01/11/113
Energy Theme; Grant Agreement No 308794
Title: ANALYSIS OF SMART-METERING PROJECTS
Version: 2.0 Page: 46 / 118
Project Funded by the European Commission under the 7th Framework Programme
with large numbers of consumers. ADDRESS also deals with regulatory, economic, societal and cultural aspects. Web Link: http://www.addressfp7.org/
2. Energy@Home: Enel started, together with Electrolux, Indesit and Telecom Italia, the Energy@home collaborative project. The aim of the project is to develop a communication infrastructure that enables provision of Value Added Services based upon information exchange related to energy usage, energy consumption and energy tariffs in the Home Area Network (HAN). Web Link: http://www.energy-home.it/SitePages/Home.aspx
3. ADVANCED (Active Demand Value ANd Consumers Experiences Discovery): its objective is the development of an actionable plan to implement active demand in Europe leveraging on data and conclusions generated within current demonstration projects and further active demand initiatives in Europe. For this purpose, a holistic approach to empower residential, commercial and industrial consumers to actively manage their energy consumption will be designed. The approach will be based on the evidence of socio-economic insights into consumer’s behavior linking them with the active demand facilitating technologies. In addition, the opportunities of active demand for the relevant stakeholders will be evaluated.
The Italian Regulatory Authority (AEEG) has carried out some initial activities to promote demand response:
- ARG/elt 22/10: Mandatory ToU 2-bands tariff (peak/midlevel+offpeak) progressively enforced from mid-2010 to all household customers in the universal supply market (ab. 24 million)
- In 2010 AEEG issued a competitive procedure (Resolution 39/10) in order to select innovative smart grid pilot projects. The investment costs of selected projects are recovered in the RAB with an additional remuneration (+ 2% in the WACC). Enel’s Isernia smart grids project has been selected and recognized as the most innovative project in this framework
- In the consultation document (DCO 34/11) AEEG evaluated the opportunity to promote the large scale deployment of demand response devices
Other advanced metering solutions Enel Distribuzione is currently working on a solution for smart gas metering with advanced functionalities taking the opportunities of the solution already deployed in Italy in the electricity sector. Alongside the benefits of smart metering, such as more accurate billing, monitoring and control and energy savings, the availability of an already experienced infrastructure raises important opportunities for high operational efficiency, optimized efforts and benefits. In fact, leveraging on the synergies with the electricity metering infrastructure and the expertise acquired by Enel Distribuzione in the electricity sector, gas smart metering would benefit a
Work Package: WP2
Type of document: Deliverable
Date: 01/11/113
Energy Theme; Grant Agreement No 308794
Title: ANALYSIS OF SMART-METERING PROJECTS
Version: 2.0 Page: 47 / 118
Project Funded by the European Commission under the 7th Framework Programme
lower economic impact while optimizing investments, would face a lower technological risk, given also the availability of specific know-how, while additionally lowering the time to market. In 2008, the National Regulatory Authority published a technical report, which included a summary of the costs and benefits of implementation of gas meters remote management / remote reading. Only the Italian version of the technical report is available: http://www.autorita.energia.it/allegati/docs/08/155-08argrt.pdf
AEEG Resolution 155/08 establishes a minimum set of functional requirements, common to all gas metering units concerning:
- Metering units’ clock/calendar - Temperature adjustment - Withdrawal totalizer register - Time of use withdrawal totalizer registers - Withdrawal curve (interval metering). - Saves and backups of withdrawal totalizer register; - Withdrawal data security - Diagnostics; - Display - Up-dating of the metering unit software program - Remote transactions
Additional minimum functionalities have been set up for meters with minimum nominal flow rate of 10m3/h (Class > G10):
- Pressure adjustment - Maximum monthly drift of the clock/calendar - Withdrawal curve time base
Additional minimum functionalities have been set up for meters with maximum nominal flow rate of 10m3/h (Class < G10):
- Maximum monthly drift of the clock/calendar - Withdrawal curve time base - Electrovalve - Remote transactions
Further minimum functional requirements are set for:
- Data concentrator: it shall be equipped with mechanisms to protect and monitor the withdrawal data originating from the metering units linked to it for onwards transmission to the remote management centre.
- Remote management centre: it shall be equipped with mechanisms to protect and monitor the data originating from the metering units and data concentrators linked to it.
AEEG Resolution 193/2012/R/GAS defined a deadline for:

Work Package: WP2
Type of document: Deliverable
Date: 01/11/113
Energy Theme; Grant Agreement No 308794
Title: ANALYSIS OF SMART-METERING PROJECTS
Version: 2.0 Page: 48 / 118
Project Funded by the European Commission under the 7th Framework Programme
- The provision of smart gas meters to the 60% of redelivery points existing at 31 December 2018
- Replacement of 100% of gas meters with certification life time expired to 31 December 2018 with smart gas meters
Conclusions on Italy In Italy, the regulatory authority was anticipated by ENEL, the most important DSO in Italy and the only one that replied to the questionnaire. ENEL started the roll-out of its smart metering project before the authority set the deadline to do this. The available contractual power is 3kW, and the average yearly consumption is about 2170kWh. The total project budget is € 2100M financed entirely by ENEL. ENEL has done several initiatives in order to involve their customers, such as:
Survey to know the acceptance of the service
Assessment of the impact on the energy behavior of customers
Field test of the operative procedures
With the deployment of the smart metering infrastructure, in Italy hourly pricing methods (Time-Of-Use tariff).have been introduced.
Moreover, ENEL is also working on the possibility to introduce Gas smart metering solutions exploiting the existing fully deployed electricity smart metering infrastructure.
3.3 Romania
Regulatory framework and market overview
National Regulation on smart meter
On July 1, 2007, Romania introduced European unbundling principles for electricity companies. As a result, separate companies were created for the management of the distribution grid and the sale of electricity, with separate administrative, accounting and management arrangements.
The market at the moment has one TSO CN Transelectrica SA, one power market operator SC OPCOM SA, eight regional DSOs and around 100 licensed electricity producers (licensed by ANRE – Romanian Energy Regulatory Authority).
According to the Romanian DSOs, currently there are 8.06 million electricity customers in the entire country. In Romania the residential consumers completely dominate – they constitute 99% of all electricity customers. The share of non-residential consumers (such as industry and SMEs) is 1%.
In Romania legislation regarding the implementation of smart metering has not been adopted yet, but on September 3rd 2012 the official cost-benefit analysis (CBA) on

Work Package: WP2
Type of document: Deliverable
Date: 01/11/113
Energy Theme; Grant Agreement No 308794
Title: ANALYSIS OF SMART-METERING PROJECTS
Version: 2.0 Page: 49 / 118
Project Funded by the European Commission under the 7th Framework Programme
smart metering roll-out, as required by Directive 2009/72/EC, has been carried out and it concludes in a positive manner. In November 2010 a Smart Metering roadmap was approved as a part of “Action Plan for implementation in the national power system of the Smart Grid concept”, but until now it has not been followed precisely.
The infrastructure of the distribution system is inefficient – as much as 13% of energy input is lost (in 2010 the network losses amounted to 7 058 GWh), whereas the average network losses in the entire EU amount to 6% of total electricity input.
Distributors and customers shares for each distributor
There are four distribution system operators in Romania:
- Electrica S.A. – with 37% market share (3 million customers) – fully state owned
- Enel – with 32% market share (2.6 million customers) – private majority owned
- CEZ – with 17% market share (1.4 million customers) – private majority owned
- E.ON – with 14% market share (1.1 million customers) – private majority owned.
Distributors replying to the questionnaire
There are 3 Enel DSO – Muntenia / Banat / Dobrogea and 2 Sales companies: Enel Energie / Enel Energie Muntenia.
On behalf of Enel one DSO has replied – Enel Muntenia.
3.3.1 Enel Distributie Muntenia
The Enel Muntenia smart meter project has started in 01/02/2009 and it’s finished in 30/06/2009. It involves 864 customers, 93% of which are residential, that correspond at 100% of the total customer of Enel Muntenia. The average contractual power is 6 kVA while the average residential yearly consumption is 1400 kWh.
It must be specified that the Enel Smart Meters have been installed in a central and compact area of Bucharest (capital of Romania) with the main purpose to test Enel Smart Meters functionalities and AMM system.
In case of roll-out it’s foreseen that 2.6 million smart meters will be installed between 2013 and 2022 of which 80% until 2020.

Work Package: WP2
Type of document: Deliverable
Date: 01/11/113
Energy Theme; Grant Agreement No 308794
Title: ANALYSIS OF SMART-METERING PROJECTS
Version: 2.0 Page: 50 / 118
Project Funded by the European Commission under the 7th Framework Programme
Overview of the Power Grid
Yearly energy distributed (TWh) 16.7 TWh
HV,MV and LV voltage levels
HV: 220/110 kV
MV: 20/10 kV
LV: 400/220 V
Number of HV/MV substations; 279
Number of MV/LV substations; 20.597
Average residential contractual power (KW) 6 kW
Average residential yearly consumption (KWh) 1400 kWh
3.3.1.1 Technological analysis of the solution deployed
Enel Distributie Muntenia: AMI Architecture The architecture of the remote meter management system is showed in the following picture
Figure 3: Enel Distribuzone AMI
The Remote Management system includes the following set of interconnected devices:
A Central System: for the collection of data and meter management;
The Concentrator: A device installed in the secondary substation that collects all the data from electronic meters (data sink). It manages the communication in both directions: towards the remote metering central system via public

Work Package: WP2
Type of document: Deliverable
Date: 01/11/113
Energy Theme; Grant Agreement No 308794
Title: ANALYSIS OF SMART-METERING PROJECTS
Version: 2.0 Page: 51 / 118
Project Funded by the European Commission under the 7th Framework Programme
telecommunication network and towards the electronic meters via private Distribution Line Carrier powerline communication.
The meter: An integrated device for energy measurement, data communication and management;
The remote metering system communicates via the public telecommunication network (GSM, PSTN & Satellites) with a LV concentrator installed in every MV/LV substation (see following picture).
The main functionalities are:
Storage and Remote Reading: of energy consumption and power imported and exported by the customer
Remote Management of contractual parameter variations, multitariff management, maximum allowed power demand management, billing periods, etc
Remote switch-off of breaker / switch disconnector, integrated into the case of the meter, due to contract termination and enabling to re-connection in case of the activation of a new one;

Work Package: WP2
Type of document: Deliverable
Date: 01/11/113
Energy Theme; Grant Agreement No 308794
Title: ANALYSIS OF SMART-METERING PROJECTS
Version: 2.0 Page: 52 / 118
Project Funded by the European Commission under the 7th Framework Programme
Collection of data related to quality of service of LV network and monitoring of tampering diagnostics;
Management of “Load shedding” to solve network/secondary substation overloads and power leakages;
Key factors of this architectural choice can be summarized as follows:
Availability of data transmission link (DLC) at each customer point without requiring any additional physical infrastructure;
Support to the offer of new services to electrical customers;
Support to synergetic development of multi metering (gas, water, heat) applications.
Enel Distributie Muntenia: Main Features of Electricity Smart Meters (single and three phases) Single phase and three phase meter share the same communication technology. The reading operation is monthly based. The meter doesn’t have any electrically protective device but it has an internal breaker which is compliant with CEI EN 60947 and it is accessible from external. The Meter integrates an internal battery to operate real-time clock without main power supply. The autonomy of this battery is over 15 years It has an internal display with 16 chars and 15 special icons in order to send to Customers information about energy consumption, technical messages , alerts from the distributor etc. All messages can be customized and it is possible to have a programmable list of messages. The Meter implements a very flexible multi-tariff billing system based on real-time calendar: The Meter implements the automatic calculation of energy consumption of the last 3 billing periods. The multi-tariff structure implements the following features:
6 different tariffs (with programmable maximum import powers);
8 different daily periods [00.00 ÷ 24.00] with 15 min granularity;
8 different type of days (from Monday to Sunday + Public Holidays);
different weekly structures;
6 different annual periods.
SINGLE PHASE THREE PHASE
Meter average life 15 Years
Presence of internal switchgear
A (2 Poles) , typology C63 circuit breaker is implemented and compliant with CEI EN 60947. The circuit breaker is accessible from external;
A (4 Poles) typology C63 circuit breaker, compliant with CEI EN 60947, is implemented. The circuit breaker is accessible from external;

Work Package: WP2
Type of document: Deliverable
Date: 01/11/113
Energy Theme; Grant Agreement No 308794
Title: ANALYSIS OF SMART-METERING PROJECTS
Version: 2.0 Page: 53 / 118
Project Funded by the European Commission under the 7th Framework Programme
List of international standard that meter is compliant to
IEC/CEI EN 62052-11
EN 62053-21
IEC/CEI EN 62053-23
MID EN 50470-1
MID EN 50470-3
Enel Distributie Muntenia: Main Functions of Electricity Smart Meters (single and three phases) Single phase and three phase meter has identical main functionalities.
SINGLE PHASE THREE PHASE
Frequency for reading Monthly
Active energy measurement
bi-directional
Reactive energy measurement
detected in 4 quadrants
Number of annual tariff programs that can be programmed
The multi-tariff structure implements the following features:
6 different tariffs (with programmable maximum import
powers);
8 different daily periods [00.00 ÷ 24.00] with 15 min
granularity;
8 different type of days (from Monday to Sunday + Public
Holidays);
different weekly structures;
6 different annual periods.
Number of weekly tariff programs that can be programmed for each annual program
Number of daily tariff programs that can be programmed for each weekly tariff programs
Number of daily tariff intervals that can be programmed
Possibility to remotely manage supplying contracts
Yes, the management of the available power is implemented according to following criteria:
An automatic disconnection, performed by an external circuit breaker, is activated in the following cases: when positive active power consumption is exceeding the available (contractual) power

Work Package: WP2
Type of document: Deliverable
Date: 01/11/113
Energy Theme; Grant Agreement No 308794
Title: ANALYSIS OF SMART-METERING PROJECTS
Version: 2.0 Page: 54 / 118
Project Funded by the European Commission under the 7th Framework Programme
or when the contract validity period is expired.
Possibility to locally manage supply contracts
Yes by hand-Held Unit through the ZVEI optical port.
Activate/Deactivate the Supply;
Programmed Reduction;
Load control support Yes, a “Load shedding” mechanism can be remotely managed to solve network/secondary substation overloads and power leakages
The meter record events in an event lo log
List of monitored parameters
How information can be accessed
The Meters store some information on unauthorized access attempts , parameter changes made, etc.
The timestamp of the last event is recorded
Record of information about power outages and quality of supply
Yes,
the Meter monitors and logs the following data about voltage interruptions on LV network:
Date, time, length of last 10 interruptions;
Number and length of short, long and transient voltage
interruptions;
Set of data for current and previous billing period
Furthermore the meter monitors and logs the following data about voltage variations on LV network according to IEC/CEI EN 50160:
number of average voltage samples within and outside a
programmable range;
maximum and minimum average voltage;
set of data for current and previous billing periods
Presence of demand management feature implemented
No
Presence prepayment management implemented
Yes, Prepayment parameters and credits can be managed by the Central System.
If the maximum debit is reached the energy supply is disconnected

Work Package: WP2
Type of document: Deliverable
Date: 01/11/113
Energy Theme; Grant Agreement No 308794
Title: ANALYSIS OF SMART-METERING PROJECTS
Version: 2.0 Page: 55 / 118
Project Funded by the European Commission under the 7th Framework Programme
; the meter provides the Customer with warnings when the credit is below a programmable threshold.
The Operator can define days in which the disconnetion for debit limit is not active (e.g. Sunday)
Local interfaces
The Meter is equipped by a DLC modem with the following characteristics:
CLC EN 50065-1 (FSK, 2400baud, Band A) and the Meter integrates an optical communication interface compliant with IEC/CEI EN 62056-21 Mode C
Possibility to remotely download firmware
Yes
3.3.1.2 Economic analysis of the solution deployed
Costs & Benefits

Work Package: WP2
Type of document: Deliverable
Date: 01/11/113
Energy Theme; Grant Agreement No 308794
Title: ANALYSIS OF SMART-METERING PROJECTS
Version: 2.0 Page: 56 / 118
Project Funded by the European Commission under the 7th Framework Programme
Cost Category Detailed Cost Actor
Incurring Cost
%
In premise cost
Meters (€) DSO 45,23%
Installation of Meters (€) DSO 39,10%
Subtotal
84,32%
Field devices costs
Data collectors (€) DSO 2,41%
Installation of data collectors (€) DSO 0,23%
Subtotal
2,64%
Data communication infrastructure
Capex (€) DSO 8,43%
Subtotal
8,43%
Other costs Stranding costs (costs incurred when a meter is taken out of service before the end of its expected economic life) (€)
DSO 4,60%
Subtotal
4,60%
Total
100%
The first aim of the analysis is to simplify data regarding main costs and benefits coming from the questionnaire. Considering the structure of the questionnaire’s section dedicated to costs and benefits, we aim at resuming results using a classification of costs and benefits consistently with their nature; M€/year or M€ without changing totals, in an effort to provide unbiased information. The mentioned macro categories, yearly (M€/year) and unit of money (M€), are mostly allocable to opex and capex; however some exceptions may occur. In premise cost covers 84,32% of total costs (M€), this share is slightly above the average of all presented cases which is 80%. The percentage of field devices costs is 2,64%, whilst data communication infrastructure represents 8,43%, other costs amount to 4,60%.

Work Package: WP2
Type of document: Deliverable
Date: 01/11/113
Energy Theme; Grant Agreement No 308794
Title: ANALYSIS OF SMART-METERING PROJECTS
Version: 2.0 Page: 57 / 118
Project Funded by the European Commission under the 7th Framework Programme
Cost Category Detailed Cost Actor
Incurring Cost
%
Data communication infrastructure
Opex (€/year) DSO 61,29%
Other costs Pavement reading inefficiency (€/year annual average) DSO 38,71%
Total
100%
Provided that detailed values are available in the corresponding table, one may note that data communication costs are around 61,29% M€/year (among the highest for which data are available), other costs sum to 38,71%, no information is available for in premise cost and field device costs.
Benefit Category Detailed Benefit Beneficiary %
Consumer Benefits Energy Savings (€/year) (Calculated for 2 500 customers) Consumer 32,09%
Subtotal
32,09%
Business Benefits
Reduction of meter reading and operations cost (reading, billing, customer care) (€/year)
DSO 16,04%
Reduction of operations and maintenance cost (assets and equipment breakdowns) (€/year)
DSO 19,79%
Reduction in commercial losses (thefts, frauds, …) (€/year)
DSO 32,09%
Subtotal
67,91%
Total
100%
Assessment of benefits and identification of beneficiaries require forward-looking statements. In this descriptive summary we classify benefits according to beneficiary’s category and, consistently with the costs section, M€/year against M€. Regarding the total yearly benefits; consumers accounts for 32,09% and business add up to 67,91%; no country-wide estimation is provided.
Supply Chain

Work Package: WP2
Type of document: Deliverable
Date: 01/11/113
Energy Theme; Grant Agreement No 308794
Title: ANALYSIS OF SMART-METERING PROJECTS
Version: 2.0 Page: 58 / 118
Project Funded by the European Commission under the 7th Framework Programme
SC of the Project in Progress:
SC MACRO TIER
RESPONDENT SUPPLIERS BELONGING
TO THE GROUP OTHER
SUPPLIERS COST PER
UNIT
Manufacturing 1; not supplying competitors 66%
Logistics X
Installation X 17%
Maintenance X 17%
Data Comm. X < 1%
Data Management
X <<1%
The project in progress is being deployed by means of an important Supply Chain (SC) vertical integration. Among the 6 main necessary macro-tiers (Manufacturing and assembly, Logistics, Installation, Maintenance, Data Communication, Data Management), 5 out of 6 (Logistics, Installation, Maintenance, Data Communication, Data Management) are performed internally. In addition, Manufacturing and assembly is performed by a single supplier not supplying competitors. As far as it concerns the costs related to each macro-tier for the current project (basing on the available data), the most relevant ones are Manufacturing and Assembling (66% out of the total cost per unit), Installation (17% out of the total cost per unit), and Maintenance (17% out of the total cost per unit). Data Communication is considerably less expensive(< 1% out of the total cost per unit). Logistics and Data Management are negligible.
SC of the Roll-out:
SC MACRO TIER
RESPONDENT SUPPLIERS
BELONGING TO THE GROUP
OTHER SUPPLIERS COST
PER UNIT
Manufacturing >1; also supplying
competitors; LT BSR 65%
Logistics X
Installation >1; also supplying
competitors; LT BSR 16%
Maintenance >1; also supplying
competitors; LT BSR 16%

Work Package: WP2
Type of document: Deliverable
Date: 01/11/113
Energy Theme; Grant Agreement No 308794
Title: ANALYSIS OF SMART-METERING PROJECTS
Version: 2.0 Page: 59 / 118
Project Funded by the European Commission under the 7th Framework Programme
Data Comm. X 1.5%
Data Management
1; not supplying
competitors 1.5%
The SC for the future roll-out is expected to be the considerably different from the one in progress, with a lower level of vertical integration. As for the Manufacturing, Installation and Maintenance, an open market scenario is foreseen, so as more than a single supplier will be hopefully used, with long-term (LT) BSR. Logistics and Data Communication will be performed internally, and Data Management will be performed by a single supplier not supplying competitors. As far as it concerns the costs related to each macro-tier for the future roll-out (basing on the available data), the most relevant ones will be Manufacturing and Assembling (65% out of the total cost per unit), Installation (16% out of the total cost per unit), and Maintenance (16% out of the total cost per unit). Data Communication and Data Management (3% out of the total cost per unit) are considerably less expensive. Logistics is negligible.
3.3.1.3 Customer involvement
Current status of installation and use of smart metering As the smart meter framework is still not completely defined and formalized to the market no initiatives in this regard have been performed yet. Such actions are planned in mass roll-out preparation phase. There were not carried out any consumers campaign related to smart meter matter but nevertheless there are some indications from the CBA: cost effectiveness & tariffs diversification. Vulnerable customer focus ANRE has clearly defined which categories of customers are vulnerable from incomes perspective/health perspective. The power consumption management offers alternatives on how to manage remote disconnection (i.e. bad payers facing tough medical situations). Such issues are requiring special attention and dedicated law sections.
There are plans to adapt the Customer Services at Enel Muntenia in order to support the smart meter installation process. As the smart meter functionalities offer plenty of opportunities in this area the most important are related to contract management, complex tariffs, billing cycle. The AMM system creates the opportunity for the customer to access his own metering data and for the DSO to offer a highly integrated platform to support energy market various players.
Opt out focus The current regulations obliges the customer to obey the mandatory rules, normally the customer is repeatedly noticed in advance and afterwards, as the project or campaign begins, after two attempts the customer is disconnected. Nevertheless a special provision for

Work Package: WP2
Type of document: Deliverable
Date: 01/11/113
Energy Theme; Grant Agreement No 308794
Title: ANALYSIS OF SMART-METERING PROJECTS
Version: 2.0 Page: 60 / 118
Project Funded by the European Commission under the 7th Framework Programme
such cases is expected to be requested by NRA as the new regulations are defined. NRA and DSO must together define the exact conditions for opt out (if any) in order to not put under the question the project success. Certainly it is a very delicate subject which worth special attention in project preparation.
3.3.1.4 Other advanced solutions enabled by smart meters
Impact on distribution network operation
Smart meter system is considered the foundation of Smart grid. The reason is related to the extensive information database Smart meter is generating every second. Most of this information is related to consumption (Load profile – LP) or network QoS parameters and they are collected from a relevant number of locations (every smart meters become a network sensor). Analysis of the collected data may offer valuable information for implementation of SCADA (or similar systems) and, in general, related to grid connections and energy supply routes.
Meter data itself is not enough for a complete understanding of the network. They can give indications about trends and thresholds. In addition sensors must be in place (feeder meter) to help the system to act in real time as needed.
The impact on Distribution management system is the use of meter information to achieve benefits as understanding the operational characteristics (such as loading, losses, phase imbalance and utilization) of the distribution network assets, optimizing the utilization of existing assets and the ability to defer capital expenditure for new assets.
The availability of real-time, accurate and comprehensive information (voltages, loads, stressing, losses) generated by smart metering on the whole low-voltage network enables the optimization of distribution network operation.
Smart meter registrations can be used in network assets investment planning as a primary source of data for further analysis of:
- Current assets efficiency - Assets maintenance plan - Assets replacement plan
Smart metering system provides different sources of useful data for maintenance optimization process:
- Input from QoS database, outages/energy supply parameters - The Load profile (LP) registered by energy balance meter for a given transformer.
The LP analysis against the transformer specifications may lead to changes in the transformer maintenance policy
- The results of meter self-test for metering quality parameters procedure
Regarding quality of supply, the meter is able to register QoS parameters (i.e. Voltage, number and duration of the outages) and send them to back office for further analysis. DSO can collect data from different network locations and act afterwards consequently. Due to two way communication functionality, the DSO is able to quickly understand and inform the customers if an outage occurs in his network (and where it occurs) or in the customer side.
Core of the EV charging infrastructure

Work Package: WP2
Type of document: Deliverable
Date: 01/11/113
Energy Theme; Grant Agreement No 308794
Title: ANALYSIS OF SMART-METERING PROJECTS
Version: 2.0 Page: 61 / 118
Project Funded by the European Commission under the 7th Framework Programme
Enel solution enables the diffusion and the use of electric vehicles, with state-of-the-art charging technologies, thanks to ad-hoc development of charging infrastructure, which includes the following features:
- Availability in all private and public areas where end users traditionally park their vehicles
- Safe and user-friendly charging points - A variety of secure payment procedures - Compliance with current free energy market regulations, allowing customers access
to the energy plans provided by their energy suppliers
Charging points will leverage on Enel’s technology, including the Enel smart meter as a kernel to provide all certified metering and data acquisition functionalities, as well as guaranteeing final customer billing management. Other functionalities implemented to fulfil the new infrastructure requirements will be supported by an additional electronic board, supporting all EV recharging processes, including data communication with the EV through power line carrier technology, and managing data communication with the central clearinghouse.
Enel has developed two different charging stations, in order to satisfy customer needs of charging: the street pole, to charge in public spaces, and the Wall Box, a custom solution to charge at home.
The Enel solution for electric mobility includes the following Smart Grid functionalities:
- Smart grid integration of charging systems allows flexibility of the charge, according to energy availability, storage of eventual energy overproduction and voltage control, and assuring quality of service
- Open platform grid infrastructure for EV charge purposes accessible to all market players and customers
- Development of customer identification technologies and communication between vehicle and power grid
- Enabling new advanced services to manage billing and charging processes - Charge of Electric vehicles with RECS certified energy (Renewable Energy
Certificate System)
Enel promotes the “DSO business model”, in which the DSO is responsible of EV charging infrastructure deployed for public/private use as grid extension, providing points of recharge (PoR) with embedded smart metering and communication systems, enabling the marketplace services.
The DSO, in addition to usual services (such as grid access, metering services), provides and maintains the charging infrastructures, and enables smart grids functionalities through them and ICT middleware, establishing a connection between the EV point of recharging (PoR) and the energy marketplace.
Support of Distributed Generation
Electricity generated by a consumer/producer in an eligible on-site plant and injected into the grid can be used to offset the electricity withdrawn from the grid.

Work Package: WP2
Type of document: Deliverable
Date: 01/11/113
Energy Theme; Grant Agreement No 308794
Title: ANALYSIS OF SMART-METERING PROJECTS
Version: 2.0 Page: 62 / 118
Project Funded by the European Commission under the 7th Framework Programme
Renewable electricity generators are equipped with one or two meters, the first one to determine the electricity generation which qualifies for feed-in rates, and the second one to determine usage (net-metering) and grid-delivery compensation.
In case of pure producers, a bidirectional meter is installed at customer premise.
The DSO is fully responsible of metering activity in general, not only for distributed generation. Currently (as smart meters are not available for the moment), AMR type meters registering Active and Reactive energy incoming / outward are used if there is a single point of connection; if In/Out circuits are separated then one / two common type AMR meter (not always the income energy is requiring an AMR) are used.
Capacity of enabling Demand Response Enel´s Demand Response foreseen features enabled by the meter are:
- Breaker and demand control algorithm on board - Remote reduction of the available power until disconnection - Display on board - Interval metering for customers with available power of more than 55 kW - Time of Use tariffs applied to customers with power less than 55kW (peak/off-
peak/midlevel)
The users could access the meter data through:
- Dedicated displays - Web - Smart phones - PC - Possible many others as the communication protocol is integrated
There are many such initiatives and projects in Enel Group. However, no R&D local projects are planned in the near future in Enel Romania by now.
Enel Romania has made neither tests nor research in this area, but a special section of the massive Roll Out project plan was dedicated to communication & customer awareness. In

Work Package: WP2
Type of document: Deliverable
Date: 01/11/113
Energy Theme; Grant Agreement No 308794
Title: ANALYSIS OF SMART-METERING PROJECTS
Version: 2.0 Page: 63 / 118
Project Funded by the European Commission under the 7th Framework Programme
addition, pilot project outcomes have clearly shown that communication will be a key factor in the project success.
The ongoing projects are:
1) Enel Romania participated (Enel Distributie Dobrogea) to FP7 ADDRESS Project, The goal of the project is to enable Active Demand: the active participation of small and commercial consumers in power system markets and provision of services to the different power system participants
2) Smart regions project, the Romanian team (TSO, DSO etc) conducted and under coordination of Romanian government, http://www.smartregions.net/default.asp?SivuID=26875.
3) Romanian Industry & Commerce Ministry “Smart Grid” working group (with participation of TSO & DSO) (there is no English version of the document for the moment) http://www.minind.ro/dezbateri_publice/2012/STRATEGIA_energetica_actualizata_22_august_2012.pdf
There are no initiatives for demand management by now, except the discussions within CBA working group.
NRA must shape the regulatory framework as following:
Metering Code modifications:
- Remove the mandatory requirement from Metering Code to perform a local reading with a frequency requested by the category of the measurement system (on an annual basis, at 2 or 3 years).
- Allow the remote configuration and parameterization of meters and concentrators which are now prohibiting by Metering Code. The remote management of meters and concentrators is an important benefit.
- Remove the DO obligation to give a hardcopy of the readings to the client. The readings registrations will come later to the client as an invoice annex.
- Remote disconnection / power management: customers in scope or out (i.e. hospitals etc)
Consider:
- If no GIS / Network topology management system is not in place then the auto discovery functionality must be mandatory (e.g. automatic enrollment of the meter to concentrator).
- EC requirements regarding customer identity & data protection (data access process governance , which data to be registered / archived etc)
- The Smart Meter solutions must compel to Mandate 441 & EU recommendations and comply to Mandate 468 and 490
- For the roll out preparations it will help a clear provision about the meter access & meter replacement: the customer must allow to the DO to change the meter.
Other advanced metering solutions

Work Package: WP2
Type of document: Deliverable
Date: 01/11/113
Energy Theme; Grant Agreement No 308794
Title: ANALYSIS OF SMART-METERING PROJECTS
Version: 2.0 Page: 64 / 118
Project Funded by the European Commission under the 7th Framework Programme
Enel is working on a solution for smart gas metering with advanced functionalities taking the opportunities of the solution already deployed in Italy in the electricity sector.
Alongside the benefits of smart metering, such as more accurate billing, monitoring and control and energy savings, the availability of an already experienced infrastructure raises important opportunities for high operational efficiency, optimized efforts and benefits. In fact, leveraging on the synergies with the electricity metering infrastructure and the expertise acquired by Enel Distribuzione in the electricity sector, gas smart metering would benefit a lower economic impact while optimizing investments, would face a lower technological risk, given also the availability of specific know-how, while additionally lowering the time to market. However, the company is not carrying out any pilot, demonstration project or roll out plan. Based on Romanian metering infrastructure model, the responsible for different issues are:
- Meter manufacturing: The winner of the meter acquisition tender organized by DSO - Meter installation and maintenance: DSO - Meter reading: DSO - Communication devices (e.g. concentrators )
manufacturing, as for the meters will be a tender – one solution meter-concentrator
installation and maintenance - DSO - Central system management
NRA operator ; DSO* - Data management
NRA operator ; DSO* *NRA suggested an centralized MDM (UK model), DSO will collect and transfer data to MDM, the suppliers and other authorized organizations will gather data form MDM
NRA has asked for a CBA covering all utilities/ multi utility solution as a support for 72 Directive call for Smart meter however only electricity and gas industries have expressed interest in such project. The CBA has a slightly negative result for Gas. Still, the CBA is positive in most of industrialized areas. Therefore, the implementation of Smart meter for Gas in urban area was considered as a possible scenario, but only as an interim solution.
The main Functionalities included as mandatory (creating savings) in Romanian CBA study are:
- Provide readings directly to the customer and any third party designated by the consumer
- Update the readings referred to in point a) frequently enough to allow the information to be used to achieve energy savings
- Allow remote reading of meters by the operator - Provide two-way communication between the smart metering system and external
networks for maintenance and control of the metering system. Interfaced with energy power meter inMaster Slave configuration where the gas meter is the Slave

Work Package: WP2
Type of document: Deliverable
Date: 01/11/113
Energy Theme; Grant Agreement No 308794
Title: ANALYSIS OF SMART-METERING PROJECTS
Version: 2.0 Page: 65 / 118
Project Funded by the European Commission under the 7th Framework Programme
- Allow readings to be taken frequently enough for the information to be used for network Planning
- Support advanced tariff systems - Provide secure data communications - Fraud prevention and detection - Provide import/export active metering - Automated fault identification - Improve monitoring of assets - Identification of technical/non-technical losses by power flow analysis - Meter enables use of different technologies providing communication with the HAN
network and other smart meters - Meters should transmit to the Central Application info about the status of the device
integrity breach sensor - AMI System central application should store meter data at least for the period
relevant for billing, complaint, collection - Communication infrastructure should enable expanding the AMI System with
additional meters, without the need to replace existing elements - Meters should have capability of storage of the data for a sufficient time period - Time synchronization - Remote software update
The National Regulatory Authority (72 Directive) has set a deadline for meter full roll out: at least 80% of gas meters to be replaced until 2020. The time plan was considered as an input for CBA, but still not officially communicated by NRA to the DSOs.
Enel Romania metering solution includes the provision of value added services, such as:
- Info Display, customer awareness, alarms if consumption exceeds agreed thresholds. - Market interactive display - Wi-Fi meter connector (the meter data can be directly accessed from PC/Tablet, etc.) - Home appliances protocol integration - Multi utility solution (connect with others utilities meter registration – i.e. electricity) - Consumption profiles. - Peak analysis (who is generating peaks, in which conditions, etc.)
Conclusions on Romania On July 1, 2007, Romania introduced European unbundling principles for electricity companies. The legislation regarding the implementation of smart metering has not been adopted yet, but on September 3rd 2012 the official cost-benefit analysis (CBA) on smart metering roll-out, has been carried out and it concludes in a positive manner. In case of roll-out, ENEL Muntenia, the only one DSO that replied to the questionnaire, forecast to install about 2,6 million smart meter by the end of 2022 of which 80% until 2020. The available contractual power is 6kW, and the average yearly consumption is about 1400kWh. The total project budget is € 262M financed entirely by ENEL Muntenia. The customer involvement’s initiatives are not yet defined due to the fact that the project is

Work Package: WP2
Type of document: Deliverable
Date: 01/11/113
Energy Theme; Grant Agreement No 308794
Title: ANALYSIS OF SMART-METERING PROJECTS
Version: 2.0 Page: 66 / 118
Project Funded by the European Commission under the 7th Framework Programme
still in the initial phase. The main benefits expected are a better operation and monitor of the grid, the possibility to abilitate some demand response strategy, a better integration of the distribute enrgy resources and the development of an EVs charging infrastructure.
3.4 Spain
Regulatory framework and market overview
National Regulation on smart meter In June 2006 legislation was in place that from July 2007 all meters to be installed in new homes should have the characteristics of a smart meter. One year later the mandate on a massive replacement scheme was approved establishing the commitment of installing 35% of the smart meters by December 2014 and to reach 100% by the end of 2018. It applies to all customers, residential or commercial and industrial, with a power contracted below 15 kW. With this decision more than 30 million meters in the country are involved, one might say following in Italy’s footsteps.
When it comes to unbundling between DSOs and Retailers, this is effective in Spain since 2009.
Spain’s electricity market is a part of MIBEL – the Iberian Electricity Market which is composed with representatives from Portugal: Energy Services Regulatory Authority (ERSE) and the Securities Market Commission (CMVM) and representatives from Spain: National Energy Commission (CNE) and National Securities Market Commission (CNMV). This initiative has proven to be quite successful for the Iberian Electricity Market but also it has been a significant endeavour in supporting the European Internal Energy Market.
The Regulatory Authority - Comisión Nacional de Energía - CNE has not performed or ordered a Cost Benefit Analysis, or if it has, it is not publicly available. Some sources say that starting this year a wide analysis will be undertaken.
At the moment in Spain between 15% and 30% of the smart meters have been installed, showing a steady and positive direction.
Customers can choose to own the meter or rent it from DSO or meter operator or retailer. DSO is obliged to offer the meter, and, if the customer accepts, the DSO can only charge the approved by Government meter rental fee. The approved rental fee comprises the meter asset, plus installation, plus operation and maintenance, plus official metrology exams. The DSO is responsible to read the meter every 2 months and provide meter readings to the retailers.
The commercial and technical quality standards set by the CNE are:
Accuracy: class A for active energy and class 3 for reactive
Hourly Discrimination (six period)
Storage of hourly profile almost three months (active and reactive)
Power control

Work Package: WP2
Type of document: Deliverable
Date: 01/11/113
Energy Theme; Grant Agreement No 308794
Title: ANALYSIS OF SMART-METERING PROJECTS
Version: 2.0 Page: 67 / 118
Project Funded by the European Commission under the 7th Framework Programme
Registration quality parameters: interruptions and voltage variations
Remote reading of energy and power
Remote reading of quality parameters and events
Remote programming (rates)
Power remote control (remote connection and disconnection)
Load management capacity
Distributors and customers shares for each distributor Spain has four dominant companies on the generation and supply markets. The top three of them have a market share of 90% of the customers.
Market shares of the supply companies: (end of 2009 consolidated data)
Endesa – 43,5%
Iberdrola – 32,7%
Gas Natural Fenosa – 14%
HC Energia – 8%
Others – 1,5%
Distributors replying to the questionnaire For this country analysis four DSOs have replied: Endesa, Iberdrola, HC Energia and Gas Natural Fenosa.
3.4.1 Endesa
The Endesa smart meter project has started in 2008 and it’s expected to finish mass deployment in 2018. It is currently the largest on-going smart metering roll-out in Europe. It involves about 13.000.000 customers, 84% of which are residential. Since 2011 the mass roll-out is ongoing and over 3.500.000 smart meters have been installed already. The average contractual power is 4,7 kW, while the average residential yearly consumption is 3300 kWh.

Work Package: WP2
Type of document: Deliverable
Date: 01/11/113
Energy Theme; Grant Agreement No 308794
Title: ANALYSIS OF SMART-METERING PROJECTS
Version: 2.0 Page: 68 / 118
Project Funded by the European Commission under the 7th Framework Programme
Overview of the Power Grid
Yearly energy distributed (TWh) 105,1 TWh (2011)
HV,MV and LV voltage levels
HV: 30.000V-400.000V
MV: 1.000V-30.000V
LV: <1000 V
Number of HV/MV substations; 1.240 (2011)
Number of MV/LV substations; 130.858 (2011)
Average residential contractual power (KW) 4,7 kW
Types of residential meters installed Both single and polyphase
Average residential yearly consumption (KWh) 3 300 kWh
3.4.1.1 Technological analysis of the solution deployed
Endesa: AMI Architecture
The architecture of the electricity metering solution is depicted in Figure 1. The main component of Endesa’s smart metering system is its new smart meter, which replaces the traditional meters. The new meter has obtained full certification, in Europe and Spain alike, and is kitted out with state-of-the-art technology. It has the same dimensions and fixing points as the traditional meters. The intermediary between the meters and the central system is the concentrator, which is installed at the secondary substations. This concentrator communicates with meters using powerline communication (PLC) technology and with the central systems via GPRS. The main features of the system are:
- Communication between meters (installed at customer’s homes) and concentrators
(installed at the secondary substation) is possible by means of low voltage electric
network (the open Meters and More PLC protocol)
- Hand held unit devices can be connected to the meters through an optical port.
- Communication between concentrator and central system is possible through the
Public Communications Network (GPRS)
- AMMS is modular and scalable. It is compatible with Endesa’s legacy systems and is
linked to Endesa’s commercial systems.

Work Package: WP2
Type of document: Deliverable
Date: 01/11/113
Energy Theme; Grant Agreement No 308794
Title: ANALYSIS OF SMART-METERING PROJECTS
Version: 2.0 Page: 69 / 118
Project Funded by the European Commission under the 7th Framework Programme
Figure 4: Endesa AMI
Each Data concentrator can manage up to 2048 meters and as said before they are installed at the transformer stations. The communication interfaces available on data collector are:
- TCP/IP based communication network - PLC - Optical port
Clock of data concentrators can be remotely synchronized by a periodic synchronization message sent to the concentrator from the central system. When a new alarm is generated, the concentrator alerts the central system (piggybacked push). Then the central system will retrieve the alarms which have been activated at the concentrator (pull). The time needed to get the alarm depends on the communications channel.
Endesa: Main Features of Electricity Smart Meters (single and three phases)
Single phase and three phase meter share the same communication technology. The meter doesn’t have any electrically protective device but transient overvoltages are detected. Also, it has a relay with a maximum cut-off current of 120A for both the single phase type and the three phase type. Possible reinstatement mechanisms are: by meter pushbutton, remotely through operation of main circuit breaker from customer house and remotely from central system management with PLC communications. The meter has a backup lithium battery as a backup power supply. It has a display that is divided in two independent areas: register area and operating indicator area. The meter offers the possibility to program weekly tariff profile. Among

Work Package: WP2
Type of document: Deliverable
Date: 01/11/113
Energy Theme; Grant Agreement No 308794
Title: ANALYSIS OF SMART-METERING PROJECTS
Version: 2.0 Page: 70 / 118
Project Funded by the European Commission under the 7th Framework Programme
the tariff programs, 2 annual programs, 6 weekly program and 8 daily programs are provided. Furthermore 6 daily tariff intervals can be programmed. It also offers the possibility to control the load and to remotely manage a load reduction. The meter also has a fraud detection mechanism that detects unauthorized cover open. Information about the fraud alarms is sent from the meters to the concentrator at least once per day. Then the concentrator sends the information to central system at least once per month (configurable).
SINGLE PHASE THREE PHASE
Meter average life
>15 years
Presence of internal switchgear
-The switchgear implemented is a
relay, and it is not accessible from
external. Possible reinstatement
mechanisms are: by meter
pushbutton, remotely through
operation of main circuit breaker from
customer house and remotely from
central system management with PLC
communications. The switchgear
complies to ICP simulation function
compliant with requirements provided
by UNE 20317.
-maximum cut-off current: Imax=120A
-cutting poles: 2 poles
-The switchgear implemented is a
relay, and it is not accessible from
external. Possible reinstatement
mechanisms are: by meter
pushbutton, remotely through
operation of main circuit breaker from
customer house and remotely from
central system management with PLC
communications. The switchgear
complies to ICP simulation function
compliant with requirements provided
by UNE 20317.
-maximum cut-off current: Imax=120A
-cutting poles: 3 poles
List of international standard that meter is compliant to
UNE-EN 50470-3;
UNE-EN 62053-23;
UNE-EN 60529;
UNE EN 62056-21;
CLC/prTS 50568-4,
CLC/prTS 50568-8,
Endesa: Main Functions of Electricity Smart Meters (single and three phases)
Single phase and three phase meter have identical main functionalities.
SINGLE PHASE THREE PHASE
Frequency for reading The concentrator retrieves information from meters every

Work Package: WP2
Type of document: Deliverable
Date: 01/11/113
Energy Theme; Grant Agreement No 308794
Title: ANALYSIS OF SMART-METERING PROJECTS
Version: 2.0 Page: 71 / 118
Project Funded by the European Commission under the 7th Framework Programme
day. The central system retrieves information from the concentrator on demand according to the requests from the retailers.
Active energy measurement It measures imported and exported active energy
Reactive energy measurement Detected in 4 quadrants
Number of annual tariff programs that can be programmed
Two: 1 Current and 1 Future
Number of weekly tariff programs that can be programmed for each annual program
Six: 3 current and 3 future
Number of daily tariff programs that can be programmed for each weekly tariff programs
8 days
Number of daily tariff intervals that can be programmed
6
Possibility to remotely manage supplying contracts
Yes
Possibility to locally manage supply contracts
Yes, through optical port communications with handheld unit.
Load control support
The meter support load control and it is possible to remotely manage a load reduction.
The tripping curve algorithm consists in ICP simulation function complies with requirements provided by UNE 20317, while the possible reconnection mechanisms are:
by meter pushbutton, remotely through operation of main circuit breaker from customer house and remotely from central system management with PLC communications.
The meter record events in an event lo log
List of monitored parameters
How information can be accessed
Meter has three buffers.
E-G2: General events
E-G1: General events, higher rank than the E-G2 events.
E-LI: Access (log-in) events.
Record of information about Yes

Work Package: WP2
Type of document: Deliverable
Date: 01/11/113
Energy Theme; Grant Agreement No 308794
Title: ANALYSIS OF SMART-METERING PROJECTS
Version: 2.0 Page: 72 / 118
Project Funded by the European Commission under the 7th Framework Programme
power outages and quality of supply
Presence of demand management feature implemented
Power control and peak shaving
Presence prepayment management implemented
No, but can be implemented at system level
Local interfaces Local access through optical port for field operations
Possibility to remotely download firmware
Yes
3.4.1.2 Economic analysis of the solution deployed
Costs & Benefits
No available data.
Supply Chain
SC of the Project in Progress (already roll-out):
SC MACRO TIER
RESPONDENT SUPPLIERS
BELONGING TO THE GROUP
OTHER SUPPLIERS COST
PER UNIT
Manufacturing 1; also supplying
competitors 6; also supplying
competitors; LT BSR
Logistics 8; also supplying
competitors; LT BSR
Installation 112; also supplying
competitors; LT BSR
Maintenance 112; also supplying
competitors; LT BSR
Data Comm. 1; not supplying
competitors 2; also supplying
competitors; LT BSR
Data Management
X 1; not supplying
competitors

Work Package: WP2
Type of document: Deliverable
Date: 01/11/113
Energy Theme; Grant Agreement No 308794
Title: ANALYSIS OF SMART-METERING PROJECTS
Version: 2.0 Page: 73 / 118
Project Funded by the European Commission under the 7th Framework Programme
The project (already roll-out) in progress is being deployed by means of a low Supply Chain (SC) vertical integration. Among the 6 main necessary macro-tiers (Manufacturing and assembly, Logistics, Installation, Maintenance, Data Communication, Data Management), 1 out of 6 (Data Management) is performed partially internally. As for the other macro-tiers, the majority (5 out of 6: Logistics, Installation, Maintenance) of the players are companies not belonging to the group, whilst in 3 cases (Manufacturing, Data Communication, Data Management) out of 6, the players are also companies belonging to the group. ENDESA always (5 out of 5) buys from multiple suppliers (also supplying competitors) with long-term Buyer-Supplier Relationships (BSR) currently in place when companies do not belong to the group, whilst buys both from single suppliers (once also supplying competitors, twice not) when suppliers belong to the group. As far as it concerns the costs related to each macro-tier within the project in progress, no information is provided.
3.4.1.3 Customer involvement
Letters informing about the meter substitution are sent to the customers. In addition, diptychs informative posters and reconnection stickers are distributed. Other initiatives as disseminations campaigns among customers, associations, local authorities and participation in congresses are performed. Currently Endesa is participating in Working Groups with the National Regulatory Authority to understand which the customers’ priorities are. At the same time, Endesa is taking into consideration the recommendations published by the European Commission. Endesa is providing to customers information about consumption through web portal in various pilot projects. The results of these tests will lead to the mass solution for DSO customers, but no monitoring has been performed by the NRA. Current status of installation and use of smart metering The rollout is at over 30% installation out of the approximate 13 million customers (residential 84%, commercial and industrial 16%). In June 2012 the 2 million installed meters mark had been passed and by the end of the year 2012 3 million customers already had them on their premises. Vulnerable customer focus According to Endesa the regulation regarding meters installation does not distinguish among different customers. Opt out focus Customer acceptance has been very positive. Only 1,9 % of the customers have called the company with doubts and only 0,19 % of customers have presented claims. In case the customer still rejects the installation, the company calls him explaining it is mandatory and if he still rejects, a registered mail is sent informing about the supply disconnection.
3.4.1.4 Other advanced solutions enabled by smart meters
Impact on distribution network operation

Work Package: WP2
Type of document: Deliverable
Date: 01/11/113
Energy Theme; Grant Agreement No 308794
Title: ANALYSIS OF SMART-METERING PROJECTS
Version: 2.0 Page: 74 / 118
Project Funded by the European Commission under the 7th Framework Programme
The impact of Smart Metering deployment on Distribution Management Systems regarding the fields of distribution management system, network planning network maintenance or quality of supply, is under study for Endesa, so there are still no conclusions drawn. Core of the EV charging infrastructure Endesa is testing smart charging and V2G services in several on-going pilot projects developed in Spain: SmartCity Málaga, SmartCity Barcelona, etc. Support of Distributed Generation Smart metering system from Endesa enables both import and export energy measurement (total energy and load curves), to facilitate the process for producers/prosumers and increase DER penetration. Capacity of enabling Demand Response As an advanced feature for Demand Response, Endesa is providing consumption information to users through a DSO web portal, under the scope of several smart grid pilot projects. Other interfaces for people to access their consumption data are web interface, TV and smartphones, also tested in pilot projects. Endesa is also participating in different European projects to promote energy efficiency of end consumers, such as ESESH and EnergyTIC, where tests are being performed. Regarding Demand Response, the National Regulatory Authorities are currently studying how to promote it, and the application of Time of Use tariffs. Other advanced metering solutions Endesa, as a DSO, is currently not going to implement other advanced metering solutions for heat, water, or gas.
3.4.2 Iberdrola
The IBERDROLA CASTELLON smart meter project has started in 2011 and it has finished deployment in 2012. At current time it involves about 98.151 customers, 90% of which are residential. Of the total number of customers, the 1% is served by the leading company. In case of rollout, it is foreseen that by 2018 10 million meters will be installed. The Castellon project was the initial demonstration project prior to massive roll-out. The average

Work Package: WP2
Type of document: Deliverable
Date: 01/11/113
Energy Theme; Grant Agreement No 308794
Title: ANALYSIS OF SMART-METERING PROJECTS
Version: 2.0 Page: 75 / 118
Project Funded by the European Commission under the 7th Framework Programme
contractual power is 3,3-4,4 kW, while the average residential yearly consumption is 3.500 kWh.
Overview of the Power Grid
Yearly energy distributed (TWh) 96
HV,MV and LV voltage levels up to 400 kV
Number of HV/MV substations; 933
Number of MV/LV substations; 93.011
Average residential contractual power (KW) 3,3 to 4,4 kW
Average residential yearly consumption (KWh) 3.500 kWh
3.4.2.1 Technological analysis of the solution deployed
Iberdrola: AMI Architecture The architecture of the Advanced Metering Infrastructure is based on Data Concentrator which are installed at MV/LV secondary substations. Some vendors say their data concentrators can manage up to 2.000 meters connected to the low voltage network using PLC. DLMS-COSEM is used over PRIME PLC meters. On the medium voltage level side, IEC 870.5-102 protocol is used over meters with telephone modems or GSM/GPRS modems. Data concentrators normally offer one or more Ethernet ports to connect to the AMM system through routers/switches. The data concentrators are synchronized remotely by the AMM system. Alarms are either pushed or pulled, depending on the group and type of the alarm. Some alarms reach the AMM system in quasi-real time. Some others take longer, until they are collected through polling mechanisms. Data concentrators offer different power supplies, universal AC and also DC. The meter reading success rate is 99%. The main reason for unsuccessful meter readings is the unavailability of the WAN connection between the data concentrator and the AMS system. The contract tariff scheme is based on 6 Time of Use registers and a totalizing register, making a total of 7 registers. Each register is composed of A+, A-, R1, R2, R3 and R4, plus a maximum demand register plus a date and time at which the maximum demand occurs. The load profile is a daily 24 hour load profile of 2 active registers and 4 reactive registers. Data concentrators have tasks to poll meters every day. Once data is retrieved from meters, it is pushed to the AMM system by data concentrators. Alternatively, the AMM system can pull data from the field, either directly from the meters or from the data concentrators.

Work Package: WP2
Type of document: Deliverable
Date: 01/11/113
Energy Theme; Grant Agreement No 308794
Title: ANALYSIS OF SMART-METERING PROJECTS
Version: 2.0 Page: 76 / 118
Project Funded by the European Commission under the 7th Framework Programme
Iberdrola: Main Features of Electricity Smart Meters (single and three phases) Single phase and three phase meter share the same communication technology. Data concentrators have a self-consumption of 2-3 W both in case of active communication and not active communication. The meter presents an external fuse as electrically protective device. The meter has an internal breaker. When it triggers it can be rearmed by the customer, either pushing one button at the front of the meter or disconnecting all loads and reconnecting them again. The maximum cut-off current is 100 A both for single phase and three phase meters. The meters has a battery as backup power supply that keeps the real time clock and values are stored in non-volatile memory. The meter presents a display showing information navigated through one or two buttons. A 24 hour billing profile and a daily billing profile are available. There are no limits on the number of annual, weekly and daily tariff programs that can be programmed. Up to 6 different daily tariff intervals can be programmed. It also offer the possibility to control the load through internal breaker that triggers if actual demand exceeds threshold value. The threshold value is remotely programmable.
SINGLE PHASE THREE PHASE
Meter average life
Expected : 10 to 15 years
Presence of internal switchgear
The meter has an internal breaker. When it triggers it can be rearmed by the customer, either pushing one button at the front of the meter or disconnecting all loads and reconnecting them again. This is also a request by regulation.
Maximum cut-off current is 100 A. Number of cutting poles: 2
The meter has an internal breaker. When it triggers it can be rearmed by the customer, either pushing one button at the front of the meter or disconnecting all loads and reconnecting them again. This is also a request by regulation.
Maximum cut-off current is 100 A. Number of cutting poles:3
List of international standard that meter is compliant to
Based on IEC standards and in compliance with European norms
Iberdrola: Main Functions of Electricity Smart Meters (single and three phases) Single phase and three phase meter has identical main functionalities.
SINGLE PHASE THREE PHASE
Frequency for reading Daily
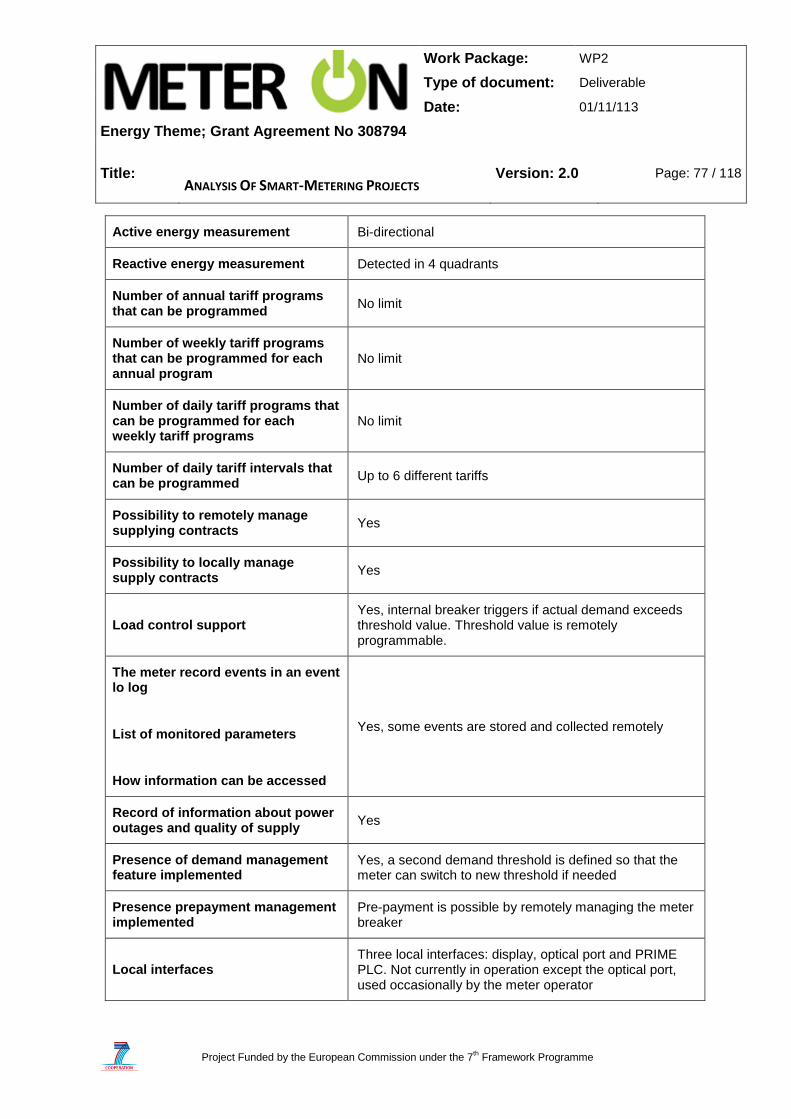
Work Package: WP2
Type of document: Deliverable
Date: 01/11/113
Energy Theme; Grant Agreement No 308794
Title: ANALYSIS OF SMART-METERING PROJECTS
Version: 2.0 Page: 77 / 118
Project Funded by the European Commission under the 7th Framework Programme
Active energy measurement Bi-directional
Reactive energy measurement Detected in 4 quadrants
Number of annual tariff programs that can be programmed
No limit
Number of weekly tariff programs that can be programmed for each annual program
No limit
Number of daily tariff programs that can be programmed for each weekly tariff programs
No limit
Number of daily tariff intervals that can be programmed
Up to 6 different tariffs
Possibility to remotely manage supplying contracts
Yes
Possibility to locally manage supply contracts
Yes
Load control support Yes, internal breaker triggers if actual demand exceeds threshold value. Threshold value is remotely programmable.
The meter record events in an event lo log
List of monitored parameters
How information can be accessed
Yes, some events are stored and collected remotely
Record of information about power outages and quality of supply
Yes
Presence of demand management feature implemented
Yes, a second demand threshold is defined so that the meter can switch to new threshold if needed
Presence prepayment management implemented
Pre-payment is possible by remotely managing the meter breaker
Local interfaces Three local interfaces: display, optical port and PRIME PLC. Not currently in operation except the optical port, used occasionally by the meter operator

Work Package: WP2
Type of document: Deliverable
Date: 01/11/113
Energy Theme; Grant Agreement No 308794
Title: ANALYSIS OF SMART-METERING PROJECTS
Version: 2.0 Page: 78 / 118
Project Funded by the European Commission under the 7th Framework Programme
Possibility to remotely download firmware
Yes
3.4.2.2 Economic analysis of the solution deployed
Costs & Benefits No available data.
Supply Chain
SC of the Project in Progress (already roll-out):
SC MACRO TIER
RESPONDENT SUPPLIERS
BELONGING TO THE GROUP
OTHER SUPPLIERS COST PER UNIT
Manufacturing 7; also supplying
competitors; LT BSR
Logistics many; also supplying competitors; LT BSR
Installation many; also supplying
competitors; LT BSR; LT BSR
Maintenance many; also supplying competitors; LT BSR
Data Comm. X
Data Management
X
The project (already roll-out) in progress is being deployed by means of a low Supply Chain (SC) vertical integration. Among the 6 main necessary macro-tiers (Manufacturing and assembly, Logistics, Installation, Maintenance, Data Communication, Data Management), 2 out of 6 (Data Communication, Data Management) are performed internally. As for the other macro-tiers, all of them (4 out of 6: Manufacturing, Logistics, Installation, Maintenance) are performed from multiple suppliers not belonging to the group, with long-term BSR in place. As far as it concerns the costs related to each macro-tier within the project in progress, no information is provided.

Work Package: WP2
Type of document: Deliverable
Date: 01/11/113
Energy Theme; Grant Agreement No 308794
Title: ANALYSIS OF SMART-METERING PROJECTS
Version: 2.0 Page: 79 / 118
Project Funded by the European Commission under the 7th Framework Programme
3.4.2.3 Customer involvement
A letter is sent to all customers prior to installation, informing the customers of the benefits of smart meters and of the way to rearm the meter breaker if triggered by excess of demand No surveys have been carried out with this project. The NRA - CNE dos not monitor customer satisfaction, at least for the time being, according to the responder. When it comes to customer services these have been adapted, as Customer Service operators have now access to smart metering data and to operate on-demand actions over the smart metering infrastructure. Current status of installation and use of smart metering For Castellon, Iberdrola has planned to install 100.000 smart meters and it has almost reached completion by Dec 2012. Beside Castellon there are 11 other areas where deployment is progressing as planned. Vulnerable customer focus Vulnerable customers are protected by a special tariff, but no details have been provided on this matter. Opt out focus No national regulation is in place for customers that want to opt-out.
3.4.2.4 Other advanced solutions enabled by smart meters
Impact on distribution network operation The impact of Smart Metering deployment on Distribution Management Systems implies that spontaneous recorded events will help to identify faults easier and faster, as well as maximum demand at secondary substations will be used for network planning, and will permit a proactive maintenance instead of reactive one. Iberdrola´s smart metering system also helps DSO to fight fraud, by matching supply points with phase, line and transformer. The improvement on network management, network planning, proactive maintenance, response to faults and network balance leads to a higher quality of supply. Core of the EV charging infrastructure For the time being, Iberdrola does not consider additional services for EV charging. However, those can be implemented at system level, as smart meters are bidirectional. Support of Distributed Generation
Work Package: WP2
Type of document: Deliverable
Date: 01/11/113
Energy Theme; Grant Agreement No 308794
Title: ANALYSIS OF SMART-METERING PROJECTS
Version: 2.0 Page: 80 / 118
Project Funded by the European Commission under the 7th Framework Programme
Smart metering system from Iberdrola is able to measure active and reactive energy in 4 quadrants, to facilitate DER penetration and integration. Capacity of enabling Demand Response As an advanced feature for Demand Response, Iberdrola´s meter, which has an internal breaker, can be programmable, so the system can regulate user power limitation in case the National Regulatory Authority permits it. In order to promote energy efficiency and an active participation of end consumers, a smart metering portal is being developed, where end-users can have information about their consumption, and also have an active participation in the power system. The interface will be via web, and users can access to it using PCs, smartphones, tablets, and so on. The company has not yet conducted any market test to evaluate the impact of the metering solutions. The National Regulatory Authority has carried out few initiatives to promote demand response, such as off-peak tariff and the recent super off-peak tariff, the last one with little success. Other advanced metering solutions Iberdrola is focused on its electricity meter, and they do not contemplate any other advanced solution.
3.4.3 Gas Natural Fenosa
The Gas Natural Fenosa smart meter project has started in 2011 and it’s expected to finish deployment in 2018. At current time it involves about 3.600.000 customers, 100% of which are residential. In case of roll-out, it is foreseen that 3.600.000 meters will be installed by 2018. The average contractual power is 3.3 kW, while the average residential yearly consumption is not provided.

Work Package: WP2
Type of document: Deliverable
Date: 01/11/113
Energy Theme; Grant Agreement No 308794
Title: ANALYSIS OF SMART-METERING PROJECTS
Version: 2.0 Page: 81 / 118
Project Funded by the European Commission under the 7th Framework Programme
Overview of the Power Grid
Yearly energy distributed (TWh) 54,1
HV,MV and LV voltage levels 220 kV, 132 kV, 66 kV, 45 kV, 20 kV, 15 kV 380 V, 220 V
Number of HV/MV substations; ~ 400
Number of MV/LV substations; ~ 37 000
Average residential contractual power (KW)
3,3 kW
Average residential yearly consumption (KWh)
n.a.
3.4.3.1 Technological analysis of the solution deployed
Gas Natural Fenosa: AMI Architecture The architecture of the Advanced Metering Infrastructure is based on Data Concentrator which are installed in MV/LV substation. The Modular Substation Manager (MSM) uses public, open and non-proprietary protocols, prioritizing the information that must be sent using real time protocols. From the communication point of view it is working to ensure reliability, cost-efficiency, standardization, and cyber-security. Regarding the communication technologies between the Data Concentrator Units and AMM Systems, PRIME is working in an international standardization..The meter is programmed to make every day a billing closure. The MDC collects this information daily from the concentrators or directly from the meter (in GPRS meters). It takes a daily register with absolute values per contract and tariff period, which is the necessary information to bill a client.
Gas Natural Fenosa: Main Features of Electricity Smart Meters (single and three phases) Single phase and three phase meter share the same communication technology. The meter doesn’t have any electrically protective device but it has an internal breaker with a maximum cut-off current >100A both for the single phase type and three phase type. The rearmament is via impedance measure of the consumer circuit (when the circuit is opened, the breaker reconnects).

Work Package: WP2
Type of document: Deliverable
Date: 01/11/113
Energy Theme; Grant Agreement No 308794
Title: ANALYSIS OF SMART-METERING PROJECTS
Version: 2.0 Page: 82 / 118
Project Funded by the European Commission under the 7th Framework Programme
The meter has an internal battery as power supply backup. It has Alphanumeric display with OBIS CODES. The meter offers the possibility to program daily and monthly billing profiles. Among the tariff programs, 12 annual programs and 10 daily programs are provided. Furthermore 6 daily tariff intervals can be programmed. It also offers the possibility to control the load. The meter also has a fraud detection mechanism that detects unauthorized cover open. Any events could makes the server builds an EVENT-NOTIFICATION-Request APDU and send it out in order to inform the client of the value of it.
SINGLE PHASE THREE PHASE
Meter average life 15 years
Presence of internal switchgear
Breaker. The rearmament is via impedance measure of the consumer circuit (when the circuit is opened, the breaker reconnects).
UNE 201003:2005
Maximum cut-off current ≥ 100 A
Number of cutting poles for single phase = 2
Breaker. The rearmament is via impedance measure of the consumer circuit (when the circuit is opened, the breaker reconnects).
UNE 201003:2005
Maximum cut-off current ≥ 100 A
Number of cutting poles for polyphase = 3
List of international standard that meter is compliant to
EN 50470-1,
EN 50470-3,
EN 62053-23,
EN 62054-21,
EN 62056-21,
EN 62056-46,
EN 62056-53,
EN 62056-61,
EN 62056-62.
Gas Natural Fenosa: Main Functions of Electricity Smart Meters (single and three phases) Single phase and three phase meter have identical main functionalities.
SINGLE PHASE THREE PHASE
Frequency for reading Daily
Active energy measurement Bi-directional

Work Package: WP2
Type of document: Deliverable
Date: 01/11/113
Energy Theme; Grant Agreement No 308794
Title: ANALYSIS OF SMART-METERING PROJECTS
Version: 2.0 Page: 83 / 118
Project Funded by the European Commission under the 7th Framework Programme
Reactive energy measurement Detected in 4 quadrants
Number of annual tariff programs that can be programmed
12 seasons
Number of weekly tariff programs that can be programmed for each annual program
n.a.
Number of daily tariff programs that can be programmed for each weekly tariff programs
10 day types
Number of daily tariff intervals that can be programmed
6 tariffs (6 TOU)
Possibility to remotely manage supplying contracts
Yes
Possibility to locally manage supply contracts
Yes
Load control support
It supports load control.
The curve is compliant with UNE 20317:
≤ 1,1 times: no tripping
1,5 times: 675-900 seconds
2,475 times: 90-120 seconds
>95 Amps: no tripping
Reconnection by measurement of impedance of the load circuit (if opened, the breaker reconnects).
The meter record events in an event lo log
List of monitored parameters
How information can be accessed
There are 6 different stacks (standard events, disconnect control, quality, fraud, demand management and frequent occurrence events)
Record of information about power outages and quality of supply
Yes
Presence of demand management feature implemented
An additional set point for the demand control (residual power), with activation by an order.
Presence prepayment management No at the moment

Work Package: WP2
Type of document: Deliverable
Date: 01/11/113
Energy Theme; Grant Agreement No 308794
Title: ANALYSIS OF SMART-METERING PROJECTS
Version: 2.0 Page: 84 / 118
Project Funded by the European Commission under the 7th Framework Programme
implemented
Local interfaces Optical port (9600 bauds) for field operations by the DSO.
Possibility to remotely download firmware
Yes
3.4.3.2 Economic analysis of the solution deployed
Costs & Benefits No available data Supply Chain
SC of the Project in Progress:
SC MACRO TIER
RESPONDENT SUPPLIERS BELONGING
TO THE GROUP OTHER
SUPPLIERS COST PER
UNIT
Manufacturing X
Logistics X
Installation X
Maintenance X
Data Comm. X X
Data Management
n.a. n.a. n.a.
The project in progress is being deployed by means of no Supply Chain (SC) vertical integration. Among the 6 main necessary macro-tiers (Manufacturing and assembly, Logistics, Installation, Maintenance, Data Communication, Data Management), 5 are performed (Data Management is currently not performed, yet), 4 out of 6 (Manufacturing and assembly, Logistics, Installation, Maintenance) are only performed from suppliers not belonging to the group, and 1 out of 6 (Data Communication) is performed by both suppliers belonging to the group and supplier not belonging to. As far as it concerns the costs related to each macro-tier within the project in progress, no information is provided.
SC of the Roll-out:

Work Package: WP2
Type of document: Deliverable
Date: 01/11/113
Energy Theme; Grant Agreement No 308794
Title: ANALYSIS OF SMART-METERING PROJECTS
Version: 2.0 Page: 85 / 118
Project Funded by the European Commission under the 7th Framework Programme
SC MACRO TIER
RESPONDENT SUPPLIERS
BELONGING TO THE GROUP
OTHER SUPPLIERS COST
PER UNIT
Manufacturing 5; also supplying
competitors; LT BSR
Logistics 1; also supplying
competitors; LT BSR
Installation 10; also supplying
competitors; LT BSR
Maintenance 10; also supplying
competitors; LT BSR
Data Comm. 1; not supplying
competitors
Data Management
1; not supplying
competitors
The SC for the future roll-out is expected to be the slightly different (and more precisely defined) from the one in progress. As for Manufacturing, Installation and Maintenance, multiple suppliers also supplying competitors, with long-term BSR, will be used. As for Logistics, a single supplier also supplying competitors, with long-term BSR, will be used. As for Data Communication, only the supplier belonging to the group will be used, as well as for Data Management, not supplying competitors. As far as it concerns the costs related to each macro-tier within the roll-out, no information is provided.
3.4.3.3 Customer involvement
Gas Natural Fenosa has made use of the traditional mailing method in order to communicate the date of installation and the characteristics of the new meters. At the moment there are no special communication initiatives. From their point of view no problems have been identified regarding consumer acceptance. At the moment GNF is involved in an innovative project called PRICE, which will also involve the consumer http://www.priceproject.es/, but at the moment there is no publicly available progress. The main objective of the project is to offer innovative, public, open and standardized technological solutions in order to facilitate interoperability and competitiveness. Current status of installation and use of smart metering The rollout is at 19% installation out of the approximate 3,6 million customers (residential 90%, commercial and industrial 10%).

Work Package: WP2
Type of document: Deliverable
Date: 01/11/113
Energy Theme; Grant Agreement No 308794
Title: ANALYSIS OF SMART-METERING PROJECTS
Version: 2.0 Page: 86 / 118
Project Funded by the European Commission under the 7th Framework Programme
Vulnerable customer focus The customers with special needs ex. patients on life support machines don’t have any limit on power usage. Opt out focus For this project the information is missing as the overall results are not available yet.
3.4.3.4 Other advanced solutions enabled by smart meters
Impact on distribution network operation Gas Natural Fenosa Smart Metering deployment has two main impacts on Distribution Management Systems, depending on the data sending frequency:
- Real-time data impacts on MV and LV monitoring, fault detection in MV, LV feeder monitoring, events and alarms in LV and MV grid, and automation and real-time control of the power grid.
- Off-line data helps to improve quality of supply (under voltage, overvoltage, harmonics, overload conditions), MV and LV management (loss control, imbalances, phase mapping, feeder-customer assignment), asset management, load flow control, impact on electric vehicle, DER impact, MV and LV network configuration.
Core of the EV charging infrastructure The experience in some smart charging pilots, such as PRICE Project, is that the charging post includes a smart meter to manage the charge in low rate. However, it is not a standardized solution by the moment. Support of Distributed Generation GNF´s meter configuration enables the measurement of energy produced by producers/prosumers, using different schemes of rates for importation and exportation (two tariff rates for importations, and one for exportation). Capacity of enabling Demand Response Gas Natural Fenosa´s smart metering system implements some foreseen features for Demand Response:
- Interval metering for any type of consumer/prosumer/producer - An overload alarm is performed, transmitting a message to the DC, or closing a relay
locally

Work Package: WP2
Type of document: Deliverable
Date: 01/11/113
Energy Theme; Grant Agreement No 308794
Title: ANALYSIS OF SMART-METERING PROJECTS
Version: 2.0 Page: 87 / 118
Project Funded by the European Commission under the 7th Framework Programme
- 6 TOU tariffs available for importation and exportation, with power limitation - Residual power functionality with remote activation
Regarding consumer interfaces, Gas Natural Fenosa, as a DSO, does not focus on this issue, because the communication with the client cannot be performed by a DSO. However, some solutions are being tested in pilot projects, including web interface, smartphone applications, etc. The company has not yet conducted any market test to evaluate the impact of the metering solutions. Gas Natural Fenosa is also participating in a national project to promote energy efficiency of end consumers. PRICE-GDE main objectives are to test customer interfaces for meter data, such as web, smartphones and dedicated displays, and testing Active Demand Management strategies by energy boxes, which control smart appliances. A demonstration of smart charge of EV is also foreseen. The project is both technical and social; on one hand, new DSM technology and IT systems will be developed and tested, and on the other hand, customer response, acceptance of solutions and effect in energy efficiency will also be tested. The National Regulatory Authority has carried out few initiatives to promote demand response. By the moment, only Time of Use tariffs are implemented, so customers can contract up to three rates. Other advanced metering solutions Gas Natural Fenosa is testing a gas metering solution which uses the electricity metering infrastructure. Some pilots have been carried out in laboratory, but there is still no experience in a real environment.
3.4.4 HC Energia
The HC Distribución Eléctrica smart meter project has started in 2009 and it is expected to finish the deployment phase in 2018. At current time it involves about 729.000 customers, 97% of which are residential. In case of roll-out it is foreseen that by 2018 there will be 728.000 meters installed. The average contractual power is 5,23 kW, while the average residential yearly consumption is 4047 kWh.

Work Package: WP2
Type of document: Deliverable
Date: 01/11/113
Energy Theme; Grant Agreement No 308794
Title: ANALYSIS OF SMART-METERING PROJECTS
Version: 2.0 Page: 88 / 118
Project Funded by the European Commission under the 7th Framework Programme
Overview of the Power Grid
Yearly energy distributed (TWh) 8,982
HV,MV and LV voltage levels 132-50-20-16-0,42 kV
Number of HV/MV substations; 63
Number of MV/LV substations; 7100
Average residential contractual power (KW) 5,23
Average residential yearly consumption (KWh) 4047
3.4.4.1 Technological analysis of the solution deployed
HC Energia: AMI Architecture The solution is based in PRIME PLC technology. The main component are: the smart meters, the data collectors (installed in transformer center) and the head end system. The head end system communicates with the meters through RTC or GSM and it is only for meter reading. The data collector can manage until 1.000 meter and it is installed in the transformer center. The interfaces WAN are mainly G3 and cable. The interface LAN is PLC PRIME. The remote synchronization is realized for the head end system. For sending alarms it is possible to push and pull mechanisms, depending on the priority of the alarm. The time depends on the quality and type of canal of communication and it can be of the order of minutes. The self-consumption of the data collector is below 10 VA and it is interoperable with phase-to-phase and phase-to-neutral systems. The adopted communication solution allow more than 99% of reading success rate and more than 99% success rate of load profile acquisition. The data requested in each reading operation consists:
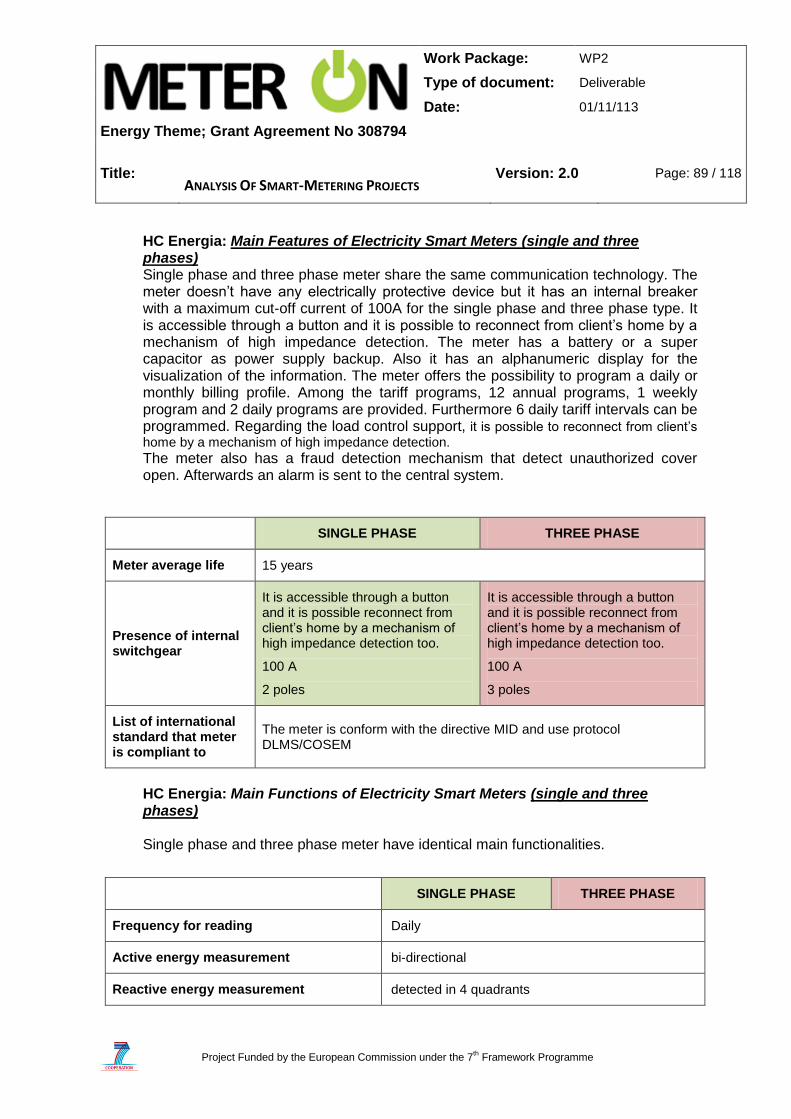
Work Package: WP2
Type of document: Deliverable
Date: 01/11/113
Energy Theme; Grant Agreement No 308794
Title: ANALYSIS OF SMART-METERING PROJECTS
Version: 2.0 Page: 89 / 118
Project Funded by the European Commission under the 7th Framework Programme
HC Energia: Main Features of Electricity Smart Meters (single and three phases) Single phase and three phase meter share the same communication technology. The meter doesn’t have any electrically protective device but it has an internal breaker with a maximum cut-off current of 100A for the single phase and three phase type. It is accessible through a button and it is possible to reconnect from client’s home by a mechanism of high impedance detection. The meter has a battery or a super capacitor as power supply backup. Also it has an alphanumeric display for the visualization of the information. The meter offers the possibility to program a daily or monthly billing profile. Among the tariff programs, 12 annual programs, 1 weekly program and 2 daily programs are provided. Furthermore 6 daily tariff intervals can be programmed. Regarding the load control support, it is possible to reconnect from client’s
home by a mechanism of high impedance detection. The meter also has a fraud detection mechanism that detect unauthorized cover open. Afterwards an alarm is sent to the central system.
SINGLE PHASE THREE PHASE
Meter average life 15 years
Presence of internal switchgear
It is accessible through a button and it is possible reconnect from client’s home by a mechanism of high impedance detection too.
100 A
2 poles
It is accessible through a button and it is possible reconnect from client’s home by a mechanism of high impedance detection too.
100 A
3 poles
List of international standard that meter is compliant to
The meter is conform with the directive MID and use protocol DLMS/COSEM
HC Energia: Main Functions of Electricity Smart Meters (single and three phases) Single phase and three phase meter have identical main functionalities.
SINGLE PHASE THREE PHASE
Frequency for reading Daily
Active energy measurement bi-directional
Reactive energy measurement detected in 4 quadrants

Work Package: WP2
Type of document: Deliverable
Date: 01/11/113
Energy Theme; Grant Agreement No 308794
Title: ANALYSIS OF SMART-METERING PROJECTS
Version: 2.0 Page: 90 / 118
Project Funded by the European Commission under the 7th Framework Programme
Number of annual tariff programs that can be programmed
12
Number of weekly tariff programs that can be programmed for each annual program
1
Number of daily tariff programs that can be programmed for each weekly tariff programs
2
Number of daily tariff intervals that can be programmed
6
Possibility to remotely manage supplying contracts
Yes
Possibility to locally manage supply contracts
yes
Load control support Yes, is possible to reconnect from client’s home by a mechanism of high impedance detection
The meter record events in an event lo log
List of monitored parameters
How information can be accessed
Yes, The events are read daily for the data collector
Record of information about power outages and quality of supply
Yes, interruptions and overvoltages/undervoltages
Presence of demand management feature implemented
It is possible to modify the power
Presence prepayment management implemented
No
Local interfaces The meter has an optical port for programming and reading local
Possibility to remotely download firmware
Yes

Work Package: WP2
Type of document: Deliverable
Date: 01/11/113
Energy Theme; Grant Agreement No 308794
Title: ANALYSIS OF SMART-METERING PROJECTS
Version: 2.0 Page: 91 / 118
Project Funded by the European Commission under the 7th Framework Programme
3.4.4.2 Economic analysis of the solution deployed
Costs & Benefits
Completed project
Cost Category Detailed Cost Actor
Incurring Cost
%
In premise cost
Meters (€) DSO 58,75%
Installation of Meters (€) DSO 20,00%
Communications equipment in premise (if applicable; e.g. WAN communication module) (€)
DSO 5,00%
Subtotal
83,75%
Field devices costs
Data collectors (€) DSO 9,38%
Installation of data collectors (€) DSO 6,88%
Subtotal
16,25%
Other Costs
Disposal (€) DSO -
Stranding costs (costs incurred when a meter is taken out of service before the end of its expected economic life) (€)
DSO -
Total
100%
The first aim of the analysis is to simplify data regarding main costs and benefits coming from the questionnaire. Considering the structure of the questionnaire’s section dedicated to costs and benefits, we aim at resuming results using a classification of costs and benefits consistently with their nature; M€/year or M€ without changing totals, in an effort to provide unbiased information. The mentioned macro categories, yearly (M€/year) and unit of money (M€), are mostly allocable to opex and capex; however some exceptions may occur. In premise cost covers 83,75% of total costs (M€), this share is in line with the average of all presented cases which is nearly 80%. The percentage of field devices costs is 16,25%, whilst data communication infrastructure represents 0% as other costs.

Work Package: WP2
Type of document: Deliverable
Date: 01/11/113
Energy Theme; Grant Agreement No 308794
Title: ANALYSIS OF SMART-METERING PROJECTS
Version: 2.0 Page: 92 / 118
Project Funded by the European Commission under the 7th Framework Programme
Cost Category Detailed Cost Actor
Incurring Cost
%
In premise cost Operation and maintenance of meters (€/year) DSO 66,67%
Field devices costs Operation and maintenance of data collectors (€/year) DSO 33,33%
Total
100%
Provided that detailed values are available in the corresponding table, onDSOe may note that in premise cost are around 66,67% of M€/year, field device cost sums to 33,33%: no other costs are considered.
Business benefits correspond to 100% of M€/year; precisely 85,71% labelled as reduction of meter reading and operations cost whereas 14,29% labelled as reduction of operations and maintenance cost.
Benefit Category Detailed Benefit Beneficiary %
Business Benefits
Reduction of meter reading and operations cost (reading, billing, customer care) (€/year)
n.a. 85,71%
Reduction of operations and maintenance cost (assets and equipment breakdowns) (€/year)
DSO 14,29%
Total
100%

Work Package: WP2
Type of document: Deliverable
Date: 01/11/113
Energy Theme; Grant Agreement No 308794
Title: ANALYSIS OF SMART-METERING PROJECTS
Version: 2.0 Page: 93 / 118
Project Funded by the European Commission under the 7th Framework Programme
Full roll-out
Cost Category Detailed Cost Actor
Incurring Cost
%
In premise cost
Meters (€) DSO 59,33%
Installation of Meters (€) DSO 20,00%
Communications equipment in premise (if applicable; e.g. WAN communication module) (€)
DSO 5,00%
Subtotal
84,33%
Field devices costs
Data collectors (€) DSO 9,00%
Installation of data collectors (€) DSO 6,67%
Subtotal
15,67%
Total
100%
The first aim of the analysis is to simplify data regarding main costs and benefits coming from the questionnaire. Considering the structure of the questionnaire’s section dedicated to costs and benefits, we aim at resuming results using a classification of costs and benefits consistently with their nature; M€/year or M€ without changing totals, in an effort to provide unbiased information. The mentioned macro categories, yearly (M€/year) and unit of money (M€), are mostly allocable to opex and capex; however some exceptions may occur. In premise cost covers 84,33% of total (M€), this share is slightly above the average of all presented cases which is nearly 80%. The share of field devices costs is 15,67%, whilst neither data communication infrastructure nor other costs are included.
Cost Category Detailed Cost Actor
Incurring Cost
%
In premise cost Operation and maintenance of meters (€/year) DSO 57,14%
Field devices costs Operation and maintenance of data collectors (€/year) DSO 28,57%
Data communication infrastructure
Opex (€/year) DSO 14,29%
Total
100%

Work Package: WP2
Type of document: Deliverable
Date: 01/11/113
Energy Theme; Grant Agreement No 308794
Title: ANALYSIS OF SMART-METERING PROJECTS
Version: 2.0 Page: 94 / 118
Project Funded by the European Commission under the 7th Framework Programme
Provided that detailed values are available in the corresponding table, one may note that in premise cost are around 57,14% M€/year, field device cost sum to 28,57%, data communication infrastructure 14,29% where no other costs are listed.
Supply Chain
SC of the Project in Progress (already roll-out):
SC MACRO TIER
RESPONDENT SUPPLIERS
BELONGING TO THE GROUP
OTHER SUPPLIERS COST
PER UNIT
Manufacturing 4; also supplying
competitors; ST BSR
Logistics X
Installation 4; also supplying
competitors; ST BSR
Maintenance X
Data Comm. 1; also supplying
competitors; LT BSR
Data Management
X
The project (already roll-out) in progress is being deployed by means of a relevant Supply Chain (SC) vertical integration. Among the 6 main necessary macro-tiers (Manufacturing and assembly, Logistics, Installation, Maintenance, Data Communication, Data Management), 3 out of 6 (Logistics, Maintenance, Data Management) are performed internally. As for the other macro-tiers, all of them (3 out of 6: Manufacturing, Installation, Data Communication) are performed from multiple (Manufacturing and Installation) or single (Data Communication) suppliers not belonging to the group, with different BSR in place (short-term for Manufacturing and Installation, where the contracts last up to 2 years, and long-term for Data Communication, where the contracts last up to 3 years). As far as it concerns the costs related to each macro-tier within the project in progress, no information is provided.
3.4.4.3 Customer involvement
Information by letter is sent to the customers explaining the new advantages of the meters and complementary information included in the official web of the company (customer page).

Work Package: WP2
Type of document: Deliverable
Date: 01/11/113
Energy Theme; Grant Agreement No 308794
Title: ANALYSIS OF SMART-METERING PROJECTS
Version: 2.0 Page: 95 / 118
Project Funded by the European Commission under the 7th Framework Programme
HC Energia is also currently involved in the Working Groups created for the NRA. As the separation between distributors and selling activities is complex, performing studies or survey on smart metering usage and their empowerment needs to be done with the participation of the regulator. All this activities are now in discussion between the companies and regulator. Current status of installation and use of smart metering The rollout is at 23% installation out of the approximate 729.000 customers (residential 97%, commercial and industrial 3%). Vulnerable customer focus No initiatives to this regard Opt out focus No cases detected yet.
3.4.4.4 Other advanced solutions enabled by smart meters
Impact on distribution network operation The impact of Smart Metering deployment on Distribution Management Systems is, in the short term, related to planning and load flow calculations in MV networks, based on the load profile information gathered by the meters. In the medium and long term, advanced functions are expected to be analyzed, such as distribution transformer management, DER integration, fraud detection and losses detection. Regarding network planning, it is expected to have a strong impact, basing the planning of MV network on the consumers’ real data. Smart metering systems will also improve network maintenance, reducing incidents by a higher observability of the network and abnormal losses detection. In order to reduce technical and non technical losses, these systems provide an energy balance between transformer delivered energy and customer consumption. Quality of supply will also be improved, by means of recorded measures of the power signal: amplitude, frequency, and so on. Core of the EV charging infrastructure The relation between EV charging infrastructure and Smart Metering is not clear for HC. Obviously, not only will consumption be measured with Smart Meters, but also other synergies are expected to appear. Support of Distributed Generation Regarding DER, HC stands that the information about power flows in producers/prosumers should be sent to SCADA systems, in order to maintain the balance between generation and consumption and improve network management.

Work Package: WP2
Type of document: Deliverable
Date: 01/11/113
Energy Theme; Grant Agreement No 308794
Title: ANALYSIS OF SMART-METERING PROJECTS
Version: 2.0 Page: 96 / 118
Project Funded by the European Commission under the 7th Framework Programme
Capacity of enabling Demand Response HC´s Demand Response foreseen features are:
- Analogical display on board: easy visualization of consumption - Access via Internet to daily/hourly consumptions: energy profiles
Energy efficiency and active participation of end users, as well as Demand Response demonstration projects, are not developed by HC currently, but the Distribution System Operator plans to carry them out in the future. Other advanced metering solutions By the moment, HC is not planning to develop other advanced metering solutions for heat, water, or gas.
Conclusions on Spain In June 2006 legislation was in place that from July 2007 all meters to be installed in new homes should have the characteristics of a smart meter. One year later the mandate on a massive replacement scheme was approved establishing the commitment of installing 35% of the smart meters by December 2014 and to reach 100% by the end of 2018. In Spain customers can choose to own the meter or rent it from DSO or meter operator or retailer. DSO is obliged to offer the meter, and, if the customer accepts, the DSO can only charge the approved by Government meter rental fee. The approved rental fee comprises the meter asset, plus installation, plus operation and maintenance, plus official metrology exams. The DSO is responsible to read the meter every 2 months and provide meter readings to the retailers. Spain has four dominant companies on the generation and supply markets: Endesa, Iberdrola, HC Energia and Gas Natural Fenosa. All of them have replied to the questionnaire. In Spain the average contractual power depends on DSO, and can vary from 3kW to 5kW, whils the average yearly consumption fall between 3300kWh and 4100kWh. The most used communication technology in Spain is based on PLC, but different communication protocol are used (Meters and More, Prime, and DLMS-COSEM). The budgets for the projects are all entirely financed by the DSOs and the amount depends on the scale of the project. The customers involvement is usually done by an informative letter and a web portal. The main benefits of the smart metering infrastructures regard a better monitoring of the grid, with the aim of improve the quality of the service, and the operativity of the grid itself, and to get better scheduled maintenance and the upgrading of the grid

Work Package: WP2
Type of document: Deliverable
Date: 01/11/113
Energy Theme; Grant Agreement No 308794
Title: ANALYSIS OF SMART-METERING PROJECTS
Version: 2.0 Page: 97 / 118
Project Funded by the European Commission under the 7th Framework Programme
With regard to the advanced topic, all Spain’s projects are planning a better integration of the distributed energy resources and a way to manage the demand response.
The EVs integration is not taken into account by all the projects, but in one case is in study a possible V2G strategy. Also, Spain doesn’t seem to be interested in multi-metering solutions
3.5 Portugal
Regulatory framework and market overview
National Regulation on smart meter
At present there is no regulation related to the rollout of smart meters, but the Portuguese NRA - Entidade Reguladora dos Servicos Energéticos – ERSE has put forward in December 2007 the proposal with the minimum requirements and a substitution plan for energy meters from 2010 – 2015.
In Portugal the market is already unbundled having the TSO – REN - and DSO as independently regulated companies. As for responsibilities on metering the DSO – EDPD - is responsible for installation, maintenance, reading, ownership and the customer owns the meter data.
Portugal’s electricity market is a part of MIBEL – the Iberian Electricity Market which is composed with representatives from Portugal: Energy Services Regulatory Authority (ERSE) and the Securities Market Commission (CMVM) and representatives from Spain: National Energy Commission (CNE) and National Securities Market Commission (CNMV). This initiative has proven to be quite successful for the Iberian Electricity Market but also it has been a significant endeavour in supporting the European Internal Energy Market.
The NRA has performed a CBA (available only in Portuguese http://www.erse.pt/pt/consultaspublicas/consultas/Documents/40_1/Contadores_Inteligentes_eletricidade_gas_CPublica_15052012.pdf) from which some main ideas come out:
consumers capture the highest share of benefits mainly due to energy savings
(2% assumed);
all other players have a negative impact (retailers, DSOs, TSOs, Others);
but overall quite positive.
Distributors and customers shares for each distributor In Portugal EDP Distribuição is the only DSO as it was reinforced in 2006, after the license held by EDP Distribuição under the Old Electricity Framework was converted into a exclusive concession agreement. The approximate number of customers is 6,1 million.
Distributors replying to the questionnaire

Work Package: WP2
Type of document: Deliverable
Date: 01/11/113
Energy Theme; Grant Agreement No 308794
Title: ANALYSIS OF SMART-METERING PROJECTS
Version: 2.0 Page: 98 / 118
Project Funded by the European Commission under the 7th Framework Programme
For this country analysis one DSO has replied.
3.5.1 EDP Distribuição
The first stage of EDP smart meter project has started in Q4 2007 and it’s finished in Q4 2011, while the second stage has started in Q4 2011 and it’s still ongoing (about 5%). It involves 30000 customers in the first stage and 100000 customers in the second stage, 99% of which are residential and 1% commercial, that correspond at 1.5% of the total customer of EDP. The average contractual power is 6.59 kVA while the average residential yearly consumption is around 3000 kWh.
Overview of the Power Grid
Yearly energy distributed (TWh)
273 GWh
HV,MV and LV voltage levels
HV – 60 kV
MV – 30kV, 15 kV and 10 kV
LV – 400 V/ 3x230V
Number of HV/MV substations;
2
Number of MV/LV substations;
503
Average residential contractual power (KW)
Around 6,59 kVA
Please mind that the admissible values of contracted power are arranged by levels. The available levels for residential customers are the following: 1.15, 2.3, 3.45, 4.6, 5.75, 6.9, 10.35, 13.8, 17.25, 20.7, 27.6, 34.5 and 41.4 kVA.
Average residential yearly consumption (KWh)
Around 3000k kWh
3.5.1.1 Technological analysis of the solution deployed
EDP Distribuição: AMI Achitecture The architecture of the remote meter management system is showed in the following picture

Work Package: WP2
Type of document: Deliverable
Date: 01/11/113
Energy Theme; Grant Agreement No 308794
Title: ANALYSIS OF SMART-METERING PROJECTS
Version: 2.0 Page: 99 / 118
Project Funded by the European Commission under the 7th Framework Programme
Figure 5: EDP AMI
The EDP AMI includes the following set of interconnected devices:
EDP Boxes (EB, as we call the smart meters): devices installed at consumers/producers (including modules for measuring, actuation, processing, interface, communication, etc.). It’s a gateway to energy management and includes the functions of smart metering;
Distribution Transformer Controller (DTC): local control equipment installed in MV/LV substations (one per each MV/LV transformer) to perform automation functions for the distribution transformer, collect information from EDP Boxes and send it to the upstream systems;
Grids/Communications: equipment and technologies for information transmission. There are 3 different levels of communication to be considered:
o WAN (Wide Area Network) – allows communication between the DTCs and the Information Systems (both technical and commercial). Also used for direct communication between the Information Systems and some specific EDP Boxes (e.g.: using GPRS technology). The main communication technology used at this level is GPRS;
o LAN (Local area Network) – allows communication between the DTC and EDP Boxes connected to its LV network. The main communication technology used at this level is PLC;
o HAN (Home area Network) – allows interaction between EDP Boxes and specific local devices (in-home devices, etc);
Information Systems: systems and applications for management and central data processing. A high level of integration with legacy systems have been achieved, as business processes were updated to take advantage of the smart metering infrastructure.

Work Package: WP2
Type of document: Deliverable
Date: 01/11/113
Energy Theme; Grant Agreement No 308794
Title: ANALYSIS OF SMART-METERING PROJECTS
Version: 2.0 Page: 100 / 118
Project Funded by the European Commission under the 7th Framework Programme
The DTC is installed in the MV/LV substation – one per each MV/LV tranformer – and can manage up to 1000 smart meters. The DTC communicate via GPRS to the upstream systems, and via PLC to the EBs box. The communication between central systems and DTC is IP based (SNTP protocol), while is based on DLMS/COSEM for the communication between the DTC and the smart meters. The mechanism used to send alarms to central system depends on the type of data (or origin of data). Alarms related to MV/LV substation and are automatically sent to technical information system using IEC60870-5-104 protocol (push mechanism). Alarms and events related to smart meters are retrieved to the information system using a pull mechanism via Webservices and dlms/cosem. In this case, the time needed to get the alarm to the central system depends on the pooling frequency by the DTC (who collects data from the smart meters) and the data acquisition frequency from the central system (usually once a day). EDP Distribuição: Main Features of Electricity Smart Meters (single and three phases) Single phase and three phase meter share the same communication technology. The reading operation is performed on a daily base. The meter have an overcurrent protective device as well as an internal breaker which is compliant with IEC 62055-31 and it in not accessible from external. The Meter integrates an internal battery to operate real-time clock without main power supply. The autonomy of this battery is 5 years It has an internal alphanumeric display with 2 rows and 16 columns. The Meter implements a daily and a monthly billing profile. It also offer the possibility to control the load activating the secondary value of contracted
SINGLE PHASE THREE PHASE
Meter average life
20 Years
Presence of internal switchgear
Yes.
Bi-stable disconnection relay;
Not accessible from external.
There are 2 reconnection
mechanisms implemented:
o a) local reconnection
using push button
available in the smart
meter;
o b) meter detects
Yes.
Bi-stable disconnection relay;
Not accessible from external.
There are 2 reconnection
mechanisms implemented:
o a) local reconnection
using push button
available in the smart
meter;
o b) meter detects

Work Package: WP2
Type of document: Deliverable
Date: 01/11/113
Energy Theme; Grant Agreement No 308794
Title: ANALYSIS OF SMART-METERING PROJECTS
Version: 2.0 Page: 101 / 118
Project Funded by the European Commission under the 7th Framework Programme
impedance variation due
to operation over the
premises’ main switch
(used when the smart
meter is not inside
clients’ premises).
IEC 62055-31;
Maximum cut-off current = 80A
Single pole relay (2 poles relay to
be considered in the next stage of
the project)
impedance variation due
to operation over the
premises’ main switch
(used when the smart
meter is not inside
clients’ premises).
IEC 62055-31;
Maximum cut-off current = 80A
per phase
3x Single pole relay
List of international standard that meter is compliant to
EN 50470-1
EN 50470-3
IEC 62052-11
IEC 62053-23
IEC 62056-21
EDP Distribuição: Main Functions of Electricity Smart Meters (single and three phases) Single phase and three phase meter has identical main functionalities.
SINGLE PHASE THREE PHASE
Frequency for reading Daily
Active energy measurement
bi-directional
Reactive energy measurement
detected in 4 quadrants
Number of annual tariff programs that can be programmed
2
Number of weekly tariff programs that can be programmed for each annual
2

Work Package: WP2
Type of document: Deliverable
Date: 01/11/113
Energy Theme; Grant Agreement No 308794
Title: ANALYSIS OF SMART-METERING PROJECTS
Version: 2.0 Page: 102 / 118
Project Funded by the European Commission under the 7th Framework Programme
program
Number of daily tariff programs that can be programmed for each weekly tariff programs
6
Number of daily tariff intervals that can be programmed
Up to 144 (each 10 minutes)
Possibility to remotely manage supplying contracts
Yes
Possibility to locally manage supply contracts
Yes, using optical port interface
Load control support
Yes
Yes, by activating the secondary value of contracted power limit.
The algorithm intends to emulate the behavior of a
thermomagnetic circuit breaker, where:
o “Tdisp” is the tripping time;
o “Q” is a configurable parameter;
o “k” is configurable parameter related to the tolerance
considered on the load control;
o “Ic” is the rms value of the current corresponding to the
contracted power (or current limit power), for each
phase;
o “i(t)” is the value of instantaneous current, for each
phase.
There are 2 mechanisms available:
o Local reconnection using the push button of the smart
meter.
o Smart meter automatically detects impedance variation
due to operation over the premises’ main switch (used

Work Package: WP2
Type of document: Deliverable
Date: 01/11/113
Energy Theme; Grant Agreement No 308794
Title: ANALYSIS OF SMART-METERING PROJECTS
Version: 2.0 Page: 103 / 118
Project Funded by the European Commission under the 7th Framework Programme
when the smart meter is not inside clients’ premises).
The meter record events in an event lo log
List of monitored parameters
How information can be accessed
Yes, the smart meter record events in a specific event log.
Main monitored parameters: fraud detection (meter cover open and non-authorized access attempt); disconnection control status changed; tariff configuration; contracted power configuration; general parameters configuration; RTC synchronization; Power up/down total and per phase; QoS registers (thresholds configuration and registers); firmware update; alarms and errors occurrence; auxiliary supply charge status.
Event log information is accessed by the DTC during scheduled pooling tasks or on-demand.
Record of information about power outages and quality of supply
Yes
Presence of demand management feature implemented
Yes.
There is a secondary value of contracted power limit (lower than the primary contracted power) configured in the smart meter that can be activated.
Presence prepayment management implemented
No
Local interfaces
2 local interfaces available
Optical interface, according to IEC 62056-21, with baudrate of 9600 bps. Used for field operations purposes.
Electrical serial interface (RS485, RJ12) with baudrate of 9600 bps. Modbus protocol implemented. HAN interface.
Possibility to remotely download firmware
Yes
3.5.1.2 Economic analysis of the solution deployed
Costs & Benefits
Completed Project

Work Package: WP2
Type of document: Deliverable
Date: 01/11/113
Energy Theme; Grant Agreement No 308794
Title: ANALYSIS OF SMART-METERING PROJECTS
Version: 2.0 Page: 104 / 118
Project Funded by the European Commission under the 7th Framework Programme
Cost Category Detailed Cost Actor
Incurring Cost
%
In premise cost
Meters (€) DSO 72,90%
Installation of Meters (€) DSO 12,15%
In Home Displays (if applicable) Energy
supplier 1,09%
Subtotal
86,15%
Field devices costs
Data collectors (€) DSO 12,15%
Installation of data collectors (€) DSO 1,70%
Subtotal 13,85%
Total 100%
The first aim of the analysis is to simplify data regarding main costs and benefits coming from the questionnaire. Considering the structure of the questionnaire’s section dedicated to costs and benefits, we aim at resuming results using a classification of costs and benefits consistently with their nature; M€/year or M€ without changing totals, in an effort to provide unbiased information. The mentioned macro categories, yearly (M€/year) and unit of money (M€), are mostly allocable to opex and capex; however some exceptions may occur. In premise cost covers 86,15% of total costs (M€), the percentage of field devices costs is 13,85%, whilst data communication infrastructure represents almost 0%, as other costs.

Work Package: WP2
Type of document: Deliverable
Date: 01/11/113
Energy Theme; Grant Agreement No 308794
Title: ANALYSIS OF SMART-METERING PROJECTS
Version: 2.0 Page: 105 / 118
Project Funded by the European Commission under the 7th Framework Programme
Cost Category Detailed Cost Actor
Incurring Cost
%
In premise cost Operation and maintenance of meters (€/year) DSO 9,46%
Field devices costs Operation and maintenance of data collectors (€/year) DSO 6,31%
Data communication infrastructure
Opex (€/year) DSO 17,98%
Other cost
Marketing (€/year annual average) - 63,09%
Legal costs (€/year annual average) - 3,15%
Total 100%
Assuming that detailed values are available in the corresponding table, one may note that in premise cost are around 9,46% M€/year, field device cost sum to 6,31%, data communication infrastructure 17,98% where other costs correspond to 66,24%; marketing costs are relatively relevant as amount to 63,09% of other costs as a whole.
Full roll-out

Work Package: WP2
Type of document: Deliverable
Date: 01/11/113
Energy Theme; Grant Agreement No 308794
Title: ANALYSIS OF SMART-METERING PROJECTS
Version: 2.0 Page: 106 / 118
Project Funded by the European Commission under the 7th Framework Programme
Cost Category Detailed Cost Actor
Incurring Cost
%
In premise cost
Meters (€) DSO
70,36%
Installation of Meters (€) DSO
Subtotal
70,36%
Field devices costs
Data collectors (€) DSO
23,20%
Installation of data collectors (€) DSO
Subtotal
23,20%
Data communication infrastructure
Capex (€) DSO 6,44%
Subtotal
6,44%
Total 100%
The purpose of this paragraph is to simplify data regarding main costs and benefits coming from the questionnaire. Considering the structure of the questionnaire’s section dedicated to costs and benefits, we aim at resuming results using a classification of costs and benefits consistently with their nature; M€/year or M€ without changing totals, in an effort to provide unbiased information. The mentioned macro categories, yearly (M€/year) and unit of money (M€), are mostly allocable to opex and capex; however some exceptions may occur. In premise cost covers 70,36% of total costs (M€), this share is below the average of all presented cases which is close to 80%. The percentage of field devices costs is 23,20%, whilst data communication infrastructure is slightly below 7% ( 6,44%). No other costs are considered.

Work Package: WP2
Type of document: Deliverable
Date: 01/11/113
Energy Theme; Grant Agreement No 308794
Title: ANALYSIS OF SMART-METERING PROJECTS
Version: 2.0 Page: 107 / 118
Project Funded by the European Commission under the 7th Framework Programme
Cost Category Detailed Cost Actor
Incurring Cost
%
In premise cost Operation and maintenance of meters (€/year) DSO 14,18%
Field devices costs Operation and maintenance of data collectors (€/year) DSO 7,09%
Data communication infrastructure
Opex (€/year) DSO 56,74%
Other cost
Pavement reading inefficiency (€/year annual average) DSO 7,09%
Marketing (€/year annual average) Other 7,09%
Legal costs (€/year annual average) DSO 0,71%
Organizational costs (e.g. data protection, ongoing regulation, assurance, accreditation, tendering) (€/year annual average)
DSO 7,09%
Total 100%
Provided that detailed values are available in the corresponding table, one may note that in premise cost are around 14% M€/year, field device cost sum to 7%, data communication infrastructure 56,74% where other costs correspond to 22%.

Work Package: WP2
Type of document: Deliverable
Date: 01/11/113
Energy Theme; Grant Agreement No 308794
Title: ANALYSIS OF SMART-METERING PROJECTS
Version: 2.0 Page: 108 / 118
Project Funded by the European Commission under the 7th Framework Programme
Benefit Category Detailed Benefit Beneficiary %
Consumer Benefits
Energy Savings (€/year) (Calculated for 2 500 customers) Consumer 44,84%
Peak load transfer (€/year) Consumer 2,69%
Subtotal
47,53%
Business Benefits
Reduction of meter reading and operations cost (reading, billing, customer care) (€/year)
DSO 25,11%
Reduction of operations and maintenance cost (assets and equipment breakdowns) (€/year)
DSO 0,90%
Reduction in electricity technical losses (€/year) DSO, Other 8,97%
Reduction in commercial losses (thefts, frauds, …) (€/year) DSO, Other 15,25%
Reduction in outage times (thefts, frauds, …) (€/year) DSO, Other 1,79%
Subtotal
52,02%
Country-wide benefits
Global CO2 reduction (Ton CO2 and € if applicable) Other 0,45%
Subtotal
0,45%
Total 100%
Benefit Category Detailed Benefit Beneficiary %
Business benefits
Deferred transmission capacity investments (€) Other 16,67%
Deferred distribution capacity investments (€) DSO, Other 83,33%
Total 100%
Assessment of benefits and identification of beneficiaries require forward-looking statements. In this descriptive summary we classify benefits according to beneficiary’s category and, consistently with the costs section, M€/year against M€. About the total yearly benefits; consumers accounts for 47%; business add up to 52%; the remaining of M€/year are categorized as country-wide.
Finally, regarding business benefits, 83.33% fall into deferred distribution capacity investments, while 16,67% are comprised in deferred transmission capacity investments.

Work Package: WP2
Type of document: Deliverable
Date: 01/11/113
Energy Theme; Grant Agreement No 308794
Title: ANALYSIS OF SMART-METERING PROJECTS
Version: 2.0 Page: 109 / 118
Project Funded by the European Commission under the 7th Framework Programme
Supply Chain
SC of the Project in Progress:
SC MACRO TIER RESPONDENT SUPPLIERS
BELONGING TO THE GROUP
OTHER SUPPLIERS
COST PER UNIT
Manufacturing X; also supplying competitors; LT
BSR
Logistics X
Installation X; LT BSR
Maintenance X
Data Comm. X; LT BSR
Data Management X
The project in progress is being deployed by means of a relevant Supply Chain (SC) vertical integration. Among the 6 main necessary macro-tiers (Manufacturing and assembly, Logistics, Installation, Maintenance, Data Communication, Data Management), 3 out of 6 (Logistics, Maintenance, Data Management) are performed internally. As for the other macro-tiers (Manufacturing and assembly, Installation, Data Communication), they are performed from suppliers not belonging to the group. EDP always (3 out of 3, Manufacturing, Installation, Data Communication) buys from suppliers (in the case of Manufacturing, also supplying competitors) not belonging to the group, with long-term (LT) Buyer-Supplier Relationships (BSR) currently in place. As far as it concerns the costs related to each macro-tier within the project in progress, no information is provided.
SC of the Roll-out:
SC MACRO TIER RESPONDENT SUPPLIERS
BELONGING TO THE GROUP
OTHER SUPPLIERS
COST PER UNIT
Manufacturing
many; also supplying
competitors; ST>LT BSR
Logistics X

Work Package: WP2
Type of document: Deliverable
Date: 01/11/113
Energy Theme; Grant Agreement No 308794
Title: ANALYSIS OF SMART-METERING PROJECTS
Version: 2.0 Page: 110 / 118
Project Funded by the European Commission under the 7th Framework Programme
Installation >1; also supplying
competitors; LT>ST BSR
Maintenance X
Data Comm. X X
Data Management X
The SC for the future roll-out is expected to be the slightly different from the one in progress. As for the Manufacturing, an open market scenario is foreseen, so as many suppliers will be used, and only few cases of long-term (LT) BSR are thought. As for the Installation, more than 1 supplier will be used, generally with LT BSR against ST BSR. As for Data Communication, the respondent will perform the activity, not only buying it from a supplier, so as the vertical integration of the SC will increase. As far as it concerns the costs related to each macro-tier within the roll-out, no information is provided.
3.5.1.3 Customer involvement
The InovGrid project seems to have one of the best developed and strong communication plan involving local stakeholders and the general population (Evora Region).
Inovgrid performed studies regarding clients’ expectations about feedback on energy efficiency and satisfaction with the EDP Box installation:

Work Package: WP2
Type of document: Deliverable
Date: 01/11/113
Energy Theme; Grant Agreement No 308794
Title: ANALYSIS OF SMART-METERING PROJECTS
Version: 2.0 Page: 111 / 118
Project Funded by the European Commission under the 7th Framework Programme
At the moment a survey is being undertaken with over 1000 representative customers but no results are available yet. During the deployment, EDP has formed a dedicated team EGRI to ensure Customer Service quality and mitigate problems, as adaptation of action was needed to the increase in customers’ contacts.

Work Package: WP2
Type of document: Deliverable
Date: 01/11/113
Energy Theme; Grant Agreement No 308794
Title: ANALYSIS OF SMART-METERING PROJECTS
Version: 2.0 Page: 112 / 118
Project Funded by the European Commission under the 7th Framework Programme
Current status of installation and use of smart metering
Overall within the InovGrid (stage 1 and 2):
- VHV, HV and MV costumers: 99,9% [of approx. 24850] - Special LV costumers (connected to LV with installed power above 41,4 kVA): 96,5 % [of
approx. 33500]
- LV residential customers: 0,7 % (of approx. 6,1 million customers). Vulnerable customer focus According to the DSO for this type of project the impact on vulnerable or special needs customers is no different from other customers. Opt out focus
During the 1st stage of the project there were an opt out rate below 0,3% but a future approach still pending decision.
3.5.1.4 Other advanced solutions enabled by smart meters
Impact on distribution network operation The impact of Smart Metering deployment on EDP´s Distribution Management System leads to:
- Optimized operations (remote operations), such as remote configuration of tariff schemes, contracted power and remote connect and disconnect.
- Costs reduction due to avoiding (reducing) on-site operations – a significant amount of operation may be performed remotely (related to DTC – Distribution Transformer Controller – and smart meters)
- Faster response to requests where data collection or remote actuation over the infrastructure are required
- Real data (more often acquired and with significant detail) enable more exhaustive and complex analysis, in order to improve the management of the network. Namely: load profile, reactive energy, QoS events and registers
- Reduction of costs related to call centre/customers care
Regarding network planning, the improvement relays on the availability of real detailed data (load profiles, maximum demand registers), which enables a more efficient, accurate and cost effective network planning. This improvement leads to defer/avoid distribution capacity investments on the network. Current planning corporative tools are also being developed and updated, in order to use the real data collected from the smart grid infrastructure as inputs.

Work Package: WP2
Type of document: Deliverable
Date: 01/11/113
Energy Theme; Grant Agreement No 308794
Title: ANALYSIS OF SMART-METERING PROJECTS
Version: 2.0 Page: 113 / 118
Project Funded by the European Commission under the 7th Framework Programme
Smart metering system also reduces the costs related to maintenance operations, which are now performed remotely (related to DTC and smart meters). Having more detailed information about the distribution assets (meters, DTC and MV/LV transformers) reduces asset management costs and improves its performance. It also helps to faster fault detection/location and power restoration.
The impact on technical and non-technical losses is also remarkable. The reduction on technical losses is due to:
- Reduction of overall consumption and more efficient energy consumption management (energy efficiency)
- Measurement and compensation of reactive energy - Knowledge and capability to adapt voltage profiles - Phase balancing of LV network - Measurement of the impact of distributed generation in the LV network - Better knowledge of current energy consumption versus distributed energy (real data)
Non-technical losses are also reduced, due to:
- Detection of legacy frauds and connection errors during smart meter installation - Remote access to more and detailed data enhances the capability to detect fraud and
connection errors: consumption patterns analysis, energy balance at LV network level, automatic alarms (e.g.: meter cover open)
The higher observability of the power grid improves network reliability and quality of supply, meaning a reduction on the number and length of interruption periods, due to remote and centralized information and actuation capability. Therefore, costs related to client complaining are reduced.
At LV/MV substation level, the use of DTC:
- Improves supply voltage monitoring (waveform) - Improves continuity of supply monitoring - Permits outage events and alarms monitoring - Permits smart meter communication availability monitoring, in order to detect signs of
large interruptions of supply
At LV network and customers´ premises level, the effect is:
- The optimization of interruption detection - Quality of supply monitoring, using voltage load profiles
Core of the EV charging infrastructure EDP is installing smart meters along with the EV charging infrastructure, in order to provide valuable information for EV charging management, and enable accurate billing and future innovative services.

Work Package: WP2
Type of document: Deliverable
Date: 01/11/113
Energy Theme; Grant Agreement No 308794
Title: ANALYSIS OF SMART-METERING PROJECTS
Version: 2.0 Page: 114 / 118
Project Funded by the European Commission under the 7th Framework Programme
Support of Distributed Generation Currently, producers/prosumers´ energy measurement is regulated by Portuguese legislation, in which the producer/prosumer role is to acquire the meter and the GSM modem. The DSO role is to certify the meters that can be used by the producer/prosumer, to collect data from meters remotely, and to retrieve data for billing purposes. The meter configuration currently in use includes:
- Measurement accuracy, fulfilling the requirements of the meters used in residential customers
- Static meters - Bi-directional measurement - 15m Load profile for A+ and A- - Tariffs (two for A+ and two for A-) - Reactive energy measurement capability - Serial port - Compliant with DSO AMI system
Capacity of enabling Demand Response EDP´s Demand Response foreseen features are:
- HAN serial interface, enabling local communication with customers devices/appliances
- Detailed and often updated data available via HAN interface, such as interval data and instantaneous values: active/reactive energy and demand, voltage and power factor
- Demand management specific features: residual power threshold to use during active demand periods, critical and non-critical periods of demand management (only available for the next stage of the project), dedicated events
EDP is not currently developing initiatives to promote energy efficiency, active participation of end consumers, or demand response. However, the strategy is to have an open platform that allows market players to develop such innovative solutions, on top of the new information gathered through the infrastructure.
As EDP´s smart meter includes a HAN port, all customer interfaces are possible using different types of communications: wi-fi, zigbee, etc.

Work Package: WP2
Type of document: Deliverable
Date: 01/11/113
Energy Theme; Grant Agreement No 308794
Title: ANALYSIS OF SMART-METERING PROJECTS
Version: 2.0 Page: 115 / 118
Project Funded by the European Commission under the 7th Framework Programme
EDP has conducted several market tests to evaluate the potential impact of smart metering solution. In particular, information of energy efficient tests on selected customers is being collected to allow getting a final study presenting the results with consolidated data.
EDP is currently participating in EcoGrid, a European demand response project. More information is available on: http://www.eu-ecogrid.net/ In Portugal, the National Regulatory Authorities have not yet defined a regulatory framework for demand response activities, so there are no activities carried out. Other advanced metering solutions By the moment, EDP is not planning to develop other advanced metering solutions for heat or water, but they have on-going plans for a gas metering solution. They will be responsible for all the metering process (installation, maintenance, reading, management) but the manufacturing, which manufacturers will be responsible of. However, there is no on-going demonstration project yet. The National Regulatory Authorities has already done a study with KEMA to analyze multi-utility CBA for the Portuguese market. More information is available on: http://www.erse.pt/pt/consultaspublicas/consultas/Documents/40_1/Contadores_Inteligentes_eletricidade_gas_CPublica_15052012.pdf

Work Package: WP2
Type of document: Deliverable
Date: 01/11/113
Energy Theme; Grant Agreement No 308794
Title: ANALYSIS OF SMART-METERING PROJECTS
Version: 2.0 Page: 116 / 118
Project Funded by the European Commission under the 7th Framework Programme
The Regulatory Authorities are planning to fulfill the EC regulation by having 80% of meters changed in 2020, but the roll out pace has not yet been defined. The advanced metering solution for gas allows the provision of value added services, as it has a HAN interface to feed other applications that can provide value added services.
Conclusions on Portugal
At present there is no regulation related to the rollout of smart meters, but the Portuguese NRA - Entidade Reguladora dos Servicos Energéticos – ERSE has put forward in December 2007 the proposal with the minimum requirements and a substitution plan for energy meters from 2010 – 2015.
In Portugal only EDP has replied to the questionnaire.
The average contractual power is 6.59 kVA while the average residential yearly consumption is around 3000 kWh.
The budget for the project is about € 15M and is entirely financed by EDP.
The EDP project (InovGrid) seems to have one of the best developed and strong communication plan involving local stakeholders and the general population (Evora Region).
Inovgrid performed studies regarding clients’ expectations about feedback on energy efficiency and satisfaction with the EDP Box installation.
At the moment a survey is being undertaken with over 1000 representative customers but no results are available yet.
During the deployment, EDP has formed a dedicated team EGRI to ensure Customer Service quality and mitigate problems, as adaptation of action was needed to the increase in customers’ contacts.
The main benefits expected by EDP regard the operativity and the upgrade of the grid as well as the improvements of the quality of the service.
Regarding the advanced topic, EDP is planning to introduce new solution for the EVs integration and for the distributed energy resources.
EDP is not directly involved in demand response, leaving to other actor the possibility to sell this service.
Also EDP has a plan for the gas smart metering.
4 MAIN FINDINGS AND CONCLUSIONS
From the analysis of the 8 projects taken into account, it’s possible to extrapolate the following findings:

Work Package: WP2
Type of document: Deliverable
Date: 01/11/113
Energy Theme; Grant Agreement No 308794
Title: ANALYSIS OF SMART-METERING PROJECTS
Version: 2.0 Page: 117 / 118
Project Funded by the European Commission under the 7th Framework Programme
In every country except Portugal, there is a regulatory framework that states a roadmap for the smart metering. Only In Italy the DSO has deployed a smart metering solution in advance respect the directive of the regulatory framework
Projects differentiate themselves in term of number of customers’ involved, contractual power, and average yearly consumption, as well as the communication technology and communication protocol used. Even if, with regard to the last ones, it’s possible to find some general approach. In facts, the most used communication protocols are Meters and More, DLMS/COSEM, Prime and G3-PLC, all based on a very similar architecture. Also, the functions provided are similar too. The difference between projects is mainly in the maturity of the technology and in the number of meters already installed.
Regarding the methods of funding, all projects are funded by the DSO themselves in all countries, except in France where it’s publicly funded.
Focusing on the customers’ involvement, it is observed that in some cases companies running the smart metering projects adopted a clear strategy targeting the engagement of the end-users, but in other cases, it is clear how the focus was more on the technological side and how the customer was not involved at the early stage of implementation. The involvement of the customer is noted to be a complex point. Customers are expected to be engaged in these changes, but as some evidence shows, the information needs to be shared in a more accessible and understandable manner for them to do not see smart meters as a danger and to experience real benefits from their usage.
The main benefit brought by smart meters seems to be the possibility of a better monitoring of the network to improve the planning and maintenance of the grid and to improve the quality of supply. Also, DSOs are much interested to the possibility of a better integration of the distributed energy resources, and the EVs charging infrastructure. The possibility to implements some demand response strategy is also taken into account.
The smart metering of other commodity, typically gas, is in the plan of the half of the projects analysed.

Work Package: WP2
Type of document: Deliverable
Date: 01/11/113
Energy Theme; Grant Agreement No 308794
Title: ANALYSIS OF SMART-METERING PROJECTS
Version: 2.0 Page: 118 / 118
Project Funded by the European Commission under the 7th Framework Programme
Copyright
“Copyright and Reprint Permissions. You may freely reproduce all or part of this paper for non-commercial purposes, provided that the following conditions are fulfilled: (i) to cite the authors, as the copyright owners (ii) to cite the Meter-ON Project and mention that the European Commission co-finances it, by means of including this statement “Meter-ON. Energy Project No 308794. Funded by EC” and (iii) not to alter the information.”