Title: Market Structure, Profits, and Spreads in the ...
31
Centre for Global Finance Working Paper Series (ISSN 2041-1596) Paper Number: 09/09 Title: Market Structure, Profits, and Spreads in the Mexican Banking Industry Author(s): Georgios E. Chortareas Jesus G. Garza-Garcia Claudia Girardone Centre for Global Finance Bristol Business School University of the West of England Coldharbour Lane Bristol BS16 1QY Telephone: 0117 32 83906 Email: [email protected] Website: http://www.uwe.ac.uk/bbs/research/cgf/
Transcript of Title: Market Structure, Profits, and Spreads in the ...

Centre for Global Finance Working Paper Series (ISSN 2041-1596) Paper Number: 09/09
Title: Market Structure, Profits, and Spreads in the Mexican Banking Industry Author(s): Georgios E. Chortareas Jesus G. Garza-Garcia Claudia Girardone Centre for Global Finance Bristol Business School University of the West of England Coldharbour Lane Bristol BS16 1QY Telephone: 0117 32 83906 Email: [email protected] Website: http://www.uwe.ac.uk/bbs/research/cgf/
Market Structure, Profits, and Spreads in the Mexican Banking Industry
Georgios E. Chortareas* Department of Economics
University of Athens
Jesus G. Garza-Garcia** Bristol Business School
University of the West of England
Claudia Girardone*** Essex Business School
University of Essex
Forthcoming: Banks and Bank Systems
Abstract
In this paper we consider two market power theories (the Structure-Conduct-Performance, or SCP, and Relative Market Power, RMP) and the Efficient Structure (ES) hypothesis to characterise empirically the Mexican banking industry over 1996-2003 and then use a similar framework to investigate the determinants of interest rate spreads. To our knowledge, this is the first study to carry out such an analysis of net interest rate margins for the Mexican banking sector. Our results seem to give only weak support to the traditional SCP paradigm in Mexican banking but also uncover evidence of strong relationships between profitability and the banks’ capital ratios. Furthermore, we do not find evidence that concentration and market share are associated with high interest rate spreads, while our chosen proxy for inefficiency is found negatively and significantly related with both profits and spreads thereby giving support to the ES hypothesis. Overall our findings suggest that alternative models that include efficiency be pursued in future research on profits and spreads in Mexican banking. Keywords: Concentration; Profitability; Market Power; Interest Rate Spreads; Mexican Banks. JEL classification: G21; D21.
* Georgios E. Chortareas, Department of Economics, University of Athens, 8 Pesmazoglou Street, Athens 10559, Greece. Phone: +30-210-3689805. Email: [email protected], [email protected] ** Jesus G. Garza-Garcia, University of the West of England, Coldharbour Lane, Bristol, BS1 1QY. [email protected] *** Claudia Girardone, Essex Business School, University of Essex, Wivenhoe Park, Colchester, CO4 3SQ, Tel. +44(0) 1206 87 4156 or email: [email protected].

2
Market Structure, Profits, and Spreads in the Mexican Banking Industry
1. Introduction
Following the 1995 financial crisis, important structural changes have shaped the
Mexican banking sector due to an intense deregulation and consolidation processes. Among
other reforms, the authorities implemented measures to guarantee a sound level of competition
and ensure the recapitalisation of the banking system.1 Soon after the crisis, the government
took over 15 banks, while at the same time the number of foreign banks has increased
dramatically. By the new millennium, foreign banks had acquired a significant stake of the
Mexican market controlling the largest and third largest financial groups, and managing almost
half of the banking systems’ assets, capital and outstanding loans.2
Despite these changes over recent years the concentration levels in the Mexican banking
sector have increased mainly as a result of many banks’ urge to merge. This in turn has raised
concerns about the potential implications in terms of banks’ conduct and behavior on the
market structure as well as for consumers’ welfare. Mergers and Acquisitions (M&As)
activities in Mexico are monitored by the Federal Competition Commission (the Comision
1 An example of such measures includes the substitution of the full coverage of deposits by the deposit insurance
agency with a limited scheme that has adopted stricter rules. 2 See Yacaman (2001) for a detailed discussion.

3
Federal de Competencia, or CFC) that typically uses the HHI (Herfindahl-Hirschmann Index)
to evaluate possible concentration problems in the industry.3
In 1996-2003 a relatively small number of large M&A operations has decreased the
total number of banks in the system by 22% while the HHI has risen by 29%.
4 Over the same
period the banking sector benefited from a positive trend in ROAA (Return On Average Assets)
with average values of 1.2% and a net increase by 2.7% for 1996 to 2006. Such developments
were also accompanied by a decrease in the cost-to-income ratio by 0.05%.5
Furthermore, Mexican banks have continued benefiting from relatively high interest rate
spreads (i.e. the difference between loan and deposit rates) in the order of 6.7% over the 1996
to 2003 period. Indeed Mexican banks have a long tradition of high interest rate spreads: over
1980-87, the spread was 15.8 points compared with the average of 6.8 in other Latin American
countries (see Morris et al. 1990). Possible collusion effects among banks were often deemed to
be a likely cause of such high spreads as argued for example by Trigueros (1995). However
Brock and Suarez (2000) recently found that different micro and macro factors may have
contributed to high interest rate spreads in Latin America and these tend to vary significantly
3 The HHI is the Herfindahl-Hirschmann Index that is calculated as the sum of squared market shares ( iα ) of the
banks operating in an industry:∑=
n
ii
1
2α . The CFC also uses the Dominance Index (DI) that is a variation of the
HHI and can be calculated as follows: 4 2
1
n
ii
DI HHIα=
=∑ . The condition under which the CFC considers that a
merger will not alter the competition structure is one of the following: the HHI is less than 2000 points; the
increase in HHI is less than 75 points; the DI decreases or its value is less than 2500 points. 4 The largest M&As that took place in Mexico over 1996-2003 were between Citibank and Banamex, BBVA and
Bancomer, HSBC and Bital, Bank of Nova Scotia and Inverlat, and Santander and Serfin. 5 Authors’ calculations using the Bankscope database.

4
across countries. In a recent study on European emerging markets in Central and Eastern
Europe, Claeys and Vander Vennet (2003) suggest that among the most significant variables
determining interest rate spreads are: incentives to restrict competition, operational
inefficiencies and severe informational asymmetries.
Consequently, an emerging question is whether banking profitability can be better
explained in terms of market power or in terms of enhanced efficiency. The first aim of this
paper is to address this issue by testing two market power theories (the Structure-Conduct-
Performance, or SCP, and Relative Market Power, RMP) and the Efficient Structure
Hypothesis (ES); and then to use a similar framework to investigate the determinants of interest
rate spreads. The SCP is commonly used to test the hypothesis that high concentration in a
banking industry lowers the cost of collusion amongst the largest firms, raising profits above
the competitive level. Collusion then allows firms to obtain higher than competitive prices
whilst having unfavorable conditions for consumers. The alternative hypothesis is the RMP
which posits that only firms with large market shares and well differentiated products can exert
market power in pricing these products and produce above than competitive earnings. Finally,
the ES postulates that efficiency and not concentration and market share explain higher
profitability (see e.g. Berger, 1995 and Goddard et. al., 2001). In this paper we employ a well-
known accounting measure, the cost-to-income ratio (C/I ratio), as a proxy for bank
(in)efficiency to test the ES.6
6 The cost-to-income ratio is considered a ‘quick’ test of efficiency that reflects bank non-interest costs as a
proportion of income as follows: non-interest expenses / (net interest income + non-interest income). The higher
(lower) this ratio the more inefficient (efficient) the bank.
5
The second aim of the paper is to consider the related question of whether the factors
that are typically associated with profitability in the market power hypotheses can explain the
banks’ spread. We also consider the role of the C/I ratio, to test for the validity of the ES. To
our knowledge, this is the first study to carry out such an investigation using industrial
organisation literature to explain spreads in the Mexican banking sector. Overall, our results
seem to give only weak support to the traditional SCP paradigm in Mexican banking but also
uncover evidence of strong relationships between profitability and banks’ capital ratios. On the
other hand, inefficiency is found negatively and significantly related with both profits and
spreads. Finally, we do not find evidence that concentration and market share are associated
with high interest rate spreads, thereby suggesting alternative models that include efficiency
measures be pursued in future research.
The paper is organised as follows: Section 2 reviews the main literature; Section 3
describes the data and discusses the models specification along with related methodological
issues; Section 4 discusses the results. Section 5 concludes.
2. Literature Review
A wide variety of studies have analyzed the validity of the two main market power
theories that exist in industrial organisation literature in the context of the banking industry: the
SCP and RMP. According to these hypotheses, concentration and market share exert a direct
influence on the competition among banking firms. The main implication of the SCP is that, if
positive and significantly related to profitability, concentration will foster collusion among the
largest firms in the market. The latter will in turn respond by adopting a non-competitive
behavior and charging above what competitive conditions would warranty. On the other hand,

6
the RMP hypothesis postulates that firms with the largest market share will be able to exercise
market power and earn abnormal profits.
Most studies on market power in banking focus on the US and EU banking industries
(see for extensive reviews Gilbert, 1984, and Goddard et. al., 2001). Many of them find a
positive statistical relationship between profitability (measured as ROAA and/or ROAE7) and
either concentration or market share (see for example Maudos, 1998; Molyneux and Forbes,
1995; and Hannan and Berger, 1991). Berger (1995) adds a major twist to the existing
literature by testing the two market structure hypotheses described above against two
‘efficiency hypotheses’ for a large sample of US banks. He argues that banks’ scale and/or X-
efficiency levels could help to explain the association between profits, concentration, and
market share.8
Despite extensive international literature, studies focusing on the Mexican banking
sector are scarce. In a recent study Rodriguez (2003) investigates both market power and
efficiency hypotheses for the Mexican banking industry. He analyzes 16 banks during the
period 1995-2000, which accounted for approximately 85% of the total market share in terms
of assets. He finds that profits were positively related with market concentration and negatively
with market share, and interprets this finding as supporting evidence in favor of the SCP.
A positive and significant relationship between profits and either or both
measures of efficiency would imply absence of anticompetitive practice and thus M&A
activities should not be discouraged. Berger’s (1995) analysis produces mixed results, finding
some support for both the X-efficiency and the RMP hypotheses thereby suggesting that banks
that follow best practice as well as larger banks tend to be more profitable.
7 Where ROAA is the Return On Average Assets and ROAE is the Return On Average Equity. 8 For extensive reviews of efficiency studies see Berger and Humphrey (1997) and Goddard et al. (2001).

7
Nevertheless, he also finds that the efficiency ratio is positively related to profitability. His
final conclusion is the acceptance of both the SCP and ES models as explanatory of the source
of profitability in the Mexican banking industry. The main policy implication derived from this
study is that regulatory entities should limit mergers between large banks if efficiency gains are
low and the market does not generate more competition. Guerrero et al. (2005) also study the
market power and efficiency hypotheses in Mexico for the period 1997 to 2004 using a
balanced panel data of 18 commercial banks that represents 88% of the market share. They test
the SCP, RMP and ES hypotheses and in contrast with previous studies they only find evidence
supporting the RMP hypothesis. The concentration index and the efficiency estimators do not
appear to be related with profitability.
According to some authors (e.g. Trigueros, 1995), one possible explanation for the high
market concentration and low efficiency of Mexican commercial banks can be sought in the
high interest rate spreads that the vast majority of them have earned over the last 30 years. This
suggests that high interest rate spreads may be influenced by the market structure and/or
efficiency levels in the industry. In this empirical study we analyze how the market structure
and efficiency models (SCP, RMP and ES) influence interest rate spreads. The literature also
includes studies looking at the determinants of interest rate spreads but generally this is not
done in the context of the industrial organisation theories described above. For example,
Saunders and Schumacher (1998) analyze the determinants of interest rate margins in Mexico
for the period of 1992 to 1995. They investigate 13 banks representing 90% of Mexican bank
assets and find that capital-to-asset ratios, the high cost of providing financial intermediation
services, and macroeconomic volatility are the main determinants of interest rate spreads.
Moreover they fail to find a relationship between market share and the interest rate spreads.
8
Demirguc-Kunt and Huizinga (1999) use bank level data for 80 developed and
developing countries including Mexico for the period of 1988 to 1995 to analyze interest
margins and bank profitability. Their evidence suggest that bank-specific variables, such as
bank taxation, deposit insurance regulation, overall financial structure, and several legal and
institutional indicators are important determinants of bank margins. Saunders and Schumacher
(2000) find that interest margins in six European countries and the US during the period of
1988-95 have been affected not only by the degree of bank capitalisation and the volatility of
interest rates but also by the bank market structure.
A recent systematic study by Brock and Suarez (2000) outlines different microeconomic
(e.g. inadequate provisions for bad loans) and macroeconomic factors (e.g., the inflation rate)
that may have contributed to high interest rate spreads in Mexico, Argentina, Bolivia, Chile,
Colombia and Peru. Specifically variables that prove important in affecting margins in the six
Latin American countries according to Brock and Suarez (2000) are the influence of liquidity
and capital risk, the level of GDP, interest rate volatility, and inflation. The main determinants
of interest rate spreads, however, are non-performing loans and capital adequacy. Mainly, in
weak Latin American banking systems such as Peru and Bolivia, when non-performing loans
increase spreads decline and when capital adequacy increases spreads are not affected. On the
other hand, in strong Latin American banking systems i.e. Argentina, Chile, Colombia and
Mexico, when non-performing loans increase spreads increase, whilst when capital adequacy
increases spreads decrease.
Focusing on the emerging markets of Central and Eastern Europe, Claeys and Vander
Vennet (2003) discuss the most significant range of factors that affect spreads. These include
incentives to restrict competition, the presence of informational asymmetries problems,

9
recurrent banking crisis that generate negative externalities and a high degree of operational
inefficiencies. They use a model that examines the role of country-specific bank market
characteristics (such as the degree of concentration as a proxy for market power), country-
specific macroeconomic variables, bank-specific characteristics (such as efficiency and capital
adequacy), and regulatory features (such as the degree of financial and regulatory reform). They
find that the SCP cannot be rejected when analyzing the determinants of bank interest rate
margins. Market concentration is positive and statistically significant, while market share is
negative and statistically insignificant.
Mlachila and Chirwa (2004) use several variables to define the interest rate spreads in
Malaysia and their results vary depending on their choice of the dependent variable among
those alternative definitions. Nevertheless, when using the net interest margin as a definition for
their dependent variable, the results are similar to those by Claeys and Vander Vennet (2003).
The results show a positive value for the concentration level and a negative sign for market
share. They conclude that bank concentration has a positive relationship with spreads thus
supporting the SCP hypothesis in the specific case of Malaysia.
Martinez Peria and Mody (2004) study a group of Latin American countries including Mexico
and analyze the determinants of interest rate spreads during the 1990s. They conclude that
foreign participation and bank concentration have been strong determinants of interest rate
spreads in the region. Gelos (2006) analyses the determinants of banking spreads in 14 Latin
American countries including Mexico. He finds that in comparison to other developing
nations, spreads in Latin American banks are higher due to less efficient banks which are a
reflection of weaker competition, higher levels of interest rates and higher reserve
requirements. The main conclusions are that promoting bank competition and efficiency as well

10
as a stable macroeconomic environment (lower interest rates) may induce lower interest rate
margins. Estrada et al. (2006) analyze the interest rate spreads in the Colombian Financial
system. Their results find that interest rate spreads are mainly affected by the inefficiency of
credit institutions and to a lesser extent by credit risk exposure and market power. They suggest
that banks should be encouraged to become more efficient by market oriented public policies.
Recently, Williams (2007) employs data from the Australian banking sector and finds that bank
market power increases net interest margins. Evidence also suggests that operating costs,
implied payments and management quality have crucial roles in determining net interest
margins. Solis and Maudos (2008) estimate the Harberger's triangle in the Mexican banking
system for the period 1993-2005 and find that the social cost attributable to market power
exceeds the cost of banking inefficiency.
3. Methodology and Data
3.1 Data Sources and Variable Description
The data was obtained from Bankscope, an international database by Bureau Van Dijk
Electronic Publishing. It consists of yearly information on detailed financial statements for the
largest 20 banks operating in Mexico. The market shares, calculated from total assets for these
banks, are presented in Table A1 in the Appendix. The largest bank over all years is
Banco Nacional de Mexico and the average market share during the period under study is
90.1%, thereby indicating that our sample is highly representative of the population.9
9 In this paper we assume a national market for all banking products and services in Mexico rather than assessing
smaller local or regional markets within the country.
The

11
macroeconomic data (i.e. inflation and GDP) were obtained from the government information
agency INEGI.10
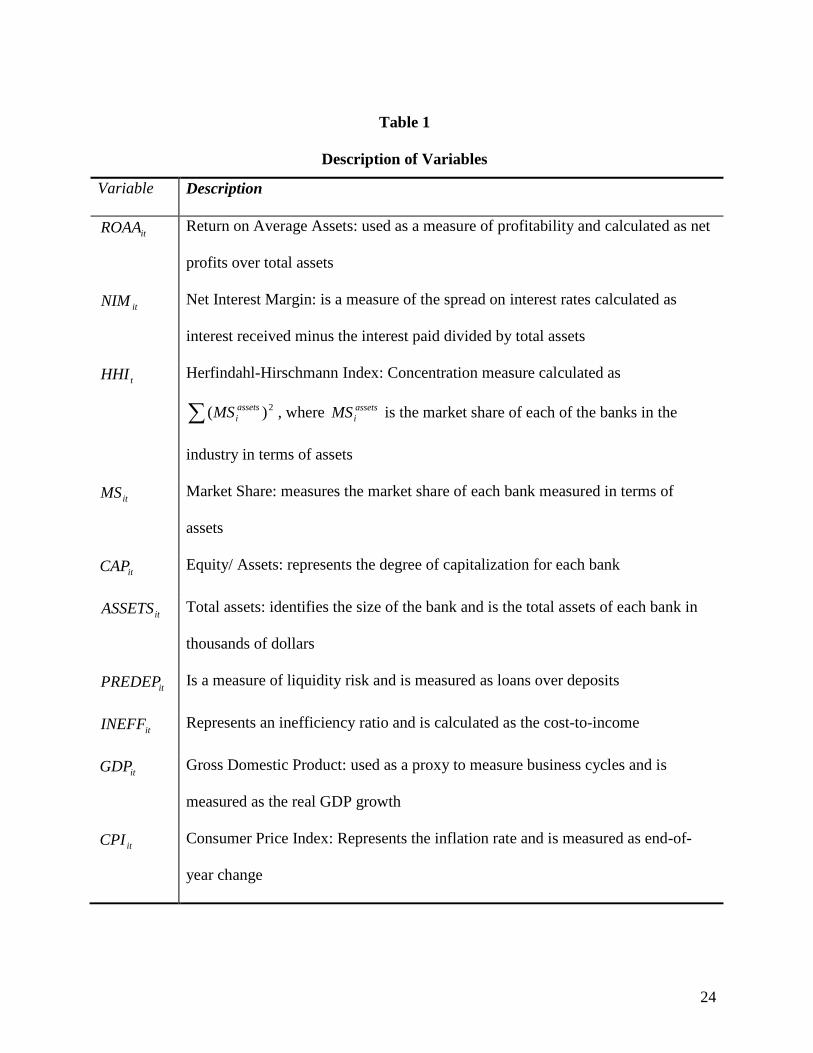
Table 1 describes the variables used for carrying out our empirical analysis. As we
discuss in Section 3.2, the two dependent variables are a commonly used measure of
profitability (the ROAA) and interest rate spreads are proxied as NIM. The table also reports
the definitions of the explanatory variables that we use to test the SCP, RPM and ES as well as
a number of bank-specific and macroeconomic variables such as the level of capitalisation and
the real GDP growth, respectively.
<Insert Table 1 about here>
Table 2 reports the descriptive statistics for the variables used in our models and Table 3
illustrates the pairwise correlation coefficients for these variables.
<Insert Table 2 about here>
<Insert Table 3 about here>
From Table 2 it is noticeable the large value of the CPI (Consumer Price Index)
inflation rate with a mean of 14.12. The inflation rate is included in order to capture
10 Instituto Nacional de Estadistica, Geografia e Informatica (see http://www.inegi.gob.mx).
12
macroeconomic stability (for example see Kind and Levine, 1993). Under conditions of high
inflation, effects of financial intermediation on economic activity may not fully materialise (for
example, see Rousseau and Wachtel , 2001).
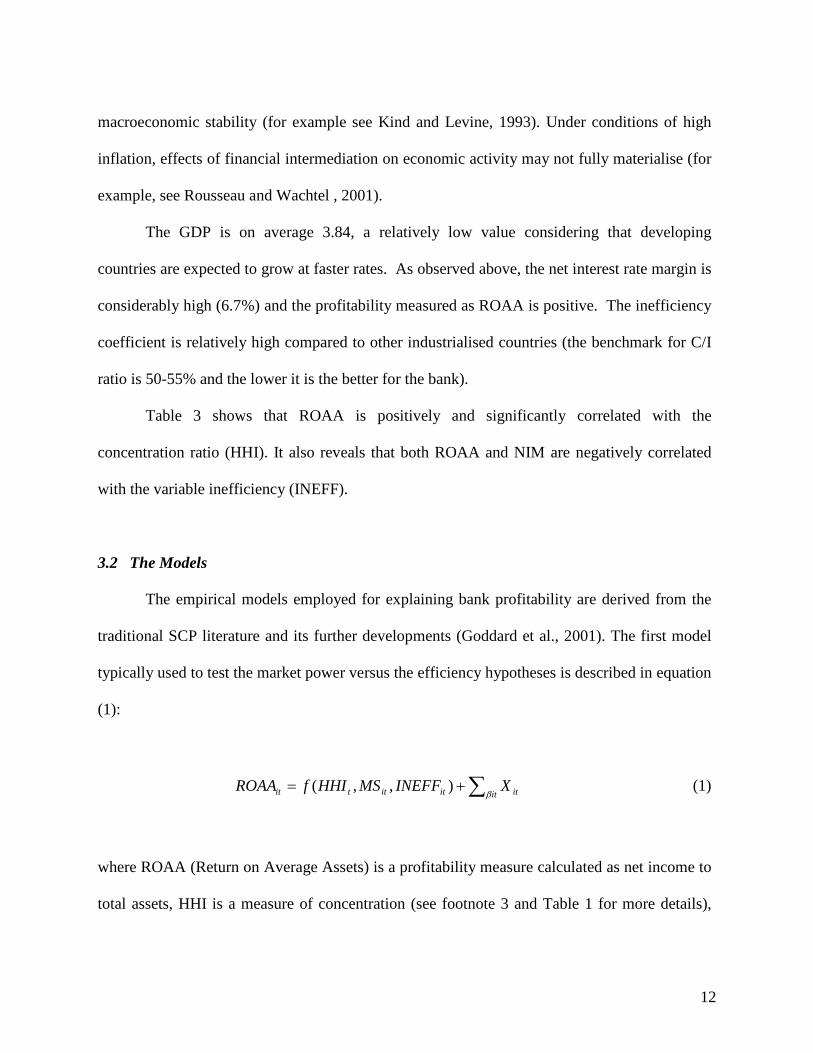
The GDP is on average 3.84, a relatively low value considering that developing
countries are expected to grow at faster rates. As observed above, the net interest rate margin is
considerably high (6.7%) and the profitability measured as ROAA is positive. The inefficiency
coefficient is relatively high compared to other industrialised countries (the benchmark for C/I
ratio is 50-55% and the lower it is the better for the bank).
Table 3 shows that ROAA is positively and significantly correlated with the
concentration ratio (HHI). It also reveals that both ROAA and NIM are negatively correlated
with the variable inefficiency (INEFF).
3.2 The Models
The empirical models employed for explaining bank profitability are derived from the
traditional SCP literature and its further developments (Goddard et al., 2001). The first model
typically used to test the market power versus the efficiency hypotheses is described in equation
(1):
∑+=it ititittit XINEFFMSHHIfROAA
β),,( (1)
where ROAA (Return on Average Assets) is a profitability measure calculated as net income to
total assets, HHI is a measure of concentration (see footnote 3 and Table 1 for more details),

13
MS is market share, INEFF is a proxy for inefficiency calculated using accounting data (the C/I
ratio) and Xit is a vector of control variables which determine firm- and market-specific
characteristics. According to this model, the SCP hypothesis can be verified by finding a
positive and statistically significant value of HHI and a value of MS equal to 0. Conversely, the
RMP theory is confirmed if MS is found positive and statistically significant. Finally, support
for the ES hypothesis can be manifested by finding a negative value for INEFF.
The extended equation including the firm- and market-specific characteristics can be
written as follows11
:
1 2 3
4 5 6 +it i t it
it it it it
ROAA HHI MS INEFFCAP PREDEP ASSETS
α β β ββ β β ε
= + + ++ + +
(2)
where HHI, MS and INEFF are as defined in equation (1), CAP is the degree of capitalisation,
PREDEP is loans over deposits and is interpreted as a measure for liquidity risk and ASSETS is
a proxy for the size of the bank.
In order to investigate the determinants of interest rate spreads we use a model similar
to (1) and (2) where the dependent variable is the interest rate spreads (NIM) rather than
ROAA:
itt tit ititittit YXINEFFMSHHIfNIM εββ
+++= ∑∑),,( (3)
11 This model is similar to the one used, among others, by Molyneux and Forbes (1995) and Rodriguez (2003).
14
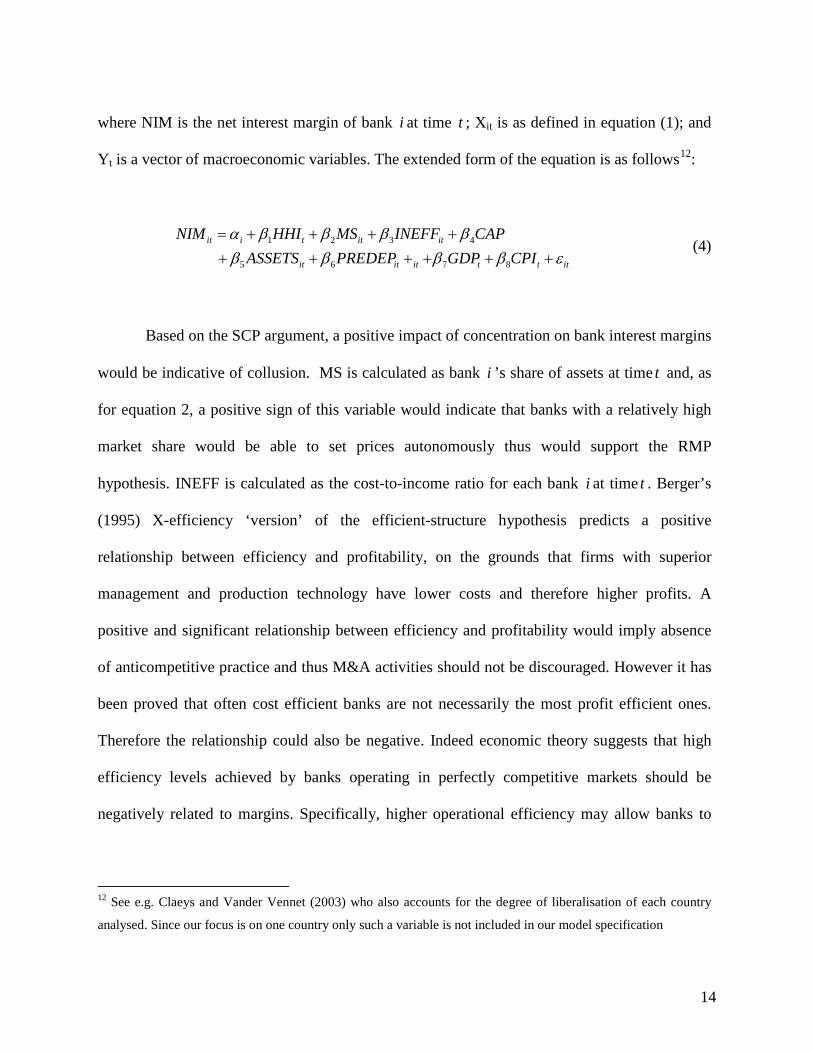
where NIM is the net interest margin of bank i at time t ; Xit is as defined in equation (1); and
Yt is a vector of macroeconomic variables. The extended form of the equation is as follows12
:
1 2 3 4
5 6 7 8 it i t it it
it it it t t it
NIM HHI MS INEFF CAPASSETS PREDEP GDP CPI
α β β β ββ β β β ε
= + + + ++ + + + + +
(4)
Based on the SCP argument, a positive impact of concentration on bank interest margins
would be indicative of collusion. MS is calculated as bank i ’s share of assets at time t and, as
for equation 2, a positive sign of this variable would indicate that banks with a relatively high
market share would be able to set prices autonomously thus would support the RMP
hypothesis. INEFF is calculated as the cost-to-income ratio for each bank i at time t . Berger’s
(1995) X-efficiency ‘version’ of the efficient-structure hypothesis predicts a positive
relationship between efficiency and profitability, on the grounds that firms with superior
management and production technology have lower costs and therefore higher profits. A
positive and significant relationship between efficiency and profitability would imply absence
of anticompetitive practice and thus M&A activities should not be discouraged. However it has
been proved that often cost efficient banks are not necessarily the most profit efficient ones.
Therefore the relationship could also be negative. Indeed economic theory suggests that high
efficiency levels achieved by banks operating in perfectly competitive markets should be
negatively related to margins. Specifically, higher operational efficiency may allow banks to
12 See e.g. Claeys and Vander Vennet (2003) who also accounts for the degree of liberalisation of each country
analysed. Since our focus is on one country only such a variable is not included in our model specification

15
pass the lower costs to their consumers in the form of lower loan rates and/or higher deposit
rates, thereby lowering the interest margin (see Claeys and Vander Vennet, 2003).
The relationship between the variables CAP and profitability is typically expected to be
negative since greater capital induces banks to take less risk and thus earn less profit. However,
higher capital ratios may also reflect higher incentives from the part of the shareholders to
monitor management and ensure that the bank operates in a profitable manner. In this case, the
hypothesis is that higher capital ratios are associated with more profitable institutions. The
variable ASSETS is calculated as the share of total assets of bank i at time t and is a proxy for
scale economies that according to the main literature could take either a positive or negative
sign. Another indicator of the bank’s balance sheet composition we included in our models is
the proportion of loans to total deposits (PREDEP). This variable monitors the risks that banks
have to bear in terms of liquidity and amount of capital and one expects a positive sign of the
variable being associated with high profitability, both in terms of ROAA and margins. This is
because up to a certain level greater risk originated by a higher proportion of loans over
deposits, should generate higher profits.
Finally, as concerns equation 4, in the vector of the macroeconomic variables (Y in eq.
3) that captures country specific macroeconomic conditions, two variables are included: real
GDP growth as a proxy for business cycle fluctuations, and the inflation rate. There is evidence
suggesting an inverse relationship between bank lending and inflation rates, implying that when
inflation raises bank lending decreases (see e.g. Boyd et. al., 2001).
We estimate models (2) and (4) above using Random-Effects (RE) panel data
estimations. The panel is balanced and includes a total of 20 banks (see Table A1 in the
Appendix), all of which were active during the whole period of study. In order to choose the

16
appropriate panel data estimation approach a Hausman test was conducted which revealed that a
Fixed-Effects (FE) estimator would yield biased estimates. The test rejected the FE hypothesis
in both regressions in favor of the RE hypothesis.13
2χ
In particular the Hausman specification test
for the first regression (equation 2) resulted in of 7.23 with 6 degrees of freedom, while the
second regression (equation 4) in 2χ of 1.59 with 8 degrees of freedom (see Table A2 in the
Appendix). Finally we have also considered the Return On Average Equity (ROAE) as an
alternative measure of profitability.
4. Results
The regression results pertaining to the SCP, RPM and ES hypotheses (equation 2) are
reported in Table 4. The results reveal some weak evidence of a positive relationship between
concentration and the level of profitability for the Mexican banking industry during the period
1996-2003. For each percentage point that the HHI increases, profits grow at a rate of .0031
points on average. At the same time, the coefficient for market share is negative and significant:
a possible explanation of this result is that the institutions which have grown in terms of
capitalisation in the banking sector have done it by mergers and/or acquisitions and not by
pursuing better administration or cost reduction policies. Moreover, there is a highly
significant and negative relationship between the inefficiency ratio and profitability supporting
the ES hypothesis. When inefficiency decreases by 1 point profitability increases by .025, a
stronger relationship than the one between HHI and ROAA. The index of capitalisation, CAP,
has a positive relationship with profitability. One possible reason is that the macroeconomic
13 The regression was performed using the STATA econometric software.

17
instability after the crisis that hit Mexico in 1995 may have directed large amounts of capital
investment in government bonds thus implying a positive relationship between the capital index
and profitability. In this context, and observing the volatility in interest rates as well as the
reduction of credit, banks relied on long-term investments to increase their profits.
The results also indicate a direct relationship between size (ASSETS) and profitability.
Finally, there is a negative relationship between the inefficiency ratio and profitability
supporting the ES hypothesis. These findings are in line with previous empirical studies (e.g.
Rodriguez, 2003) and suggest that profitability in the Mexican banking industry has derived
from both market structural factors and greater efficiency. In other words, these results seem to
support only partially the SCP hypothesis, in which profits may be derived from market
structure, and more markedly the ES hypothesis, in which lower inefficiency (greater
efficiency) has driven profits upward, and other variables such as the degree of capitalisation.
<Insert Table 4 about here>
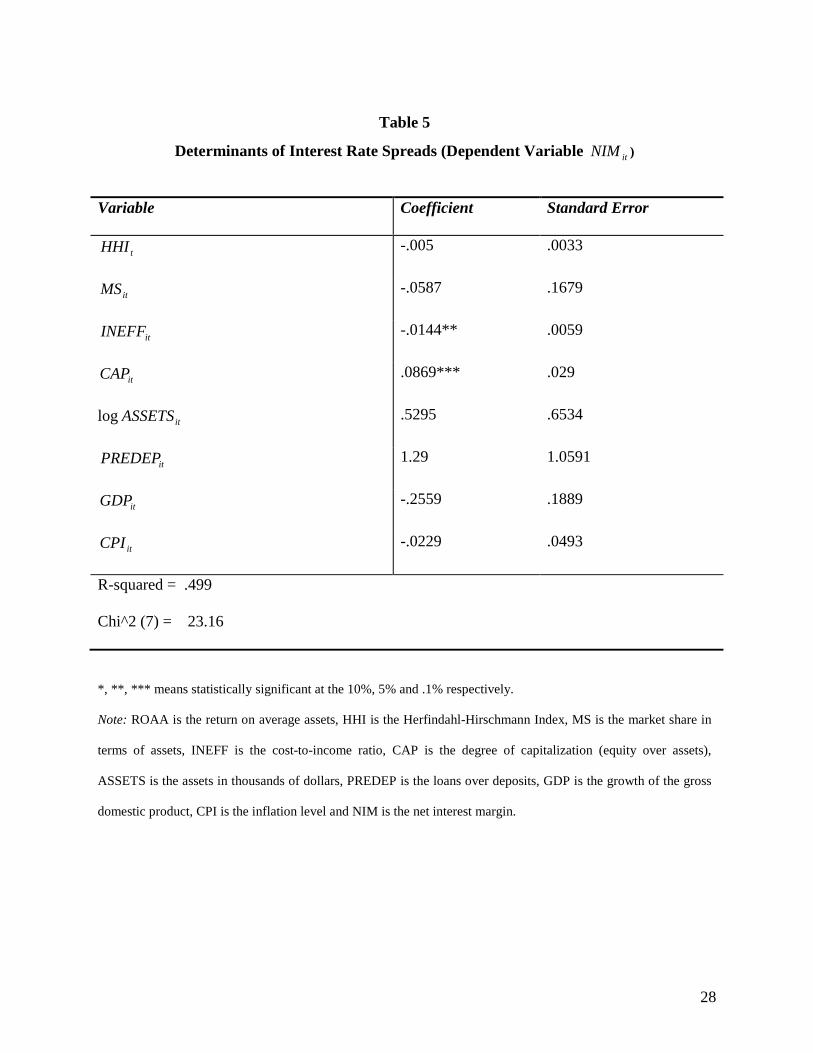
Table 5 reports the results on the interest rate spreads determinants derived from
estimating equation (4).
<Insert Table 5 about here>
The results do not indicate a statistically significant relationship between interest rate spreads
and HHI or MS. Besides not being statistically significant, the variables on concentration and
market share are both negative. The two variables that are found statistically significant in this

18
model are the efficiency indicator and CAP. The variable INEFF displays a negative sign that
can be interpreted as lower costs (i.e. less inefficiency) should increase interest rates margins.
This implies that greater efficiency widens the interest rate spreads, a result which is consistent
with an ES interpretation, whereby to the extent that enhanced efficiency reduces costs, the
interest rate margins increase provided that the ‘pass-through’ of efficiency benefits to
consumers is less than one. Of course, one may expect that in a perfectly competitive
environment higher efficiency should induce banks to pass these lower costs to their customer as
lower loan rates and/or higher deposit rates, thus lowering the interest rate margin (e.g., Claeys
and Vander Vennet, 2003). Market structure imperfections, however, may result to less than full
pass-through of the efficiency gains to consumers. Such cases should be reflected to increases in
interest rate spreads. The degree of capitalisation (variable CAP) is positively related to spreads
because, as observed e.g. by Brock and Suarez (2000), higher capital adequacy levels may
induce banks to undertake more profitable lending activities, thus increasing the net interest
margins. These results seem to be consistent with those obtained by Saunders and Schumacher
(1998), who find a direct relationship between the interest rate margins and capital-to-assets
ratio. They also point out the macroeconomic activity as influential in the determination of
interest rate margins, although in this particular regression no significant relationship was found
between GDP and NIM. Finally, they also find no significant relationship between market
structure variables and net interest margins. In our empirical analysis the regressions have also
been carried out using the Return On Equity (ROE) as an additional possible measure of
profitability for the period 1997-2003. Our results, however, indicate that the INEFF variable is
negative as expected but no evidence of collusion results emerge (HHI is not significant, MS is
negative).

19
Overall, no strong evidence exists suggesting that bank concentration produces high
spreads on interest rates for commercial banks in Mexico over the period under study. As
shown in Table 4, however, high concentration in the industry could generate collusion effects,
which in turn may have some (although weak) effects on bank profitability. The results in
Table 5 reject the market power hypotheses while our chosen proxy for inefficiency, the C/I
ratio is found negatively and significantly related with both profits and spreads thereby giving
some general support to the ES hypothesis.
5. Conclusions
The banking sector in Mexico has experienced substantial changes during the past
decade, especially after the 1995 economic crisis. One of the most relevant changes was the
increase in foreign financial institutions operating in this sector: a number of them have either
merged or acquired the largest banks in Mexico. The initial idea of allowing foreign capital in
the industry was to recapitalise the sector, since during the aftermath of the crisis banks were
left undercapitalised. Nevertheless, concerns over the industry concentration have arisen. The
first five banks (BBVA-Bancomer, Banamex, Santander, HSBC Mexico and Banorte) control
some 85% of the total market share of the banking sector and have done so for the past few
years. The trend is towards further concentration, and this could potentially affect substantially
banks’ profitability.
This paper empirically tests two market power theories (the Structure-Conduct-
Performance and Relative Market Power) and the Efficient Structure (ES) hypothesis in the
Mexican banking industry over 1996-2003 and then uses a similar framework to investigate the

20
determinants of interest rate spreads. Our results seem to give only weak support to the
traditional SCP paradigm in Mexican banking but also uncover evidence of strong relationships
between profitability and the banks’ capital ratios. Furthermore, we do not find evidence that
concentration and market share are associated with high interest rate spreads, while our chosen
proxy for inefficiency is found negatively and significantly related with both profits and
spreads thereby giving strong support to the ES hypothesis.
The above findings can be of interest to policy-makers and anti-trust authorities not only
in the specific context of Mexican banks but also for other emerging countries in the Latin
American region that are implementing policies aimed at liberalizing their banking sectors. In
particular our evidence suggests that M&A operations that increase the concentration in the
banking market should not be discouraged. This is because factors such as managerial and other
efficiencies appear to be important forces behind the high spreads and profits, thus implying
that the rushed focus on market power may often be misplaced. Indirectly, our findings also
imply that policies directed towards more open financial systems should not be considered as
the cause of high spreads.
Finally our evidence suggests that alternative models that include specific measures of
efficiency be pursued in any future research on profits and spreads in Mexican banking.
Furthermore, future studies specifically on the determinants of interest rate spreads in Mexico
should be pursued to determine what factors, other than efficiency, are driving the persistently
high spreads.

21
References
Banco de Mexico, Economics indicators (Mexico: Banco de Mexico, various years)
Berger AN (1995) The profit-structure relationship in banking: Tests of market power and
efficient structure hypothesis. Journal of Money, Credit and Banking 27: 404-431.
Boyd JH, Levine R, Smith BD (2001) The impact of inflation on financial sector performance.
Journal of Monetary Economics 47: 221-248.
Brock PL, Suarez LR (2000) Understanding the behavior of bank spreads in Latin America.
Journal of Development Economics 63: 113-134.
Claeys S, Vander Vennet R (2003) Determinants of bank interest margins in central and
Eastern Europe. Convergence to the west? Working Papers of Faculty of Economics and
Business Administration 203, Ghent University, Belgium.
Comision Nacional Bancaria y de Valores, Boletin estadistico de banca multiple, various
issues.
Demirguc-Kunt A, Huizinga H (1999) Determinants of commercial bank interest margins and
profitability: Some international evidence. World Bank Economic Review 13 (2): 379-
408
Estrada D, Gomez E, Orozco I (2006) Determinants of interest margins in Colombia.
Borradores de Economia 393, Banco de la Republica de Colombia.
Gelos G (2006) Banking spreads in Latin America, IMF Working Paper 06(44).
Gilbert RA (1984) Bank market structure and competition: A survey. Journal of Money, Credit
and Banking 16(4): 617-645

22
Guerrero R, Sepulveda E, Villalpando M (2005) Profitability, concentration and efficiency in
the Mexican banking industry. Paper presented at the 10th Latin American and Caribbean
Economic Association, Paris.
Hannan T, Berger AN (1991) The rigidity of prices: Evidence from the banking industry.
American Economic Review 81: 938-945.
Instituto Nacional de Estadistica, Geografia e Informatica (INEGI). www.inegi.gob.mx
King R, Levine R (1993) Finance and growth: Schumpeter might be right. Quarterly Journal of
Economics 108 (4): 717–738.
Martinez Peria MS, Mody A (2004) How foreign participation and market concentration impact
bank spreads: Evidence from Latin America. World Bank Working Paper 3210.
Maudos J (1998) Market structure and performance in Spanish banking using a direct measure
of efficiency. Applied Financial Economics 8: 191-200.
Mlachila M, Chirwa EW (2004) Financial reforms and interest rate spreads in the commercial
banking system in Malawi. International Monetary Fund Working Paper 51(1).
Molyneux P., Forbes W (1995) Market structure and performance in European banking.
Applied Economics 27(1): 155-159.
Morris F, Dorfman M, Ortiz JP, Franco MC (1990) Latin America’s banking systems in the
1980s: A cross country comparison. World Bank Working Paper 81.
Rodriguez Montemayor E, (2003) Concentración industrial y rentabilidad de la banca en
México. Evaluación posterior a la crisis de 1995. El Trimestre Economico 278: 371-404.
Rousseau PL, Wachtel P (2001) Inflation, financial development and growth. In Negishi T,
Ramachandran R, Mino K, eds, Economic theory, dynamics and markets: Essays in honor
of Ryuzo Sato, Boston, MA, Kluwer: 309-324.

23
Saunders A, Schumacher L (1998) The determinants of bank interest rate margins in Mexico’s
post privatisation period (1992-1995). Washington D.C.: George Washington University.
Saunders A, Schumacher L (2000) The determinants of bank interest rate margins: An
international study. Journal of International Money and Finance 19 (6): 813-832.
Solís, L, Maudos, J, (2008) The social costs of bank market power: Evidence from Mexico.
Journal of Comparative Economics 36(3): 467-488.
Trigueros I (1995) El sistema financiero mexicano. México a la hora del cambio. Mexico:
Mexico, Cal y Arena.
Williams B (2007) Factors determining net interest margins in Australia: domestic and foreign
banks. Financial Markets, Institutions and Instruments 16 (3):145-165.
Yacaman JM (2001) Competition and consolidation in the Mexican banking industry after the
1995 crisis. BIS Papers 4: 102-112.
24
Table 1
Description of Variables
Variable Description
itROAA Return on Average Assets: used as a measure of profitability and calculated as net
profits over total assets
itNIM Net Interest Margin: is a measure of the spread on interest rates calculated as
interest received minus the interest paid divided by total assets
tHHI Herfindahl-Hirschmann Index: Concentration measure calculated as
∑ 2)( assetsiMS , where assets
iMS is the market share of each of the banks in the
industry in terms of assets
itMS Market Share: measures the market share of each bank measured in terms of
assets
itCAP Equity/ Assets: represents the degree of capitalization for each bank
itASSETS Total assets: identifies the size of the bank and is the total assets of each bank in
thousands of dollars
itPREDEP Is a measure of liquidity risk and is measured as loans over deposits
itINEFF Represents an inefficiency ratio and is calculated as the cost-to-income
itGDP Gross Domestic Product: used as a proxy to measure business cycles and is
measured as the real GDP growth
itCPI Consumer Price Index: Represents the inflation rate and is measured as end-of-
year change

25
Table 2
Descriptive Statistics of Variables Used in the Empirical Models (averages 1996-03)
Mean Median Min Max St. Dev
itROAA 1.1466 0.7983 -0.684 3.3405 1.412
itNIM 6.7436 7.1423 4.213 7.8785 1.2053
tHHI 1,436.113 1,443.86 1,187.645 1,653.597 151.0005
itMS 4.252 4.4238 3.84 4.563 0.3121
itCAP 16.3647 16.4248 12.9275 18.849 2.0928
itASSETS 60,330.86 57,406.43 42,345.75 82,778.15 14,036.45
itPREDEP 0.8195 0.7865 0.672 1.164 0.1602
itINEFF 84.4803 77.3158 70.0615 131.606 19.8313
itGDP 3.8375 4.3 -0.1 6.8 2.5411
itCPI 14.1213 12.71 4.55 34.38 10.1273
Note: ROAA is the return on average assets, HHI is the Herfindahl-Hirschmann Index, MS is the market share in
terms of assets, CAP is the degree of capitalization (equity over assets), ASSETS is the assets in thousands of
dollars, CAP is the degree of capitalization, PREDEP is the loans over deposits, INEFF is the cost-to-income ratio,
GDP is the growth of the gross domestic product, CPI is the inflation rate and NIM is the net interest margin.
Source: Elaborated with data from Bankscope.

26
Table 3
Pairwise Correlation Matrix
ROAA HHI MS CAP PREDEP ASSETS INEFF LTA NIM GDP CPI ROAA 1.00 HHI 0.171* 1.000 MS -0.055 0.031 1.000 CAP 0.406* 0.05 -0.279* 1.000 PREDEP -0.124 -0.209* -0.153 0.018 1.000 ASSETS -0.043 0.077 0.969* -0.264* -0.168* 1.000 INEFF -0.457* -0.027 -0.13 -0.018 -0.055 -0.134 1.000 LTA -0.167* -0.032 0.073 -0.201* 0.406* 0.049 -0.062 1.000 NIM 0.013 -0.018 -0.019 0.246* 0.314* -0.01 -0.165* 0.169* 1.000 GDP -0.233* -0.639* -0.012 -0.034 0.199* -0.086 0.113 0.102 -0.066 1.000 CPI -0.184* -0.618* -0.014 -0.099 0.361* -0.112 0.073 -0.046 -0.038 0.559* 1.000

27
Table 4
Tests of Market Power and Efficiency (Dependent variable itROAA )
*, **, *** means statistically significant at the 10%, 5% and .1% respectively.
Note: ROAA is the return on average assets, HHI is the Herfindahl-Hirschmann Index, MS is the market share in
terms of assets, INEFF is the cost-to-income ratio, CAP is the degree of capitalization (equity over assets),
ASSETS is the assets in thousands of dollars, and PREDEP is the loans over deposits.
Variable Coefficient Standard Error
tHHI .0031* .0018
itMS -.1762** .0856
itINEFF -.0248*** .0042
itCAP .1092*** .0187
Log itASSETS .7484** .351
itPREDEP -.8676 .7333
R-squared = .12
Chi^2 (6) = 91.29
28
Table 5
Determinants of Interest Rate Spreads (Dependent Variable itNIM )
Variable Coefficient Standard Error
tHHI -.005 .0033
itMS -.0587 .1679
itINEFF -.0144** .0059
itCAP .0869*** .029
log itASSETS .5295 .6534
itPREDEP 1.29 1.0591
itGDP -.2559 .1889
itCPI -.0229 .0493
R-squared = .499
Chi^2 (7) = 23.16
*, **, *** means statistically significant at the 10%, 5% and .1% respectively.
Note: ROAA is the return on average assets, HHI is the Herfindahl-Hirschmann Index, MS is the market share in
terms of assets, INEFF is the cost-to-income ratio, CAP is the degree of capitalization (equity over assets),
ASSETS is the assets in thousands of dollars, PREDEP is the loans over deposits, GDP is the growth of the gross
domestic product, CPI is the inflation level and NIM is the net interest margin.

29
Appendix
Table A1
Market share in terms of assets of the 20 banks under study (%, 1996-2003)
Source: Bankscope data.
1996 1997 1998 1999 2000 2001 2002 2003
BBVA Bancomer S.A. 18.35 21.43 17.52 17.52 24.44 27.27 25.12 26.12
Banco Mercantil del Norte S.A. 2.87 2.91 4.12 4.12 6.29 6.50 11.64 10.96
HSBC Mexico, SA 7.38 7.21 8.75 8.44 7.47 8.84 9.59 9.53
Banco Santander Mexicano SA 6.27 6.30 5.89 4.72 6.28 7.46 6.60 6.93
Banca Serfin 14.21 14.40 14.21 12.16 7.95 8.97 6.49 6.17
Banco JP Morgan SA 1.29 0.55 0.12 0.08 0.13 1.1 0.74 2.09
ING Bank (Mexico) 0.19 0.11 0.15 0.17 0.21 0.72 1.01 0.95
Bank of America (Mexico) 0.25 0.11 0.10 0.15 0.35 0.49 0.45 0.89
Banco del Bajio 0.22 0.23 0.28 0.27 0.28 0.38 0.56 0.68
Banca Afirme 0.09 0.39 0.51 0.38 0.33 0.36 0.38 0.50
BBVA Bancomer Servicios 4.54 6.14 6.60 5.53 0.36 0.3 0.34
Banco Interacciones, SA de CV 0.59 0.74 0.98 0.70 0.42 0.43 0.33 0.35
Banco Regional de Monterrey S.A. 0.15 0.14 0.18 0.15 0.21 0.24 0.28 0.30
Banca Mifel, SA de CV 0.34 0.24 0.23 0.24 0.27 0.27 0.27 0.24
Banco del Centro SA 0.01 2.09 1.90 1.50 0.21 0.41 0.29 0.26
Comerica Bank Mexico S.A. 0.01 0.09 0.23 0.16 0.14 0.17 0.22 0.19
American Express (Mexico) 0.01 0.03 0.04 0.04 0.05 0.08 0.12 0.17
Bank of Tokyo - Mitsubishi (Mexico) 0.26 0.08 0.1 0.1 0.10 0.16 0.13 0.14
Banco Bansi 0.12 0.05 0.1 0.10 0.1 0.12 0.11 0.12
Banco Nacional de Mexico, SA 21.68 28.02 25.13 20.71 21.21 24.08 23.93 21.92

30
Table A2
Hausman specification test
ROAA as dependent variable
Coefficients
ROAA Fixed Effects Random Effects Difference
MS -.4012 -.1762 -.225
HHI .0036 .0031 .0005
CAP .0897 .1092 -.0195
PREDEP -1.1305 -.8676 -.2629
logASSETS .6692 .7484 -.0792
INEFF -.02 -.0248 .0048
Ho: difference in coefficients not systematic Chi ^ 2 (6) = 7.23
NIM as dependent variable
Coefficients
NIM Fixed Effects Random Effects Difference
MS -.125 -.0587 -.0663
HHI -.0045 -.005 .0005
CAP .1184 .0869 .0316
PREDEP .5097 1.2894 -.7797
INEFF -.0139 -.0144 .0005
logASSETS 1.7505 .5295 1.221
GDP -.1821 -.2559 .0738
CPI .0146 -.0229 .0375
Ho: difference in coefficients not systematic – Chi^2 (8) = 1.59
Note: Where ROAA is the return on average assets, MS is the market share in terms of assets, HHI is the
Herfindahl-Hirschmann index measured in terms of assets, CAP is the equity over assets ratio, PREDEP is the
loans over deposits ratio, logAssets is the logarithm of the total assets, INEFF is the cost-to-income ratio, NIM is
the net interest margin, GDP is the growth in the gross domestic product and CPI is the consumer price index
yearly percentage.