
Title HTLV-1 modulates the frequency and phenotype of ...
13
RIGHT: URL: CITATION: AUTHOR(S): ISSUE DATE: TITLE: HTLV-1 modulates the frequency and phenotype of FoxP3+CD4+ T cells in virus-infected individuals. Satou, Yorifumi; Utsunomiya, Atae; Tanabe, Junko; Nakagawa, Masanori; Nosaka, Kisato; Matsuoka, Masao Satou, Yorifumi ...[et al]. HTLV-1 modulates the frequency and phenotype of FoxP3+CD4+ T cells in virus-infected individuals.. 2012-05-30 http://hdl.handle.net/2433/159469 © 2012 Satou et al.; licensee BioMed Central Ltd. This is an Open Access article distributed under the terms of the Creative Commons Attribution License (http://creativecommons.org/licenses/by/2.0), which permits unrestricted use, distribution, and reproduction in any medium, provided the original work is properly cited.
Transcript of Title HTLV-1 modulates the frequency and phenotype of ...

RIGHT:
URL:
CITATION:
AUTHOR(S):
ISSUE DATE:
TITLE:
HTLV-1 modulates the frequencyand phenotype of FoxP3+CD4+ Tcells in virus-infected individuals.
Satou, Yorifumi; Utsunomiya, Atae; Tanabe, Junko;Nakagawa, Masanori; Nosaka, Kisato; Matsuoka,Masao
Satou, Yorifumi ...[et al]. HTLV-1 modulates the frequency andphenotype of FoxP3+CD4+ T cells in virus-infected individuals..
2012-05-30
http://hdl.handle.net/2433/159469
© 2012 Satou et al.; licensee BioMed Central Ltd. This is an Open Access article distributed under the terms of theCreative Commons Attribution License (http://creativecommons.org/licenses/by/2.0), which permits unrestricted use,distribution, and reproduction in any medium, provided the original work is properly cited.

RESEARCH Open Access
HTLV-1 modulates the frequency and phenotypeof FoxP3+CD4+ T cells in virus-infected individualsYorifumi Satou1,5*, Atae Utsunomiya2, Junko Tanabe1, Masanori Nakagawa3, Kisato Nosaka4 and Masao Matsuoka1*
Abstract
Background: HTLV-1 utilizes CD4 T cells as the main host cell and maintains the proviral load via clonalproliferation of infected CD4+ T cells. Infection of CD4+ T cells by HTLV-1 is therefore thought to play a pivotal rolein HTLV-1-related pathogenicity, including leukemia/lymphoma of CD4+ T cells and chronic inflammatory diseases.Recently, it has been reported that a proportion of HTLV-1 infected CD4+ T cells express FoxP3, a master moleculeof regulatory T cells. However, crucial questions remain unanswered on the relationship between HTLV-1 infectionand FoxP3 expression.
Results: To investigate the effect of HTLV-1 infection on CD4+ T-cell subsets, we used flow cytometry to analyzethe T-cell phenotype and HTLV-1 infection in peripheral mononuclear cells (PBMCs) of four groups of subjects,including 23 HTLV-1-infected asymptomatic carriers (AC), 10 patients with HTLV-1 associated myelopathy/tropicalspastic paraparesis (HAM/TSP), 10 patients with adult T-cell leukemia (ATL), and 10 healthy donors. The frequency ofFoxP3+ cells in CD4+ T cells in AC with high proviral load and patients with HAM/TSP or ATL was higher than thatin uninfected individuals. The proviral load was positively correlated with the percentage of CD4+ T cells that wereFoxP3+. The CD4+FoxP3+ T cells, themselves, were frequently infected with HTLV-1. We conclude that FoxP3+ T-cells are disproportionately infected with HTLV-1 during chronic infection. We next focused on PBMCs of HAM/TSPpatients. The expression levels of the Treg associated molecules CTLA-4 and GITR were decreased in CD4+FoxP3+ T cells.Further we characterized FoxP3+CD4+ T-cell subsets by staining CD45RA and FoxP3, which revealed an increase inCD45RA−FoxP3low non-suppressive T-cells. These findings can reconcile the inflammatory phenotype of HAM/TSP withthe observed increase in frequency of FoxP3+ cells. Finally, we analyzed ATL cells and observed not only a high frequencyof FoxP3 expression but also wide variation in FoxP3 expression level among individual cases.
Conclusions: HTLV-1 infection induces an abnormal frequency and phenotype of FoxP3+CD4+ T cells.
Keywords: HTLV-1, ATL, HAM/TSP, FoxP3, Tax, HBZ
BackgroundHuman T-cell leukemia virus type 1 (HTLV-1) is adelta type retrovirus, which causes leukemia ofHTLV-1-infected CD4+ T cells, known as adult T-cellleukemia (ATL) [1-4], in 2 to 5 % of infected indivi-duals. HTLV-1 is also associated with chronic inflam-matory diseases [5,6], including HTLV-1 associatedmyelopathy/tropical spastic paraparesis (HAM/TSP),uveitis, alveolitis [7], and dermatitis [8]. It has been
estimated that 20 million people are infected withHTLV-1 in the world. HTLV-1 has a characteristicproliferative strategy; HTLV-1 increases its copy num-ber not via vigorous production of cell-free viral par-ticle but mainly via proliferation of infected hostcells, which contain the integrated HTLV-1 provirusin the host genome [9,10]. Given the fact that HTLV-1 utilizes CD4+ T cells as the major host cell popula-tion, the pathogenesis by this virus may be due to ab-normalities of CD4+ T cells in HTLV-1-infectedindividuals. However the precise characteristics of theputative CD4+ T-cell abnormality still remain to beelucidated.In addition to viral structural proteins, such as Gag,
Pol, and Env, HTLV-1 encodes several regulatory and
* Correspondence: [email protected]; [email protected] of Virus Control, Institute for Virus Research, Kyoto University,Kyoto, 606-8507, Japan5Current address: Immunology Section, Division of Infectious Diseases,Department of Medicine, Imperial College, London, W2 1PG, UKFull list of author information is available at the end of the article
© 2012 Satou et al.; licensee BioMed Central Ltd. This is an Open Access article distributed under the terms of the CreativeCommons Attribution License (http://creativecommons.org/licenses/by/2.0), which permits unrestricted use, distribution, andreproduction in any medium, provided the original work is properly cited.
Satou et al. Retrovirology 2012, 9:46http://www.retrovirology.com/content/9/1/46
A Self-archived copy inKyoto University Research Information Repository
https://repository.kulib.kyoto-u.ac.jp

accessory proteins, including Tax, Rex, p30, p12, andHTLV-1 bZIP factor (HBZ), which regulate viral geneexpression or proliferation of infected host cells [4].After the HTLV-1 provirus is integrated into the hostgenome, the virus expresses these regulatory andaccessory proteins to induce host cell proliferation orviral latency, resulting in persistent infection in vivo. Taxis known to influence various host cell-signaling path-ways, for example activation of NF-κB, and to contributeto proliferation and survival of infected cells [11,12]. An-other viral gene, the HBZ, which is encoded in theminus strand of HTLV-1 [13] and expressed constitu-tively in the infected host cells [14,15], also contributesto proliferation of the infected cells [14,16], dysregula-tion of differentiation and function of CD4+ T cells [17],and the pathogenesis of diseases such as T-cell lymph-oma and chronic inflammatory diseases [17,18]. On theother hand, viral protein expression induces the host im-mune response to eliminate the virus, which includesboth antibody and cytotoxic T lymphocytes (CTL)against the viral antigens [19-21]. It has been reportedthat the CTL response against this virus determinesHTLV-1 proviral load; yet, the host immune system can-not eliminate the HTLV-1 completely, which allowsHTLV-1 to establish persistent infection in almost allinfected individuals.Recent studies have clarified the presence of various
CD4+ T-cell subsets. CD4+ T cells can be divided intotwo major categories, effector T cells and regulatory Tcells. Effector T cells induce the activation of immuneresponses by secreting pro-inflammatory cytokineswhereas regulatory T cells, which express the transcrip-tion factor FoxP3 [22-24], suppress the immune re-sponse by both cell-contact dependent and independentmechanisms [25]. As an example of cell contactdependent suppression, expression of the immune sup-pressive molecule CTLA-4 on the cell surface inhibitsthe activation of surrounding neighboring T cells [26]. Inaddition, a recent report demonstrated that humanFoxP3+CD4+ T cells were composed of three phenotyp-ically and functionally different subsets according to thedegree of FoxP3 expression and CD45RA expression,namely CD45RA+FoxP3low resting Treg cells (rTreg cells),CD45RA−FoxP3high activated Treg cells (aTreg cells), orCD45RA−FoxP3low non-suppressive T cells (FoxP3low
non-Treg cells) [27]. Both rTreg cells and aTreg cells havesuppressive function, but FoxP3low non-Treg cells arenot suppressive.Previous studies have reported that the HTLV-1 pro-
virus is enriched in effector/memory T cells [28,29], andthe phenotype of ATL cells shares certain characteristicswith regulatory T cells based on the finding of FoxP3 ex-pression [30,31]. However there are few studies that sys-tematically and specifically investigate which recently
described CD4+ T-cell subset is infected by HTLV-1 inasymptomatic carriers (AC), HAM/TSP patients, andATL patients. To elucidate this point, we analyzed per-ipheral mononuclear cells (PBMCs) from naturallyHTLV-1-infected individuals, including AC, HAM/TSP,and ATL patients, by using multicolor flow cytometricanalysis combined with the detection of the viral antigenTax to identify the presence of HTLV-1 [32]. We foundthe specific CD4+FoxP3+ T-cell subset is frequentlyinfected with HTLV-1, which may allow the virusto achieve persistent infection in vivo, and should alsocontribute to the pathogenesis of the virus-associateddiseases.
ResultsThe frequency of FoxP3+ cells is positively correlated withHTLV-1 proviral loadPrevious studies reported that the HTLV-1 provirus wasfrequently detected in effector/memory CD4+ T cells[28], but at that time the analysis did not distinguish be-tween effector/memory CD4+ T cell and regulatory Tcells (Treg cells). Also further subsets of CD4+ T cellshave been identified recently, such as the division ofFoxP3+CD4+ T cells into three distinct subsets [27]. Inorder to uncover the impact of HTLV-1 infection on theCD4+ T-cell subset, it is necessary to re-evaluate theCD4+ subsets in HTLV-1-infected individuals. We ana-lyzed 23 ACs, 10 HAM/TSP patients, 10 ATL patients,and 10 healthy donors in this study as shown in Table 1.Almost all ATL cells express CD4, and indeed the per-centage of CD4+ T-cells in ATL patients was signifi-cantly higher than that of uninfected healthy donors(p= 0.0051, Figure 1A). There were no significant differ-ences in the percentage of CD4+ T cells between HD,AC, and HAM/TSP individuals (p= 0.2153 and 0.4597,respectively, Figure 1A). To characterize the CD4+ T-cellsubset in more detail, we stained PBMCs with anti-CD4,anti-CD45RA, and anti-FoxP3 antibodies. In this analysiswe divided CD4+ T cells into three distinct subsets,which include two FoxP3− populations (CD45RA+ naïveT cells and CD45RA− effector/memory T cells) and aFoxP3+ population. As shown in Figure 1B, the percent-age of naïve CD4+ T cells was decreased in ATL patients(p= 0.0097), but did not differ significantly between HD,AC and HAM/TSP (p= 0.8381 and 0.2567, respectively).The percentages of effector/memory CD4+ T cells werenot significantly different among the four studied subjectgroups (Figure 1C). However, frequencies of FoxP3+ cellsin HTLV-1 infected individuals (AChigh, ATL, HAM/TSP) were remarkably higher than those of HD(p= 0.0054, 0.0002 and 0.0002, respectively, Figure 1D).The frequencies of FoxP3+ cells in AC were significantlycorrelated with HTLV-1 proviral load (PVL) (r = 0.60,p= 0.0051, Figure 1E). Additionally, the absolute number
Satou et al. Retrovirology 2012, 9:46 Page 2 of 12http://www.retrovirology.com/content/9/1/46
A Self-archived copy inKyoto University Research Information Repository
https://repository.kulib.kyoto-u.ac.jp
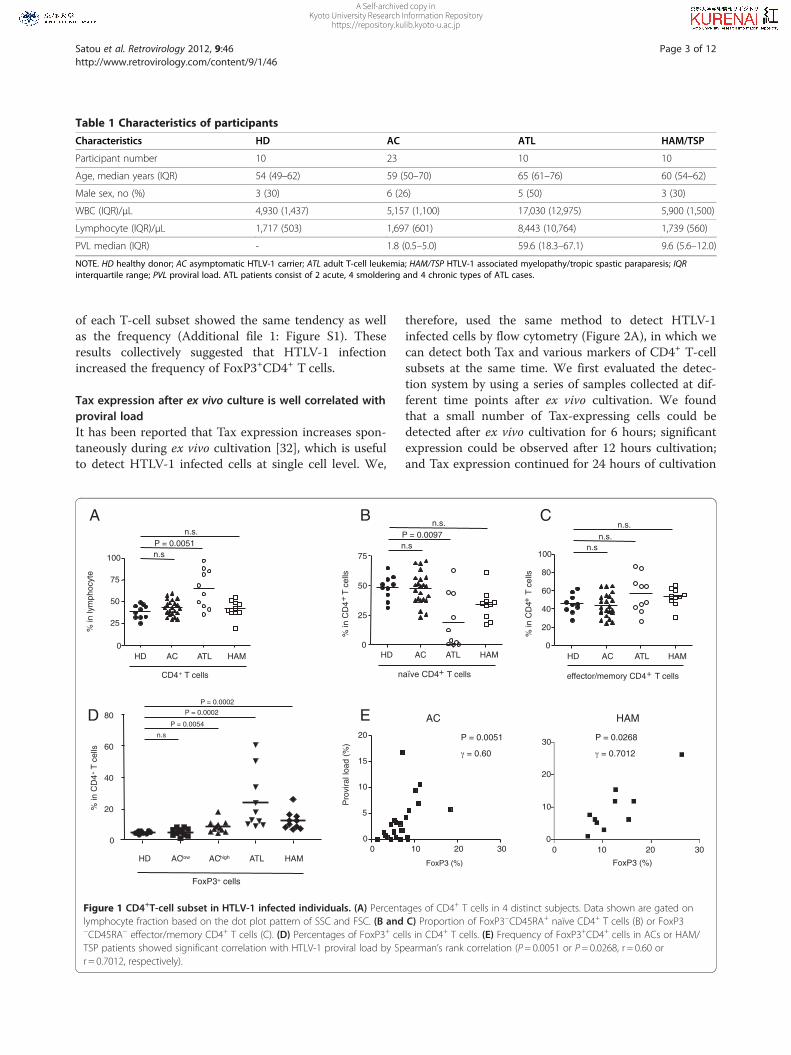
of each T-cell subset showed the same tendency as wellas the frequency (Additional file 1: Figure S1). Theseresults collectively suggested that HTLV-1 infectionincreased the frequency of FoxP3+CD4+ T cells.
Tax expression after ex vivo culture is well correlated withproviral loadIt has been reported that Tax expression increases spon-taneously during ex vivo cultivation [32], which is usefulto detect HTLV-1 infected cells at single cell level. We,
therefore, used the same method to detect HTLV-1infected cells by flow cytometry (Figure 2A), in which wecan detect both Tax and various markers of CD4+ T-cellsubsets at the same time. We first evaluated the detec-tion system by using a series of samples collected at dif-ferent time points after ex vivo cultivation. We foundthat a small number of Tax-expressing cells could bedetected after ex vivo cultivation for 6 hours; significantexpression could be observed after 12 hours cultivation;and Tax expression continued for 24 hours of cultivation
B
0
25
50
75
HD AC ATL HAM
C
HD AC ATL HAM 0
20
40
60
80
100
D
A
HD AC ATL HAM 0
25
50
75
100
% in
lym
phoc
yte
CD4+ T cells
% in
CD
4+
T c
ells
% in
CD
4+ T
cel
ls
+ T cells effector/memory CD4+ T cells
FoxP3+ cells
0
20
40
60
80
HD AClow AChigh ATL HAM
% in
CD
4+ T
cel
ls
E
0 10 20 30 0
5
10
15
20
FoxP3 (%)
Pro
vira
l loa
d (%
)
P = 0.0051
= 0.60
n.sP = 0.0051
n.s.
n.sP = 0.0097
n.s.
n.sn.s.
n.s.
n.s
P = 0.0054
P = 0.0002
P = 0.0002
AC
P = 0.0268
= 0.7012
HAM
FoxP3 (%)
0
10
20
30
0 10 20 30
Figure 1 CD4+T-cell subset in HTLV-1 infected individuals. (A) Percentages of CD4+ T cells in 4 distinct subjects. Data shown are gated onlymphocyte fraction based on the dot plot pattern of SSC and FSC. (B and C) Proportion of FoxP3−CD45RA+ naïve CD4+ T cells (B) or FoxP3−CD45RA− effector/memory CD4+ T cells (C). (D) Percentages of FoxP3+ cells in CD4+ T cells. (E) Frequency of FoxP3+CD4+ cells in ACs or HAM/TSP patients showed significant correlation with HTLV-1 proviral load by Spearman’s rank correlation (P= 0.0051 or P= 0.0268, r = 0.60 orr = 0.7012, respectively).
Table 1 Characteristics of participants
Characteristics HD AC ATL HAM/TSP
Participant number 10 23 10 10
Age, median years (IQR) 54 (49–62) 59 (50–70) 65 (61–76) 60 (54–62)
Male sex, no (%) 3 (30) 6 (26) 5 (50) 3 (30)
WBC (IQR)/μL 4,930 (1,437) 5,157 (1,100) 17,030 (12,975) 5,900 (1,500)
Lymphocyte (IQR)/μL 1,717 (503) 1,697 (601) 8,443 (10,764) 1,739 (560)
PVL median (IQR) - 1.8 (0.5–5.0) 59.6 (18.3–67.1) 9.6 (5.6–12.0)
NOTE. HD healthy donor; AC asymptomatic HTLV-1 carrier; ATL adult T-cell leukemia; HAM/TSP HTLV-1 associated myelopathy/tropic spastic paraparesis; IQRinterquartile range; PVL proviral load. ATL patients consist of 2 acute, 4 smoldering and 4 chronic types of ATL cases.
Satou et al. Retrovirology 2012, 9:46 Page 3 of 12http://www.retrovirology.com/content/9/1/46
A Self-archived copy inKyoto University Research Information Repository
https://repository.kulib.kyoto-u.ac.jp

(Figure 2B). In order to confirm the efficiency of thissystem, we analyzed the correlation between HTLV-1proviral load and the percentage of Tax expression inthis system.Consistent with previous reports that Tax expression
is frequently silenced in ATL cells, Tax expression afterex vivo cultivation of ATL cells was not correlated withthe proviral load (Figure 2C). The percentage of Taxpositive cells tended to be lower than the proviral loadeven after ex vivo culture in AC and HAM/TSP patients,but we found that Tax positivity showed a significantcorrelation with the proviral load both in AC and HAM/TSP (r = 0.91 or 0.61, p= 0.00002 or 0.0334, respectively,Figure 2D and E). In order to investigate whether T-cellsubset markers, including FoxP3 and CD45RA, are influ-enced by ex vivo cultivation, we analyzed their expres-sion both before and after cultivation. The resultsshowed that the frequency of FoxP3 or CD45RA wasnot significantly changed during ex vivo culture (Add-itional file2: Figure S2). These findings collectively
indicate the usefulness of this Tax detection system forthis study.
The frequency of HTLV-1 infection in each CD4+ T-cellsubsetWe next investigated which T-cell subset is frequentlyinfected with HTLV-1. We cultivated PBMCs isolatedfrom HTLV-1 infected individuals ex vivo for 12–18 hoursand stained with antibodies to Tax and various T-cell sub-set markers such as CD4, CD8, and FoxP3. Consistentwith the previous reports, the frequency of Tax positivityin CD4+ T cells was much higher than that in CD8+ T cells(p< 0.0001, Figure 3A). Among CD4+ T cells, the FoxP3positive cell population contained a significantly higherratio of Tax positive cells than that in FoxP3 negativecells (p< 0.0001, Figure 3B). In line with the finding inFigure 1E, the frequencies of FoxP3+ cells were signifi-cantly correlated with Tax positivity in CD4+ T cells.(r = 0.48, p= 0.0257, Figure 3C). These results indicated
PBMC isolation
Intracelluar staining of Tax
Ex vivo culture
Cultivation time hours
0
2.5
5.0
7.5
0 3 6 12 18 24
AC1
AC2
AC3%
in C
D4+
T c
ells
A B C
Flowcytometric analysis
Tax+ cells
D E
0 2 4 6 8 10 0
5
10
15
20
Tax (%)
Pro
vira
l loa
d (%
)
P = 0.00002
= 0.91
AC
ATL
P = 0.0973 = -0.5531
0 10 20 300
25
50
75
100
125
Tax (%)
Pro
vira
l loa
d (%
)
P = 0.0334 = 0.6098
0
5
10
15
0 10 20
HAM
Tax (%)
Pro
vira
l loa
d (%
)
Figure 2 Characterization of Tax expression after ex vivo cultivation. (A) A flowchart of the experiment to detect Tax by flow cytometry. (B)The percentages of Tax expression in CD4+ T cells after ex vivo culture are shown from 3 distinct ACs. (C–E) Correlation between Tax positivity inCD4+ T cells and PVL in ATL patients (C), ACs (D) or HAM/TSP (E).
Satou et al. Retrovirology 2012, 9:46 Page 4 of 12http://www.retrovirology.com/content/9/1/46
A Self-archived copy inKyoto University Research Information Repository
https://repository.kulib.kyoto-u.ac.jp

that the increased FoxP3+ cells in HTLV-1-infected indivi-duals were frequently infected with HTLV-1.
Characterization of FoxP3+CD4+ T-cell subset in ACWe further focused on the FoxP3+CD4+ T-cell subset asdefined previously (Figure 4A) [27]. First, we investi-gated the frequency of FoxP3+CD4+ T-cell subset in HDor AC. The results showed that the frequencies of rTreg
or aTreg in AClow or AChigh were not significantly differ-ent from that in HD (Figure 4B and 4 C), but FoxP3low
non-Treg cells were significantly more frequent in theAChigh population (p= 0.0080, Figure 4D). We next ana-lyzed the presence of HTLV-1 in each CD4+ T-cell sub-set by using AC sample. We observed that Tax positivityin FoxP3− effector/memory CD4+ T cells was higherthan that of FoxP3− naïve CD4+ T cells (p< 0.0001,Figure 4E). Since effector/memory CD4 T cells are themost dominant in total CD4 T cells in terms of absolutecell number, the Tax-expressing cells are most abundantin effector/memory CD4 T cells (Additional file 3: Figure
S3). More interestingly, Tax positivity in aTreg cells orFoxP3low non-Treg cells was much higher than that ofrTreg cells in ACboth AClow and AChigh subjects(p< 0.0001 or 0.0001, respectively, Figure 4E). Theseresults indicated that HTLV-1 is frequently present inaTreg cells or FoxP3
low non-Treg cells.
Characteristics of T-cell subsets in HAM/TSP patientsTo investigate the inflammatory aspects of HTLV-1 infec-tion, we next focused on PBMCs of HAM/TSP patients.There were no significant differences in the percentage ofCD4+ or CD8+ T cells between HD and HAM/TSP groups(p=0.3073 and 0.1509, respectively, Figure 5A). The resultof Tax staining showed that HTLV-1 infection was predom-inantly detected in CD4+ T cells, and at a higher frequencyin CD4+FoxP3+ T cells than CD4+FoxP3− T cells(p=0.0069, Figure 5B). To characterize the phenotype ofFoxP3+ cells in HAM/TSP patients, we investigated the ex-pression levels of Treg associated molecules, and found thatthe expression of GITR or CTLA-4 in HAM/TSP patients
A
CD
4
0
500
1000
1500
Tax
6.3
0
2000
4000
6000
8000
Tax
0.4
CD4+ CD8+
B
0
1000
2000
3000
FoxP3
2.9797
0
20
40
60
80
Tax
17.9
0
1000
2000
3000
Tax
0.7
C
FoxP3 FoxP3+
0
10
20
30
40
CD4+ CD8+
0
2.5
5.0
7.5
10.0
0 10 20 0
2.5
5.0
7.5
10.0
FoxP3 (%)
FoxP3 FoxP3+
% o
f Tax
+ c
ells
% o
f Tax
+ c
ells
% o
f Tax
+ c
ells
0 103 104 105
0
103
104
105
35.3
32.3
CD8
P < 0.0001
P < 0.0001
P = 0.00257
= 0.48
Figure 3 Frequency of HTLV-1-infection in each CD4+ T-cell subset of asymptomatic HTLV-1 carriers. PBMCs from HTLV-1 asymptomaticcarriers (n = 23) were cultivated for 18 hours, stained with anti-CD4, anti-CD8, anti-FoxP3, and anti-Tax antibodies, and analyzed by flow cytometry.(A) Representative dot plots of CD4 and CD8 and histograms of Tax in CD4+ or CD8+ T cells (Left panel). Right, cumulative results from 23 ACindividuals are shown in graph (Right panel). (B) Representative histograms of Tax expression in FoxP3+ or FoxP3− cell (Left panel). Right,cumulative results from 23 AC individuals are shown in graph (Right panel). (C) Tax positivity in CD4+ T cells showed significant correlation withFoxP3 positivity in CD4+ T cells by Spearman’s rank correlation (P= 0.0257, r = 0.48).
Satou et al. Retrovirology 2012, 9:46 Page 5 of 12http://www.retrovirology.com/content/9/1/46
A Self-archived copy inKyoto University Research Information Repository
https://repository.kulib.kyoto-u.ac.jp

was significantly lower than that in HD (p=0.0328 or0.00002, respectively, Figure 5C). On the contrary, CD25expression was high in HAM/TSP patients (p=0.0099,Figure 5C). We further evaluated FoxP3+CD4+ T-cell sub-set in HAM/TSP patients. The frequencies of rTreg werenot significantly different from that in HD (p =0.9096,Figure 5D), but aTreg cells or FoxP3
low non-Treg cells wereremarkably increased (p=0.0250 or 0.0004, Figure 5E and5F). Furthermore, aTreg cells or FoxP3low non-Treg cellsshowed a high frequency of Tax+cells compared with rTreg
cells (p=0.0069 or 0.0069, respectively, Figure 5G) asobserved in ACs (Figure 4E). These data indicated thatHTLV-1 infection significantly influenced not only thefrequency but also the phenotype of CD4+FoxP3+ T cellsin an inflammatory disease HAM/TSP.
Phenotypical analyses of ATL cellsPrevious studies reported that some ATL cells expressFoxP3 or CD25 [30,31,33], but the precise information
about FoxP3+CD4+ T-cell subset of ATL cells remainsunknown. We, therefore, analyzed CD4+ T-cell subsetsfor ATL cases. FoxP3 positivity was 80% in ATL cases;yet the expression level was different among the cases(Figure 6A), which is consistent with previous reports[30,31]. In line with the finding in asymptomatic HTLV-1-infected carriers that the percentage of HTLV-1 inFoxP3low non-Treg cells or aTreg cells was high (Figure 4E),ATL cells analyzed in this study did not expressCD45RA, suggesting that FoxP3-expressing ATL cellsmight be derived from FoxP3low non-Treg or aTreg cells.CD25 expression on ATL cells was generally high, butthere was also much variation among the cases(Figure 6B).
DiscussionFoxP3+ Treg cells play a crucial role in persistent infec-tion and pathogenesis of chronic viral infection. Previousstudies have suggested that Treg cells suppress virus-
E
FoxP3
CD
45R
A
0 102 103 104 1050
200
400
600
800
0.4 0 102 103 104 105
0
5
10
15
20
5.2
0 102 103 104 1050
200
400
600
6.0
0 102 103 104 1050
50
100
150
24.9
0 102 103 104 1050
20
40
60
80
20.0
A
FoxP3
CD
45R
A a
b c
Tax
Tax Tax
Tax
Tax
0
5
10
15
0
5
10
15
0
5
10
15
rTreg cell
HD AClow AChigh
n.s.n.s.
aTreg cells
HD AClow AChigh
% in
CD
4+ c
ells
% in
CD
4+ c
ells
% in
CD
4+ c
ells
FoxP3low nonTreg cells
HD AClow AChigh
B C D
n.s.n.s.
n.s.P = 0.0080
AC with high PVL
nT emT rTreg aTreg nonTreg
0
25
50
75
AC with low PVL
nT emT rTreg aTreg nonTreg
0
10
20
30
CD4+FoxP3 CD4+FoxP3+ CD4+FoxP3 CD4+FoxP3+
% o
f Tax
+ c
ells
P = 0.0205
P = 0.0385
P = 0.0316
P < 0.0001
P < 0.0001
P < 0.0001
Figure 4 Characterization of FoxP3+CD4+ T-cell subset in AC samples. (A) A result of flow cytometric dot plots of CD45RA and FoxP3 inCD4+ T cells of an AC sample is shown as an example. FoxP3+CD4+ T cells were classified into three subsets. a, CD45RA+FoxP3low resting Tregcells (rTreg cells); b, CD45RA
−FoxP3low non-regulatory T cells (FoxP3low non-Treg cells), c, CD45RA−FoxP3high activated Treg cells (aTreg cells). (B–D)
Frequencies of the FoxP3+CD4+ T-cell subset in HD, AClow, and AChigh. Percentages of resting Treg cells (B), activated Treg cells (C), and FoxP3low
non-Treg cells (D) in CD4+ T cells are shown. (E) Representative flow cytometric dot plots of CD45RA and FoxP3 and histograms of Tax expressionin each CD4+ T-cell subset in an AC sample (Left panel). Cumulative results from 13 AClow and 10 AChigh individuals are shown in the graph(Middle and right panels).
Satou et al. Retrovirology 2012, 9:46 Page 6 of 12http://www.retrovirology.com/content/9/1/46
A Self-archived copy inKyoto University Research Information Repository
https://repository.kulib.kyoto-u.ac.jp

specific CD8+ T-cell effector functions in chronic humanviral infections such as human immunodeficiency virus,hepatitis C virus and cytomegalovirus [34,35]. Regardingthis point, FoxP3+ Treg cells play a role in facilitatingviral persistence. In HTLV-1 infection, the frequency ofFoxP3+ cells is indeed correlated with the impairment ofCTL activity against the viral antigen Tax in HAM/TSPpatient [36]. On the other hand, FoxP3+ Treg cells couldprevent tissue damage caused by excessive immune re-sponse triggered by viral infection. In addition to thesegeneral roles of FoxP3+ Treg cells in chronic viral infec-tion, FoxP3+ Treg cells should have some specific role inHTLV-1 infection, because FoxP3+ Treg cells are com-prised in CD4+ T cells, which are a main host cell popu-lation of HTLV-1. Here we performed a comprehensiveanalysis of CD4+ T-cell subsets in individuals naturallyinfected with HTLV-1 and revealed that the frequency ofHTLV-1 infection is positively correlated with the fre-quency of FoxP3+ T cells (Figure 1E). The increasedFoxP3+ T cells themselves are frequently infected withHTLV-1 (Figure 3B), suggesting that HTLV-1 utilizes theFoxP3+ T cells as a host cell. What is the advantage forHTLV-1 to exist in FoxP3+ T cells? There are two
possibilities for this preference. First, FoxP3+ T cells areknown as hyper-proliferating cells in vivo with a doub-ling time of 8 days [37], which could contribute to clonalexpansion of infected cells. Second, HTLV-1 can evadethe host immune system by directly infecting this poten-tially immuno-suppressive cell population. Thus, HTLV-1-infection of FoxP3+ T cells should enable the virus toincrease or maintain proviral load and achieve persistentinfection.How then does HTLV-1 infection target FoxP3+ T cells?
This could be explained by the following two mechanisms.First, FoxP3+ T cells are known to contact with dendriticcells (DCs) frequently [38], which could increasethe chance of de novo viral infection between DCs andFoxP3+ T cells. A recent study demonstrated that cell-freeHTLV-1 efficiently infects DCs, and the infected DCs pro-mote de novo infection of CD4+ T cells [39]. This notionis consistent with the finding that effector/memory-typeCD45RA− Treg cells, including FoxP3low non-Treg cellsand FoxP3high aTreg cells, are more frequently infectedwith HTLV-1 than CD45RA+ rTreg cells (Figure 4E). Sec-ond, once FoxP3− T cells are infected with HTLV-1, HBZshould be expressed in the host cells. Since HBZ is recently
A B % of Tax+ cells
G
% o
f Tax
+ c
ells
naive e/m rTreg aTreg nonTreg
0
20
40
60
80
P = 0.0069
P = 0.0069
CD4+ CD8+ non T FoxP3 FoxP3+
0 10 20 30 40 50 60 70 P = 0.0069
HD HAM 0
10
20
30
40
50
60
% in
lym
phoc
yte
CD4+
HD HAM
CD8+
n.s
n.s.
C
Mea
n flu
ores
cenc
e in
tens
ity
GITR
HD HAM
0
50
100
150
CD25
HD HAM 0
500
1000
1500
2000
CTLA-4
HD HAM
0
500
1000
1500
2000 P = 0.0099 P = 0.0328 P < 0.0001
CD4+FoxP3 CD4+FoxP3+
0
5
10
15
20
25
0
5
10
15
20
25
0
5
10
15
20
25
n.s.
% in
CD
4+ c
ells
rTreg cells
HD HAM
aTreg cells
HD HAM
nonTreg cells
HD HAM
P= 0.0004 P= 0.025
F E D
Figure 5 Detailed characterizations of CD4+ T-cell subsets in HAM/TSP patients. Freshly isolated PBMCs from HAM/TSP patients (n = 10)were stained with anti-CD4, anti-CD45RA, anti-FoxP3 antibodies and analyzed by flow cytometry. To detect Tax expression, PBMCs were cultivatedfor 18 hours before antibody staining. (A) Percentages of CD4+ or CD8+ T cells in HAM/TSP patients. (B) Tax positivity of CD4+, CD8+, non-T,FoxP3−, or FoxP3+ cell populations in HAM/TSP patients. (C) Expression levels of Treg associated molecules in FoxP3+ cells of HD or HAM/TSPpatients. (D–F) Frequencies of the FoxP3+CD4+ T-cell subset in HD and HAM/TSP patients. Percentages of rTreg cells (D), aTreg cells (E), andFoxP3low non-Treg cells (F) in CD4+ T cells are shown. (G) Tax positivity of each CD4+ T-cell subset in HAM/TSP patients.
Satou et al. Retrovirology 2012, 9:46 Page 7 of 12http://www.retrovirology.com/content/9/1/46
A Self-archived copy inKyoto University Research Information Repository
https://repository.kulib.kyoto-u.ac.jp

reported to induce FoxP3 expression via enhancing TGF-βsignaling pathway [17,40], HTLV-1 infection is likely toconvert FoxP3− cells into FoxP3+ cells. In addition,HTLV-1 has a cell-extrinsic effect on FoxP3+ cell gener-ation. HTLV-1 infected cells secrete CCL22 via expres-sion of Tax, which indirectly contributes to thegeneration and maintenance of HTLV-1 uninfectedFoxP3+ cells [41,42]. This would contribute to anincreased number of HTLV-1-uninfected FoxP3+ cells.Since FoxP3+ Treg cells play a crucial role in suppres-
sing immune response, the increase of FoxP3+ cells
observed in HTLV-1 infection may contribute to im-munodeficiency, which is frequently observed in HTLV-1 infection [43]. On the other hand, the high frequencyof FoxP3+ T cells observed in HAM/TSP patients isparadoxical, because the pathogenesis of HAM/TSP isbelieved to be inflammatory. Therefore, we analyzed thephenotype of the increased FoxP3+ cells and observedthat CTLA-4 and GITR expression of FoxP3+ T cells inHAM/TSP patient was significantly reduced comparedto uninfected individuals (Figure 5C). A similar observa-tion was reported previously that the expression level of
FoxP3
CD
25
A
B
0102 103 104 105
0102
103
104
105
0.0640.69
7.02
31.2
60.5
0102 103 104 105
0102
103
104
105
0.033
0.89
13.4
51.633.6
0102 103 104 105
0102
103
104
105
0.16
3.77
39.8
46.4 9.75
0102 103 104 105
0102
103
104
105
0.57
34
38
26.1 1.23
0102 103 104 105
0102
103
104
105
0.2
53.6
17.2
28.5 0.44
0102 103 104 105
0102
103
104
105
0.15
4.73
7.76
57.3 29.9
0102 103 104 105
0102
103
104
105
13.5 0.84
37.717.1
30.4
0102 103 104 105
0102
103
104
105
29.6 2.54
26.13.35
38.3
0102 103 104 105
0102
103
104
105
41.3 0.37
5.011.94
51.1
0102 103 104 105
0102
103
104
105
3.63 0.27
5.01 2.4
88.9
FoxP3
CD
45R
A
Case 1 Case 2 Case 3 Case 4 Case 5
Case 6 Case 7 Case 8 Case 9 Case 10
0102 103 104 105
0102
103
104
105 1.06 13.8
74.111
0 102 103 104 105
0102
103
104
105 4.85 16.1
1465
0102 103 104 105
0102
103
104
105 8.39 13.1
16.262.3
0 102 103 104 105
0102
103
104
105 1.15 1.35
56.441.1
0102 103 104 105
0102
103
104
105 3.95 55
31.59.55
0102 103 104 105
0102
103
104
105 2.86 26.2
63.47.51
0102 103 104 105
0102
103
104
105 19.5 2.9
3.1974.4
0102 103 104 105
0102
103
104
105 19.3 3.58
2.6774.4
0102 103 104 105
0102
103
104
105 4.91 13.5
10.271.4
0102 103 104 105
0102
103
104
105 4.74 27.7
23.244.4
Case 1 Case 2 Case 3 Case 4 Case 5
Case 6 Case 7 Case 8 Case 9 Case 10
Figure 6 Characterization of CD4+ T-cell subsets in ATL cells. PBMCs from ATL patients (n = 10) were stained with anti-CD4, anti-CD45RA,anti-CD25, and anti-FoxP3 antibodies and analyzed by flow cytometry. (A) The expression pattern of CD45RA and FoxP3 of CD4+ T cells in ATLpatients. (B) The expression pattern of CD25 and FoxP3 of CD4+ T cells in ATL patients.
Satou et al. Retrovirology 2012, 9:46 Page 8 of 12http://www.retrovirology.com/content/9/1/46
A Self-archived copy inKyoto University Research Information Repository
https://repository.kulib.kyoto-u.ac.jp

FoxP3, GITR, or CTLA-4 mRNA in CD4+CD25+ T cellsof HAM/TSP patients is lower than that of HD [44].That report used CD4+CD25+ as a marker of Treg cells,but CD4+CD25+ T cells contain not only FoxP3+ Treg
cells but also FoxP3− activated T cells. Particularly theproportion of CD4+CD25+FoxP3−activated T cells is up-regulated in HAM/TSP patients, which is likely to re-duce the proportion of FoxP3+ Treg cells in CD4+CD25+
T cells of HAM/TSP patients. Thus, the expression levelof GITR or CTLA-4 in FoxP3+ T cells of HAM/TSPpatients has not been elucidated yet. To avoid this con-cern, we utilized the multicolor flow cytometry, whichenabled us to show that CTLA-4 and GITR were clearlydown regulated in FoxP3+ T cells of HAM/TSP patients.Then what is the underlying mechanism of this
phenomenon? We reported recently that HBZ-Tg miceshowed a pro-inflammatory phenotype in spite of the in-crease of Foxp3+ T cells [17], which is similar to HAM/TSP patients (Figure 1D). Treg associated molecules werealso down regulated in Foxp3+ T cells of HBZ-Tg mice.Thus, HBZ-mediated FoxP3 dysfunction may play a rolein the abnormality regarding FoxP3+ cells in HAM/TSPpatients. It has been reported that Tax also contributesto the dysregulation of FoxP3+ Treg cells. Tax suppressesFoxP3 expression at transcriptional level [45], which alter-natively or additionally could contribute to the abnormalphenotype of FoxP3+ cells. These findings collectively indi-cate that the increased FoxP3+ Treg cells were functionallyimpaired in HAM/TSP patients. Furthermore, FoxP3+
CD4+ T cells in HAM/TSP patient contain an increasedFoxP3+ non-Treg population (Figure 5F), which would con-tribute to the inflammatory phenotype of HAM/TSP viageneration of pro-inflammatory cytokine-producing CD4+
T cells such as THAM cells [46] or exFoxp3 cells [47].In the current study, we did not observed FoxP3 re-
pression during Tax expression by ex vivo cultivation.This result seems to be inconsistent with a previous re-port that Tax represses FoxP3 expression [45]. There aretwo possible explanation of this inconsistency. First,there is the difference of the ways to express Tax. In theprevious study, the authors used transfection of plasmidthat induces Tax expression by the CMV promoter. Weused endogenous HTLV-1 provirus to express Tax.Therefore, the expression level of Tax in our currentstudy should be much lower than that of the previousstudy. In addition, Tax expression was induced in a pro-portion of FoxP3+ cell in our current study. Second,there are differences in incubation time for Tax expres-sion. In the previous study, the authors evaluated FoxP3expression after 48 hours of transfection, whereas weevaluated FoxP3 expression within 24 hours after Taxexpression.High expression levels of CD25 are also well documented
in HTLV-1 infection [33]. Consistent with previous
findings, CD25 expression is upregulated in FoxP3+ cells ofHAM/TSP patient (Figure 5C). One determinant of thesusceptibility to HAM/TSP is host genetic polymorphismsuch as MHC class 1, which influences the efficiency ofCTL against HTLV-1 [48,49]. HTLV-1-infected individualswho have HLA class I susceptible for HAM/TSP may allowhigh expression of Tax and/or HBZ, which could cause up-regulation of CD25 molecules in the FoxP3+ cell population(Figure 5C).It is controversial whether ATL is a leukemia of FoxP3+
Treg cells or not. However, there is no a priori reason to as-sume that ATL cells must be exclusively derived fromFoxP3+ Treg cells or non-Treg cells. Indeed, there are previ-ous reports to support both possibilities. Some studies havereported that ATL cells have regulatory functions [50,51],whereas other studies reported no regulatory function inATL [52,53]. We showed here that HTLV-1 is frequentlydetectable in CD4+FoxP3+ T cells (Figure 3B) in AC. Morethan half of ATL cells express FoxP3 (Figure 6), eventhough FoxP3 expression in ATL cells is variable as shownin the present and previous studies [30,31]. These findingsprompt us to propose an idea that more than a half of ATLcells are possibly derived from FoxP3+ Treg cells. Wereported previously that HBZ expression is constitutivelyactive but Tax expression is frequently silenced in ATLcells, which possibly contributes to high frequency ofFoxP3+ ATL.
ConclusionThis study demonstrated that HTLV-1 infection inducedthe abnormality of frequency and phenotype of FoxP3+
T cells, suggesting that HTLV-1 has evolved a sophisti-cated strategy to achieve persistent infection by directlyaffecting the central regulator of the host immune sys-tem. HTLV-1-mediated dysregulation of FoxP3+ T cellsis likely to be a critical cellular mechanism for theunderstanding HTLV-1 pathogenicity.
MethodsClinical samples and ethics statementPBMCs were obtained from asymptomatic HTLV-1infected carriers (n = 23), HAM/TSP patients (n = 10),ATL patients (n = 10), and age-matched healthy controls(n = 10). Characteristics of each group are presented inTable 1. ATL patients consist of 2 acute, 4 smolderingand 4 chronic types of ATL cases. Genomic DNAextracted from PBMCs was used to determine proviralload (PVL) as described previously [29]. Briefly, PVL wasquantified by real time PCR and calculated by using gen-omic DNA of TL-Om1, an ATL cell line with one copyof complete HTLV-1 provirus, as a standard of 100%.We defined AC with less than 2% of proviral load asAClow and AC with more than 2% of proviral load asAChigh. This study was conducted according to the
Satou et al. Retrovirology 2012, 9:46 Page 9 of 12http://www.retrovirology.com/content/9/1/46
A Self-archived copy inKyoto University Research Information Repository
https://repository.kulib.kyoto-u.ac.jp

principles expressed in the Declaration of Helsinki andapproved by the Institutional Review Board of KyotoUniversity (844 and E-921). All patients provided writteninformed consent for the collection of samples and sub-sequent analysis.
AntibodiesThe following antibodies were purchased from BD Phar-Mingen; purified monoclonal antibody (mAb) for humanCD3 (UCHT1), CD4 (RPA-T4), CD8a (RPA-T8),CD45RA (NI100) and CTLA-4 (BNI3). Purified mAbsfor human CD25 (BC96), GITR (eBio AITR) and FoxP3(236A/E7) were purchased from eBioscience.
Flow cytometric analysisPBMCs were isolated with Ficoll-Isopaque (GE Healthcare)gradient centrifugation. Flow cytometric analyses were car-ried out using a FACS CantoII with Diva Software (BDPharmingen), and the data were analyzed by FlowJo soft-ware (Treestar). To discriminate dead cells, we used LIVE/DEAD Fixable Near-IR Dead Cell Stain Kit (Invitrogen).For cell surface staining, 106 cells were incubated withmAbs for 30 minutes at 4°C, and then analyzed. For intra-cellular staining, we used a human FoxP3 staining kitaccording to the manufacture’s protocol (eBioscience). Todistinguish FoxP3+ and FoxP3− cell population clearly, weused isotype control according to the manufacture’srecommendation. To detect the viral antigen Tax, we cul-tured PBMCs from ACs or HAM/TSP patients for 12–18hours and stained with monoclonal antibodies againstFoxP3 or Tax (MI-73) [54], and then analyzed by flowcytometry.
Statistical analysisTo compare 2 groups when data were determined tohave a Gaussian distribution, the Student t test was used.If data did not have a Gaussian distribution, the Mann–Whitney U test was used for unpaired data, and the Wil-cox signed-ranks test was used for paired data. The ACgroup and HD did not differ significantly in sex or age,using chi-squared test and Mann–Whitney U test. Dif-ferences with P< 0.05 were considered to be statisticallysignificant. Correlations were evaluated using Spear-man’s rank correlation.
Additional files
Additional file 1: Figure S1. Absolute cell numbers of each CD4+T-cellsubset in HTLV-1 infected individuals. (A) Absolute cell numbers of CD4+
T cells in 4 distinct subjects. Data shown are gated on lymphocytefraction based on the dot plot pattern of SSC and FSC. (B and C)Absolute cell numbers of FoxP3−CD45RA+ naïve CD4+ T cells (B) or FoxP3−CD45RA− effector/memory CD4+ T cells (C). (D) Absolute cell numbersof FoxP3+ cells in CD4+ T cells.
Additional file 2: Figure S2. Effect of ex vivo cultivation on FoxP3 and
CD45RA expression. The percentages of FoxP3 and CD45RA expression inCD4+ T cells both before and after ex vivo culture are shown from 5distinct ACs.
Additional file 3: Figure S3. Frequency of each CD4 T-cell subset inTax-expressing cell population in AC. Cumulative results from 23ACindividuals are shown in the graph.
Competing interestsThe authors declare that they have no competing interests.
AcknowledgmentsThis study was supported by Grant-in-Aid for Scientific Research fromJapanese Society for the Promotion of Science and Ministry of Health Laborand Welfare, a grant from Takeda Science Foundation, a grant from NaitoFoundation. We thank Prof. Charles R.M. Bangham for critical reading of themanuscript and Ms. M. Nakashima for preparation of peripheral blood ofpatients. We are most grateful to the patients and healthy donors whoparticipated in this study.
Author details1Laboratory of Virus Control, Institute for Virus Research, Kyoto University,Kyoto, 606-8507, Japan. 2Department of Hematology, Imamura Bun-inHospital, Kagoshima, 890-0064, Japan. 3Department of Neurology, GraduateSchool of Medical Science, Kyoto Prefectural University of Medicine, Kyoto,602-8566, Japan. 4Department of Hematology, Kumamoto University Schoolof Medicine, Kumamoto, 860-8556, Japan. 5Current address: ImmunologySection, Division of Infectious Diseases, Department of Medicine, ImperialCollege, London, W2 1PG, UK.
Authors’ contributionsThis study was designed by YS and MM. Laboratory analysis was performedby YS and JT. Data analysis was performed by YS, AU, JT and MM. Clinicalsamples and data were provided by AU, MN and KN. YS and MM wrote thepaper. All authors read and approved the final manuscript.
Received: 24 December 2011 Accepted: 30 May 2012Published: 30 May 2012
References1. Uchiyama T, Yodoi J, Sagawa K, Takatsuki K, Uchino H: Adult T-cell
leukemia: clinical and hematologic features of 16 cases. Blood 1977,50:481–492.
2. Gallo RC: The discovery of the first human retrovirus: HTLV-1 and HTLV-2.Retrovirology 2005, 2:17.
3. Takatsuki K: Discovery of adult T-cell leukemia. Retrovirology 2005, 2:16.4. Matsuoka M, Jeang KT: Human T-cell leukaemia virus type 1 (HTLV-1)
infectivity and cellular transformation. Nat Rev Cancer 2007, 7:270–280.5. Gessain A, Barin F, Vernant JC, Gout O, Maurs L, Calender A, de The G:
Antibodies to human T-lymphotropic virus type-I in patients withtropical spastic paraparesis. Lancet 1985, 2:407–410.
6. Osame M, Usuku K, Izumo S, Ijichi N, Amitani H, Igata A, Matsumoto M, TaraM: HTLV-I associated myelopathy, a new clinical entity. Lancet 1986,1:1031–1032.
7. Sugimoto M, Nakashima H, Watanabe S, Uyama E, Tanaka F, Ando M, ArakiS, Kawasaki S: T-lymphocyte alveolitis in HTLV-I-associated myelopathy.Lancet 1987, 2:1220.
8. Milagres SP, Sanches JA Jr, Milagres AC, Valente NY: Histopathological andimmunohistochemical assessment of acquired ichthyosis in patientswith human T-cell lymphotropic virus type I-associated myelopathy. Br JDermatol 2003, 149:776–781.
9. Etoh K, Tamiya S, Yamaguchi K, Okayama A, Tsubouchi H, Ideta T, Mueller N,Takatsuki K, Matsuoka M: Persistent clonal proliferation of human T-lymphotropic virus type I-infected cells in vivo. Cancer Res 1997,57:4862–4867.
10. Cavrois M, Leclercq I, Gout O, Gessain A, Wain-Hobson S, Wattel E:Persistent oligoclonal expansion of human T-cell leukemia virus type 1-infected circulating cells in patients with Tropical spastic paraparesis/HTLV-1 associated myelopathy. Oncogene 1998, 17:77–82.
11. Yoshida M: Multiple viral strategies of htlv-1 for dysregulation of cellgrowth control. Annu Rev Immunol 2001, 19:475–496.
Satou et al. Retrovirology 2012, 9:46 Page 10 of 12http://www.retrovirology.com/content/9/1/46
A Self-archived copy inKyoto University Research Information Repository
https://repository.kulib.kyoto-u.ac.jp

12. Giam CZ, Jeang KT: HTLV-1 Tax and adult T-cell leukemia. Front Biosci2007, 12:1496–1507.
13. Gaudray G, Gachon F, Basbous J, Biard-Piechaczyk M, Devaux C, Mesnard JM: Thecomplementary strand of the human T-cell leukemia virus type 1 RNAgenome encodes a bZIP transcription factor that down-regulates viraltranscription. J Virol 2002, 76:12813–12822.
14. Satou Y, Yasunaga J, Yoshida M, Matsuoka M: HTLV-I basic leucine zipper factorgene mRNA supports proliferation of adult T cell leukemia cells. Proc NatlAcad Sci U S A 2006, 103:720–725.
15. Usui T, Yanagihara K, Tsukasaki K, Murata K, Hasegawa H, Yamada Y, Kamihira S:Characteristic expression of HTLV-1 basic zipper factor (HBZ) transcripts inHTLV-1 provirus-positive cells. Retrovirology 2008, 5:34.
16. Arnold J, Zimmerman B, Li M, Lairmore MD, Green PL: Human T-cell leukemiavirus type-1 antisense-encoded gene, Hbz, promotes T-lymphocyteproliferation. Blood 2008, 112:3788–3797.
17. Satou Y, Yasunaga J, Zhao T, Yoshida M, Miyazato P, Takai K, Shimizu K, OhshimaK, Green PL, Ohkura N, et al: HTLV-1 bZIP factor induces T-Cell lymphoma andsystemic inflammation in vivo. PLoS Pathog 2011, 7:e1001274.
18. Saito M, Matsuzaki T, Satou Y, Yasunaga J, Saito K, Arimura K, Matsuoka M,Ohara Y: In vivo expression of the HBZ gene of HTLV-1 correlates withproviral load, inflammatory markers and disease severity in HTLV-1associated myelopathy/tropical spastic paraparesis (HAM/TSP).Retrovirology 2009, 6:19.
19. Jacobson S, Shida H, McFarlin DE, Fauci AS, Koenig S: Circulating CD8+cytotoxic T lymphocytes specific for HTLV-I pX in patients with HTLV-Iassociated neurological disease. Nature 1990, 348:245–248.
20. Bangham CR, Osame M: Cellular immune response to HTLV-1. Oncogene2005, 24:6035–6046.
21. Kannagi M, Harada S, Maruyama I, Inoko H, Igarashi H, Kuwashima G, Sato S,Morita M, Kidokoro M, Sugimoto M, et al: Predominant recognition ofhuman T cell leukemia virus type I (HTLV-I) pX gene products by humanCD8+ cytotoxic T cells directed against HTLV-I-infected cells. Int Immunol1991, 3:761–767.
22. Fontenot JD, Gavin MA, Rudensky AY: Foxp3 programs the developmentand function of CD4+CD25+ regulatory T cells. Nat Immunol 2003, 4:330–336.
23. Hori S, Nomura T, Sakaguchi S: Control of regulatory T cell developmentby the transcription factor Foxp3. Science 2003, 299:1057–1061.
24. Khattri R, Cox T, Yasayko SA, Ramsdell F: An essential role for Scurfin inCD4+CD25+ T regulatory cells. Nat Immunol 2003, 4:337–342.
25. Sakaguchi S, Yamaguchi T, Nomura T, Ono M: Regulatory T cells andimmune tolerance. Cell 2008, 133:775–787.
26. Wing K, Onishi Y, Prieto-Martin P, Yamaguchi T, Miyara M, Fehervari Z,Nomura T, Sakaguchi S: CTLA-4 control over Foxp3+ regulatory T cellfunction. Science 2008, 322:271–275.
27. Miyara M, Yoshioka Y, Kitoh A, Shima T, Wing K, Niwa A, Parizot C, Taflin C,Heike T, Valeyre D, et al: Functional delineation and differentiationdynamics of human CD4+ T cells expressing the FoxP3 transcriptionfactor. Immunity 2009, 30:899–911.
28. Richardson JH, Edwards AJ, Cruickshank JK, Rudge P, Dalgleish AG: In vivocellular tropism of human T-cell leukemia virus type 1. J Virol 1990,64:5682–5687.
29. Yasunaga J, Sakai T, Nosaka K, Etoh K, Tamiya S, Koga S, Mita S, Uchino M,Mitsuya H, Matsuoka M: Impaired production of naive T lymphocytes inhuman T-cell leukemia virus type I-infected individuals: its implicationsin the immunodeficient state. Blood 2001, 97:3177–3183.
30. Karube K, Ohshima K, Tsuchiya T, Yamaguchi T, Kawano R, Suzumiya J,Utsunomiya A, Harada M, Kikuchi M: Expression of FoxP3, a key moleculein CD4CD25 regulatory T cells, in adult T-cell leukaemia/lymphoma cells.Br J Haematol 2004, 126:81–84.
31. Abe M, Uchihashi K, Kazuto T, Osaka A, Yanagihara K, Tsukasaki K, HasegawaH, Yamada Y, Kamihira S: Foxp3 expression on normal and leukemic CD4 +CD25+ T cells implicated in human T-cell leukemia virus type-1 isinconsistent with Treg cells. Eur J Haematol 2008, 81:209–217.
32. Hanon E, Hall S, Taylor GP, Saito M, Davis R, Tanaka Y, Usuku K, Osame M,Weber JN, Bangham CR: Abundant tax protein expression in CD4+ T cellsinfected with human T-cell lymphotropic virus type I (HTLV-I) isprevented by cytotoxic T lymphocytes. Blood 2000, 95:1386–1392.
33. Hattori T, Uchiyama T, Toibana T, Takatsuki K, Uchino H: Surface phenotypeof Japanese adult T-cell leukemia cells characterized by monoclonalantibodies. Blood 1981, 58:645–647.
34. Aandahl EM, Michaelsson J, Moretto WJ, Hecht FM, Nixon DF: Human CD4+CD25+ regulatory T cells control T-cell responses to humanimmunodeficiency virus and cytomegalovirus antigens. J Virol 2004,78:2454–2459.
35. Cabrera R, Tu Z, Xu Y, Firpi RJ, Rosen HR, Liu C, Nelson DR: Animmunomodulatory role for CD4(+)CD25(+) regulatory T lymphocytes inhepatitis C virus infection. Hepatology 2004, 40:1062–1071.
36. Toulza F, Heaps A, Tanaka Y, Taylor GP, Bangham CR: High frequency ofCD4 + FoxP3+ cells in HTLV-1 infection: inverse correlation withHTLV-1-specific CTL response. Blood 2008, 111:5047–5053.
37. Vukmanovic-Stejic M, Zhang Y, Cook JE, Fletcher JM, McQuaid A, Masters JE,Rustin MH, Taams LS, Beverley PC, Macallan DC, Akbar AN: Human CD4+CD25hi Foxp3+ regulatory T cells are derived by rapid turnover ofmemory populations in vivo. J Clin Invest 2006, 116:2423–2433.
38. Yamazaki S, Steinman RM: Dendritic cells as controllers of antigen-specificFoxp3+ regulatory T cells. J Dermatol Sci 2009, 54:69–75.
39. Jones KS, Petrow-Sadowski C, Huang YK, Bertolette DC, Ruscetti FW:Cell-free HTLV-1 infects dendritic cells leading to transmission andtransformation of CD4(+) T cells. Nat Med 2008, 14:429–436.
40. Zhao T, Satou Y, Sugata K, Miyazato P, Green PL, Imamura T, Matsuoka M:HTLV-1 bZIP factor enhances TGF-beta signaling through p300coactivator. Blood 2011, 118:1865–1876.
41. Hieshima K, Nagakubo D, Nakayama T, Shirakawa AK, Jin Z, Yoshie O:Tax-inducible production of CC chemokine ligand 22 by human T cellleukemia virus type 1 (HTLV-1)-infected T cells promotes preferentialtransmission of HTLV-1 to CCR4-expressing CD4+ T cells. J Immunol 2008,180:931–939.
42. Toulza F, Nosaka K, Tanaka Y, Schioppa T, Balkwill F, Taylor GP, Bangham CR:Human T-lymphotropic virus type 1-induced CC chemokine ligand 22maintains a high frequency of functional FoxP3+ regulatory T cells. JImmunol 2010, 185:183–189.
43. Tachibana N, Okayama A, Ishizaki J, Yokota T, Shishime E, Murai K, Shioiri S,Tsuda K, Essex M, Mueller N: Suppression of tuberculin skin reaction inhealthy HTLV-I carriers from Japan. Int J Cancer 1988, 42:829–831.
44. Ramirez E, Cartier L, Rodriguez L, Alberti C, Valenzuela MA: In vivofluctuation of Tax, Foxp3, CTLA-4, and GITR mRNA expression in CD4(+)CD25(+) T cells of patients with human T-lymphotropic virus type1-associated myelopathy. Braz J Med Biol Res 2010, 43:1109–1115.
45. Yamano Y, Takenouchi N, Li HC, Tomaru U, Yao K, Grant CW, Maric DA,Jacobson S: Virus-induced dysfunction of CD4 + CD25+ T cells inpatients with HTLV-I-associated neuroimmunological disease. J Clin Invest2005, 115:1361–1368.
46. Yamano Y, Araya N, Sato T, Utsunomiya A, Azakami K, Hasegawa D, Izumi T,Fujita H, Aratani S, Yagishita N, et al: Abnormally high levels ofvirus-infected IFN-gamma + CCR4+ CD4+ CD25+ T cells in aretrovirus-associated neuroinflammatory disorder. PLoS One 2009,4:e6517.
47. Zhou X, Bailey-Bucktrout SL, Jeker LT, Penaranda C, Martinez-Llordella M,Ashby M, Nakayama M, Rosenthal W, Bluestone JA: Instability of thetranscription factor Foxp3 leads to the generation of pathogenicmemory T cells in vivo. Nat Immunol 2009, 10:1000–1007.
48. Jeffery KJ, Usuku K, Hall SE, Matsumoto W, Taylor GP, Procter J, Bunce M,Ogg GS, Welsh KI, Weber JN, et al: HLA alleles determine humanT-lymphotropic virus-I (HTLV-I) proviral load and the risk ofHTLV-I-associated myelopathy. Proc Natl Acad Sci U S A 1999,96:3848–3853.
49. Macnamara A, Rowan A, Hilburn S, Kadolsky U, Fujiwara H, Suemori K,Yasukawa M, Taylor G, Bangham CR, Asquith B: HLA class I binding ofHBZ determines outcome in HTLV-1 infection. PLoS Pathog 2010, 6:e1001117.
50. Chen S, Ishii N, Ine S, Ikeda S, Fujimura T, Ndhlovu LC, Soroosh P, Tada K,Harigae H, Kameoka J, et al: Regulatory T cell-like activity of Foxp3+ adultT cell leukemia cells. Int Immunol 2006, 18:269–277.
51. Yano H, Ishida T, Inagaki A, Ishii T, Kusumoto S, Komatsu H, Iida S,Utsunomiya A, Ueda R: Regulatory T-cell function of adult T-cellleukemia/lymphoma cells. Int J Cancer 2007, 120:2052–2057.
52. Shimauchi T, Kabashima K, Tokura Y: Adult T-cell leukemia/lymphoma cellsfrom blood and skin tumors express cytotoxic T lymphocyte-associatedantigen-4 and Foxp3 but lack suppressor activity toward autologousCD8+ T cells. Cancer Sci 2008, 99:98–106.
Satou et al. Retrovirology 2012, 9:46 Page 11 of 12http://www.retrovirology.com/content/9/1/46
A Self-archived copy inKyoto University Research Information Repository
https://repository.kulib.kyoto-u.ac.jp

53. Toulza F, Nosaka K, Takiguchi M, Pagliuca T, Mitsuya H, Tanaka Y, Taylor GP,Bangham CR: FoxP3+ regulatory T cells are distinct from leukemiacells in HTLV-1-associated adult T-cell leukemia. Int J Cancer 2009,125:2375–2382.
54. Mori K, Sabe H, Siomi H, Iino T, Tanaka A, Takeuchi K, Hirayoshi K, HatanakaM: Expression of a provirus of human T cell leukaemia virus type I byDNA transfection. J Gen Virol 1987, 68(Pt 2):499–506.
doi:10.1186/1742-4690-9-46Cite this article as: Satou et al.: HTLV-1 modulates the frequency andphenotype of FoxP3+CD4+ T cells in virus-infected individuals.Retrovirology 2012 9:46.
Submit your next manuscript to BioMed Centraland take full advantage of:
• Convenient online submission
• Thorough peer review
• No space constraints or color figure charges
• Immediate publication on acceptance
• Inclusion in PubMed, CAS, Scopus and Google Scholar
• Research which is freely available for redistribution
Submit your manuscript at www.biomedcentral.com/submit
Satou et al. Retrovirology 2012, 9:46 Page 12 of 12http://www.retrovirology.com/content/9/1/46
A Self-archived copy inKyoto University Research Information Repository
https://repository.kulib.kyoto-u.ac.jp


![Inflammatory manifestations of HTLV-1 and their ... · HTLV-1 and HTLV-2 can usually be discriminated [35]. The immune response to HTLV-1 is strong and the serum antibody titer, which](https://static.fdocuments.in/doc/165x107/5f2ee3b1fcc4502be05de1e8/inflammatory-manifestations-of-htlv-1-and-their-htlv-1-and-htlv-2-can-usually.jpg)


![SIK inhibition in human myeloid cells modulates TLR and IL ... · induces an anti-inflammatory phenotype ... M1 versus M2 dichotomy is far too reductive to ... [25]. For M(LPS + IgG)](https://static.fdocuments.in/doc/165x107/5af4f8757f8b9a74448d93ea/sik-inhibition-in-human-myeloid-cells-modulates-tlr-and-il-an-anti-inflammatory.jpg)
