TITLE: GRAIN YIELD, GRAVIMETRIC MOISTURE CONTENT, DRY MATTER
99
GRAIN YIELD, GRAVIMETRIC MOISTURE CONTENT, DRY MATTER ACCUMULATION AND CHLOROPHYLL PRODUCTION IN MAIZE-LEGUME INTERCROP UNDER MINIMUM AND CONVENTIONAL TILLAGE SYSTEMS MOKGADI MIZEN RAMOROKA DISSERTATION SUBMITTED IN FULFILMENT OF THE REQUIREMENTS FOR THE DEGREE MASTER OF AGRICULTURAL MANAGEMENT (AGRONOMY) DEPARTMENT OF PLANT PRODUCTION, FACULTY OF SCIENCE AND AGRICULTURE, AT THE UNIVERSITY OF LIMPOPO, SOUTH AFRICA AUGUST 2008 SUPERVISOR: PROF. K. K. AYISI Table of contents
Transcript of TITLE: GRAIN YIELD, GRAVIMETRIC MOISTURE CONTENT, DRY MATTER

GRAIN YIELD, GRAVIMETRIC MOISTURE CONTENT, DRY MATTER ACCUMULATION AND CHLOROPHYLL PRODUCTION IN MAIZE-LEGUME INTERCROP UNDER
MINIMUM AND CONVENTIONAL TILLAGE SYSTEMS
MOKGADI MIZEN RAMOROKA
DISSERTATION SUBMITTED IN FULFILMENT OF THE REQUIREMENTS FOR THE DEGREE MASTER OF AGRICULTURAL MANAGEMENT (AGRONOMY)
DEPARTMENT OF PLANT PRODUCTION, FACULTY OF SCIENCE AND AGRICULTURE, AT THE UNIVERSITY OF LIMPOPO, SOUTH AFRICA
AUGUST 2008
SUPERVISOR: PROF. K. K. AYISI
Table of contents

1
LIST OF TABLES ......................................................................................................... 3 LIST OF FIGURES ....................................................................................................... 4 DISSERTATION ABSTRACT ..................................................................................... 6 CHAPTER I ................................................................................................................... 8 GENERAL INTRODUCTION AND LITERATURE REVIEW .................................. 9 CHAPTER 2 ................................................................................................................ 18 INTRODUCTION ....................................................................................................... 19 MATERIALS AND METHODS ................................................................................. 22
Experimental Design ................................................................................................ 24 Agronomic characteristics ....................................................................................... 25 Data Analysis ........................................................................................................... 25
RESULTS AND DISCUSSION .................................................................................. 26 Site characteristics ................................................................................................... 26
Initial soil condition ............................................................................................. 26 Weather ................................................................................................................ 27
Grain yield ............................................................................................................... 28 Maize.................................................................................................................... 28 Legumes ............................................................................................................... 29
Agronomic Characteristics ....................................................................................... 31 CONCLUSIONS.......................................................................................................... 33 CHAPTER 3 ................................................................................................................ 44 INTRODUCTION ....................................................................................................... 45 MATERIALS AND METHODS ................................................................................. 49
Gravimetric moisture ............................................................................................... 49 Dry matter ................................................................................................................ 49 Chlorophyll readings ................................................................................................ 50
RESULTS AND DISCUSSIONS ................................................................................ 51 Gravimetric moisture ............................................................................................... 51 Chlorophyll Production ............................................................................................ 52 Dry matter production .............................................................................................. 54
Maize.................................................................................................................... 54 Legumes ............................................................................................................... 55
CONCLUSION ............................................................................................................ 56 CONCLUSION AND RECOMMENDATIONS ........................................................ 79
Major study finding.................................................................................................. 79 Recommendations .................................................................................................... 80
REFERENCES ............................................................................................................ 81 DISSERTATION APPENDIX .................................................................................... 85
Table 1. Response of maize grain yield to tillage systems at Dalmada (2002/2003 and 2003/2004) and Syferkuil (2003/2004). ........................................ 86 Table 2: Moisture response to tillage system at Syferkuil during 2003/2004 growing season......................................................................................................... 87 Table3: Moisture response to cropping system at Syferkuil during 2003/2004 growing season......................................................................................................... 88 Table 4: Moisture response to tillage system at Dalmada during 2003/2004 growing season. ...................................................................................................................... 89 Table 5: Moisture response to cropping system at Dalmada during 2003/2004 growing season......................................................................................................... 90 Table 6: Moisture response to tillage system (Dalmada 2002/2003). ..................... 91 Table 7: Moisture response to cropping system (Dalmada 2002/2003). ................. 92

2
Table 8: Effect of tillage system on chlorophyll content in the youngest fully expanded leaf at Dalmada during 2002/2003 growing season. ............................... 93 Table 9: Effect of tillage system on chlorophyll content in the lower leaves at Dalmada during 2002/2003 growing season............................................................ 94 Table 10: Effect of cropping system on chlorophyll content in the lower leaves at Dalmada during 2002/2003 growing season............................................................ 95 Table 11: Effect of Crop system on chlorophyll content in the youngest fully expanded leaf at Dalmada during 2003/2004 growing season. ............................... 96 Fig 1. Maize yield components as influenced by tillage systems at Dalmada during 2002/2003 growing season. ..................................................................................... 97 Fig. 2. Maize yield components as influenced by tillage systems at Dalmada and Syferkuil during 2003/2004 growing season. .......................................................... 98

3
LIST OF TABLES
Table 2.1: Soil form characteristics and their level of suitability for crop production.
Table 2.2: Initial top and subsoil nutrient status at Dalmada and Syferkuil during the 2002/2003 and 2003/2004 growing season. Table 2.3: Maize yield components as influenced by tillage systems at Dalmada during 2002/2003 growing season. Table 2.4: Maize yield components as influenced by tillage systems at Dalmada during 2003/2004 growing season. Table 2.5: Maize yield components as influenced by tillage systems at Syferkuil during 2003/2004 growing season. Table 2.6: Summary of maize yield components as influenced by tillage systems at Dalmada during 2002/2003 and 2003/2004 and at Syferkuil during 2003/2004 growing season. Table 2.7: Tasseling, silking and maturity at Dalmada and Syferkuil for both growing season. Table 2.8: Maize plant height (m) at Dalmada (2002/2003 and 2003/2004) and Syferkuil (2003/2004) as influenced by tillage systems. Table 3.1: Maize total Dry matter accumulation response to tillage system at Dalmada and Syferkuil during 2002/2003 and 2003/2004 growing seasons. Table 3.2: Maize total Dry matter accumulation response to cropping system at Dalmada and Syferkuil during 2002/2003 and 2003/2004 growing seasons. Table 3.3: Legume Dry matter accumulation to tillage systems at Dalmada and Syferkuil during 2002/2003 and 2003/2004 growing seasons. Table 3.4: Legume dry matter accumulation response to cropping system at Dalmada and Syferkuil in all growing seasons.

4
LIST OF FIGURES
Fig.2.1: Land type maps at Dalmada and at the University of the Limpopo Experimental farm at Syferkuil. Fig. 2.2: Minimum and maximum temperature for Syferkuil during 2003/2004 growing season and for Dalmada during 2003/2004 and 2002/2003 growing season. Fig. 2.3: Rainfall and evaporation measurements for Syferkuil during 2003/2004 growing season and Dalmada during 2002/2003 and 2003/2004 growing season. Fig. 2.4: Maize grain yield at Dalmada and Syferkuil as influenced by tillage systems during 2002/2003 and 2003/2004 growing season. Figure 3.1: Moisture response to tillage system at Dalmada during 2002/2003 growing season. Figure 3.2: Moisture response to tillage system at Dalmada during 2003/2004 growing season. Figure 3.3: Moisture responses to tillage system at Syferkuil during 2003/2004 growing season. Figure 3.4: Moisture response to cropping system at 0-150 mm depth at Dalmada during 2002/2003 growing season. Figure 3.5: Moisture response to cropping system at 150-300 mm depth at Dalmada during 2002/2003 growing season. Figure 3.6: Moisture response to cropping system at 0-150 mm depth at Dalmada during 2003/2004 growing season. Figure 3.7: Moisture response to cropping system at 150-300 mm depth at Dalmada during 2003/2004 growing season. Figure 3.8: Moisture response to cropping system at 0-150 mm depth at Syferkuil during 2003/2004 growing season. Figure 3.9: Moisture response to cropping system at 150-300 mm depth at Syferkuil during 2003/2004 growing season. Figure 3.10: Effect of tillage system on chlorophyll production in youngest leaf and senescence in oldest under CT and MT. Figure 3.11: Effect of tillage system on chlorophyll production in youngest leaf and senescence in oldest under CT and MT. Figure 3.12: Effect of tillage system on chlorophyll production in youngest leaf and senescence in oldest under CT and MT.

5
Figure 3.13: Effect of cropping system on chlorophyll content of maize intercropped with the different legumes in the youngest fully expanded leaf at Dalmada during 2002/2003 growing season. Figure 3.14: Effect of cropping system on chlorophyll content of maize intercropped with the different legumes in the lowest leaves at Dalmada during 2002/2003 growing season. Figure 3.15: Effect of cropping system on chlorophyll content of maize intercropped with the different legumes in the youngest fully expanded leaf at Dalmada during 2003/2004 growing season. Figure 3.16: Effect of cropping system on chlorophyll content of maize intercropped with the different legumes in the lowest leaves at Dalmada during 2003/2004 growing season. Figure 3.17: Effect of cropping system on chlorophyll content of maize intercropped with the different legumes in the youngest fully expanded leaf at Syferkuil during 2003/2004 growing season. Figure 3.18: Effect of cropping system on chlorophyll content of maize intercropped with the different legumes in the lowest leaves at Syferkuil during 2003/2004 growing season.

6
DISSERTATION ABSTRACT
379 words
Maize is a dominant crop in smallholder farming systems in the Limpopo province of
South Africa, generally cultivated as intercrop with grain legumes. The major
constraint in this cropping system is inadequate soil moisture during the growing
season, which also limits nutrient availability to the component crops. The minimum
tillage system has been reported to improve soil moisture availability on farmers’
fields but this has not yet been verified in an intercropping system in the province.
The objective of this study was to quantify grain yield and chlorophyll production of
intercropped maize, and to assess seasonal moisture availability under minimum
tillage (MT) and conventional tillage (CT) systems. Dryland field experiments were
conducted at two locations in the province namely, farmer’s field at Dalmada in
2002/2003 and 2003/2004 growing seasons and at the University of Limpopo
Experimental farm at Syferkuil during the 2003/2004. The experimental design was
a randomized complete block in split plot arrangement at all locations and seasons.
Tillage systems consisting of conventional tillage and minimum tillage were the main
plot treatments, whereas five different cropping systems namely, sole maize, and
maize intercrop with cowpea (variety, Bechuana White), cowpea (variety, Agripers),
Lablab bean (variety, Rongai) and Velvet bean were assigned as sub-plot treatments.
Maize grain yield in 2002/2003 at Dalmada was significantly lower (357 kg/ha)
under CT relative to 755kg/ha under MT. In 2003/2004 at Dalmada, grain yields
under the two systems were similar, where as at Syferkuil, 15% higher grain yield
results was obtained under MT. Minimum tillage systems resulted in higher number
of maize cobs per plant at Dalmada in both growing seasons and weight per cob was

7
higher under MT at both locations and seasons. At Dalmada, significantly higher soil
moisture was recorded under the MT relative to the CT depending on depth and
sampling dates. Chlorophyll content of the youngest fully expanded leaves of maize
was generally higher under MT than CT, but this was observed only at the later stages
of plant growth. The results also showed that the rate of senescence (reduced
chlorophyll content in older leaves) was higher in maize plants grown under CT
relative to those under MT. The minimum tillage system has shown the potential of
being a superior system for dryland maize production, but further research involving
additional locations is required to ascertain this fact.

8
CHAPTER I
GRAIN YIELD, GRAVIMETRIC MOISTURE CONTENT, DRY
MATTER ACCUMULATION AND CHLOROPHYLL
PRODUCTION IN MAIZE-LEGUME INTERCROP UNDER
MINIMUM AND CONVENTIONAL TILLAGE SYSTEMS.

9
GENERAL INTRODUCTION AND LITERATURE REVIEW
Maize is the major field crop produced by smallholder and commercial farmers in the
Limpopo province. Worldwide, maize is considered a staple food crop for mankind
through direct consumption and indirectly through animal feed (Evans, 1993). The
crop originated from Mexico but its production spread quickly around the world. In
the Limpopo province, maize is generally cultivated as intercrop with grain legumes
such as cowpea, groundnut and bambara nuts. Grain legumes are major sources of
protein for humans. Intercropping is reported to be one of the most common cropping
systems in Africa (Vandemeer, 1992). Some of the advantages of including grain
legumes in cropping systems are, reduced insect and disease problems, improved soil
N availability through biological nitrogen fixation by the legumes, and increased yield
per unit area (Van Rensburg, 1998).
Water is an important constituent of all living cells, comprising approximately 90% of
the plant tissue and it is a medium for proper nutrition and healthy growth in higher
plants. It is also required for cellular activities and maintenance of turgor pressure
within cells. The water in plant cells keeps the stem upright and maintains expanded
leaves so as to receive sunlight for photosynthesis. Hence, any water stress during the
course of growth constitutes a major limitation to crop growth and development and
final yield (Modiba, 2002).
In South Africa and Limpopo Province in particular, water is the most limiting
production resource among smallholder farmers engaged in field crop production. A
dry and cold winter and hot summer with few raining days characterize the Limpopo
province. Moisture evaporates very quickly because of the prolonged hot days.

10
Water sources are generally scarce, and agriculture’s share of these resources is
competing with the domestic and industrial sectors.
Agriculture in the Limpopo province is an active sector but unless moisture
availability during crop growth is maintained on farmer’s fields, productivity of crops
will remain marginal. Irrigation is currently the most effective means of minimizing
the constraint of moisture in the cultivation of crops but this facility is available to
only a small proportion of the entire farming population in the province. In the
production of a crop such as maize, moisture stress especially during the reproductive
stage can lead to drastic yield reduction in grain mass. The initial effects of water
stress could occur during the process of germination and emergence. Germination of
maize seed, like that of many field crops, is very sensitive to water shortage and
therefore, reduced soil moisture potential during the germination process can limit
moisture movement through the seed coat. Water deficits can drastically reduce the
yield from its genetic potential to zero. In the Limpopo province, losses in crop yields
from water deficits probably exceed the losses from all other yield-reducing causes
combined.
Low soil nitrogen and phosphorus content are the next limiting production factors in
the Limpopo province and South Africa as a whole. Nitrogen stress in field crops
generally decreases leaf area index, leaf area duration and crop photosynthesis rate, all
of which leads to lower radiation interception, decreased crop growth rate, and hence
lower grain yield (Barbieri et al., 2000). Olaoye, (2002) found that an increased
surface residue under minimum tillage and the resulting increase in organic matter
had a positive effect on corn yield in some but not in all soil types. Authors further

11
indicated that the increase in surface residue which results in a long term increase of
organic matter can improve soil and its water management, especially in soils which
are naturally low in organic matter. Improvement in soil fertility can be achieved by
retaining or incorporating crop residues on the field and supplementing the residues
with mineral fertilizers and also through the extensive use of leguminous species in
rotational or intercropping systems. Retaining crop residues maintains soil fertility
through the slow build up of soil organic matter, thereby improving aggregation and
water-holding capacity of soils (Belay et al., 1998).
Plants obtain the bulk of their nitrogen requirements primarily as nitrate and
ammonium from the soil. It is well documented that the mineral nutrition of plants is
related, in many ways directly or indirectly, to soil moisture since the root hairs
absorb dissolved plant nutrients from the soil solution. Dry soils will obviously result
in lower nutrient uptake since the lack of water reduces nutrient flow and diffusion.
Nitrate is very water-soluble and its movement through the soil via the process of
mass flow to plant roots is reduced when soil moisture is low (Modiba, 2002).
An important cropping system that has been reported to improve soil moisture
availability on farmers’ fields in recent years is the No-till or reduced tillage system.
No-till system is a production practice, where the soil is left undisturbed from harvest
to planting, except in a narrow seedbed and for nutrient application (Unger, 1991).
No-till system has been defined as one in which the crop is planted either without
tillage or with just sufficient tillage to allow placement and coverage of the seed with
soil to allow it to germinate and emerge (Torbert et al., 2001). It has been further
defined as the use of herbicides or other method of killing all live plants on the

12
surface of the soil, followed by as little disturbance of the soil as possible to provide
good seed placement. No-till system leaves crop residues on the soil surface that
reduces the risk of water and wind erosion. It also reduces soil temperature,
minimizes soil water evaporation and hence increases water availability in the soil for
crops to grow. The system can also reduce the requirements for labour and the general
cost of production, which create the potential for higher profitability (Rozas et al.,
1999).
Currently, the main soil preparation method in the Limpopo province is by the
conventional tillage system, which involves ploughing followed by disking.
Conventional tillage system is designed to prepare a seedbed by eliminating almost all
the residue that is left on the soil surface. The major goals of using conventional
tillage system by farmers are to control weeds prior to planting and also to prepare a
fine seedbed for placement. Ploughed surface may also improve water infiltration for
a short period of time after an initial tillage operation. However, the long-term effects
of it are generally, a steady decline in soil structure, which reduces soil porosity,
increases erosion and hence reduced soil fertility and productivity. The adoption of
the no-till system thus has the potential of improving soil moisture and nutrient
availability during crop growth. However, since the system is relatively new in the
Limpopo province, thorough information needs to be generated before
recommendations are made to farmers.
Water resources are generally scarce, not only in South Africa but in many other parts
of the continent. In South Africa, field crop production is mainly carried out summer
rain conditions. Rainfed crop production under this climate thus depends strongly on

13
both the amount and distribution of rain. The amount of rainfall is however low and
generally poorly distributed and as a result, crop yield and water use efficiency are
low and variable (Oweis et al., 2000).
Although water is the most abundant compound on earth, severe to occasional deficits
can occur during a growing season, which can have devastating effects on crop
productivity. The water used per day by maize generally increases rapidly from about
30 days before silking, peaks during fertilization and early grain fill and declines
thereafter (Sprague and Dudley, 1988). Smith (1995) also, reported that moisture
deficit is most damaging during the silking to early grain fill period, causing up to 8
percent yield reduction per day of stress. It is therefore important for maize farmers to
time the planting date so that the peak water demand of the crop coincides with
periods of rainfall abundance.
Moisture stress interrupts photosynthesis and growth until turgor is restored by
removal of the stress. Sprague and Dudley (1988) pointed out that, a deficit of water
is the single most important factor limiting crop yield on the worldwide scale. Water
use varies with the stage of development of the maize crop. Early in the growing
season the loss is primarily evaporation from soil. As the crop cover increases,
transpiration becomes an increasingly dominant factor.
No-till increases the water availability for the crop. By using the no-till system,
surface residue can be managed to better conserve soil water for greater use efficiency
by the plant. Water loss is different under no-till system, compared with a
conventional tillage system (Daniel et al., 1999). Soil water storage is greater where

14
there is no-till compared to stubble mulching or where disk tillage was used (Unger,
1991). Daniel et al., (1999) reported that surface residue potentially increases
infiltration of water into the soil by 25 to 50% under no-till as compared to
conventional tillage system. With conventional tillage, the soil surface is unprotected
against moisture evaporation from the beginning of the growing season until the end.
Moisture evaporation can also be minimized by using cover crops or cereal-legume
intercrops.
Maize is one of the most suitable crops for cultivation under no-tillage (Rozas et al.,
1999). No-till has the effect of increasing water infiltration and storage due to the soil
cover and the undisturbed soil structure as compared to conventional tillage. Soil
cover reduces water evaporation, keeps moisture in the soil, it does not disturb the
biological activities of the soil and makes water available to the root system. No-till
system can be effective not only in increasing soil and water conservation, but also by
reducing labor requirement and time (Kladivko, 2001;Yusuf et al., 1999; Rozas,
1999).
Cereal-legume intercrops are common throughout Africa and also in the Limpopo
Province of South Africa. There are many advantages of the system compared to sole
cultures. Two main reported advantages in intercrop system are transfer of nitrogen
fixed by legumes to the companion grass species (Brophy and Heichel, 1989;
Eaglesham et al., 1981) and the control of spread of diseases and pests (Ayisi and
Mposi, 2001 and Maluleke, 2004). These advantages vary over factors such as plant
species, planting dates, soil moisture and soil fertility. Cereals can be intercropped

15
with legumes, such as cowpea (Vigna unguiculata), lablab (Lablab purpureus) and
velvet bean (Mucuna pruriens) and other legumes.
Intercropping is the growing of two or more crops simultaneously on the same area of
land, and this is a very common practice among smallholder farmers in the Limpopo
Province. Intercropping legumes with maize is widely practised to maximize
productivity of land, which often increases the total crop yield above that of the sole
crops (Clark and Myers, 1994). Worldwide, intercropping has received a lot of
research attention and the published information is voluminous, but very little has
been published in South Africa.
In Africa, up to 90% of legumes are produced as intercrop with maize, millet or
sorghum, although sole crops of legumes are important in some parts of West Africa
(Vandemeer, 1992). Cowpea is one of the legumes that is widely intercropped. In
maize/cowpea intercropping system, the two components grow vigorously at about
the same time and therefore competition for available resources such as solar
radiation, moisture and nutrients is high. Solar radiation is a major resource
determining growth and yield of component crops in intercropping, especially when
other resources (e.g. water and N) are not severely limiting crop growth. As maize
plants become increasingly taller than cowpea plants, radiation becomes less available
to the cowpea. Some cowpea cultivars may mature before the adverse effect of
associated maize crop becomes severe and often early-maturing cowpea cultivars are
advantageous in intercropping (Watiki et al., 1993).

16
Maize can also be intercropped with legume cover crops such as velvet bean (Mucuna
pruriens), cowpea (Vigna unguiculata) and lablab (Lablab purpureus). These cover
crops are widely promoted as means of reversing or slowing down the negative
effects of landuse. Legume cover crops are used as improved fallows and
intercropped in major cereal cropping systems (Hartkap et al., 2002). Suggested
benefits include reduced soil erosion and weed competition, as well as improved soil
fertility and structure.
Velvet bean is one of the widely used Legume cover crops in maize production
systems in Meso America, West and South Africa. It is a vigorous, large seeded,
twining annual climbing legume with a growth cycle of 120-180 days, depending on
cultivar, planting date and environment (Hartkap et al., 2002). It has been proven in
Zimbabwe that velvet bean is a good nutritious crop as animal feed, both on dairy and
beef cattle (Murungweni et al., 2002). It has high level of protein and accumulates
large quantity of dry matter. Hartkap et al., (2002) reported that velvet bean can be
introduced into maize production systems in several arrangements including rotation,
relay cropping and intercropping. The benefits of velvet bean-maize systems may
vary with the arrangement of the crop relative to the maize crop, as well as the climate
and soil environment where it is grown.
Lablab bean (Lablab purpureus) is a leguminous species that has the potential to be
intercropped with maize because of its drought tolerance characteristics and ability to
produce large biomass quickly. Lablab originated in Asia but it is now grown for food
throughout the world. The crop is capable of contributing to the soil N pool through
symbiotic fixation and its biomass production can be used as cover cropping and

17
mulching. Preliminary studies conducted on lablab in the province indicated that the
crops could be very aggressive and competitive and if not well managed, could
severely suppress maize yields in an intercropping system.
One of the benefits of leaving plant residue on the soil surface is to reduce soil
moisture evaporation, improve the soil structure and increase the status of soil organic
matter. Any tillage method that leaves at least 20% of the surface soil covered with
crop residue is considered a conservative tillage (Olaoye, 2002; Kladivko, 2001).
Olaoye, (2002) indicated that residue placement preceding and during the growing
season, especially the amount remaining on the soil surface, affect accumulation of
soil organic matter, soil erodibility, soil temperature and soil moisture. They may also
affect crop growth, maturity and yield.
According to Yusuf et al., (1999), production results under no-till system changes soil
physical properties and can also increase soil organic matter content. These changes
influence the plant growth. The change can be detrimental, neutral or beneficial for
crop growth and yield depending on soil structure and texture, climatic factors such as
rainfall and weed control. Generally, no-till system have greater yield when used in
soils characterized by low organic matter and poor structure, rather than in well-
structured soils with high organic matter content.
The objective of this study is to determine the growth, moisture and nitrogen
dynamics in maize-legume intercropping as influenced by tillage systems.

18
CHAPTER 2
YIELD AND YIELD COMPONENTS OF MAIZE-LEGUME
INTERCROP SYSTEM UNDER MINIMUM AND
CONVENTIONAL TILLAGE.

19
INTRODUCTION Reduced tillage is an important soil conservation system in crop production. To
increase and maintain sustainability of crop yields in the Limpopo province, available
water should be efficiently utilized. Water is identified as the most widely limiting
factor for crop production in the province. As maize is the most important food crop
in most areas of the province, its yield needs to be maintained or enhanced to ensure
food security.
Increased water use efficiency (WUE) is of greatest interest to farmers when yields
are maximized for the available water supply in each growing season. High water use
efficiency is of less interest if it is not associated with high yields. Economic benefits
from increased water use efficiency under water-limiting conditions are usually
achieved only if yield is maximized for the available water (Sinclair and Muchow,
2001). WUE, the ratio of grain yield to crop water use, provide a simple means of
assessing whether yield is limited by water supply or other factors (Angus and van
Herwaarden, 2001). Water availability plays a major role in the regulation of seed
development and maturity.
Sinclair and Muchow (2001) reported that crops that establish deeper root systems
clearly increase crop yields while earlier maturity and osmotic adjustment had little or
no benefit. According to the authors, increasing soil volume occupied by roots was
the most effective adaptive mechanism for increasing growth during succession
drying cycle. Crops will be able to resist drought and even lodging caused by strong
wind.

20
Increased water storage within the soil profile is necessary to increasing plant
available soil water. Tillage roughens the soil surface and breaks apart any soil crust.
This leads to increased water storage by increasing infiltration into soil as well as
decreasing soil water losses by evaporation compared to residue-covered surface or an
undisturbed surface. If surface residue is buried, the soil surface can become smooth
and infiltration rates can decrease for subsequent rain events (Hatfield et al., 2001).
Many authors reported that the grain yield of most cereals (maize, sorghum wheat,
etc) is higher with reduced tillage, than with conventional tillage. More water is
conserved during the fallow periods and there is deeper wetting of the soil profile in
reduced tillage plots.
Reduced tillage systems increase the amount of plant residues left on soil surface. The
presence of residue on the surface reduced soil water evaporation by 34-50%
(Hatfield et al., 2001). Availability of crop residue does not only increase soil water
availability but also increases nitrogen availability to plants and soil organic matter.
Nitrogen is a complex part of the soil system and its availability is affected by soil
type, tillage, N resources (e.g. fertilizer and manure) and crop rotation. Nitrogen is a
major nutrient required by maize crop for higher grain yields and quality kernels, and
it is a key resource in influencing grain productivity of maize (Bratia and Mitra,
1990). Nitrogen is also a dominant factor affecting plant chlorophyll content, which is
generally related to yield (Reeves et al., 1993). Inorganic nitrogen fertilizers are
usually applied to maize as available nitrogen is limited in most soils (Sallah, 1991).
Nitrogen deficiency in maize may be detrimental to yield and quality, hence must be
avoided.

21
The specific objectives of this study are:
1. To determine the effect of tillage systems on grain yield of maize and legumes
in an intercropping system.
2. To evaluate yield components as affected by the tillage system.
3. To determine the response of agronomic characteristics of component crops
(flowering, silking, tasselling and physiological maturity) to the tillage
systems.

22
MATERIALS AND METHODS Field experiments were conducted at two locations in the Limpopo province namely,
University of the North Experimental farm at Syferkuil and at Dalmada on a farmer’s
field. At Dalmada, the experiment was conducted during the 2002/2003 and
2003/2004 growing seasons, whereas at Syferkuil it was conducted in 2003/2004. The
landtypes present at the experimental site at Dalmada is Ia132 and that of Syferkuil is
Bc56. The dominant soil form at Dalmada is Dundee followed by Valsrivier, whereas
at Syferkuil, the dominant forms are Hutton and Bainsvlei. The characteristic of the
soil forms and their suitability for crop production is presented in table 2.1 (Soil
classification working group, 1991)
Table 2.1. Soil form characteristics and their level of suitability for crop production.
Soil form Land types characteristics Suitability for agriculture
Hutton
This soil type is defined as a succession of red-coloured sandy material that exhibits little or no structure and is deemed freely draining. The topsoil horizon is Orthic A, which do not show organic, humic, vertic or melanic character. This material is generally easy to excavate by hand or light mechanical tillage implements. Clay content ranges from 10 -25 % and exhibits moderately low to low permeability.
Suitable
Dundee Soil depth exceeds 1200 mm and a clay content of 15 - 20 %. It is characterised by seasonal perched water table which may subject it waterlogging conditions.
Moderately suitable
Bainsvlei This soil type is defined as a succession of red-coloured sandy material underlain by soft ferricrete, and is indicative of the seasonal occurrence of perched water tables at relatively shallow depth. Although the upper sandy horizons are generally easy to excavate by hand or light mechanical excavator, the soft ferricrete occurring at depth may prove difficult to remove, especially during the drier months. The sandy upper soil layers may exhibit a potentially compressible and/or collapsible character. Bainsvlei soil also exhibits moderately low to low permeability, and the possibility of lateral movement of liquids within the sandy topsoil layers is there.
Moderate suitability
Valsriveir Soil depth exceeds 1200 mm and a clay content of 15 - 20 %. It is characterised by strongly structured clays which may be difficult to excavate by hand. The soil is potentially expansive which may interfere with proper root development.
Moderately suitable
The soil type at Dalmada is sandy-clay loam and at Syferkuil, loamy sand.

23
Fig.2.1: Land type maps at Dalmada and at the University of Limpopo Experimental farm at Syferkuil. Prior to land preparation, representative soil samples were taken from the two project
locations and analyzed for nutrient concentration and textural classes. Two spots from
the demarcated experimental site were sampled during 2003/2004 at both locations
and one sampling spot during 2002/2003 at the depth of 0-300 mm for topsoil and
300-600 for subsoil (table 2.2).

24
Temperatures at both locations during the two growing seasons are presented in figure
2.2, whereas rainfall and evaporation are presented in fig 2.3. Land preparation was
done three to two days before planting at both locations in the two growing seasons,
using tractor, ripper planter, disk and hoes. The experiment was conducted under
dryland but irrigation was applied at a critical stage of maize when the rainfall was
not received for an extended period.
Experimental Design
Randomized Complete block in Split plot arrangement was used as an experimental
design with five replications during 2002/2003 growing season and four replications
in 2003/2004. Tillage systems consisting of conventional tillage and minimum tillage
were the main plot treatments whereas five different cropping systems were assigned
as the sub-plot treatments. The sub-plot treatments were, sole maize and maize
intercrop with Bechuana White, Agripers, Lablab bean and Velvet bean. The
conventional tillage system consisted of ploughing, disking and planting of maize
using a conventional planter, whereas under the minimum tillage system, maize was
planted using the ripper planter without ploughing or disking. Under both tillage
systems, an inter row spacing of 0.9m was maintained for maize at a density of 25000
ha-1. The legumes were planted by hand between the maize at a density of 55000
plants ha-1 for the Cowpea varieties, Lablab and Velvet bean. Maize was planted on
11th December at both locations and years whereas the legumes were planted
approximately a month later on the 07th and 09th January 2004 at Syferkuil and
Dalmada respectively. Weeding was done by hand, twice at both locations and
seasons during the growing season.

25
Agronomic characteristics
Days to flowering, anthesis and silking of maize were scored when 50% of the plants
on an experimental unit had displayed these traits. Physiological maturity was scored
when 90% of the maize plants do not show kernels with milk line. Flowering and pod
stage of legumes was also scored at 50 %, while the physiological maturity was
scored when 90% pods had turned brown and when seeds rattled pods were shaken.
Yield and Yield components
Grains of both maize and legumes were harvested manually after physiological
maturity to determine grain yields. The harvested area was 12.6 m2 and 18.0 m2 at
Syferkuil and Dalmada respectively from the middle rows of each experimental unit.
The maize cobs were oven dried at 650C in the laboratory to reduce grain moisture to
approximately 14%. Maize yield components were determined after drying as weight
per cob, cob number per plot, cob number per plant, rows per cob, number of kernels
per row, number of kernels per cob, 100 seed mass (table 2.3 ). Yield components of
legumes were also determined after drying the pods as pods number and weight per
plant, number of seeds per pod, pods length and 30 seeds weight.
Data Analysis
Data were subjected to analysis of variance (ANOVA) as outlined by Statistical
Analysis System (SAS Institute, 1990) to detect statistical significance of treatments.
Differences between treatment means were separated using the least significant
difference (LSD) procedure (Gomez and Gomez, 1984).

26
RESULTS AND DISCUSSION
Site characteristics
Initial soil condition The topography at both experimental locations was relatively flat with a slope of
approximately 1 – 2 %. Nutrient runoff is thus, expected to be minimal at the two
sites.
The soil pH at the experimental sites ranged from 7.6 - 7.8 during the 2002/2003
growing season at Dalmada. In 2003/2004, the pH ranged from 6.8 - 7.7 and 6.6 - 8.1
at Syferkuil and Dalmada respectively. The pH at the experimental sites is close to
neutral and this should enhance the efficient nutrient ion release for crop growth and
development.
The available nitrogen levels in the top and sub soils ranged from 8 - 13 mg kg-1 N at
Syferkuil and 1-3 mg kg-1 N at Dalmada in both growing seasons. These N
concentrations correspond approximately to 32 - 52 kg N ha-1 at Syferkuil and 4 - 12
kg N ha-1 at Dalmada. The soil nitrogen concentration is relatively low with the
severe deficiency occurring at Dalmada. Supplementary nitrogen as Urea was applied
as topdress at a rate of 30 kg N ha-1, three weeks after planting at both locations to
improve growth of maize.
Phosphorus concentration at Syferkuil was 18 – 32 mg P kg-1 compared to 1 - 24 mg P
kg-1at Dalmada. P concentration of 20 mg P kg-1 is usually the recommended
minimum satisfactory growth of grain crops. Super phosphate was applied at planting
27
at both locations at a rate of 30 kg P ha-1 at Dalmada and 15 kg P ha-1 at Syferkuil to
improve available phosphorous concentration in the soil.
Potassium concentration ranged from 30 - 117 mg K kg-1 At Syferkuil, and from 110 -
305 mg K kg-1 and 99 - 515 mg K kg-1 at Dalmada in 2002/2003 and 2003/2004
respectively. The soil potassium concentration was generally adequate at the two
locations and hence no supplementary fertilizer was applied. The concentrations of
Ca, Mg, Na, Cl and Zn were adequate at both locations.
Weather The seasonal temperature (max and min) was recorded at both locations and the
readings are presented in figure 2.2. Syferkuil experienced a relatively hotter summer
temperature with the maximum temperature of 30.2 oC. The minimum temperature at
Syferkuil was 1.5 oC during winter. At Dalmada the recorded temperatures for two
growing seasons were 29.9 oC maximum and 9.6 oC minimum in 2002/2003 and 29.2
oC maximum and 3.1 minimum in 2003/2004. The data suggests the possibility of
frost during winter months at both locations.
According to the recorded seasonal rainfall on both locations, Syferkuil received
relatively high rainfall (132.5 mm) during December month when the experiment was
established. The total rainfall of 481.4 mm was received at Syferkuil for the entire
growing season. 22 mm and 48.7 mm rainfall received in Dalmada during 2002/2003
and 2003/2004 respectively during December month. An average of 124.3 mm
evaporation occurred at Syferkuil, 132.5 mm and 133.4 mm at Dalmada 2002/2003
and 2003/2004 respectively. Due to high amount of moisture evaporation at both

28
locations supplementary irrigation was in place and applied during the critical stages
of drought.
Grain yield
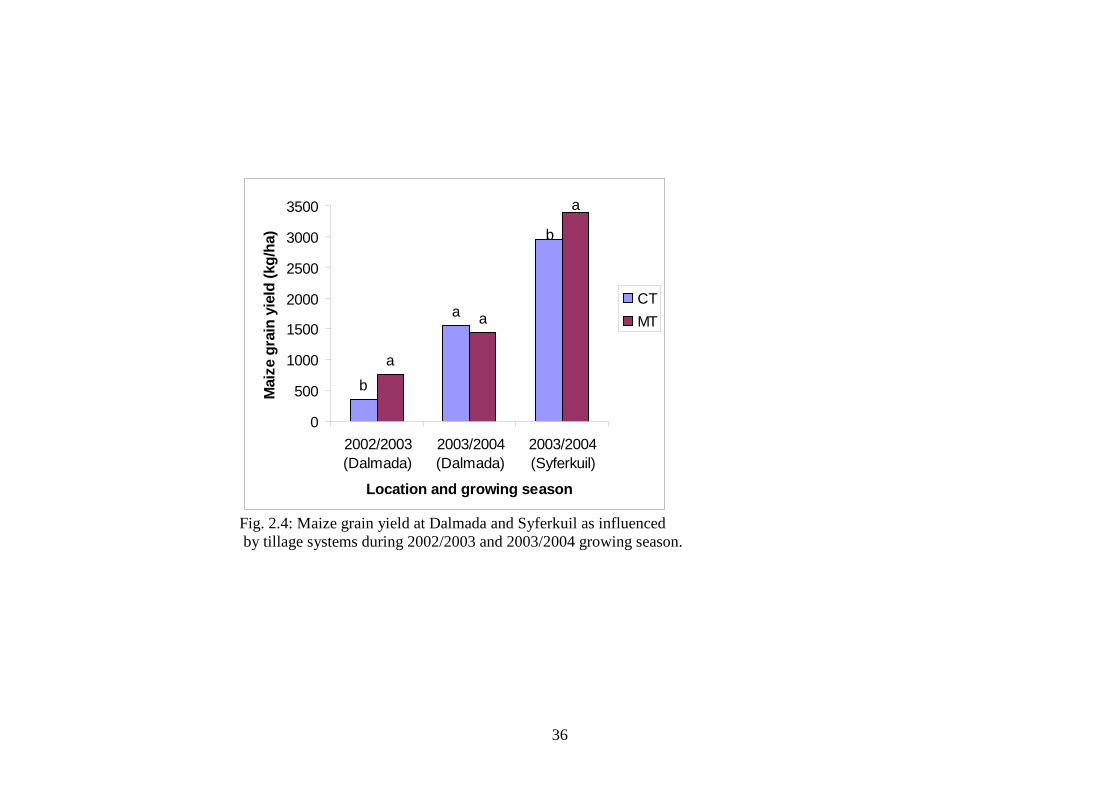
Maize Maize grain yield was influenced by the tillage systems at both locations (Fig. 2.4). At
Dalmada in 2002/2003, maize yielded higher under minimum tillage (MT) compared
to conventional tillage (CT). Maize yields of 357 kg/ha and 755kg/ha were obtained
from CT and MT respectively during 2002/2003 growing season. During 2003/2004
growing season, maize yielded equally between CT and MT (Fig. 2.4). Significant
differences were observed at Syferkuil during 2003/2004. Maize grain yield was
15.3% higher under MT tillage at Syferkuil compare to CT (Fig. 2.4). Mehdi et al.,
(1999) also found that maize yield is often higher under minimum tillage, because MT
crops are more efficient at utilizing soil N than conventionally tilled crops. Moisture
content under the MT was reserved for longer period due to the undisturbed soil. Root
penetration was also observed to be deeper compared to CT. These factors might have
contributed to higher maize yield recorded under MT in the present study. According
to Vandermeer (1992), in an intercropping system, component crop can positively
modify the growing environment for the benefit of the other crop which can lead to
overall yield advantage in the intercropping system relative to the sole crop. In this
study, later planting of legumes, though low growing rate was observed, suppressed
weeds to some extent in the intercrop plots, creating cooler soil conditions which
could have benefited the maize crop (Maluleke, 2004)

29
Legumes The legumes did not produce any yield at both locations except for only few border
rows that flowered. The legumes were planted a month after maize which may be one
of the reasons for lack of reproductive growth. Lower rainfall was received at both
locations and in both growing season. At Dalmada a heavy hail storm was
experienced during the middle of the growing season when legumes were only a
month old causing significant damage to the crops.
A legume such as lablab bean has a long growing duration, ranging from 70-300 days
which may lead to failure or delay of flowering during the dry seasons (Maluleke,
2004). According to Gardiner and Cracker (1981), bean-maize intercrop plantings
increase light interception and decrease light reflection as compared with bean
solecrop plantings. However, the quantity of light available to the bean canopy is
decreased as the maize population is increased.
Maize yield components
Number of rows per cob
At Dalmada in 2002/2003 the number of rows per cob was highly influenced by
tillage systems. Maize under MT produced cobs with 14 rows compared to 12 under
CT (Table 2.3). Legumes under MT grew taller as compared to CT, therefore the
increase on row per cob might be associated with the favourable growing environment
created by from the legumes. During 2003/2004 growing season, the measured
parameter was non significant at both locations (Tables 2.3 and 2.4). The lack of

30
significant effect is an indication that these parameters are generally not
environmentally dependent but rather genetically controlled (Modiba, 2002)
Number of kernels per cob
Kernel number per cob was highly significant at Dalmada in 2002/2003 with maize
under MT producing 31% more kernels per cob than under CT (Table 2.3). A similar
trend was observed at Syferkuil during 2003/2004 growing season where MT
produced significantly higher results than CT. Kernels per cob was 14% higher in the
MT system than in the CT system (Table 2.5).
The number of kernels per cob at Dalmada in 2003/2004 growing season did not show
any significant results (Table 2.3). The best on number of kernels per row was
recorded under minimum tillage compared to the conventional tillage system except
at Dalmada in 2003/2004. This implies that the moisture stress was not high as on the
CT. Kernel number is one of the parameters that determine the grain yield and it
depends on the rate of grain-filling, duration and stress during the reproduction stage
(Wang et al., 1999).
Number of kernels per row
Significantly higher number of kernels per row on maize cob was recorded under MT
compared to CT at the two locations. The effect was not significant at Dalmada in
2003/2004 (Table 2.4). MT was 21% and 8.6 higher than CT respectively at During
2002/2003 growing season (Table 2.3). The number of kernels set is more critical for
maize yield and it is more affected by environment (Andrade et al., 2000).

31
Unfavourable environmental conditions at the period of flowering and silking can
cause the reduction in number of kernels per row.
Number of cobs per plant
Minimum tillage systems resulted in higher number of maize cobs per plant at
Dalmada during both growing seasons (Table 2.3 and 2.4). Number of cobs per plant
was non significant at Syferkuil (Table 2.5).
Weight per cob
The effect of tillage systems was significant at all locations in both seasons. Weight
per cob recorded under MT was higher at both locations and growing seasons (Table
2.3-2.5). Weight per cob is associated with the grain-filling stage. Cobs produced
under MT were bigger and well filled compared to CT production. Similar results of
lighter cob weight under CT were observed by Ghaffarzadeh et al., (1997).
Hundred Seed mass
Hundred seed mass was not affected by tillage system at both locations and in all
growing seasons (Table 2.3-2.5).
Agronomic Characteristics Tasseling and Silking
Days to tasseling was influenced by the tillage system only at Dalmada during
2002/2003 growing period (Table 2.7). During 2003/2004 growing season, there was
no significant difference at both locations (Table 2.7). Tasseling is an important
phonological stage of crop development because it signals change of growth of annual

32
crops from vegetative to generative phase, essential for yield of most crops (Modiba,
2002). Days to silk emergence were significant highly affected by tillage at Syferkuil
and not at Dalmada in both seasons (Table 2.7).
Maturity
There were no significant differences for days to physiological maturity between CT
and MT systems for 2002/2003 and 2003/2004 growing seasons at Dalmada.
Significant differences between tillage systems were observed at Syferkuil during
2003/2004 growing season. CT system, maize matured a day earlier than maize
planted in the MT system (Table 2.7). Days to physiological maturity did not appear
to have contributed significantly to grain yield differences observed at Syferkuil.
Maize plant height
Maize plant height significantly responded to tillage system at Dalmada (2002/2003)
and Syferkuil (2003/2004). The tallest plants were produced under MT system across
locations in the two growing seasons (Table 2.8). Differences in plant height was non
significant at Dalmada during 2003/2004, but tillage and cropping system interaction
was significant. The height of maize might have partly contributed to the higher grain
yield observed under minimum tillage system.

33
CONCLUSIONS
The evaporation rate was much higher than the rainfall received and However
supplementary irrigation was in place at both locations to minimise excessive
moisture stress on the plants. Maize grain yield was generally higher under the
minimum tillage system compared to the conventional tillage system at the two
locations in both growing seasons. Significantly higher yield components were
observed under the minimum tillage system in most of the parameters studied relative
to the conventional system. The number of cobs per plant and weight per cob in
maize were the main yield components accounting for grain yield increment under the
minimum tillage system. Number of rows per cob was not significant at both
locations and this is not surprising as this plant component is usually genetically
determined and not environmental based. Hundred seed mass was not affected by
tillage system at both locations and in all growing seasons. Days to physiological
maturity did not differ between the two tillage systems at Dalmada during both
growing seasons, but at Syferkuil, differences were observed. The number of days to
tasseling in maize was influenced by tillage system only at Syferkuil and not at
Dalmada. No grain yield was produced in the grain legumes primarily due to severe
competition from the maize for moisture and sunlight. The minimum tillage system
has shown the potential to be a superior system for dryland maize production but
further research involving additional locations is required.

34
Minimum and maximum temperatures for Dalmada during 2002/2003
05
101520253035
S O N D J F M A M J J A
Month
Deg
ree
celc
ius
Max
Min
Maximum and minimum temparatures for Dalmada during 2003/2004
05
101520253035
S O N D J F M A M J J A
Month
Deg
ree
celc
ius
Max
Min
Minimum and maximum temperature
for Syferkuil during 2003/2004
05
101520253035
S O N D J F M A M J J A
Month
Deg
ree
celc
ius
Max
Min
Fig. 2.2: Minimum and maximum temperature for Syferkuil during 2003/2004 growing season and for Dalmada during 2003/2004 and 2002/2003 growing season.

35
Rainfall and evaporation for Dalmada during 2002/2003
0
50
100
150
200
S O N D J F M A M J J A
Month
mm Rainfall
Evaporation
Rainfall and evaporation for Dalmada during 2003/2004
0
50
100
150
200
250
S O N D J F M A M J J AMonth
mm
RainfallEvaporation
Rainfall and evaporation for Syferkuil during
2003/2004
0
50
100
150
200
250
S O N D J F M A M J J A
Month
mm Rainfall
Evaporation
Fig. 2.3: Rainfall and evaporation measurements for Syferkuil during 2003/2004 growing season and Dalmada during 2002/2003 and 2003/2004 growing season.
36
a
b
b
a
a
a
0
500
1000
1500
2000
2500
3000
3500
2002/2003(Dalmada)
2003/2004(Dalmada)
2003/2004(Syferkuil)
Location and growing season
Mai
ze g
rain
yie
ld (k
g/ha
)
CTMT
Fig. 2.4: Maize grain yield at Dalmada and Syferkuil as influenced by tillage systems during 2002/2003 and 2003/2004 growing season.

37
Table 2.2. Initial top and subsoil nutrient status at Dalmada and Syferkuil during the 2002/2003 and 2003/2004 growing season. Dalmada Syferkuil …….2002/2003…... ……………….………………………2003/2004………………………………………. Sampling point 1 Sampling point 2 Sampling point 1 Sampling point 2 Depth (mm) Depth (mm)
Minerals mg kg-1 0-300 300-600 0-300 300-600 0-300 300-600 0-300 300-600 0-300 300-600 N 3.4 1.5 3 1 1 1 13 8 12 11 P 9 1 24 1 9 1 32 27 28 18 K 110 305 99 320 515 290 30 38 117 60 Ca 957 1215 1020 1190 895 1240 523 518 430 448 Mg 676 895 720 830 633 960 313 320 283 235 Na 47 139 50 78 45 200 58 125 78 88 Cl 2 22 1 21 2 23 2 16 6 23 Zn 1.82 0.42 1.84 0.48 1.8 0.36 1.8 0.84 1.04 1.4 pH 7.6 7.8 6.6 7.6 7.8 8.1 7.6 6.9 7.7 6.8 % Clay 15 20 15 32 19 23 20 17 13 11

38
Table 2.3. Maize yield components as influenced by tillage systems at Dalmada during 2002/2003 growing season. Tillage # Cob/
plant Weight/
cob # Rows/
cob # Kernel/
row # Kernel/
cob 100 seed
mass
..count.. ….g…. ….........count………… …..g….. CT 0.5b 52b 12b 28b 356b 23a MT 1.0a 151a 14a 34a 468a 24a Lsd 0.12 32.01 0.879 2.7 42.09 ns Tillage ** ** ** ** ** ns Cropping system ns Ns ns ns Ns ns Tillage*Cropping ** Ns ns ** ** *
LSD = Least significant difference. Means followed by the same letter within a column are similar statistically; **= p<0.01; *= p<0.05; ns = not statistically significant. CT = Conventional tillage. MT = Minimum tillage

39
Table 2.4. Maize yield components as influenced by tillage systems at Dalmada during 2003/2004 growing season. Tillage # Cob/
plant Weight/
cob # Rows/
cob # Kernel/
row # Kernel/
cob 100 seed
mass
..count.. ….g…. ….........count………… …..g….. CT 0.75b 92.9b 13a 40a 539a 42.5a MT 1.30a 193.1a 13a 41a 540a 50.2a Lsd 0.25 43.21 ns ns Ns ns Tillage ** ** ns ns Ns ns Cropping system ns Ns ns ns Ns ns Tillage*Cropping ns Ns ** * * ns
LSD = Least significant difference. Means followed by the same letter within a column are similar statistically; **= p<0.01; *= p<0.05; ns = not statistically significant. CT = Conventional tillage. MT = Minimum tillage.

40
Table 2.5. Maize yield components as influenced by tillage systems at Syferkuil during 2003/2004 growing season. Tillage # Cob/
plant Weight/
cob # Rows/
cob # Kernel/
row # Kernel/
cob 100 seed
mass ..count.. ….g…. ….........count………… …..g….. CT 1.1a 179b 13a 35b 459b 58a MT 1.3a 238a 14a 38a 524a 59a Lsd ns 41.03 ns 1.89 36 ns Tillage ns ** ns ** ** ns Cropping system ns Ns ns ns Ns ns Tillage*Cropping ns Ns ns ns Ns ns
LSD = Least significant difference. Means followed by the same letter within a column are similar statistically; **= p<0.01; *= p<0.05; ns = not statistically significant. CT = Conventional tillage. MT = Minimum tillage

41
Table 2.6. Summary of maize yield components as influenced by tillage systems at Dalamada during 2002/2003 and 2003/2004 and at Syferkuil during 2003/2004 growing season.
Dalmada Syferkuil 2002/2003 2003/2004 Tillage # Cob/
plant Weight/
cob #
Rows/ cob
# Kernel/
row
# Kernel/
cob
100 seed mass
# Cob/ plant
Weight/ cob
# Rows/
cob
# Kernel/
row
# Kernel/ cob
100 seed mass
# Cob/ plant
Weight/ cob
# Rows/
cob
# Kernel/
row
# Kernel/
cob
100 seed mass
..count.. ….g…. ….........count………… ....g...
..count..
….g…. ….........count………… ..g….
..count.. ….g….
….........count………… ..g…
CT 0.5b 52b 12b 28b 356b 23a
0.75b
92.9b 13a 40a 539a 42.5a
1.1a 179b 13a 35b 459b
58a
MT 1.0a 151a 14a 34a 468a 24a
1.30a
193.1a 13a 41a 540a 50.2a
1.3a 238a 14a 38a 524a
59a
Lsd 0.12 32.01 0.879 2.7 42.09 ns 0.25 43.21 ns ns Ns ns ns 41.03 ns 1.89 36 ns Tillage ** ** ** ** ** ns ** ** ns ns Ns ns ns ** ns ** ** ns Cropping system
ns ns ns ns ns ns
ns Ns ns ns Ns ns
ns Ns ns ns ns ns
Tillage* Cropping
** ns ns ** ** *
ns Ns ** * * ns
ns Ns ns ns ns ns

42
Table 2.7. Tasseling, silking and maturity at Dalmada and Syferkuil for both growing seasons. Tillage Dalmada Syferkuil 2002/2003 2003/2004 2003/2004 Tasseling Maturity Tasseling Silking Maturity Tasseling Silking Maturity …………………………………………No. days…………………………………………….. CT 64a 120 75 81 144 64 72a 133b MT 62b 119 76 81 144 63 71b 134a Lsd 1.4 ns ns ns ns ns 0.50 0.55 Tillage ns ns ns ns ns ns ** ** Cropping system ns ns ns ns ns ns Ns Ns Tillage*Cropping ns ns ns ns ns ns Ns Ns LSD = Least significant difference. Means followed by the same letter within a column are similar statistically; **= p<0.01; *= p<0.05; ns = not statistically significant. CT = Conventional tillage. MT = Minimum tillage

43
Table 2.8. Maize plant height (m) at Dalmada (2002/2003 and 2003/2004) and Syferkuil (2003/2004) as influenced by tillage systems.
Dalmada Syferkuil Tillage 2002/2003 2003/2004 2003/2004 ……………………….m……………………. CT 1.10b 1.85 1.6b MT 1.33a 1.86 1.8a Lsd 0.09 ns 0.07 Tillage ** ns ** Cropping system ns ns Ns Tillage*Cropping ns * Ns
LSD = Least significant difference. Means followed by the same letter within a column are similar statistically; **= p<0.01; *= p<0.05; ns = not statistically significant. CT = Conventional tillage. MT = Minimum tillage.

44
CHAPTER 3
THE RESPONSE OF GRAVIMETRIC SOIL MOISTURE,
CHLOROPHYLL CONTENT, NITROGEN UPTAKE AND DRY
MATTER ACCUMULATION IN MAIZE TO TILLAGE SYSTEMS

45
INTRODUCTION
Soil moisture is one of the most limiting factors to economical crop production in many
part of South Africa including the Limpopo Province. Most smallholder farmers in the
Limpopo Province have no access to irrigation facilities and hence, crop yields are
marginal and unreliable even though the soil is good enough for production. Crops such
as maize cannot tolerate drought longer than one month especially during the
reproductive stage because this is the stage where large amount of water is needed
(Tabassum, 2004). Management practices that enhance rain water infiltration and
conservation are therefore required to improve farmer’s productivity and ensure food
security in the province.
Tillage practices may influence soil moisture availability throughout the growing season.
Moisture evaporation from the soil can also be minimized through cropping systems such
as intercropping. Although not all the crops being intercropped will reduce the
evaporation, cereal-legume or cereal-cover crop combination is reported to reduce
evaporation and further prevent soil and nutrients erosion (Rozas et al., 1999). Morris et
al., 1990 indicated that water captured by intercrop differ from water captured by the sole
crops and further reported that water-utilization efficiency by intercrop is greater than
water-utilization efficiency by sole crops, often by more than 18%.
Conventional tillage practices are not an efficient soil moisture conservation technique.
Cultivating methods such as minimum tillage can improve the storage of soil water better
because the soil is left undisturbed thereby minimizing evaporation losses. Water runoffs

46
is also slowed by roughness of the soil surface, the presence of plant residue which
allows more time for infiltration and also prevent soil crusting which in turn increase
infiltration (Olaoye., 2002).
Nitrogen is considered to be the most important plant nutrient due to its demand in
greatest quantities by plants. In Limpopo Province, it is the major limiting nutrient in the
smallholder farming systems. Nitrogen is a complex part of the soil system and its
availability is affected by soil type, tillage, N sources (eg. Fertilizers and Manure), crop
rotation and precipitation (Hatfield et al., 2001).
The role of legumes is very important in the improvement of soil nutrient status in both
the natural and the agro-ecosystems. Environmental factors such as temperature, soil pH,
aeration and nitrate concentration in the soil influence the effectiveness of biological
nitrogen fixation by legumes. At temperatures suitable for plant growth, nitrogen fixation
usually proceeds at an optimum rate. At temperature above 30 0C, N2 fixation is reduced
and nodules are generally sloughed off. Maximum rates of fixation occur in pH ranges of
6 to 8 similar to those that are optimum for plants (Rauschkolb and Hornsby, 1994).
Smartt (1990) indicated that in most parts of Africa where legumes are not planted,
agricultural productivity is limiting because of poor soil nutrients or high inputs of
chemicals to supplement nitrogen. The author further indicated that there are three main
areas in the improvement of agricultural productivity namely; soil nutrient status, soil
physical structure and biotic competition. Legumes have a role to play in agricultural
systems, as they can maintain nitrogen status of the soil during the cropping phase and

47
restore soil nitrogen status. Legumes can be intercropped with cereals so that the cereals
may effectively use the nitrogen fixed, either currently or in subsequent years.
Intercropping of N2 fixing legumes with non-legumes is often used to increase dry matter
production and protein content of the harvested crop while minimizing the need for
nitrogen fertilizer inputs. Ideally the legumes will fix most of their required nitrogen and
also supply a significant portion of that required by the non-legumes.
Legumes offer several advantages over soil degradation. They do not only add substantial
amount of organic matter and improve structure but when properly inoculated, legumes
can fix considerable quantities of atmospheric N2 and make it available to the succeeding
crops as the residues decompose. Nitrogen requirement can be assessed or measured from
the plant using techniques such as the Kjeldah analysis and chlorophyll meter SPAD-502.
Scott and Hector, (1997) indicated that the amount of chlorophyll per unit leaf area in
maize is a good indicator to the overall conditions of the plant. Healthy plants, capable of
maximum growth, generally can be expected to have larger amount of chlorophyll than
unhealthy plants. Determination of the chlorophyll content of a leaf can be used to detect
and study plant stress and nutritional status. The Minolta chlorophyll meter SPAD-502
can be used to rapidly determine chlorophyll concentrations in plant leaves without
damage of the leaf (Scott and Hector, 1997).

48
The objectives of the study were to:
i) Determine the impact of tillage system on chlorophyll content and dry matter
accumulation of maize.
ii) To determine soil moisture content as influenced by the legumes and tillage
systems.

49
MATERIALS AND METHODS The study area and experimental details are the same as reported in Chapter 2. Gravimetric moisture
Soil samples were collected every other week for gravimetric moisture determination of
the soil from two different portions of a plot using an augar and zip log plastic bags to
conserve moisture. The samples were collected from 0-150 mm depth and 150-300 mm
depth within the profile. Determination of the fresh weight of the samples was done
quickly at arrival in the laboratory from the field and dry weight was measured after oven
drying for two days at 1000C. Gravimetric moisture content was determined using the
formula:
Gravimetric water = [(Wet weight – Dry weight)/ Dry weight] x 100 (Scott, 2000)
Dry matter
Above ground maize and legume samples were taken every other week during 2002/2003
growing season to determine plant growth characteristics. Samples were taken at 63
DAP, 77 DAP and 97 DAP at Dalmada (2002/2003) and at 70 DAP, 87 DAP at Syferkuil
and Dalmada (2003/2004) respectively. Plants were collected from a 0.5 m length at both
end of the middle row where two plants were left out as borders. During 2003/2004
growing season the plant samples were collected once at maize tasseling due to poor
stand establishment. Samples were dried at 650C for several days in the oven to constant
weight. The maize samples were separated into leaves, shoot and cob fractions and for
the legumes into leaves, shoots, roots and nodules. Each fraction was weighed separately.

50
Chlorophyll readings
Chlorophyll readings on maize were determined from the fully expanded younger leaf
and the lowest leaf, which is the oldest leaf. Five individual plants were selected
randomly for the readings on each plot using Minolta Chlorophyll meter SPAD-502.
During 2003/2004 the chlorophyll readings were determined from the youngest leave and
the middle leaves because of the severe hail damage of maize at 26 DAP at Dalmada.

51
RESULTS AND DISCUSSIONS
Gravimetric moisture
During the two growing seasons, gravimetric soil moisture under the minimum tillage
system was generally higher than the conventional tillage, but in some instances, they
were similar depending on the depth of sampling. There were no instances where soil
moisture under the conventional tillage system was recorded as higher than that of the
minimum tillage system. At Dalmalda in 2002/2003, higher soil moisture under
minimum tillage (MT) occurred at 0 - 150 mm depth at 81 DAP and at the 150 - 300 mm
depth at 63 DAP (Fig. 3.1), representing 22.9 % and 55.4 % increase respectively. In
2003/2004, the difference occurred at 0 - 150 mm depth at 74 DAP (Fig. 3.2), which is
equivalent to 32.6 % increase. At Syferkuil, 27.5 % higher soil moisture occurred at both
0 - 150 mm and 32.9 % at 150 - 300 mm depths at 126 DAP (Fig. 3.3). The moisture
difference between the two systems were similar at 84 DAP.
The observed differences in gravimetric soil moisture were strongly influenced by the
amount and timing of rainfall during a season and the location of study. Higher rainfall
was received at the later stage of the growing season at Dalmada 2003/2004, which could
have resulted in the non-significant difference in soil moisture under the two tillage
systems. There was no late season rain at Syferkuil which may explain the observed
differences in soil moisture under the two tillage systems.

52
Increased soil moisture under no-till system relative to the conventional tillage system
had been reported by other authors. Daniel et al., (1999) reported that surface residue
potentially increases infiltration of water into the soil by 25 to 50% under no-till as
compared to conventional tillage system. Unger, (1991) reported that soil water storage
is greater where there is no-till compared to stubble mulching or where disk tillage was
used. The increased maize yield under the minimum tillage system observed at Dalmada
and Syferkuil could partly be attributed to increased soil moisture during periods of
drought.
Chlorophyll Production
Younger maize leaf
Chlorophyll production in the youngest fully expanded leaf of maize at Dalmada and
Syferkuil was significantly influenced by tillage system, especially during the later stages
of growth (figure 3.10 and 3.11). At Dalmada, higher chlorophyll content was recorded
under minimum tillage system at 78 DAP in 2002/2003, indicating an increase of 23.2 %.
In 2003/2004 15.5 % higher chlorophyll was recorded under minimum tillage system at
103 DAP. There was a trend of decreasing chlorophyll concentration during the growing
seasons in both seasons.
Similar to Dalmada, higher chlorophyll content in the younger leaves was recorded under
minimum tillage system relative to the conventional system in Syferkuil (Fig. 3.12). A
53
17.7% and 29.8 % increase was at 54 DAP and 76 DAP respectively under minimum
tillage. A trend of decreasing chlorophyll content over the season was also observed.
Scott and Hector, (1997) indicated that the amount of chlorophyll per unit leaf area in
maize is a good indicator to the overall conditions of the plant. Healthy plants, capable of
maximum growth, generally can be expected to have larger amount of chlorophyll than
unhealthy plants. The observed higher grain yield in maize under the minimum tillage
system could be an indication of healthy growth as inferred by higher dry matter
accumulation (table 3.1).
Older maize leaf
Significant differences were observed at the early and the latest sampling dates at
Dalmada during 2002/2003 with regard to the chlorophyll content of the older maize leaf.
Plants grown under MT generally recorded higher chlorophyll concentration compared to
those grown under CT except at 78 DAP (fig. 3.10). Similar trend was recorded during
2003/2004, where plants under minimum tillage predominantly produced higher leaf
chlorophyll except at 51 DAP and 89 DAP. Reduced chlorophyll concentration in the
lower leaves generally signifies the onset of senescence. The results showed that the rate
of senescence was higher in maize plants grown under CT relative to those under MT.
At Syferkuil leaf senescence were measured equally for both tillage systems at 44 DAP
and 76 DAP (Fig. 3.12) which might be the results of aging rather shading. A 27.6%
increase was recoded at 54 DAP under MT.
54
Chlorophyll on legumes
Legumes showed a quadratic response irrespective of legume cultivar in both younger
and older leaves. The coefficient of determination (R2) across the legumes intercrop
ranged from 0.8391 – 0.9638 and 0.58 – 0.9997 during 2002/2003 and 2003/2004
respectively. The results indicated a strong relationship between chlorophyll production
of maize and legume intercropping (fig. 3.13 – 3.18).
Dry matter production
Maize At Dalmada, during 2002/2003 higher dry matter production was recorded only at 97
DAP. The amount of dry matter accumulated was 4379.5 kg/ha under MT at 97 DAP
compared to 347.2 kg/ha under CT (Table 3.1). In 2003/2004 there was no significant
difference at Dalmada, but at Syferkuil maize grown under minimum tillage produced
dry matter, 4215 kg/ha compared to 3220 kg/ha under conventional tillage at 70 DAP.
Maize dry matter as influenced by the intercropping was significant at an early stage of
63 DAP at Dalmada in 2002/2003 growing season only (Table 3.2). Sole maize
accumulated 3305.80 kg/ha which was higher than the yield of the intercropped maize.
The lack of benefit of maize in a maize-legume intercropping system has also been
reported by Cenpukdee and Fukai, (1991).

55
Legumes During the 2002/2003 growing season, legume dry matter accumulated was not affected
by any of the tillage systems but in 2003/2004 significant results were recorded at both
locations. Legume dry matter production was higher under minimum tillage (table 3.3).
Legume intercropping was significant at both locations and growing seasons except at
Syferkuil during 2003/2004 at 44 DAP. Higher dry matter production was recorded in
the cowpea varieties compared to lablab and velvet bean (table 3.4). Cowpea is
indigenous to the experimental location whereas velvet bean and lablab bean are
introduced species. This might contributed to the superior production in cowpea.
56
CONCLUSION Gravimetric soil moisture under the minimum tillage system was generally higher than
under the conventional tillage, but in some instance, they were similar depending on the
depth of sampling during the two growing seasons. There were no instances where soil
moisture under the conventional tillage system was higher than that of the minimum
tillage system. The observed differences in gravimetric soil moisture was strongly
influenced by the amount and timing of rainfall during a season and the location of study.
Higher rainfall was received at the later stage of the growing season at Dalmada
2003/2004, which could have resulted in the non-significant difference in soil moisture
under the two tillage systems. Increased soil moisture under no-till system relative to the
conventional tillage system had been reported by other authors.
Chlorophyll production in the youngest fully expanded leaf of maize at Dalmada and
Syferkuil was significantly influenced by tillage systems. At Dalmada, higher
chlorophyll content was recorded under minimum tillage system at 78 DAP in
2002/2003, indicating an increase of 23.2 %. In 2003/2004 15.5 % higher chlorophyll
was recorded under minimum tillage system at 103 DAP. There was a trend of decreasing
chlorophyll concentration in the younger leaves during the growing seasons in both
seasons.
In the older maize leaves significant results were observed at the early and the latest
sampling dates at Dalmada during 2002/2003 with regard to the chlorophyll content.
Plants grown under MT generally recorded higher chlorophyll concentration compared to

57
those grown under CT except at 78 DAP (fig. 3.10). Reduced chlorophyll concentration
in the lower leaves generally signifies the onset of senescence. The results showed that
the rate of senescence was higher in maize plants grown under CT relative to those under
MT. Similar trend was recorded during 2003/2004. At Syferkuil leaf senescence
measured the same for both tillage systems at 44 DAP and 76 DAP.
In 2003/2004 there was no significant difference of dry matter production at Dalmada,
but at Syferkuil maize grown under minimum tillage produced higher dry matter
compared maize grown under conventional tillage. During 2002/2003 growing season
legume dry matter accumulated was not affected by any of the tillage systems, but in
2003/2004 significant results were recorded at both locations.
Legume intercropping was significant at both locations and growing seasons except at
Syferkuil during 2003/2004 at 44 DAP. Legume dry matter production was higher under
minimum tillage. Comparing dry matter production amongst the legumes, significantly
higher production was recorded in the cowpea varieties compared to lablab and velvet
bean.
From the above study, both maize and legume plants grown under minimum tillage
system generally produced higher dry matter and chlorophyll and also conserved
significantly higher soil moisture compared to those under conventional tillage
irrespective of the location.

58
63 and 81 days after planting at Dalmada during 2002/2003
0123456789
10
0-150 150-300 0-150 150-300
Depth
Perc
enta
ge g
ravi
met
ric
moi
stur
e
CT
MT
b
bba
ba
bb
Figure 3.1: Moisture response to tillage system at Dalmada during 2002/2003 growing season.
74 and 130 days after planting at Dalmada during 2003/2004
0
2
4
6
8
10
12
14
0-150 150-300 0-150 150-300
Depth
Perc
enta
ge g
ravi
met
ric
moi
stur
e
CT
MT
b aa
bb
a
aa
Figure 3.2: Moisture response to tillage system at Dalmada during 2003/2004 growing season.

59
84 and 126 days after planting at Syferkuil during 2003/2004
0
2
4
6
8
10
12
0-150 150-300 0-150 150-300
Depth
Perc
enta
ge g
ravi
met
ric
moi
stur
e
CTMT
bb b
b
bb
a
a
Figure 3.3: Moisture responses to tillage system at Syferkuil during 2003/2004 growing season.

60
Agripers intercrop vs sole maize at 0-150 mm depth (Dalmada 2002/2003)
a
a
a
a
012345678
63 DAP 81 DAP
Days after planting
Perc
enta
ge g
ravi
met
ric
moi
stur
e
SoleAgri
Lablab intercrop vs sole maize at 0-150 mm depth (Dalmada 2002/2003)
a
a
aa
0
2
4
6
8
10
63 DAP 81 DAP
Days after planting
Perc
enta
ge g
ravi
met
ric
moi
stur
e
SoleLab
Velvet bean intercrop vs sole maize
at 0-150 mm depth (Dalmada 2002/2003)
a
a
a
a
0
2
4
6
8
10
63 DAP 81 DAP
Days after planting
Perc
enta
ge
grav
imet
ric m
oist
ure
SoleVel
Bechuana white intercrop vs sole maize at 0-150 mm depth (Dalmada
2002/2003)
a
a
a
a
02468
10
63 DAP 81 DAP
Days after planting
Perc
enta
ge
grav
imet
ric m
oist
ure
SoleBCW
Figure 3.4: Moisture response to cropping system at 0-150 mm depth at Dalmada during 2002/2003 growing season.

61
Agripers intercrop vs sole maize at 150-300 mm depth (Dalmada
2002/2003)
a
a
a
a
0
2
4
6
8
10
63 DAP 81 DAP
Days after planting
Perc
enta
ge g
ravi
met
ric
moi
stur
e
SoleAgri
Lablab intercrop vs sole maize at 150-300 mm depth (Dalmada 2002/2003)
a
a
a
a
0
2
4
6
8
10
63 DAP 81 DAP
Days after planting
Perc
enta
ge g
ravi
met
ric
moi
stur
e
SoleLab
Velvet bean intercrop vs sole maize
at 150-300 mm depth (Dalmada 2002/2003)
a
a
a
a
0
2
4
6
8
10
63 DAP 81 DAP
Days after planting
Perc
enta
ge g
ravi
met
ric
moi
stur
e
SoleVel
Bechuana white intercrop vs sole maize at 150-300 mm depth (Dalmada
2002/2003)
a
a
a
a
0
2
4
6
8
10
63 DAP 81 DAP
Days after planting
Perc
enta
ge g
ravi
met
ric
moi
stur
e
SoleBCW
Figure 3.5: Moisture response to cropping system at 150-300 mm depth at Dalmada during 2002/2003 growing season.

62
Agripers intercrop vs sole maize at 0-150 mm depth (Dalmada 2003/2004)
a
a
a
a
0
2
4
6
8
10
12
74 DAP 130 DAP
Days after planting
Perc
enta
ge g
ravi
met
ric
moi
stur
e
SoleAgri
Lablab intercrop vs sole maize at 0-150 mm depth (Dalmada 2003/2004)
a
a
a
a
0
2
4
6
8
10
12
74 DAP 130 DAP
Days after planting
Perc
enta
ge g
ravi
met
ric
moi
stur
e
SoleLab
Velvet bean intercrop vs sole maize
at 0-150 mm depth (Dalmada 2003/2004)
a
aa
a
0
2
4
6
8
10
12
74 DAP 130 DAP
Days after planting
Perc
enta
ge g
ravi
met
ric
moi
stur
e
SoleVel
Bechuana white intercrop vs sole maize at 0-150 mm depth (Dalmada
2003/2004)
a
aaa
0
2
4
6
8
10
12
74 DAP 130 DAP
Days after planting
Perc
enta
ge g
ravi
met
ric
moi
stur
e
SoleBCW
Figure 3.6: Moisture response to cropping system at 0-150 mm depth at Dalmada during 2003/2004 growing season.

63
Agripers intercrop vs sole maize at 150-300 mm depth (Dalmada
2003/2004)
a
a
a
a
02
46
810
12
74 DAP 130 DAP
Days after planting
Perc
enta
ge g
ravi
met
ric
moi
stur
eSoleAgripers
Lablab intercrop vs sole maize at 150-300 mm depth (Dalmada 2003/2004)
aa
a
a
02468
10121416
74 DAP 130 DAP
Days after planting
Perc
enta
ge g
ravi
met
ric
moi
stur
e
SoleLablab
Velvet bean intercrop vs sole maize
at 150-300 mm depth (Dalmada 2003/2004)
a
a
b
a
0
2
4
6
8
10
12
74 DAP 130 DAP
Days after planting
Perc
enta
ge g
ravi
met
ric
moi
stur
e
SoleVelvet
Bechuana white intercrop vs sole maize at 150-300 mm depth (Dalmada
2003/2004)
a
a
b
a
0
2
4
6
8
10
12
74 DAP 130 DAP
Days after planting
Perc
enta
ge g
ravi
met
ric
moi
stur
e
SoleBCW
Figure 3.7: Moisture response to cropping system at 150-300 mm depth at Dalmada during 2003/2004 growing season.

64
Agripers intercrop vs sole maize at 0-150 mm depth (Syferkuil 2003/2004)
a
a
aa
0
2
4
6
8
10
12
84 DAP 126 DAP
Days after planting
Perc
enta
ge g
ravi
met
ric
moi
stur
e
SoleAgri
Lablab intercrop vs sole maize at 0-150 mm (syferkuil 2003/2004)
a
a
aa
0
2
4
6
8
10
12
84 DAP 126 DAP
Days after planting
Perc
enta
ge g
ravi
met
ric
moi
stur
e
SoleLab
Velvet bean intercrop vs sole maize
at 0-150 mm depth (Syferkuil 2003/2004)
a
a
a
a
0
2
4
6
8
10
12
84 DAP 126 DAP
Days after planting
Perc
enta
ge g
ravi
met
ric
moi
stur
e
SoleVel
Bechuana white intercrop vs sole maize at 0-150 mm (Syferkuil
2003/2004)
a
a
aa
0
2
4
6
8
10
12
84 DAP 126 DAP
Days after planting
Perc
enta
ge g
ravi
met
ric
moi
stur
e
Sole
BCW
Figure 3.8: Moisture response to cropping system at 0-150 mm depth at Syferkuil during 2003/2004 growing season.

65
Agripers intercrop vs sole maize at 150-300 mm depth (Syferkuil
2003/2004)
aa aa
02468
1012
84 DAP 126 DAP
Days after planting
Perc
enta
ge g
ravi
met
ric
moi
stur
e
SoleAgri
Lablab intercrop vs sole maize at 150-300 mm depth (Syferkuil 2003/2004)
aa
aa
0
2
4
6
8
10
12
84 DAP 126 DAP
Days after planting
Perc
enta
ge g
ravi
met
ric
moi
stur
e
SoleLab
Velvet bean intercrop vs sole maize
at 150-300 mm depth (Syferkuil 2003/2004)
aa
a
a
0
2
4
6
8
10
12
84 DAP 126 DAP
Days after planting
Perc
enta
ge g
ravi
met
ric
moi
stur
e
SoleVel
Bechuana white intercrop vs sole maize at 150-300 mm depth (Syferkuil
2003/2004)
aa
aa
0
2
4
6
8
10
12
84 DAP 126 DAP
Days after planting
Perc
enta
ge g
ravi
met
ric
moi
stur
e
SoleBCW
Figure 3.9: Moisture response to cropping system at 150-300 mm depth at Syferkuil during 2003/2004 growing season.

66
Chlorophyll production on youngest leaf at Dalmada 2002/2003
*nsns
10
20
30
40
50
60
64 71 78
Days after planting
Chl
orop
hyll
read
ings
CTMT
Chlorophyll on lowest leaf at Dalmada 2002/2003
** ns *
10
20
30
40
50
60
64 71 78
Days after planting
Chl
orop
hyll
read
ings
CTMT
Figure 3.10: Effect of tillage system on chlorophyll production in youngest leaf and senescence in oldest under CT and MT.**= p<0.01; *= p<0.05; ns = not statistically significant.

67
Chlorophyll production on youngest leaf at Dalmada 2003/2004
*nsnsns
0102030405060
51 74 89 103
Days after planting
Chl
orop
hyll
read
ings
CTMT
Chlorophyll on lowest leaf at Dalmada 2003/2004
*ns*ns
0102030405060
51 74 89 103
Days after planting
Chl
orop
hyll
read
ings
CTMT
Figure 3.11: Effect of tillage system on chlorophyll production in youngest leaf and senescence in oldest under CT and MT.**= p<0.01; *= p<0.05; ns = not
statistically significant.

68
Chlorophyll production on youngest leaf at Syferkuil 2003/2004
***ns
10152025303540455055
44 54 76
Days after planting
Chl
orop
hyll
read
ings
CTMT
Chlorophyll on lowest leaf at Syferkuil 2003/2004
ns ** ns
101520253035404550
44 54 76
Days after planting
Chl
orop
hyll
read
ings
CTMT
Figure 3.12: Effect of tillage system on chlorophyll production in youngest leaf and senescence in oldest under CT and MT.**= p<0.01; *= p<0.05; ns = not statistically significant.

69
Agripers intercrop vs sole maize (Dalmada 2002/2003)
Agri - R2 = 0.982Sole - R2 = 0.8168
01020304050
64 71 78 96
Days after planting
Chl
orop
hyll
read
ings
AgriSole
Lablab intercrop vs sole maize (Dalmada 2002/2003)
Lablab - R2 = 0.8914Sole - R2 = 0.8168
01020304050
64 71 78 96
Days after planting
Chl
orop
hyll
read
ings
labSole
Velvet bean intercrop vs sole maize (Dalmada 2002/2003)
Sole - R2 = 0.8168Velvet - R2 = 0.9638
01020
304050
64 71 78 96
Days after planting
Chl
orop
hyll
read
ings
VelvetSole
Bechuana White intercrop vs sole maize (Dalmada 2002/2003)
BCW - R2 = 0.8545Sole - R2 = 0.8168
01020304050
64 71 78 96
Days after planting
chlo
roph
yll r
eadi
ngs
BCWSole
Figure 3.13: Effect of cropping system on chlorophyll content of maize intercropped with the different legumes in the youngest fully expanded leaf at Dalmada during 2002/2003 growing season. **= p<0.01; *= p<0.05; ns = not statistically significant.

70
Agripers intercrop vs sole maize (Dalmada 2002/2003)
Agri - R2 = 0.9882Sole - R2 = 0.7902
0
20
40
60
64 71 78 96
Days after planting
Chl
orop
hyll
read
ings
Agri Sole
lablab intercrop vs sole maize (Dalmada 2002/2003)
Sole - R2 = 0.7902Lablab - R2 = 0.9589
0
1020
3040
50
64 71 78 96Days after planting
Chl
orop
hyll
read
ings
labSole
Velvet bean intercrop vs sole maize (Dalmada 2002/2003)
Sole - R2 = 0.7902Velvet - R2 = 0.9285
0
1020
3040
50
64 71 78 96Days after planting
Chl
orop
hyll
read
ings
VelvetSole
Bachuana White intercrop vs sole maize (Dalmada 2002/2003)
BCW - R2 = 0.8391Sole - R2 = 0.7902
0
10
20
30
40
50
64 71 78 96Days after planting
Chl
orop
hyll
read
ings
BCWSole
Figure 3.14: Effect of cropping system on chlorophyll content of maize intercropped with the different legumes in the lowest leaves at Dalmada during 2002/2003 growing season. **= p<0.01; *= p<0.05; ns = not statistically significant.

71
Agripers intercrop vs sole maize (Dalmada 2003/2004)
Sole=R 2 = 0.9089Agri=R 2 = 0.58
0102030405060
51 74 89 103
Days after planting
Chl
orop
hyll
read
ings
AgriSole
Lablab intercrop vs sole maize (Dalmada 2003/2004)
Sole=R 2 = 0.9089Lab=R2 = 0.7012
0102030405060
51 74 89 103Days after planting
Chl
orop
hyll
read
ings
LabSole
Velvet bean intercrop vs sole maize (Dalmada 2003/2004)
Sole=R 2 = 0.9089Vel=R2 = 0.8232
0102030405060
51 74 89 103
Days after planting
Chl
orop
hyll
read
ings
VelSole
Bechuana White intercrop vs sole maize (Dalmada 2003/2004)
Sole=R 2 = 0.9089BCW=R 2 = 0.6777
0102030405060
51 74 89 103Days after planting
Chl
orop
hyll
read
ing
BCWSole
Figure 3.15: Effect of cropping system on chlorophyll content of maize intercropped with the different legumes in the youngest fully expanded leaf at Dalmada during 2003/2004 growing season. **= p<0.01; *= p<0.05; ns = not statistically significant.

72
Agripers intercrop vs Sole maize (Dalmada 2003/2004)
Sole=R 2 = 0.86Agri=R 2 = 0.87
0102030405060
51 74 89 103
Days after planting
Chl
orop
hyll
read
ings
Soleagri
Lablab bean intercrop vs Sole maize (Dalmada 2003/2004)
Lablab=R2 = 0.82Sole=R 2 = 0.86
0102030405060
51 74 89 103Days after planting
Chl
orop
hyll
read
ings
Solelab
Velvet bean intercrop vs Sole maize (Dalmada 2003/2004)
Velvet=R 2 = 0.91
Sole=R 2 = 0.86
0102030405060
51 74 89 103Days after planting
Chl
orop
hyll
read
ings
Solevel
Bechuana white intercrop vs Sole maize (Dalmada 2003/2004)
Sole=R 2 = 0.86
BCW=R 2 = 0.95
0102030405060
51 74 89 103Days after planting
Chl
orop
hyll
read
ings
SoleBCW
Figure 3.16: Effect of cropping system on chlorophyll content of maize intercropped with the different legumes in the lowest leaves at Dalmada during 2003/2004 growing season. **= p<0.01; *= p<0.05; ns = not statistically significant.

73
Agripers intercrop vs sole maize (Syferkuil 2003/2004)
Agri=R 2 = 0.8887Sole=R 2 = 0.8238
01020304050
44 54 76
Days after planting
chlo
roph
yll r
eadi
ngs
SoleAgri
Lablab intercrop vs sole maize (Syferkuil 2003/2004)
Lab=R2 = 0.5724Sole=R 2 = 0.8238
0
10
20
30
40
50
44 54 76Days after planting
Cho
loro
phyl
l re
adin
gs
SoleLab
Velvet bean intercrop vs sole maize (Syferkuil 2003/2004)
Vel =R2 = 0.6621Sole=R 2 = 0.8238
01020304050
44 54 76
Days after planting
Chl
orop
hyll
read
ings
SoleVel
Bechuana white intercrop vs sole maize (Syferkuil 2003/2004)
BCW=R 2 = 0.7245
Sole=R 2 = 0.8238
0
1020
3040
50
44 54 76Days after planting
Chl
orop
hyll
read
ings
SoleBCW
Figure 3.17: Effect of cropping system on chlorophyll content of maize intercropped with the different legumes in the youngest fully expanded leaf at Syferkuil during 2003/2004 growing season. **= p<0.01; *= p<0.05; ns = not statistically significant.

74
Agripers intercrop vs sole maize (Syferkuil 2003/2004)
Sole=R 2 = 1Agri=R 2 = 1
01020304050
44 54 76Days after planting
Cho
loro
phyl
l re
adin
gs
SoleAgri
Lablab intercrop vs sole maize (Syferkuil 2003/2004)
Sole=R 2 = 1Lab=R2 = 1
010
2030
4050
44 54 76Days after planting
Chl
orop
hyll
read
ings
SoleLab
Velvet bean intercrop vs sole maize (Syferkuil 2003/2004)
Sole=R 2 = 0.6681Vel=R2 = 0.9997
01020304050
44 54 76Days after planting
Chl
orop
hyll
read
ings
SoleVel
Bechuana White intercrop vs Sole maize (Syferkuil 2003/2006)
BCW=R 2 = 0.8887Sole=R 2 = 0.6681
01020304050
44 54 76
Days after planting
Chl
orop
hyll
read
ings
Sole
BCW
Figure 3.18: Effect of cropping system on chlorophyll content of maize intercropped with the different legumes in the lowest leaves at Syferkuil during 2003/2004 growing season. **= p<0.01; *= p<0.05; ns = not statistically significant.

75
Table 3.1: Maize total Dry matter accumulation response to tillage system at Dalmada and Syferkuil during 2002/2003 and 2003/2004 growing seasons. Dalmada Dalmada Syferkuil 2002/2003 2003/2004 Tillage 63 DAP 77 DAP 97 DAP 87 DAP 70 DAP ………………………………………Kg/ha…………………………… CT 2358.0 2930.0 3469.2b 3924.1 3220.0b MT 2089.9 3317.9 4379.5a 4266.0 4215.6a Lsd Ns Ns 434.51 Ns 498.53 Tillage Ns Ns ** Ns ** Cropping system * Ns ns Ns ns Tillage*Cropping system
Ns Ns ns Ns ns
LSD = Least significant difference. Means followed by the same letter within columns are similar statistically; **= p<0.01; *= p<0.05; ns = not statistically significant. CT = Conventional tillage. MT = Minimum tillage. DAP = Days after planting.

76
Table 3.2: Maize total Dry matter accumulation response to cropping system at Dalmada and Syferkuil during 2002/2003 and 2003/2004 growing seasons. Dalmada Dalmada Syferkuil 2002/2003 2003/2004 Crop System 63 DAP 77 DAP 97 DAP 87 DAP 70 DAP ……………………………………..Kg/ha……………………………. Sole 3305.8a 3244.1 1206.8 3759.8 4133.3 M+Agri 1745.6b 3019.6 697.8 4027.0 3505.6 M+Lab 2195.5b 3102.0 1395.3 4307.6 3427.8 M+Vel 2188.8b 3442.7 1435.4 3759.8 3972.2 M+BCW 1684.3b 2811.5 918.1 4587.2 3550.0 Lsd 984.62 Ns ns Ns 788.25 Tillage Ns Ns ** Ns ** Cropping system * Ns ns Ns ns Tillage*Cropping system
Ns Ns ns Ns ns
LSD = Least significant difference. Means followed by the same letter within columns are similar statistically; **= p<0.01; *= p<0.05; ns = not statistically significant. CT = Conventional tillage. MT = Minimum tillage. DAP = Days after planting.

77
Table 3.3: Legume Dry matter accumulation to tillage systems at Dalmada and Syferkuil during 2002/2003 and 2003/2004 growing seasons. Dalmada Dalmada Syferkuil 2002/2003 2003/2004 2003/2004 Tillage 41 DAP 67 DAP 58 DAP 74 DAP 44 DAP 71 DAP …………………….……………..kg/ha……………………………… CT 25.8 65.1 309.5b 608.8b 90.7b 312.1b MT 25.4 88.6 870.8a 1255.8a 161.9a 986.6a Lsd 8.19 35.37 414.42 215.64 35.13 269.8 Tillage Ns Ns * ** ** ** Cropping system ** ** ** ** ns ** Tillage*Cropping system
** Ns ns * ns *
LSD = Least significant difference. Means followed by the same letter within columns are similar statistically; **= p<0.01; *= p<0.05; ns = not statistically significant. CT = Conventional tillage. MT = Minimum tillage. DAP = Days after planting.

78
Table 3.4: Legume dry matter accumulation response to cropping system at Dalmada and Syferkuil in all growing seasons. Dalmada Dalmada Syferkuil 2002/2003 2003/2004 2003/2004 Tillage 41 DAP 67 DAP 58 DAP 74 DAP 44 DAP 71 DAP …………………….……………..kg/ha…………………………………….. M + Agrinawa 32.4ab 95.7ab 1321.7a 1717.4a 180.7a 1152.5a M + Lablab 25.4b 67.6b 551.9bc 1065.7b 133.9a 909.7ab M + Velvet bean 44.9a 95.0ab 408.2bc 710.9c 134.1a 640.7b M + Bechuana White 25.2b 126.8a 669.2ab 1167.4b 182.9a 544.0b Lsd 12.9 55.9 655.3 340.9 55.5 426.6 Tillage ns ns * ** ** ** Cropping system ** ** ** ** ns ** Tillage*Cropping system
** Ns ns * ns *
LSD = Least significant difference. Means followed by the same letter within columns are similar statistically; **= p<0.01; *= p<0.05; ns = not statistically significant. CT = Conventional tillage. MT = Minimum tillage. DAP = Days after planting.

79
CONCLUSION AND RECOMMENDATIONS Major study finding
Based on the study, minimum tillage system proved to be generally more superior in
the parameters measured throughout the experimentation at both locations. Maize
yield during 2002/2003 and 2003/2004 (Syferkuil) growing season was significantly
higher under minimum tillage. Agronomic characteristics and yield components were
a good reflection of the grain yield. According to the finding of this study, grain yield
of the two tillage systems was strongly determined by the number of cobs per plant
and weight of cob. Weight of kernels did not show any significant role on grain yield.
Generally at both locations, significantly higher soil moisture was recorded under the
minimum tillage system compared to conventional system. A decreasing trend of
chlorophyll production was observed throughout the experimental period at both
locations. Although dry matter accumulation for both maize and legumes were
similar at several sampling dates, there were some instances where crops grown under
minimum tillage were superior to those under conventional system.
The following additional conclusions could be drawn from the studies:
The implementation of minimum tillage especially on dryland farming
and in drought prone areas such as the Limpopo province can be
beneficial to farmers as grain yield and major yield components
increase compared to conventional tillage system.

80
Due to minimal disturbance of the soil, more soil moisture was
conserved under the minimum tillage system compared to conventional
system as inferred by higher gravimetric soil moisture.
Legumes in both seasons and locations played a minimal and non
significant role as the growth and development was very poor due to
late planting and poor solar radiation interception.
Recommendations
Production of good yield in low rainfall and water scarce areas need good cultural
practices and suitable tillage systems. Further study is recommended on the evaluation
of tillage systems on different crops in order to ascertain the optimal system for each
crop and suitable planting time for legumes.

81
REFERENCES
Andrade, F. H., M. E. Otegui and Vega C. 2000. Intercepted Radiation at flowering and kernel number in maize. Agron. J. 92: 92-97.
Ayisi, K.K., M.S. Mposi, and J. van den Berg. 2001. Grain yield response and C. partellus infestation in diverse sorghum: cowpea intercrop arrangements. S. Afr. J. of Plant and Soils. 18 (1). Barbieri, P. A., H. R. Rozas, F. H. Andrade and H. E. Echeverria. 2000. Row spacing Effect at Different levels of Nitrogen Availability in Maize. Agron. J.92:283- 288. Belay, A., H. Gebrekidan and Y. Uloro. 1998. Effect of tied ridges on grain yield response of Maize (Zea mays L.) to application of crop residual N and P on two soil types at Alemaya, Ethiopia. South African J. Plant and Soil 15:123- 129. Bratia, C. R. and R. Mitra. 1990. Bioenergetic of grain protein. In Nitrogen in higher plants. Y.P Abrol. P.427.New York Brophy, L. S. and G. H. Heichel. 1989. Nitrogen release from root of alfalfa and soybean growth in sand culture. Plant and Soil 116:77-84 Cenpukdee, U. and S. Fukai., 1991. Effects of nitrogen supply on Cassava/pigeon pea intercropping with three contrasting cassava cultivars. Field Crops Res., 29: 275-280. Clark, K. M. and R. L. Myers. 1994. Intercrop performance of pearl millet, amaranth, cowpea and soybean in response to planting pattern and nitrogen. Agron. J. 86:1097-1102. Daniel, J. B., A. O. Abaye, M. M. Alley, C. W. Adcock and J. C. Maitland. 1999.
Winter Annual Cover Crops in a Virginia No-till Cotton Production System: II. Cover and Tillage Effects on Soil Moisture, Cotton Yield, and Cotton Quality. The Journal of Cotton Sci. 3:84-91.
Eaglesham, A. R. J., A. Ayanaba., V. Ranga Rao and D. L. Eckew. 1981. Improving the nitrogen nutrition of maize by intercropping with cowpea. Soil Biol. Biochem. 13:169-171. Evans, L. T. 1993. Crop Evaluation, Adaptation and Yield. Cambridge Press, Australia Ghaffarzadeh, M., F. G. Prechac, and R. M. Cruse. 1997. Toillage effect on soil water content and corn yield in a strip intercropping system. Agronomic journal. 89: 893-899

82
Gardiner, T. R., and L. E. Cracker., 1981. Bean growth and light interception in a bean-maize intercrop. Field Crops Res. 4: 313-320 Gomez, K. A., and A. A. Gomez. 1984. Statistical procedure for agricultural research. 2nd ed. John Wiley and sons, Inc. New York. Hartkap, A. D., G. Hoogenboon, R. A. Gilbert, T. Benson, S. A. Tarawali, A. J. Gijsman, W. Bown and J. W. White. 2002. Adaptation of the CROPCRO growth model to velvet bean (Mucuna prupriens). II. Cultivar evaluation and model testing. Field Crop Res. 78:27-40. Hartkap, A. D., G. Hoogenboon and J. W. White. 2002. Adaptation of the
CROPCRO growth model to velvet bean (Mucuna prupriens). I Model development. Field Crop Res. 78:9-25.
Hatfield, J. L., T. J. Sauer and J. H. Prueger. 2001 Managing soils to achieve greater water use efficiently: A review. Agron. J. 93:271-280. Kladivko, E. J. 2001. Tillage systems and Soil ecology. Soil and Tillage Res. 61:61- 76. Maluleke, H. M. 2004. Biological productivity, soil resource use and stalk borer infestation in maize lablab planting date and density intercropping system. Masters thesis. University of the North. Mehdi, B. B., C. A. Madramootoo and G. R. Mehuys. 1999. Yield and Nitrogen Content of corn under different tillage practices. Agron. J. 91:631-636. Modiba, M. D. 2002. Growth and grain yield response of maize (Zea mays) water and
Nitrogen in smallholder irrigation schemes in the Limpopo province. Master thesis. University of the North, Syferkuil.
Morris, R. A., Villegas, A. N., Polthane, A. and Centeno, H. S., 1990. Water use by mono-cropped and intercropped cowpea and sorghum grown after rice. Agronomy Journal., 82: 884-668. Murungweni, C., S. Chibi, L. Svisva, C. Nyama, G. Manyawu, N. Mukombe and N.
Mutema. 2002. Velvet bean Hay (Mucuna pruriens), Dolichos lablab Hay (Lablab purpureurs) and Paprika Calyx (Capsicum anuum L) as Substitutes for Conventional Protein Sources used in Dairy and Fattenning Diets by Smallholder Farmers of Zimbabwe. AS2/96/149 Annual workshop, Makgobaskloof. 7-10 October 2002. Pp. 144-122.
Olaoye, O. J. 2002. Influence of tillage on crop residue cover, soil properties and
yield components of cowpea in derived Savannah Ectones of Nigeria. Soil and Tillage Res. 64:179-187.
Oweis, T., H. Zhang and M. Pala. 2000. Water use Efficiency of Rainfed and Irrigated Bread Wheat in a Mediterranean Environment. Agron. J. 92:231- 238.

83
Rauschkolb, R. S. and A. G. Hornsby. 1994. Nitrogen management in irrigated agriculture. Oxford, University Press, 251pp. Rozas, H. S., H. E. Echeverria., G. A. Studdent and F. H. Andrade. 1999. No-till
maize Nitrogen uptake and yield: Effect of Urease inhibitor and application time. Agron. J. 91:950-955.
Sallar, R. Y. K. 1991. Effect of six cycle of recurrent selection on the nitrogen
response of a Lowland Tropical maize production. Proceedings of the SAFGRAD Inter Network Conference held at ‘Palais des Congres’.p 195-197. Menyonga J. M, yayouk J. Y., Niamey, Niger.
SAS Institute. 1990. SAS/statistics user’s guide. Version 6, 4th Ed. SAS Inst. Cary,
NC. Scott, H. D., 2000. Soil physics. Agricultural and Environmental applications.
Published at Iowa State University Press. USA Scott, C. C and J. B. Hector., 1997. Using a chlorophyll meter to estimate specific leaf
nitrogen of tropical maize during vegetative growth. Agronomy Journ. 89: 557-562.
Sinclair, T. R and R. C. Muchow. 2001. System Analysis of Plant Traits to Increase
Grain Yield and Limited Water Supplies. Agron. J. 93:263-270. Smartt, J. 1990. Pulses of the classical world, p. 190-198. In: R.J. Summerfield and E.H. Ellis (eds.). Grain legumes: evaluation and genetic resources. Cambridge Univ. Press, Cambridge. Smith, C. W. 1995. Crop production. Wiley, Canada. Soil classification working group. 1991. Soil classification, A Taxonomic System for South
Africa. Soil and Irrigation Research Institute, Department of Agricultural Development. Pretoria.
Sprague, G. F and J. W. Dudley. 1988. Corn and Corn Improvement. Madison, Wisconsin: USA. Tabassum, M. I. 2004. Development of maize under water stress areas. DAWN- Business.14November2004. Torbert, H. A., K. N Potter, and J. E Morrison. 2001. Tillage system, fertilizer Nitrogen rate and timing effect on corn yields in the Texas Blank land Prairie. Agron. J.93:1119-1124. Unger, P. W. 1991. Ontogeny and water use of No-tillage Sorghum Cultivars on D Dryland. Agron. J. 83:961-968. Van Rensburg, J. 1998. Farming Systems Research. Maize-cowpea intercropping research at Impendhile. Agri-update, Kwazulu Natal.
84
Vandemeer, J.1992. The Ecology of Intercropping. Cambridge Press. New York. Wang, G., M. S. Kang and O Morero. 1999. Genetic analyses of grain-filling rate and duration in maize. Field Crops Res. 61:211-222. Watiki, J. M., S. Fuka, J. A. Banda and B. A. Keating. 1993. Radiation interception and growth of maize/cowpea intercrop as affected by maize plant density and cowpea cultivar. Field Crop Res. 35:123-133. Yusuf, R. I., J. C. Siemens and D. G. Bullock. 1999. Growth analysis of soybean
under No-tillage and conventional tillage systems.

85
DISSERTATION APPENDIX

86
Table 1. Response of maize grain yield to tillage systems at Dalmada (2002/2003 and 2003/2004) and Syferkuil (2003/2004).
Dalmada Syferkuil Tillage 2002/2003 2003/2004 2003/2004 …………………………………Kg/ha………………… CT 357b 1557a 2943b MT 755a 1436a 3393a Lsd 145.07 ns 355.26 Tillage ** ns * Cropping system ns ns ns Tillage*Cropping * * ns
LSD = Least significant difference. Means followed by the same letter within a column are similar statistically; **= p<0.01; *= p<0.05; ns = not statistically significant. CT = Conventional tillage. MT = Minimum tillage

87
Table 2: Moisture response to tillage system at Syferkuil during 2003/2004 growing season. Tillage 0-150mm 150-300mm 0-150mm 150-300mm 84 DAP 126 DAP CT 9.24a 9.72a 6.9b 7.9b MT 10.29a 10.53a 8.8a 10.5a Lsd ns ns 0.95 1.5 Tillage ns ns ** ** Cropping system ns ns Ns ns Tillage*Cropping system
ns ns Ns ns
LSD = Least significant difference. Means followed by the same letter within a column are similar statistically; **= p<0.01; *= p<0.05; ns = not statistically significant. CT = Conventional tillage. MT = Minimum tillage

88
Table3: Moisture response to cropping system at Syferkuil during 2003/2004 growing season.
LSD = Least significant difference. Means followed by the same letter within a column are similar statistically; **= p<0.01; *= p<0.05; ns = not statistically significant. CT = Conventional tillage. MT = Minimum tillage
Cropping system 0-150mm 150-300mm 0-150mm 150-300mm 84 DAP 126 DAP Sole 10.76a 11.05a 7.9a 9.7a M+Agri 8.98a 10.36a 7.8a 10.4a M+Lab 8.83a 8.39a 7.3a 8.5a M+Vel 10.40a 10.79a 7.9a 8.8a M+BCW 9.87a 10.03a 8.5a 8.7a Lsd Ns ns ns ns Tillage Ns ns ** ** Cropping system Ns ns ns ns Tillage*Cropping system
Ns ns ns ns

89
Table 4: Moisture response to tillage system at Dalmada during 2003/2004 growing season. Tillage 0-150mm 150-300mm 0-150mm 150-300mm 74 DAP 130 DAP CT 8.2b 9.9a 7.2a 7.1a MT 10.9a 12.0a 8.1a 7.9a Lsd 2.4 ns Ns ns Tillage * ns Ns ns Cropping system ns ns Ns * Tillage*Cropping system
ns ns Ns ns
LSD = Least significant difference. Means followed by the same letter within a column are similar statistically; **= p<0.01; *= p<0.05; ns = not statistically significant. CT = Conventional tillage. MT = Minimum tillage
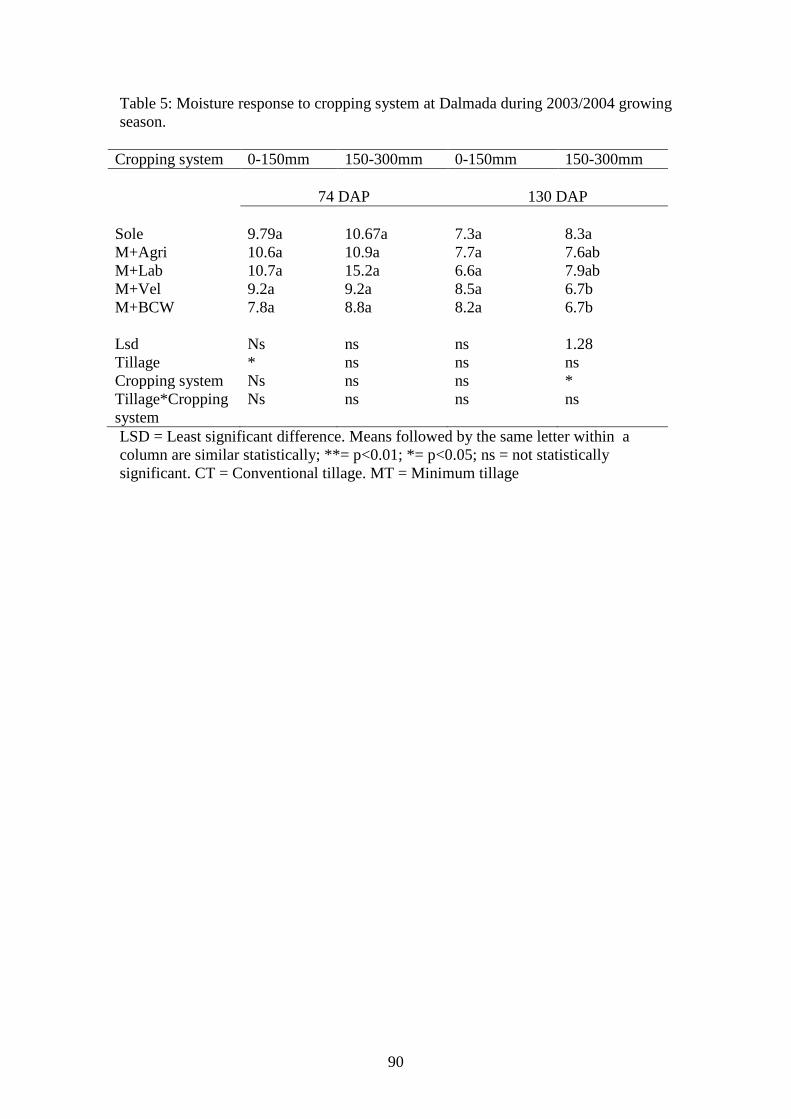
90
Table 5: Moisture response to cropping system at Dalmada during 2003/2004 growing season.
LSD = Least significant difference. Means followed by the same letter within a column are similar statistically; **= p<0.01; *= p<0.05; ns = not statistically significant. CT = Conventional tillage. MT = Minimum tillage
Cropping system 0-150mm 150-300mm 0-150mm 150-300mm 74 DAP 130 DAP Sole 9.79a 10.67a 7.3a 8.3a M+Agri 10.6a 10.9a 7.7a 7.6ab M+Lab 10.7a 15.2a 6.6a 7.9ab M+Vel 9.2a 9.2a 8.5a 6.7b M+BCW 7.8a 8.8a 8.2a 6.7b Lsd Ns ns ns 1.28 Tillage * ns ns ns Cropping system Ns ns ns * Tillage*Cropping system
Ns ns ns ns

91
Table 6: Moisture response to tillage system (Dalmada 2002/2003). Tillage 0-150mm 150-300mm 0-150mm 150-300mm 63 DAP 81 DAP CT 5.58a 4.35b 6.99b 9.16a MT 4.37a 6.76a 8.59a 8.96a Lsd ns 2.13 1.52 ns Tillage ns * * ns Cropping system ns ns Ns ns Tillage*Cropping system
ns ns Ns ns
LSD = Least significant difference. Means followed by the same letter within a column are similar statistically; **= p<0.01; *= p<0.05; ns = not statistically significant. CT = Conventional tillage. MT = Minimum tillage

92
Table 7: Moisture response to cropping system (Dalmada 2002/2003). Cropping system 0-150mm 150-300mm 0-150mm 150-300mm 63 DAP 81 DAP Sole 4.11a 4.40a 7.08a 9.27a M+Agri 3.69a 7.11a 6.66a 9.06a M+Lab 6.61a 5.41a 7.78a 8.66a M+Vel 5.65a 5.68a 9.17a 9.24a M+BCW 4.81a 5.18a 9.07a Lsd ns ns ns ns Tillage ns * ns ns Cropping system ns ns ns ns Tillage*Cropping system
ns ns ns ns
LSD = Least significant difference. Means followed by the same letter within a column are similar statistically; **= p<0.01; *= p<0.05; ns = not statistically significant. CT = Conventional tillage. MT = Minimum tillage

93
Table 8: Effect of tillage system on chlorophyll content in the youngest fully expanded leaf at Dalmada during 2002/2003 growing season. Tillage 64 DAP 71 DAP 78 DAP 96 DAP CT 33a 35a 39a 23a MT 36a 37a 36b 23a Lsd ns ns 2.6 ns Tillage ns ns * ns Cropping system ns ns ns ns Tillage*Cropping system
ns ns ns ns
LSD = Least significant difference. Means followed by the same letter within a column are similar statistically; **= p<0.01; *= p<0.05; ns = not statistically significant. CT = Conventional tillage. MT = Minimum tillage

94
Table 9: Effect of tillage system on chlorophyll content in the lower leaves at Dalmada during 2002/2003 growing season. Tillage 64 DAP 71 DAP 78 DAP 96 DAP CT 35b 40a 42a 23a MT 39a 38a 38b 21a Lsd 3.75 ns 3.58 ns Tillage ** ns * ns Cropping system ns ns ns ns Tillage*Cropping system
ns ns ns ns
LSD = Least significant difference. Means followed by the same letter within a column are similar statistically; **= p<0.01; *= p<0.05; ns = not statistically significant. CT = Conventional tillage. MT = Minimum tillage

95
Table 10: Effect of cropping system on chlorophyll content in the lower leaves at Dalmada during 2002/2003 growing season. Cropping system 64 DAP 71 DAP 78 DAP 96 DAP Sole 36.82a 37.32a 42.64a 23.0a M+Agri 34.00a 38.91a 37.32a 23.3a M+Lab 38.68a 40.20a 39.16a 22.1a M+Vel 38.34a 38.59a 38.98a 22.1a M+BCW 37.87a 38.35a 42.41a 22.2a Lsd ns ns Ns ns Tillage ** ns * ns Cropping system ns ns Ns ns Tillage*Cropping system
ns ns Ns ns
LSD = Least significant difference. Means followed by the same letter within a column are similar statistically; **= p<0.01; *= p<0.05; ns = not statistically significant. CT = Conventional tillage. MT = Minimum tillage

96
Table 11: Effect of Crop system on chlorophyll content in the youngest fully expanded leaf at Dalmada during 2003/2004 growing season. Cropping system 64 DAP 71 DAP 78 DAP 96 DAP Sole 34.45a 35.49a 39.46a 23a M+Agri 32.24a 36.05a 35.13a 23a M+Lab 35.50a 35.57a 36.94a 24a M+Vel 35.18a 37.56a 36.85a 23a M+BCW 36.02a 35.94a 37.59a 27a Lsd ns ns ns ns Tillage ** ns * ns Cropping system ns ns ns ns Tillage*Cropping system
ns ns ns ns
LSD = Least significant difference. Means followed by the same letter within a column are similar statistically; **= p<0.01; *= p<0.05; ns = not statistically significant. CT = Conventional tillage. MT = Minimum tillage

97
a
b
1
3
5
7
9
11
13
15
CT MT
2002/2003 growing season
Num
ber o
f row
s pe
r cob
b
a
0
5
10
15
20
25
30
35
40
CT MT
2002/2003 growing season
Num
ber o
f ker
nels
per
row
b
a
050
100150200250300350400450500
CT MT
2002/2003 growing season
Num
ber o
f ker
nels
per
cob
a
b
0
200
400
600
800
1000
1200
1400
1600
CT MT
2002/2003 growing season
Wei
ght o
f cob
s (K
g/ha
)
Fig 1. Maize yield components as influenced by tillage systems at Dalmada during 2002/2003 growing season.

98
aaa
a
2
4
6
8
10
12
14
16
Dalmada Syferkuil
Locations in 2003/2004 growing season
Num
ber o
f row
s pe
r cob
CTMT
ab
aa
510
1520
2530
3540
45
Dalmada Syferkuil
LOcations in 2003/2004 growing season
Num
ber o
f ker
nels
per
row
CT
MT
b
aa
a
400
420
440
460
480
500
520
540
560
Dalmada Syferkuil
Locations in 2003/2004 growing season
Num
ber o
f ker
nels
per
cob
CTMT
b
b
a
a
0
50
100
150
200
250
Dalmada Syferkuil
Locations in 2003/2004 growing season
Wei
ght o
f cob
s (g
)
CT
MT
Fig. 2. Maize yield components as influenced by tillage systems at Dalmada and Syferkuil during 2003/2004 growing season.