Assessing the Ecological Implications of the Altered Flow ...

TITLE: ENERGY FLOW IN ECOLOGICAL SYSTEMS
TOPIC: Ecosystems
FOCUS QUESTIONS:
1. What are the fundamental components of ecological systems? 2. How does energy move through ecosystems? What transformations are
involved? 3. How is energy flow different from the biomass cycle in ecosystems?
BIG IDEA: Ecosystems involve transformations of energy
GRADE LEVEL: 9-12
by ALANDEOM WANDERLEI DE OLIVEIRA
A UNIT PLAN
Submitted in partial fulfillment of the requirements
for the Q540 course: Teaching Environmental Education
BLOOMINGTON, INDIANA
2005
1

1. RATIONALE Misconceptions are scientifically inaccurate assumptions and explanations of
phenomena constructed by an individual through his/her experiences. Regardless of age and background, people are likely to have ecological misconceptions. These misconceptions are particularly important to overcome, because ecology teaches students how they are influenced by, and have influence on, the ecosystems and the biosphere. Accurate understanding and ability to make decisions about potential environmental policies that impact the students’ are increasingly demanded as human impacts on the planet Earth intensify.
Common ecological misconceptions include: 1) plants take in food from the outside environment, and/or plants get their food from the soil via roots; 2) organisms higher in a food web eat everything that is lower in the food web; 3) the top of the food chain has the most energy because it accumulates up the chain; 4) populations higher on a food web increase in number because they deplete those lower in the web; 5) there are more herbivores because people keep and breed them; 6) decomposers release some energy that is cycled back to plants; 7) the number of producers is high to satisfy consumers; 8) plants are dependent on humans, not vice versa; 9) carbon dioxide is a source of energy for plants. For references on each of these ecological misconceptions see Armstrong and Stamp (2004).
This unit plan was constructed with the intent of providing environmental educators with the curriculum needed to overcome mainly those misconceptions related to the flow of energy through ecological systems (listed as number 2 and 6). However, focus on the other misconceptions can be easily accomplished by expanding this unit. Activities in this unit plan are organized into an instructional sequence that follows the five phases of a learning cycle (Engage, Explore, Expand, Expand and Evaluate).
In the first phase (Engage), students are asked to build a food web. In the next phase (Explain), students calculate the efficiency of energy transfer and graph it against different lengths of food chains. In the Exploration phase, students model the flow of energy through a food chain by passing a quantity of water along a chain of students. In the Expand phase students use the computer program called Environmental Decision Making (EDM) to create a model of a pond ecosystem and run simulations of this model. Finally, in the Evaluation phase, students are asked to use the cards from the Food Chains and Webs Pattern Sheet to form a food web and use the EDM software to research the questions: how many fish you and your friends can remove without destroying future fishing.
The engagement activity serves as not only to get students interested but also to prompt them to think about their prior knowledge related to the ecological concepts at hand (ecosystems components, energy transformations, etc). The activity used to model energy from in ecosystems are also modeled strategically, starting with a kinesthetic and very concrete simulation, and then following with a very abstract and more complex computer simulation. This transition from concrete to abstract simulations, followed by extensive analysis and discussion of results is likely to increase the likelihood of success of overcoming student’s misconceptions related to energy flow in ecosystems. Finally, in the end of the unit plan, students are asked to use their increased understanding of the flow of energy in ecosystems to inform their decision about an environmental policy related to the amount of fishing in a pond, a real-life and complex task.
2
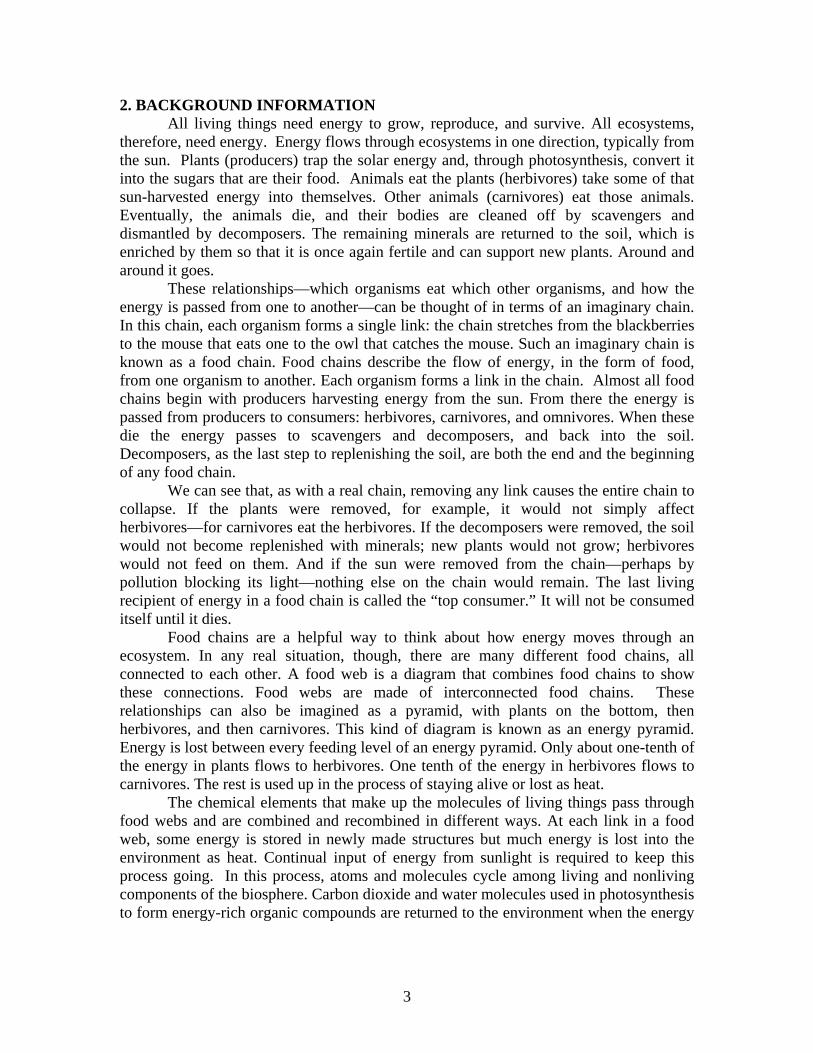
2. BACKGROUND INFORMATION All living things need energy to grow, reproduce, and survive. All ecosystems,
therefore, need energy. Energy flows through ecosystems in one direction, typically from the sun. Plants (producers) trap the solar energy and, through photosynthesis, convert it into the sugars that are their food. Animals eat the plants (herbivores) take some of that sun-harvested energy into themselves. Other animals (carnivores) eat those animals. Eventually, the animals die, and their bodies are cleaned off by scavengers and dismantled by decomposers. The remaining minerals are returned to the soil, which is enriched by them so that it is once again fertile and can support new plants. Around and around it goes.
These relationships—which organisms eat which other organisms, and how the energy is passed from one to another—can be thought of in terms of an imaginary chain. In this chain, each organism forms a single link: the chain stretches from the blackberries to the mouse that eats one to the owl that catches the mouse. Such an imaginary chain is known as a food chain. Food chains describe the flow of energy, in the form of food, from one organism to another. Each organism forms a link in the chain. Almost all food chains begin with producers harvesting energy from the sun. From there the energy is passed from producers to consumers: herbivores, carnivores, and omnivores. When these die the energy passes to scavengers and decomposers, and back into the soil. Decomposers, as the last step to replenishing the soil, are both the end and the beginning of any food chain.
We can see that, as with a real chain, removing any link causes the entire chain to collapse. If the plants were removed, for example, it would not simply affect herbivores—for carnivores eat the herbivores. If the decomposers were removed, the soil would not become replenished with minerals; new plants would not grow; herbivores would not feed on them. And if the sun were removed from the chain—perhaps by pollution blocking its light—nothing else on the chain would remain. The last living recipient of energy in a food chain is called the “top consumer.” It will not be consumed itself until it dies.
Food chains are a helpful way to think about how energy moves through an ecosystem. In any real situation, though, there are many different food chains, all connected to each other. A food web is a diagram that combines food chains to show these connections. Food webs are made of interconnected food chains. These relationships can also be imagined as a pyramid, with plants on the bottom, then herbivores, and then carnivores. This kind of diagram is known as an energy pyramid. Energy is lost between every feeding level of an energy pyramid. Only about one-tenth of the energy in plants flows to herbivores. One tenth of the energy in herbivores flows to carnivores. The rest is used up in the process of staying alive or lost as heat.
The chemical elements that make up the molecules of living things pass through food webs and are combined and recombined in different ways. At each link in a food web, some energy is stored in newly made structures but much energy is lost into the environment as heat. Continual input of energy from sunlight is required to keep this process going. In this process, atoms and molecules cycle among living and nonliving components of the biosphere. Carbon dioxide and water molecules used in photosynthesis to form energy-rich organic compounds are returned to the environment when the energy
3

in these compounds is eventually released by cells through the processes of cell respiration and other life activities.
The most abundant organisms in any ecosystem, aside from the decomposers, will be the producers. Plants have the most energy available to them because they trap it directly from the sun. There will be fewer carnivores and even fewer top carnivores. Small populations of top carnivores depend on much larger populations of other animals to survive. The number of organisms any environment can support is called its carrying capacity. The carrying capacity of an environment is limited by the available energy, water, oxygen, and minerals, and by the ability of ecosystems to recycle the remains of dead organisms through the activities of bacteria and fungi. Living organisms have the capacity to produce populations of unlimited size, but available resources in their environments are finite. This restricts the growth of populations and produces competition between organisms. 3. GOALS AND OBJECTIVES Students will be able to
1. Recognize the fundamental components of ecological systems including plant producers and animal consumers.
2. Demonstrate how species in a food chain interact. 3. Model how energy is transferred through a food chain. 4. Apply their understanding of energy flow to human food chains in order to inform
environmental decisions. 4. NAAEE GUIDELINES FOR LEARNING (9-12) AND CONTENT STANDARDS CORRELATION List of relevant NAAEE Guidelines for learning that correlate with this unit plan (grades 9-12): Strand 1– Questioning, Analysis and Interpretation Skills F) Working with models and simulations—Learners are able to create, use, and evaluate models to understand environmental phenomena. Strand 2– Knowledge of Environmental Processes and SystemsStrand 2.2–The Living Environment A) Organisms, populations, and communities—Learners understand basic population dynamics and the importance of diversity in living systems. C) Systems and connections—Learners understand the living environment to be comprised of interrelated, dynamic systems. D) Flow of matter and energy—Learners are able to account for environmental characteristics based on their knowledge of how matter and energy interact in living systems. Strand 2.4–Environment and Society A) Human/environment interactions—Learners understand that humans are able to alter the physical environment to meet their needs and that there are limits to the ability of the environment to absorb impacts or meet human needs. Strand 3 – Skills for Understanding and Addressing Environmental Issues
4
Strand 3.1–Skills for Analyzing and Investigating Environmental Issues B) Sorting out the consequences of issues—Learners are able to evaluate the consequences of specific environmental changes, conditions, and issues for human and ecological systems. C) Identifying and evaluating alternative solutions and courses of action—Learners are able to identify and propose action strategies that are likely to be effective in particular situations and for particular purposes.
List of relevant Indiana Academic Standards that correlate with this unit plan (grades 9-12): Environmental Science Standard 1- Principles of Environmental Science Environmental Systems Env.1.4 Understand and explain that human beings are part of Earth’s ecosystems and give examples of how human activities can, deliberately or inadvertently, alter ecosystems. Env.1.10 Identify and measure biological, chemical, and physical factors within an ecosystem. Flow of Matter and Energy Env.1.14 Recognize and explain that the amount of life any environment can support is limited by the available energy, water, oxygen, and minerals, and by the ability of ecosystems to recycle organic materials from the remains of dead organisms. Env.1.15 Describe how the chemical elements that make up the molecules of living things pass through food webs and are combined and recombined in different ways. Biology Ecology B.1.37 Explain that the amount of life any environment can support is limited by the available energy, water, oxygen, and minerals, and by the ability of ecosystems to recycle the residue of dead organic materials. Recognize, therefore, that human activities and technology can change the flow and reduce the fertility of the land. B.1.41 Recognize that and describe how human beings are part of Earth’s ecosystems. Note that human activities can, deliberately or inadvertently, alter the equilibrium in ecosystems. B.1.43 Understand that and describe how organisms are influenced by a particular combination of living and nonliving components of the environment. B.1.44 Describe the flow of matter, nutrients, and energy within ecosystems. Integrated Mathematics I Standard 2- Algebra and Functions IM1.2.6 Sketch a reasonable graph for a given relationship. IM1.2.7 Interpret a graph representing a given situation. Standard 4 – Data Analysis and Statistics IM1.4.1 Construct a line plot. IM1.4.12 Construct a scatterplot from a set of data. IM1.4.15 Compare sets of data using scatterplots and the line y = x, and interpret these comparisons for real-world data.
5

Integrated Mathematics II Standard 1- Algebra and Functions IM2.1.2 Interpret given situations as functions in graphs, formulas, and words. Standard 3 – Data Analysis and Statistics IM2.3.1 Describe the association between two variables by interpreting a scatterplot. 5. LESSON PLAN/5 E’s 5.1. Engagement Phase
Cut out the pictures from the Food Chain Picture Page, and have students paste them on separate pages under the appropriate headings of Producer, Primary Consumer/Herbivore, Secondary Consumer/Carnivore. Alternatively you could hand out the pages to groups of students and have them write down the headings on a sheet of paper, filling the names of the animals shown on the sheet under the appropriate heading.
Divide the class into small groups. Each group must use the pictures from the Food Chain Picture Page handout to form a food chain and food web. Each group is then given an opportunity to present to the class explaining why they used the pictures they did. Alternatively they can just write the names of the organism down in a diagram as above allowing you to reuse the Picture Page. 5.2. Exploration Phase - Energy Transfer in a Food Chain In this phase students will model the flow of energy through a food chain by passing a quantity of water along a chain of students. Materials: 5 1-gallon jugs, filled with tap water 5 metric measuring cups or graduated cylinders, holding at least 500 mls (approx. 2 cups) 15 8 oz cups, 3 having 2 pencil-size holes, and 12 having one pencil-sized hole Masking tape (5 pieces 10 cm long) + marker/ or chalk 15 numbered organism cards organized into five food chains (by color) as follows: Redwood (1) Milkweed(1), monarch caterpillar (2) Wheat(1), field mouse(2), hawk(3) Grass(1), beetle(2), chicken(3), fox(4) Plankton(1), shrimp(2), anchovy(3), cod(4), human(5) Set-up: On a walkway outside, set up the materials as follows Tape Chain A Chain B Chain C Chain D Chain E 10 paces
1 gallon jug
1 gallon jug 1 gallon jug 1 gallon jug 1 gallon jug
1 grad cyl. (1)
(1) (1) (1) (1)
2 Grad. cyl. (2) (2) (2) (2) 3 Grad cyl. (3) (3) (3) 4 Grad. Cyl (4) (4) 5 Grad cyl. (5)
6
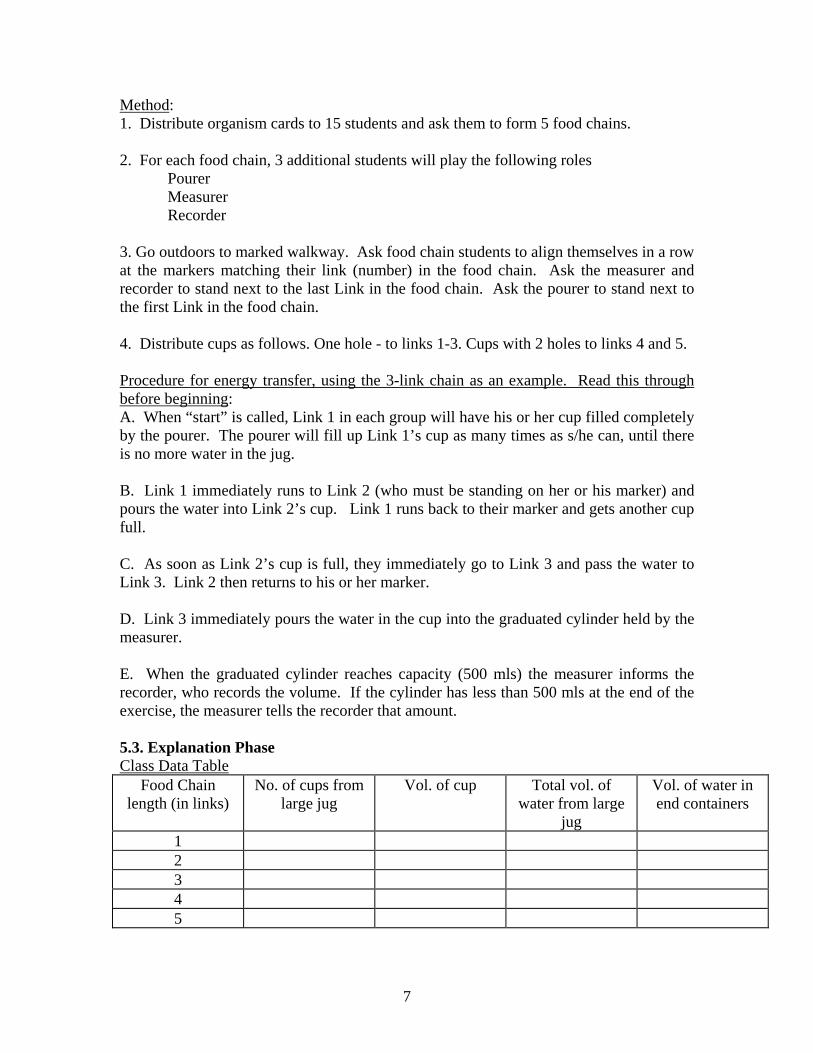
Method: 1. Distribute organism cards to 15 students and ask them to form 5 food chains. 2. For each food chain, 3 additional students will play the following roles Pourer Measurer Recorder 3. Go outdoors to marked walkway. Ask food chain students to align themselves in a row at the markers matching their link (number) in the food chain. Ask the measurer and recorder to stand next to the last Link in the food chain. Ask the pourer to stand next to the first Link in the food chain. 4. Distribute cups as follows. One hole - to links 1-3. Cups with 2 holes to links 4 and 5. Procedure for energy transfer, using the 3-link chain as an example. Read this through before beginning: A. When “start” is called, Link 1 in each group will have his or her cup filled completely by the pourer. The pourer will fill up Link 1’s cup as many times as s/he can, until there is no more water in the jug. B. Link 1 immediately runs to Link 2 (who must be standing on her or his marker) and pours the water into Link 2’s cup. Link 1 runs back to their marker and gets another cup full. C. As soon as Link 2’s cup is full, they immediately go to Link 3 and pass the water to Link 3. Link 2 then returns to his or her marker. D. Link 3 immediately pours the water in the cup into the graduated cylinder held by the measurer. E. When the graduated cylinder reaches capacity (500 mls) the measurer informs the recorder, who records the volume. If the cylinder has less than 500 mls at the end of the exercise, the measurer tells the recorder that amount. 5.3. Explanation Phase Class Data Table
Food Chain length (in links)
No. of cups from large jug
Vol. of cup Total vol. of water from large
jug
Vol. of water in end containers
1 2 3 4 5
7
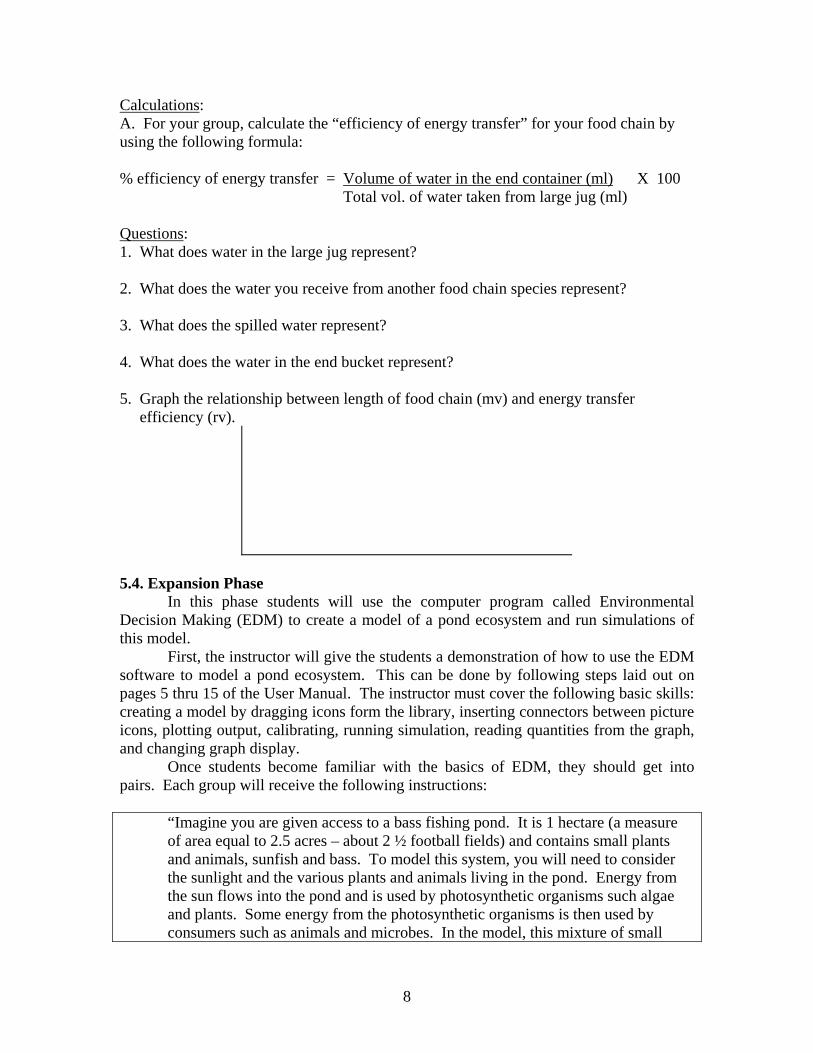
Calculations: A. For your group, calculate the “efficiency of energy transfer” for your food chain by using the following formula: % efficiency of energy transfer = Volume of water in the end container (ml) X 100 Total vol. of water taken from large jug (ml) Questions: 1. What does water in the large jug represent? 2. What does the water you receive from another food chain species represent? 3. What does the spilled water represent? 4. What does the water in the end bucket represent? 5. Graph the relationship between length of food chain (mv) and energy transfer efficiency (rv).
5.4. Expansion Phase
In this phase students will use the computer program called Environmental Decision Making (EDM) to create a model of a pond ecosystem and run simulations of this model.
First, the instructor will give the students a demonstration of how to use the EDM software to model a pond ecosystem. This can be done by following steps laid out on pages 5 thru 15 of the User Manual. The instructor must cover the following basic skills: creating a model by dragging icons form the library, inserting connectors between picture icons, plotting output, calibrating, running simulation, reading quantities from the graph, and changing graph display.
Once students become familiar with the basics of EDM, they should get into pairs. Each group will receive the following instructions:
“Imagine you are given access to a bass fishing pond. It is 1 hectare (a measure of area equal to 2.5 acres – about 2 ½ football fields) and contains small plants and animals, sunfish and bass. To model this system, you will need to consider the sunlight and the various plants and animals living in the pond. Energy from the sun flows into the pond and is used by photosynthetic organisms such algae and plants. Some energy from the photosynthetic organisms is then used by consumers such as animals and microbes. In the model, this mixture of small
8
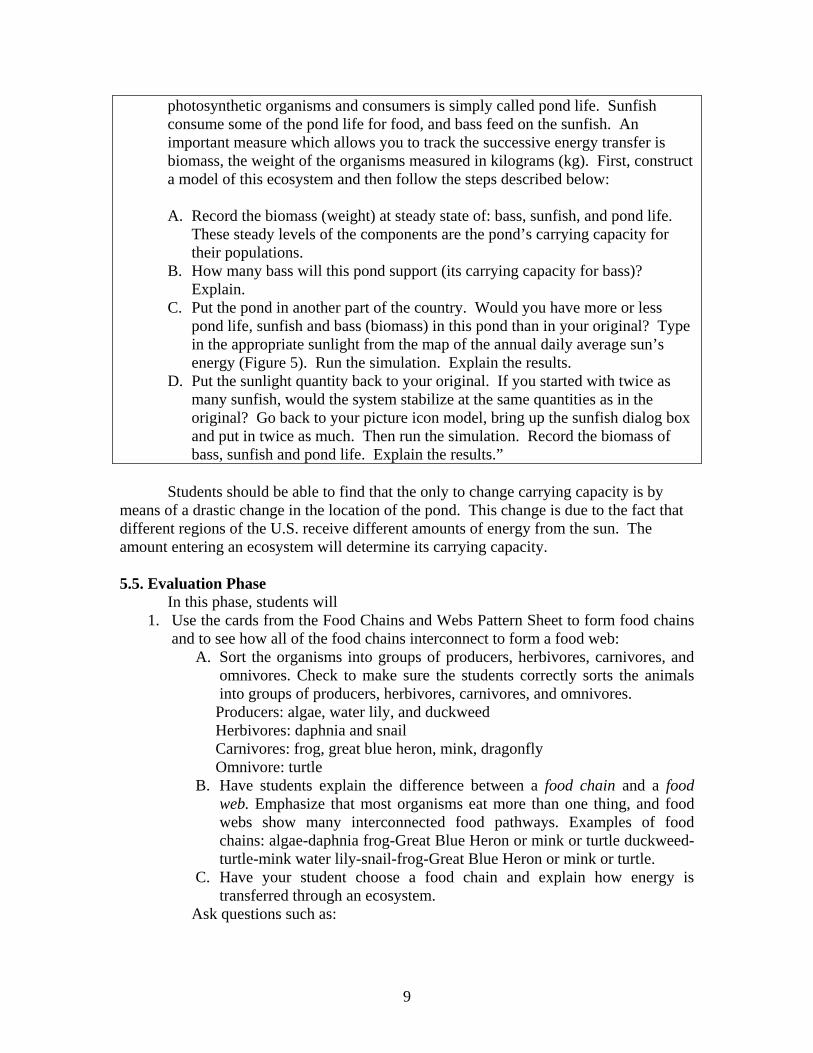
photosynthetic organisms and consumers is simply called pond life. Sunfish consume some of the pond life for food, and bass feed on the sunfish. An important measure which allows you to track the successive energy transfer is biomass, the weight of the organisms measured in kilograms (kg). First, construct a model of this ecosystem and then follow the steps described below: A. Record the biomass (weight) at steady state of: bass, sunfish, and pond life.
These steady levels of the components are the pond’s carrying capacity for their populations.
B. How many bass will this pond support (its carrying capacity for bass)? Explain.
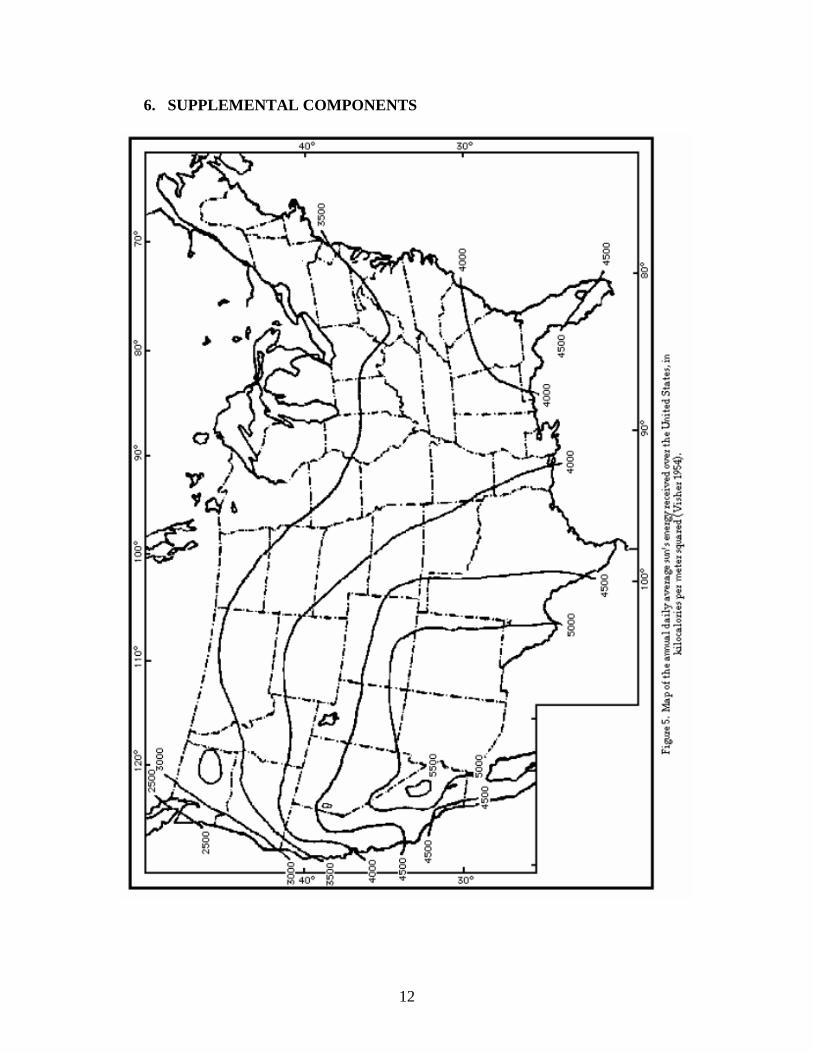
C. Put the pond in another part of the country. Would you have more or less pond life, sunfish and bass (biomass) in this pond than in your original? Type in the appropriate sunlight from the map of the annual daily average sun’s energy (Figure 5). Run the simulation. Explain the results.
D. Put the sunlight quantity back to your original. If you started with twice as many sunfish, would the system stabilize at the same quantities as in the original? Go back to your picture icon model, bring up the sunfish dialog box and put in twice as much. Then run the simulation. Record the biomass of bass, sunfish and pond life. Explain the results.”
Students should be able to find that the only to change carrying capacity is by means of a drastic change in the location of the pond. This change is due to the fact that different regions of the U.S. receive different amounts of energy from the sun. The amount entering an ecosystem will determine its carrying capacity.
5.5. Evaluation Phase
In this phase, students will 1. Use the cards from the Food Chains and Webs Pattern Sheet to form food chains
and to see how all of the food chains interconnect to form a food web: A. Sort the organisms into groups of producers, herbivores, carnivores, and
omnivores. Check to make sure the students correctly sorts the animals into groups of producers, herbivores, carnivores, and omnivores. Producers: algae, water lily, and duckweed Herbivores: daphnia and snail Carnivores: frog, great blue heron, mink, dragonfly Omnivore: turtle
B. Have students explain the difference between a food chain and a food web. Emphasize that most organisms eat more than one thing, and food webs show many interconnected food pathways. Examples of food chains: algae-daphnia frog-Great Blue Heron or mink or turtle duckweed-turtle-mink water lily-snail-frog-Great Blue Heron or mink or turtle.
C. Have your student choose a food chain and explain how energy is transferred through an ecosystem.
Ask questions such as:
9
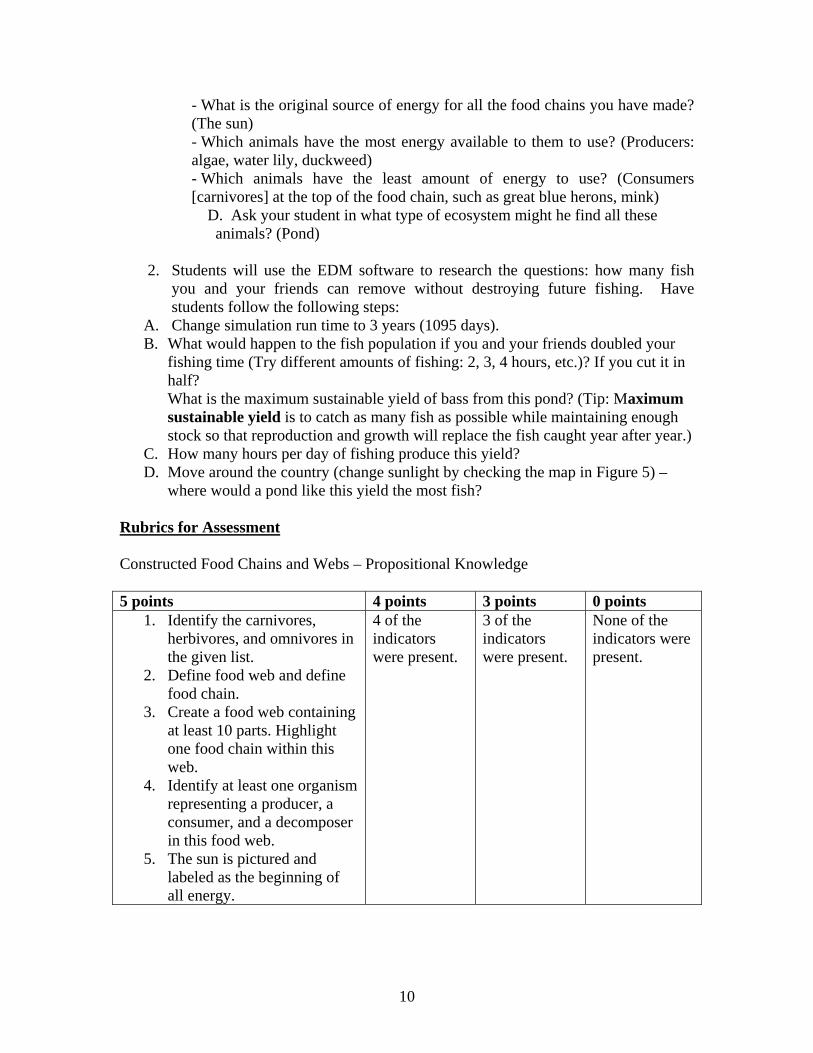
- What is the original source of energy for all the food chains you have made? (The sun) - Which animals have the most energy available to them to use? (Producers: algae, water lily, duckweed) - Which animals have the least amount of energy to use? (Consumers [carnivores] at the top of the food chain, such as great blue herons, mink) D. Ask your student in what type of ecosystem might he find all these animals? (Pond)
2. Students will use the EDM software to research the questions: how many fish
you and your friends can remove without destroying future fishing. Have students follow the following steps:
A. Change simulation run time to 3 years (1095 days). B. What would happen to the fish population if you and your friends doubled your
fishing time (Try different amounts of fishing: 2, 3, 4 hours, etc.)? If you cut it in half? What is the maximum sustainable yield of bass from this pond? (Tip: Maximum sustainable yield is to catch as many fish as possible while maintaining enough stock so that reproduction and growth will replace the fish caught year after year.)
C. How many hours per day of fishing produce this yield? D. Move around the country (change sunlight by checking the map in Figure 5) –
where would a pond like this yield the most fish? Rubrics for Assessment Constructed Food Chains and Webs – Propositional Knowledge 5 points 4 points 3 points 0 points
1. Identify the carnivores, herbivores, and omnivores in the given list.
2. Define food web and define food chain.
3. Create a food web containing at least 10 parts. Highlight one food chain within this web.
4. Identify at least one organism representing a producer, a consumer, and a decomposer in this food web.
5. The sun is pictured and labeled as the beginning of all energy.
4 of the indicators were present.
3 of the indicators were present.
None of the indicators were present.
10

EDM Investigation Tasks – Competency 5 points 4 points 3 points 0 points
1. Assemble a model of the ecosystem using icons.
2. Collect data by running simulations in order to better understand and refine the model.
3. Calibrate ecosystem model using data.
4. Generalize about likely behaviors of ecosystems based on modeling and simulation experiences
5. Identify the consequences of specific human decisions affecting the pond ecosystem.
Results almost always reasonable. Extensive justification of conclusions. Very few errors in use of language and methods of science and math. Very seldom needs help (guidance and explanation). Exhibits full knowledge and insight.
Results usually reasonable. Some justification of conclusions, but incomplete. Some errors in use of language and methods of science and math. Requires some help (guidance and explanation). Exhibits considerable knowledge and insight.
Results often unreasonable Very little justification of conclusion. Many errors in use of language and methods of science and math. Requires much help (guidance and explanation). Exhibits little knowledge or insight.
11
6. SUPPLEMENTAL COMPONENTS
12

13

14

15

7. REFERENCES AND RESOURCES Armstrong, M. and Stamp, N. (2004). Overcoming Ecological Misconception – The Power of Stories. Retrieved from Binghamton University Website: http://ecomisconceptions.binghamton.edu/energyflow.htm. “Energy Transfer in a Food Chain” was adapted from Community of Life a module in the Applications in Biology/Chemistry series, Waco, TX: Center for Occupational Research and Development, 1997, pp. 89- 95. Odum, E. C., Odum, H. T., and Perterson, N. S. (2002). Environmental Decision Making. In J. Jungck and V. Vaughan (Eds.) BioQUEST Library VI. San Diego: Academic Press, 2002. For more information about energy flow in ecosystems see the following websites: Energy Flow in Ecosystems http://www.usoe.k12.ut.us/curr/science/sciber00/8th/energy/sciber/ecosys.htm Food Webs: Energy Flow in an Ecosystem http://www.k12.com/curriculum/subjects/sample_lessons/lessons/content_lesson_6652_teacherGuide.htm Food Chains http://www.cheetah.co.za/resource/english/grade_4_lesson_4.pdf
16