Title: Effects of a Research-Based Intervention to Improve ...
68
Title: Effects of a Research-Based Intervention to Improve Seventh-Grade Students’ Proportional Problem Solving: A Cluster Randomized Trial This is a pre-copyedited, author-produced PDF of an article that has been published in the Journal of Educational Psychology following peer review. The version of record [citation information below] is available online at http://dx.doi.org/10.1037/edu0000039 Jitendra, A. K., Harwell, M. R., Dupuis, D. N., Karl, S. R., Lein, A. E., Simonson, G. & Slater, S. C. (2015). Effects of a research-based mathematics intervention to improve seventh-grade students’ proportional problem solving: A cluster randomized trial. Journal of Educational Psychology, 107, 1019-1034. doi: 10.1037/edu0000039 Asha K. Jitendra University of Minnesota Michael R. Harwell University of Minnesota Danielle N. Dupuis University of Minnesota Stacy R. Karl University of Minnesota Amy E. Lein University of Minnesota Gregory Simonson University of Minnesota Susan C. Slater University of Minnesota Authors’ Note The research reported here was supported by the Institute of Education Sciences, U.S. Department of Education, through Grant #R305A110358. The opinions expressed are those of the authors and do not represent views of the Institute of Education Sciences or the U.S. Department of Education. We gratefully acknowledge the efforts of all teachers and students who participated in the study. The first author of this paper is the primary author of the SBI intervention. However, to ensure objectivity of findings, all scoring, entry and data analysis were conducted by research assistants and methodologists, who do not have any interests that might be interpreted as influencing the research. The research assistants and methodologists independently reviewed the manuscript to ensure data analysis, findings, discussion, and interpretations were appropriate, accurate, and objective.
Transcript of Title: Effects of a Research-Based Intervention to Improve ...
Title: Effects of a Research-Based Intervention to Improve Seventh-Grade Students’ Proportional Problem Solving: A Cluster Randomized Trial
This is a pre-copyedited, author-produced PDF of an article that has been published in the Journal of Educational Psychology following peer review. The version of record [citation information below] is available online at http://dx.doi.org/10.1037/edu0000039
Jitendra, A. K., Harwell, M. R., Dupuis, D. N., Karl, S. R., Lein, A. E., Simonson, G. & Slater, S. C. (2015). Effects of a research-based mathematics intervention to improve seventh-grade students’ proportional problem solving: A cluster randomized trial. Journal of Educational Psychology, 107, 1019-1034. doi: 10.1037/edu0000039
Asha K. Jitendra University of Minnesota
Michael R. Harwell
University of Minnesota
Danielle N. Dupuis University of Minnesota
Stacy R. Karl
University of Minnesota
Amy E. Lein University of Minnesota
Gregory Simonson
University of Minnesota
Susan C. Slater University of Minnesota
Authors’ Note
The research reported here was supported by the Institute of Education Sciences, U.S. Department of Education, through Grant #R305A110358. The opinions expressed are those of the authors and do not represent views of the Institute of Education Sciences or the U.S. Department of Education. We gratefully acknowledge the efforts of all teachers and students who participated in the study. The first author of this paper is the primary author of the SBI intervention. However, to ensure objectivity of findings, all scoring, entry and data analysis were conducted by research assistants and methodologists, who do not have any interests that might be interpreted as influencing the research. The research assistants and methodologists independently reviewed the manuscript to ensure data analysis, findings, discussion, and interpretations were appropriate, accurate, and objective.
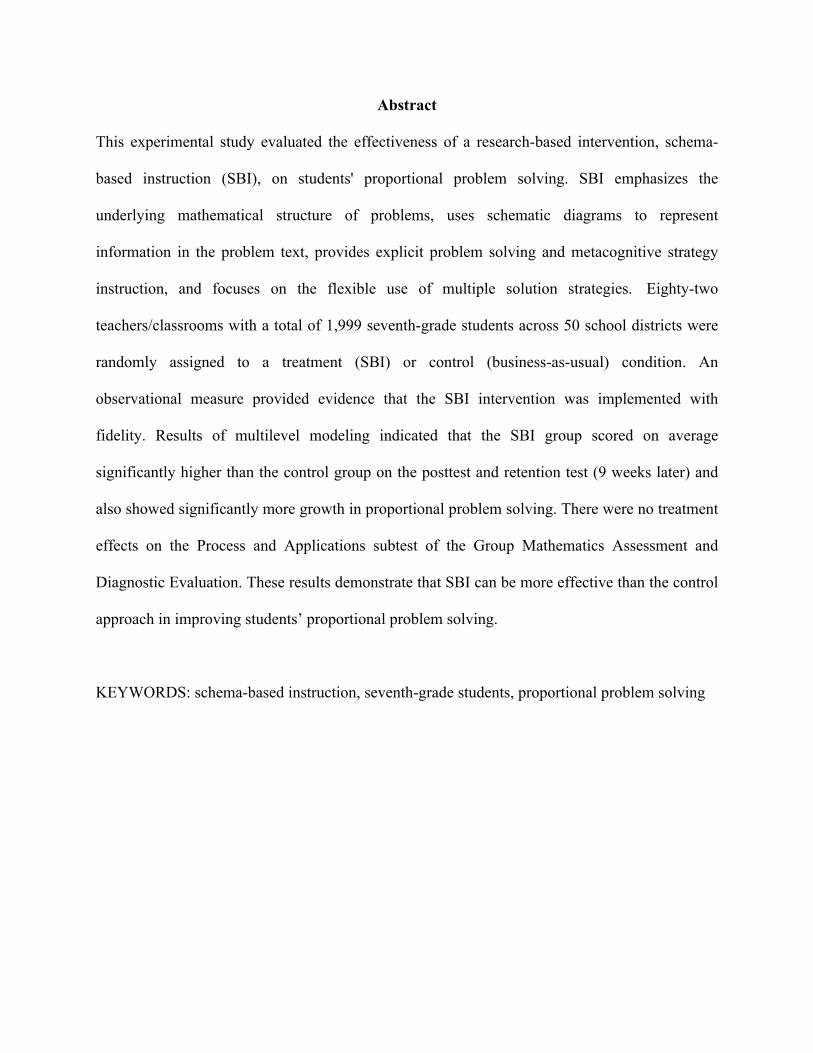
Abstract
This experimental study evaluated the effectiveness of a research-based intervention, schema-
based instruction (SBI), on students' proportional problem solving. SBI emphasizes the
underlying mathematical structure of problems, uses schematic diagrams to represent
information in the problem text, provides explicit problem solving and metacognitive strategy
instruction, and focuses on the flexible use of multiple solution strategies. Eighty-two
teachers/classrooms with a total of 1,999 seventh-grade students across 50 school districts were
randomly assigned to a treatment (SBI) or control (business-as-usual) condition. An
observational measure provided evidence that the SBI intervention was implemented with
fidelity. Results of multilevel modeling indicated that the SBI group scored on average
significantly higher than the control group on the posttest and retention test (9 weeks later) and
also showed significantly more growth in proportional problem solving. There were no treatment
effects on the Process and Applications subtest of the Group Mathematics Assessment and
Diagnostic Evaluation. These results demonstrate that SBI can be more effective than the control
approach in improving students’ proportional problem solving.
KEYWORDS: schema-based instruction, seventh-grade students, proportional problem solving
PROPORTIONAL PROBLEM SOLVING
3
Effects of a Research-Based Intervention to Improve Seventh-Grade Students’
Proportional Problem Solving: A Cluster Randomized Trial
There is considerable evidence that as children progress from the elementary grades into
middle school, the mathematical gains made in elementary school are not matched in later years
(e.g., National Mathematics Advisory Panel [NMAP], 2008). For example, on the 2013 National
Assessment of Educational Progress (NAEP), only 35% of U.S. eighth-grade students compared
to 42% of fourth-grade students were proficient or advanced in their knowledge of mathematics
(National Center for Education Statistics, 2013a). Although U.S. students’ mathematics scores
on international assessments have improved over the past decade, data from the Trends in
International Mathematics and Science Study (TIMSS) showed no measureable difference in
average U.S. mathematics scores at grade 8 in 2007 and in 2011 (Provasnik, Kastberg, Ferraro,
Lemanski, Roey, & Jenkins, 2012). Similarly, there were no significant changes in the average
performance of U.S. 15 year olds in mathematics between 2003 and 2012 on the Program for
International Student Assessment (PISA; Kelly, Xie, Nord, Jenkins, Chan, & Kastberg, 2013).
Despite having some of the highest per-pupil expenditures in the world, the percentage of U.S.
top performers was well below average in mathematics on the PISA, which includes tasks that
require well-developed thinking and reasoning skills. These findings are cause for concern given
an increasingly competitive job market, where the demand for mathematics intensive science and
engineering jobs are outpacing overall job growth three-to-one (NMAP, 2008). Clearly, the need
for identifying interventions that improve students’ mathematics skills is critical.
The goal of the present study was to test a research-based intervention, schema-based
instruction (SBI), designed to improve students’ proportional reasoning. Although the SBI
intervention was developed and used extensively to solve arithmetic word problems, recent work
PROPORTIONAL PROBLEM SOLVING
4
on SBI has focused on students’ development of proportional reasoning. Proportional reasoning
is of primary importance during the upper elementary and middle school grades (NMAP, 2008),
and is one of four critical mathematics topics at Grade 7 in the Common Core State Standards
(CCSS; National Governors Association Center for Best Practices & Council of Chief State
School Officers, 2010). In this introduction, we describe the importance of proportional
reasoning and introduce the theoretical framework for SBI. Then, we summarize prior research
evaluating the SBI intervention on problem solving, especially proportional reasoning, and close
with a discussion of how the present study extends the literature.
Proportional Reasoning
Proportional reasoning, which is fundamental to the productive growth of mathematical
reasoning, is considered key to progress in more advanced mathematics, including algebra
(Boyer, Levine, & Huttenlocher, 2008; NMAP, 2008). Proportional reasoning refers to the
understanding of
structural relationships among four quantities (say a, b, c, d) in a context
simultaneously involving covariance of quantities and invariance of ratios or
products; this would consist of the ability to discern a multiplicative relationship
between two quantities as well as the ability to extend the same relationship to
other pairs of quantities (Lamon, 2007, p. 638).
Many children and adolescents, as well as adults, are not proficient with fractions, ratios,
and proportions, which are essential concepts of proportional reasoning (Adjiage & Pluvinage,
2007; Fujimura, 2001; Lamon, 2007; Lobato, Ellis, Charles, & Zbiek, 2010; Miyakawa &
Winslow, 2009; NMAP, 2008; Tourniaire & Pulos, 1985). Much of the literature in mathematics
education indicates that young students’ difficulty with proportional reasoning is related to their
PROPORTIONAL PROBLEM SOLVING
5
development of multiplicative versus additive reasoning (Lamon, 1993, 1995; Thompson &
Thompson, 1994). Students often employ strategies (e.g., buildup or double counting process
strategy; calculating the value of one unit and then multiplying by that value to get the desired
amount; partitioning) without understanding the multiplicative nature of proportions or the
composite nature of ratios. Alternatively, they tend to use many erroneous strategies in solving
proportional reasoning tasks (e.g., focusing on nonmathematical reasons when comparing two
ratios, “ignoring part of the data in the problem, looking at ratios of differences between the
same variables” [the additive strategy]; Ozgun-Koca & Altay, 2009, p. 31).
Proportional reasoning is a complex concept that not only requires understanding the
concept of ratios and that two or more ratios are equal but also requires the ability to extract
relevant information to develop a representation of the problem situation (Al-Wattban, 2001).
Often, the topics of ratio and proportion are presented in the context of word problems. Solving
even simple proportion problems is challenging for students when they lack understanding of the
problem situation and whether a solution strategy is applicable (Weinberg, 2002). Not
surprisingly, many students require instruction that supports the development of underlying
concepts and flexible procedures to solve proportion problems (NMAP, 2008; Tourniaire &
Pulos, 1985).
Over time and with focused instruction in various linear functions in mathematics and
science, secondary school students may learn to reason proportionally. However, researchers
have documented another problem that tends to show up – students apply the notion of linearity
to most situations even when it is not applicable (Fernández, Llinares, Van Dooren, De Bock, &
Verschaffel, 2012; Van Dooren, De Bock, Evers, & Verschaffel, 2009; Van Dooren, De Bock,
Hessels, Janssens, & Verschaffel, 2005). It is this overreliance on linear methods, also referred to
PROPORTIONAL PROBLEM SOLVING
6
as the illusion of linearity, that affects students’ reasoning and problem solving in that they
typically do not distinguish proportional from non-proportional situations (e.g., Van Dooren et
al., 2005). The overuse of proportionality is often seen in classrooms that employ missing-value
proportional reasoning tasks and where the focus is on technically correct procedures (Van
Dooren, De Bock, Vleugels, & Verschaffel, 2010). As such, students tend to associate missing
value problems with proportional reasoning and solve them using algorithmic procedures (i.e.,
cross multiplication) without understanding why they are applicable (Van Dooren et al., 2010).
Although student difficulties with proportional thinking may be explained in part by ‘routine
expertise’ versus ‘adaptive expertise’ (see Hatano, 2003), the overuse of linearity may indicate a
lack of attention to the initial components of mathematical modeling – understanding the
problem and the relationship between the relevant elements in the problem to translate into a
mathematical model (see Verschaffel, Greer, & De Corte, 2000).
Although research on ratios and proportional relationships was prominent in the 1980s
and early 1990s (e.g., Behr, Wachsmuth, Post, & Lesh, 1984; Harel, Behr, Post, & Lesh, 1992;
Carpenter, Fennema, & Romberg, 1993), and scholars in mathematics education continued to
explore ways to improve students' learning of this important topic, previous intervention research
has been limited in several ways. First, most interventions (e.g., inquiry methods that encourage
students to construct knowledge of proportionality through collaborative problem solving
activities, use of pictorial representations or manipulative models) were short-term and did not
focus on the broad domain of ratios and proportional relationships (Adjiage & Pluvinage, 2007;
Fujimura, 2001; Myakawa & Winslow, 2009). Second, many of the studies used quasi-
experimental research designs or a teaching experiment (including lesson study, action research)
to evaluate the effectiveness of different approaches to the teaching and learning of proportional
PROPORTIONAL PROBLEM SOLVING
7
reasoning, limiting causal inferences. Third, these studies typically involved a limited number of
students or classrooms (Adjiage & Pluvinage, 2007; Fujimura, 2001; Myakawa & Winslow,
2009). Fourth, most of this research was conducted outside of the United States with non-English
speaking students (e.g., Adjiage & Pluvinage, 2007; Fujimura, 2001; Myakawa & Winslow,
2009; Ozgun-Koca & Altay, 2009); thus, the results of these studies may not generalize to
middle school students in the United States.
With the exception of a few studies that have tested the effectiveness of a comprehensive
curriculum package (e.g., Connected Mathematics Project; see Ben-Chaim, Fitzgerald,
Benedetto, & Miller, 1998), previous research using randomized studies with teachers in various
settings implementing the intervention with fidelity is sparse. The present study addressed these
limitations by using a randomized design with a relatively large sample of teachers to investigate
the effects of the SBI intervention, which incorporates key instructional practices identified in
policy reports and research articles (see Theoretical Framework section). Further, the content in
the current SBI intervention covered the CCSS content standards of ratios and proportional
relationships. Specifically, the focus was on proportional problem solving involving ratios/rates
and percents with the intervention helping students make sense of their reasoning related to
proportions.
Theoretical Framework
SBI’s theoretical framework is an elaboration of schema theory and is guided by
cognitive models of mathematical problem solving (Mayer, 1999). Our SBI intervention
integrates four major components; it includes a focus on the mathematical structure of problems,
use of visual representations, explicit problem solving and metacognitive strategy instruction,
and an emphasis on procedural flexibility. These components correspond with the
PROPORTIONAL PROBLEM SOLVING
8
recommendations articulated in the What Works Clearinghouse’s recent research synthesis on
improving students’ mathematical problem solving performance (Woodward et al., 2012) and
address the mathematical practices (e.g., look for and make use of structure, model with
mathematics) in the CCSS.
Focusing on the mathematical structure of proportion problems. Prior research has
found that providing students with problem categories and ways to place problems within
categories improves problem solving substantially (Chen, 1999; Quilici & Mayer, 1996, 2002).
Historically, there is strong evidence of the benefits of arithmetic word problem solving
instruction that teaches students to identify problems of a given type (i.e., change, combine,
compare) by focusing on the problem structure (e.g., Fuchs et al., 2008; Fuchs et al., 2010; Fuson
& Willis, 1989; Jitendra et al., 2007). In the current SBI intervention, we focused on a less well-
established typology of basic problem types on mathematical subtopics of ratio, proportion,
percent/percent of change within the broad domain of proportion. Recent research suggests that
focused instruction on identifying the problem structure of proportion problems is beneficial (see
Jitendra et al., 2009; Jitendra, Star, Dupuis, & Rodriguez, 2013; Jitendra, Star, Rodriguez,
Lindell, & Someki, 2011).
Using visual representations as mathematical tools. There is a growing body of
evidence that teaching students to model problems using representations (e.g., diagrams) to make
visible the underlying problem structure has a positive effect on students’ problem solving
performance (e.g., Fuchs et al., 2008; Fuson & Willis, 1989; Jitendra et al., 2007, 2009, 2011,
2013; Xin et al., 2011). It is important to teach students a few types of visual representations
(e.g., tables, graphs, diagrams) that effectively link the relationships between the relevant
quantities in the problem with the requisite mathematical operations needed to solve the problem
PROPORTIONAL PROBLEM SOLVING
9
and provide instruction on how to represent the problem using a visual representation
(Woodward et al., 2012). Our SBI intervention uses schematic diagrams that help students to
represent the mathematical information in problems.
Addressing problem solving and metacognitive strategy instruction. Research
suggests that effective instructional practices (e.g., “explicit teacher modeling and instruction,
guided questions, and efforts to engage students in conversations about their thinking and
problem solving,” Woodward et al., 2012, p. 7) to represent, analyze, and solve problems serve
to enrich the learning of mathematical concepts and notations and can have a direct effect on
students’ achievement. Furthermore, there is compelling evidence that metacognitive strategy
instruction, such as monitoring and reflecting during problem solving enhances students’
mathematical reasoning (Kramarski & Mevarech, 2003; Mevarech & Kramarski, 2003). Such
instruction helps “students think about what they are doing and why they are doing it, evaluate
the steps they are taking to solve the problem, and connect new concepts to what they already
know” (Woodward et al., 2012, p. 17). We included metacognitive instruction as a component of
problem solving instruction in the SBI intervention to teach students not only how to solve a
problem, but also how to monitor and reflect on their problem-solving processes.
Emphasizing procedural flexibility. Research supports the positive effects of teaching
and encouraging problem solvers to use a variety of strategies for solving problems (see
Woodward et al., 2012). Understanding when, how, and why to use a broad range of methods for
a given class of problems improves procedural knowledge (Star, 2005, 2007). Furthermore, there
is compelling evidence that instruction that supports using, sharing, comparing, and contrasting
multiple solution methods can improve students’ procedural flexibility (e.g., Star & Rittle-
PROPORTIONAL PROBLEM SOLVING
10
Johnson, 2008, 2009). In the current intervention, the emphasis was on solving problems in
different ways using appropriate methods.
Evaluation of SBI Intervention on Proportional Problem Solving
Only a few studies have conducted causal studies of the effects of the SBI intervention on
solving proportion problems involving ratios/rates and percents (Jitendra et al., 2009, 2011,
2013; Xin, Jitendra, Deatline-Buchman, 2005). Xin et al. developed and tested the effectiveness
of the SBI intervention with middle school students struggling in mathematics. The intervention
focused on teaching a limited set of topics – proportion and multiplicative compare word
problems – in 12 one-hour small group tutoring sessions. Using random assignment, scores on
researcher-developed measures showed that students in the SBI group on average outperformed
students in the control condition by d = 1.69 SD. The positive effects on proportional problem
solving attributed to SBI strengthened on a retention test (d = 2.53).
Using a more comprehensive coverage of topics that included ratios, equivalent ratios,
ratio word problems, rates, proportion word problems, scale drawing problems, Jitendra et al.
(2009) studied the effectiveness of the SBI intervention with seventh-grade students. Eight
seventh-grade classrooms were randomly assigned to SBI or a “business as usual” control
condition. Students in both conditions were instructed five times a week for 45 min over a 2-
week period. Compared to the control condition, students in the SBI group scored on average
significantly higher on proportional problem solving (d = 0.45) and maintained the effects on a
4-month retention test (d = 0.56).
To address limitations of the Jitendra et al. (2009) study, a follow-up study was designed
that targeted additional topics such as proportional problem solving involving percents, included
more classrooms (j = 21) across three schools in two suburban school districts, extended

PROPORTIONAL PROBLEM SOLVING
11
instructional time over a 6-week period, and provided longer professional development to
classroom teachers (Jitendra et al., 2011). Seventh-grade classrooms were randomly assigned to
SBI or control conditions, and results indicated that the posttest difference favoring the SBI
group was statistically significant for proportional problem solving (multilevel standardized
effect size = 0.32). However, the effects of SBI were not maintained on the retention test given a
month after the end of the intervention. The authors attributed this finding to a lack of power to
detect significant differences given the modest number of classrooms (j = 21).
Using a randomized design, Jitendra et al. (2013) conducted a rigorous replication of
Jitendra et al. (2011) that increased the sample size to include more classrooms (j = 42) across
more schools (k = 6) and reduced direct involvement of the research team. Fidelity of
implementation was assessed with videotaped sessions of both SBI and control classrooms. With
these methodological improvements, students in SBI classrooms on average outperformed
students in control classrooms on a measure of proportion problem solving at posttest (multilevel
standardized effect size = 0.36) and maintained their problem solving skills at 6 weeks follow-up
(multilevel standardized effect size = 0.29).
The Present Study
While previous studies have supported the efficacy of SBI, each of the evaluations
involved small to modest numbers of teachers (range = 6 to 42) and their students for a
geographically limited sample of schools (range = 1 to 6) that used a total of four different
mathematics programs. The research design in these studies consisted of randomly assigning
classrooms to SBI intervention or control (business as usual) conditions. Teachers with multiple
classrooms taught both SBI and control classrooms all of which were included in the study. In
the current study, we were interested in determining whether a similar implementation of SBI, as
PROPORTIONAL PROBLEM SOLVING
12
in Jitendra et al. (2013), would have comparable effects for a sample of greater geographic and
socioeconomic diversity of schools and students, and a larger number of teachers. Another
important feature of the study was eliminating the direct involvement of the research team in
supporting both SBI classroom implementation and test administration. Research team members
supported teachers primarily on logistical issues rather than the level of curriculum
implementation intensity provided in previous studies.
Additionally, we improved our study design by randomly assigning teachers to SBI or
control and then randomly selecting one of their classrooms to participate in the study, meaning
that each teacher in the current study taught in a SBI or control classroom but not both. By
implementing SBI in 50 school districts across a state in the upper Midwest reflecting urban,
suburban, and rural school settings we also assessed whether the efficacy of SBI would hold
when control classrooms used increasingly diverse mathematics programs. Another purpose of
this study was to document the effects of SBI on proportional problem solving related to student
background variables like socioeconomic status or sex.
We had three specific research questions. Our first research question examined whether
SBI leads to improved proportional problem solving performance compared to a business-as-
usual instruction control group and whether students’ proportional problem solving skills would
be maintained 9 weeks after the termination of the intervention. Based on previous research, we
hypothesized that SBI would on average increase student understanding of proportional
reasoning compared to a control group (e.g., Jitendra et al., 2009, 2011, 2013).
The second research question examined whether SBI results in increased achievement
compared to a control group on overall mathematical problem solving performance after a
focused period of time spent on ratios and proportional relationships. We used a norm-referenced
PROPORTIONAL PROBLEM SOLVING
13
standardized test that measures application of mathematics concepts in multiple content areas
(e.g., number, data analysis, geometry) to examine overall problem solving achievement and
what students might be expected to know during the entire year. Given that 67% of the items on
this test are based on concepts not taught in the study, we hypothesized that students’ overall
problem-solving achievement in the two groups would be comparable.
The third research question we tested was whether SBI and teacher-classroom
characteristics moderate the effects of student-level background variables (e.g., socioeconomic
status, sex) on mathematical problem solving. We hypothesized that treatment classrooms would
be associated with weaker relationships between background variables and understanding
proportional reasoning, compared to control classrooms, which would provide evidence of the
moderating effect of SBI.
Method
Setting and Sample
Middle school math teachers in an upper Midwest state who taught a typical seventh-
grade math class (approximately 600) were invited to participate in the study. Of those, a total of
82 seventh-grade math teachers from 58 middle schools across 50 districts volunteered to
participate in the study. Student enrollment in the 50 districts ranged from 115 to 37,864
students, with an average enrollment of 1,698 students. Of the 50 districts, 38 (76%) were
located in rural settings, eight (16%) in suburban settings, and four (8%) in urban settings. The
percent of minority students in the districts ranged from 0 to 76% with an average of 34%; the
percent of students eligible for free or reduced price lunch in districts ranged from 15 to 73%
with an average of 52%. Student and teacher participant information is provided in the following
sections.
PROPORTIONAL PROBLEM SOLVING
14
Students. The sample consisted of 1,999 seventh-grade students; the majority of students
were White (77%), with 9% Black, 7% Hispanic, 6% Asian, and 1% American Indian. Due to
data analysis difficulties linked to small sample sizes and the presence of missing data, the n = 18
American Indian students were removed; as such, the student sample used for the present
analyses consisted of 1,981 students (fewer in some analyses because of missing data). The mean
age of these students was 12 years, 8 months (SD = 4 months). Approximately 40% of the total
sample of students was eligible for a free or reduced price lunch, 10% received special education
services, and 6% were English language learners (see Table 1 for student demographic
information).
Teachers. The 82 participating seventh-grade mathematics teachers’ mean years of
experience teaching mathematics was 11.9 (SD = 6.4, range 1 to 34 years). All teachers were
certified to teach mathematics; 6% were also certified to teach science, 15% were certified in
subjects other than mathematics or science, and 36% were certified in all subjects (generalist).
Similarly, all teachers were certified to teach grades 6-8; in addition, 55% were also certified to
teach grades 9-12 and 45% to teach grades K-5. Virtually all of the teachers were White (j = 79),
with one Hispanic, Asian, and American Indian teacher. Sixty-seven percent of teachers were
female (see Table 1 for teacher demographic information). Forty six (56.1%) teachers taught in
schools classified as located in a rural setting, 27 (32.9%) in a suburban setting, and 9 (11%) in
an urban setting.
Study Design
We used a prospective randomized cluster design with longitudinal (pretest, posttest,
delayed posttest) data in which teachers/classrooms served as clusters. If properly implemented,
this design ensures that estimated treatment effects are unbiased (Bloom, Richburg-Hayes, &
PROPORTIONAL PROBLEM SOLVING
15
Black, 2007). Initially, one class of students for each of the 82 teachers was randomly selected
to participate in the study. Then, each of the 82 teachers and their participating class (cluster)
was randomly assigned to one of two conditions: treatment (j = 40) or control (j = 42). The
unequal number of teachers/classrooms was due to one teacher originally assigned to the
treatment condition being subsequently moved to the control condition for logistical reasons.
Immediately following random assignment one teacher indicated that she could not attend PD,
which precluded her from being a treatment teacher. The teacher was moved to the control
condition before the PD training. As such, the change in assignment could not have affected
the teacher's fidelity implementation, which was more similar to the control condition.
An a priori power and sample size analysis using the Optimal Design software (Spybrook
et al., 2011) was performed that focused on testing the SBI vs. control effect for cross-sectional
data needed to answer the research questions. The results indicated that 82 clusters and 1,900
students would allow us to detect a standardized effect of .30 (a moderately small effect
following Cohen, 1988) for the SBI vs. control comparison, with a power of .80 for an intra-
class-correlation of .19 taken from Hedges and Hedberg (2007) for seventh grade mathematics
data, and a power of .95 under the same conditions for a standardized effect of .40.
Treatment Instruction
Treatment teachers participated in 16 hours of professional development (see
Professional Development section) in mid-December, followed by delivering the SBI
intervention five days a week across six weeks between January and February. Teachers replaced
the lessons on ratio/proportion and percent in their curriculum with the SBI lessons.
SBI intervention. The SBI program content consisted of two replacement units, one
focusing on Ratio/Proportion and the other on Percent. Each unit comprised ten 50-min lessons
PROPORTIONAL PROBLEM SOLVING
16
with an additional lesson at the end of the second unit that provided practice on solving problems
related to ratio, proportion, and percent. The SBI program was aligned with the state
mathematics standards and covered the same content taught in seventh-grade classrooms (for
further details about the content of SBI see Jitendra et al., 2011). SBI teachers were provided
with (a) a detailed teacher guide that we developed as a resource to fully understand program
features, along with teaching materials (e.g., visual diagrams and problem solving checklists) and
student materials (i.e., workbook and homework book) to support implementation of activities to
develop critical concepts and skills, and (b) professional development to help teachers use the
lessons. The SBI intervention and professional development are described in greater detail next.
SBI’s instructional approach was designed to include four instructional practices: (1)
explicitly modeling problem solving and metacognitive strategies, (2) activating the
mathematical structure of problems, (3) visually mapping information in the problem using
schematic diagrams (see Figure 1), and (4) developing procedural flexibility. With these four
practices, teachers initially modeled problem solving by thinking aloud (see Appendix A, sample
excerpt of the script for solving a problem in Lesson 11 located in the online supplemental
materials) and gradually shifted responsibility to the students by scaffolding instruction using
teacher-student dialogues to help clarify and refine their thinking (see Appendix A, sample
excerpt of the script for percent of change problem solving in Lesson 14 located in the online
supplemental materials).
The aim of the first practice was to promote mathematical problem solving and
metacognition on the basis of extensive modeling and scaffolding by the teachers. Using a four-
step problem solving strategy, represented by the acronym DISC (Discover the problem type,
Identify information in the problem to represent in a diagram, Solve the problem, Check the
PROPORTIONAL PROBLEM SOLVING
17
solution), teachers first focused on activating the mathematical structure of the problem (second
practice). Through classroom discussions and by answering deep-level questions, teachers
encouraged students to identify the type of problem (i.e., ratio, proportion, or percent) by
reading, retelling, and examining information in the problem as well as thinking about how
problems within and across types are similar or different. For example, students learned that ratio
and proportion problems are similar because they both involve a multiplicative comparison of
two quantities and are different in that ratio problems are confined to a single situation, whereas
proportion problems describe a statement of equality between two ratios/rates that allows one to
think about the ways that the two situations are the same.
Second, students learned to connect the problem to a certain schematic diagram and used
the appropriate diagram to represent the problem such that the visual mapping showed the
relevant elements, relations and conditions embedded in the problem (third practice).
Specifically, instruction focused on identifying information critical to solving the problem to
represent using the schematic diagram. Through careful instruction, students also reasoned why
the same ratio schematic diagram can be used to represent information in both ratio and percent
problems (a percent is a special type of ratio). With further instruction, students understand that
while ratio diagrams work well for some percent of change problems to represent the relation
between the change amount and original amount, more complex percent of change problems
(including simple interest) require the use of diagrams that depict both multiplicative and
additive relationships (see Percent of Change diagram in Figure 1).
Third, students estimated an answer, made decisions about what method (equivalent
fractions, unit rate, cross multiplication) to use to solve the problem (fourth practice), and solved
the problem. With explicit instruction on multiple solution methods for solving proportion
PROPORTIONAL PROBLEM SOLVING
18
problems, the goal of such instruction was to have students become cognizant of specific
methods that are more efficient than others and select the strategy that is most efficient based on
the numbers in the problem.
Finally, teachers encouraged students to use their estimated answer from the previous
step in evaluating their work to determine whether the answer made sense. At each stage in the
problem-solving process, teachers used prompts or deep-level questions to encourage students to
monitor and reflect while solving a problem. For example, prompts were used to ensure that
students (a) understand and identify the problem type (e.g., Why is this a proportion problem?
How is this problem similar to or different from one I already solved?), (b) identify and represent
the critical information in the problem using an appropriate diagram (e.g., Which diagram is best
to represent information in the problem?), (c) select a strategy to solve the problem (e.g., Which
solution method would best help me solve this problem?), and (d) check the solution (e.g., Is the
answer reasonable based on my estimate?).
Professional development. The goal of the two-day professional development provided
by one of the authors of the SBI program was to support teachers’ learning and implementation
of SBI, as well as to provide training in implementing the new approach and assessments
faithfully. In the first training session, teachers were introduced to the project and key features of
the SBI intervention (e.g., recognizing problem types, generating estimates, knowing multiple
strategies) to support student learning of ratio, proportion and percent. Teachers practiced with
SBI techniques and materials to sort problems by type of problem, use schematic diagrams to
represent information in the problem, generate “ballpark” estimates (i.e., quick and easy based
on benchmark numbers and fractions), and select an appropriate solution method from among
several strategies to solve problems.
PROPORTIONAL PROBLEM SOLVING
19
The second training session gave teachers an opportunity to review the two curricular
units on ratios/rates and percent along with associated materials and to learn about implementing
the intervention. Throughout the training, the focus was on developing students’ proportional
reasoning with the SBI intervention. Teachers viewed multiple short video segments of teachers
from a previous study to illustrate the implementation of the intervention, with the focus on
eliciting student discussion. The video segments provided an opportunity to address the
importance of implementing SBI intervention faithfully without the need to read the teacher
guide while teaching. In addition, the training emphasized the importance of treatment teachers
not sharing project materials or strategies with any control group teachers in their building.
“Business as usual” control instruction. Students in the control condition were taught
the topics of ratio, proportion, and percent using their district-adopted textbooks in the same time
period as the treatment condition. We gathered information on textbooks used in the control
classrooms from a written teacher questionnaire in which teachers listed the mathematics
textbooks they used and a review of lessons on ratio/proportion and percent topics sampled from
the textbooks. Overall, teachers in the control classrooms used traditional resources that
consisted of 10 different textbooks published from 2001 to 2012 by one of three publishers:
Houghton, Mifflin, Harcourt; Glencoe/McGraw Hill; Pearson Education. These textbooks were
examined for the presence of the core instructional components of SBI (i.e., identifying the
problem type, visual representations, modeling of problem solving and metacognitive strategies,
multiple solution strategies).
Several control textbooks included instructional components such as the use of visuals,
problem solving procedures, and multiple solution strategies. For example, all of the control
textbooks included various visual representations (e.g., pie graphs, percent bar graphs, strip

PROPORTIONAL PROBLEM SOLVING
20
diagrams). However, none provided instructions to activate the mathematical problem structure
using the visuals. Although about one-half of the control curricula also incorporated problem-
solving instruction (e.g., “use a table to set up a proportion, write a proportion, multiply each
side by 100, simplify;” Larson, Boswell, Kanold, & Stiff, 2007, p. 348), the emphasis was more
on problem solution procedures and less on problem comprehension. Metacognition, when
included in the textbooks, was not explicitly targeted for instruction (e.g., reflect using a math
journal). Approximately one-third of the control textbooks encouraged the use of various
solution strategies (e.g., recognizing that there is more than one way to solve a proportion
problem); however, none emphasized the selection of the most efficient strategy based on the
relationships between the numbers in the problem. In short, our review of control classroom texts
suggested that the instructional components covered do not overlap with those in treatment
classrooms in ways that would distort estimates of the effects of SBI. To assess the impact of
different curricula used in control classrooms we performed analyses comparing the proportional
problem-solving (PPS) and Group Mathematics Assessment and Diagnostic Evaluation
(GMADE) test scores of control students as a function of the curriculum they experienced.
Measures
Proportional problem-solving (PPS) test. We assessed students’ proportional problem
solving performance using the PPS test, which we developed using released items related to the
topics of ratio, proportion, and percent from NAEP and TIMSS as well as questions from past
state mathematics assessments (see sample items in Appendix B located in the online
supplemental materials). The same test was used for pretest, posttest, and delayed posttest. The
delayed posttest was given 9 weeks after the end of the intervention. The PPS test included
PROPORTIONAL PROBLEM SOLVING
21
multiple-choice items and short-response items that addressed the general program content of
ratio/proportion and percent.
The 23 multiple-choice items were dichotomously scored. We scored the four short-
response items on the PPS test using a rubric, which emphasized correct reasoning; responses
were scored on a 0-to-2 point scale. Students’ scores on the PPS test were calculated by taking
the sum of their points earned (total possible points equaled 31), which means that the short-
response and multiple-choice items were unequally weighted.
To score the short-response items, we developed a rubric based on a sample of student
responses from a previous study using the same measure (Jitendra et al., 2013). Next, all raters
participated in training that involved scoring several sample student responses until at least 90%
agreement between raters was reached. The pretest, posttest, and delayed posttest short-response
items were scored by one of several project staff members who were blind to the student group.
To assess the degree of inter-rater consistency a different rater scored 33% of the short-response
items, producing intra-class correlations 0.85, 0.91, and 0.89 at pretest, posttest, and delayed
posttest, respectively.
To assess the reliability of the PPS test we followed recommended practice (Dunn,
Baguley, & Brunsden, 2013) and performed separate analyses for the pretest, posttest, and
delayed posttests using the jMetrik software (Meyer, 2007). jMetrik is a comprehensive item
analysis software package that assist users in identifying the measurement model that best
captures patterns in the item responses, and provides a range of useful statistics such as reliability
coefficients. The jMetrik software identified the congeneric measurement model as providing the
best fit to the PPS item responses (RMSEA values £ .03; GFI values ³ .97), and we report the
(omega) reliability coefficient associated with this model.
PROPORTIONAL PROBLEM SOLVING
22
A congeneric measurement model assumes a single continuous latent factor underlies (in
our case) the dichotomous- and trichotomously-scored PPS items but places fewer assumptions
on the data than other models, such as that assumed to underlie the traditional alpha coefficient
of reliability (McDonald, 1999). Specifically, in a factor-analytic framework the congeneric
model allows item loadings to vary and tends to produce unbiased (or less biased) estimates of
reliability compared to the traditional alpha reliability coefficient, especially if item response
formats vary (McDonald, 1999) as is the case with the PPS. The omega reliability coefficient
associated with the congeneric model represents a ratio of the estimated true score variance to
observed score variance obtained from a factor analysis and thus has values between 0 and 1,
with higher values indicating greater reliability (Dunn et al., 2014; Revelle & Zinberg, 2009).
For the PPS pretest, posttest, and delayed posttest the estimated omega reliabilities were 0.69,
0.77, and 0.76, respectively. Because omega can be interpreted like the traditional alpha
coefficient of reliability in that values closer to one signal less measurement error, the PPS
reliabilities indicate moderate reliability (Nunnally, 1978, p. 245). We recognize that reliabilities
in this range may be deemed inadequate by some researchers. However, it is important to
emphasize that we found statistically significant treatment effects for the PPS posttests (see
below) despite the random measurement error linked to these reliabilities. Thus, while
the reliabilities for the PPS were somewhat smaller than desired they did not compromise our
ability to detect treatment effects.
Group Mathematics Assessment and Diagnostic Evaluation (GMADE). We used the
Process and Applications subtest of the GMADE (Pearson, 2004), Level M, Form A, a norm-
referenced standardized assessment, at both the pretest and posttest to assess students’ overall
mathematics problem solving performance. The construction and validation of this test was
PROPORTIONAL PROBLEM SOLVING
23
informed by the Principles and Standards for School Mathematics of the National Council of
Teachers of Mathematics (NCTM, 2000). The Process and Applications subtest specifically
measures students’ ability to comprehend mathematical language and concepts and apply
relevant operations to solve word problems across multiple content areas (e.g., algebra,
geometry, number and operations). This allowed us to examine student performance on a general
measure of problem solving rather than only on ratio/rates and percent problem solving. The
Process and Applications subtest includes 30 multiple-choice items that require students to read a
short passage of one or more sentences and choose the best of four possible answers, in which
choices included numbers, pictures, or symbols (Williams, 2004). Some items also included
multiple-step problems and Process Problems that require identifying a process (e.g., reasoning)
or application to derive the answer. A Process Problem is one that does not require students to
solve the problem, but has them think about the process for solving it. For example, students
would be presented with a problem and asked a process question such as, “What is the
appropriate first step to solve the following problem?” (Pearson, 2004, p. 22).
All items were scored as correct or incorrect. Once again the congeneric model best fit
the item data, with coefficient omega reliabilities for the pretest and posttest of 0.61 and 0.69.
The PPS and GMADE assessments were group-administered in classrooms by the
classroom teacher following standardized protocols. Both tests were untimed, but each test could
be completed in 50 minutes on average. All students were administered the pretests in December
of the school year and posttests during the week following the last day of the intervention, with
the PPS test also administered nine weeks later.
Fidelity of implementation. To document and measure fidelity of implementation, we
developed two measures based on guidelines proposed by O’Donnell (2008) that addressed
PROPORTIONAL PROBLEM SOLVING
24
procedural fidelity and adherence to the SBI intervention (Dane & Schneider, 1998) as well as
overall quality of instruction in treatment and control classrooms based on attributes of effective
teaching. Fidelity of implementation and quality of instruction information was generated by
videotaping an entire lesson on proportion problem solving for each teacher during the 6 weeks
of the study. We selected proportion problem solving lessons to ensure that the observed tasks
incorporated the core features that were targeted for evaluation. We assessed procedural fidelity
and adherence by observing videotaped lessons using a checklist developed to document the
presence of the core features of the SBI intervention. The same checklist was also used in the
control condition to evaluate program differentiation and determine whether control teachers
spontaneously provided instruction that was similar to the key elements of SBI (Dane &
Schneider, 1998). For each lesson, raters completed seven items evaluating whether teachers
completed all components corresponding to the four SBI instructional practices and whether they
were fluent in facilitating student thinking. The seven items were: (a) identifies the problem type
by focusing on the key problem features, (b) connects the new problem to previously solved
problems, (c) represents critical information in the problem text using an appropriate diagram,
(d) generates an estimate prior to solving the problem, (e) discusses multiple solution strategies,
(f) solves the problem and presents the solution within the context of the problem, and (g)
evaluates the solution.
Procedural fidelity items were coded on a 0-to-3 scale (3 = high level of implementation
– 0 = did not implement). The coding scheme for the fidelity measure was developed by one of
the authors in consultation with the first author (the SBI program developer), with the measure
finalized after multiple rounds of independent video coding by six coders, discussion, and re-
operationalization of the codes. During coder training a benchmark of 90% agreement on
PROPORTIONAL PROBLEM SOLVING
25
applying codes was treated as adequate. Fidelity was independently assessed for each classroom
video by two coders, producing a total of 160 codings (i.e., two per classroom). We were not
able to record two control classroom teachers because of scheduling conflicts. Disagreements in
coding were resolved through discussion and review of the videotapes. Inter-rater reliability was
estimated by computing intra-class correlations for the coder ratings and averaged 0.98 across
the seven items (range 0.97 to 0.99).
The overall quality of instruction was assessed using four items that focused on features
such as the teacher’s ability to clarify the lesson purpose, provide lesson closure, manage
instructional time (i.e., how well the teacher managed student behavior), and minimize
mathematical errors. The items were evaluated on the same 0-to-3 scale as the fidelity measure,
and inter-rater reliability for the coder ratings averaged 0.99 across the four items (range 0.96 to
1.00).
Data Analysis
Descriptive statistics for the measures by treatment are presented in Table 3. We also
compared the scores of control students on the PPS and GMADE assessments as a function of
the mathematics curriculum they experienced; nonsignificant results imply that the control
curricula did not differentially affect student PPS and GMADE scores and strengthen arguments
for pooling control classrooms.
To assess differences between the treatment and control classrooms we fitted a series of
multilevel (i.e., two-level, students within clusters) models with covariates at both levels using
the HLM 6 software (Raudenbush, Bryk, & Congdon, 2004). Adjusting the data for control
variables can account for variation that otherwise remains unexplained and improve estimation
and statistical power (Bloom et al., 2007). The outcome variables included in the analyses were
PROPORTIONAL PROBLEM SOLVING
26
the PPS posttest, PPS delayed posttest, and GMADE posttest, which were analyzed separately.
We also performed an ancillary analysis of the PPS longitudinal data to explore student change
over time and whether such change was impacted by the treatment.
For each outcome, the Level 1 (student) model contained three covariates: pretest score,
sex (1 = males, 0 = females), and race (Black = 1, Hispanic = 1, and Asian = 1, White = 0 so the
latter served as the reference group). All Level 1 covariates were grand-mean centered.
Level 2 variables included the treatment variable (1 = SBI, 0 = control), five teacher
covariates (i.e., number of post-secondary mathematics courses taken, number of post-secondary
education courses taken, years of teaching experience in mathematics, number of PD hours in
mathematics or mathematics education in the last year, sex), and variables capturing the
percentage of limited English proficiency (LEP), eligible for free or reduced price lunch (FRL),
and students receiving special education services per classroom or teacher. Given that there was
little or no variation in classrooms with regard to the sample characteristics such as LEP, FRL,
and special education (e.g., one-half of the classrooms had no LEP students) and thus
compromised estimation of model parameters within each classroom, we decided to aggregate
these variables to the classroom level (e.g., %LEP students in a classroom). Because the
distributions of the percentages were ragged and discontinuous we rescaled these variables to
quintiles and used the rescaled versions as Level 2 covariates.
Slopes capturing the impact of student variables (e.g., sex) on the outcome variables were
found to be statistically equal across classrooms (i.e., variance = 0). Thus models examining the
impact of treatment on Level 1 relationships were not fitted, and in what follows the results are
based on intercepts-only models.
PROPORTIONAL PROBLEM SOLVING
27
We examined the data for evidence that model assumptions were satisfied for all
analyses, and no major violations were found for any of the models. To control for compounding
of Type I error rates several methods are available. We used the Dunn-Bonferroni correction
(Miller, 1966) in which an overall (i.e., experimentwise) Type I error rate (e.g., α = .15) is
divided among all statistical tests linked to each outcome variable with no requirement that the
error rate be divided equally. Accordingly, we assigned .05 to the test of the treatment effect
because this was the most important effect in the model and divided the remaining .10 among
tests of the remaining fixed effects, producing .10' .007114
a = = . Also, for both descriptive and
inferential analyses we used all available data, which means that sample sizes vary across
analyses depending on attrition patterns (missing data).
Attrition analysis. An examination of missing data indicated that it centered on student
variables and that for all outcomes, except the PPS delayed posttest, attrition was less than 5%.
Importantly, attrition was approximately equal in the treatment and control groups. For the PPS
delayed posttest, 6.8% of students had missing data because the test was not administered in two
control classrooms due to end of the school year time constraints. The percentages of missing
data for all student-level covariates were below 5%.
Small percentages of missing data are unlikely to bias findings if the percentages are
similar across groups (Peng, Harwell, Liou, & Ehman, 2006), but as a sensitivity analysis we
also fitted each of the final HLM models to the student sample that provided complete data (no
missing data) and compared the results to those obtained using all available data (some missing
data). The results of these models did not differ in any significant way, suggesting that our
models were insensitive to the presence of missing data. As such, we used all available data for
each analysis meaning that student sample sizes for each analysis varied.
PROPORTIONAL PROBLEM SOLVING
28
Results
Descriptive Results
We initially performed a series of descriptive analyses that included examining the
correlations between all measures and exploring pre-existing differences between the SBI and
control group students. Results of the correlational analyses showed that the correlations between
the PPS pretest and posttest, pretest and delayed posttest, and posttest and delayed posttest were
0.65, 0.64, and 0.75, respectively. For example, the PPS pretest/posttest correlation of 0.65
means that students who scored above (or below) the pretest mean also tended to score above
(below) the posttest mean; equivalently, 2(.65) = .422 means that 42.2% of the variation in the
posttest can be predicted from variation in the pretest. The correlation between the GMADE
pretest and posttest was 0.54. Correlations between the PPS and the GMADE tests ranged from
0.51 to 0.61 across time points.
We also computed descriptive statistics to check whether the SBI intervention was on
average implemented with fidelity. Table 2 displays both fidelity and quality of instruction data.
We conducted t-tests to test group differences on both the fidelity and quality of instruction data
and used the Dunn-Bonferroni correction to control for compounding of Type 1 error. With
regard to the fidelity of implementation, the mean total score across the seven items on the
fidelity checklist was 14.33 (SD = 3.86) for treatment teachers and 7.43 (SD = 3.00) for control
teachers out of a possible 21 points (higher scores are consistent with greater fidelity). Results
indicated statistically significant and fairly substantial differences between the treatment and
control groups on the total score and all individual items except for item 6 (i.e., solves the
problem and presents the solution within the context of the problem), with treatment teachers
implementing SBI elements more than control teachers. For example, the effect size of 1.34 for
PROPORTIONAL PROBLEM SOLVING
29
“Identifies Problem Type” means that on average SBI classrooms were rated 1.34 SD above
control classrooms, or, equivalently, 91% of SBI classrooms were rated higher than the average
control classroom rating on this item (Lipsey et al, 2012).
With regard to quality of instruction, we expected to observe general teacher behaviors
(e.g., clarifies lesson purpose, minimizes mathematical errors) in both treatment and control
classrooms. The results indicate that, on average, both treatment (M = 9.50) and control (M =
9.28) teachers were rated similarly on these behaviors, t(78) = 0.66, p = .507, indicating that on
average there were no differences between the groups in terms of quality of instruction. These
data (fidelity and quality of instruction) allowed us to investigate program differentiation (Dane
& Schneider, 1998) in that there were clear differences in SBI instructional elements across the
two groups, whereas the general quality of instruction was similar in both conditions.
Table 3 reports means and SDs for the treatment and control groups for each measure.
Differences between the treatment and control groups on the GMADE pretest were not
statistically significant, whereas the difference on the PPS pretest was d = -0.10 SD, which would
be statistically significant at a= .05 given the large sample of students. It is not clear what the
source of this difference is but the inclusion of this variable as a covariate in the multilevel
analyses means the outcomes will be adjusted for this difference.
Last, we fitted two-level (students-within-classrooms) multilevel models using only
control classrooms with curriculum dummy-coded to the PPS total, ratio/proportion, and percent
posttest and delayed posttest outcomes, along with the GMADE outcome. None of these results
was statistically significant implying that for the outcomes we studied the particular curriculum
used in a control classroom produced a similar impact, providing empirical evidence for pooling
control classrooms.
PROPORTIONAL PROBLEM SOLVING
30
Treatment Effects on Proportional Problem Solving
The first research question asked whether SBI leads to improved proportional problem
solving performance compared to business-as-usual instruction, and whether students’
proportional problem solving skills would be maintained 9 weeks after the termination of the
intervention
PPS posttests. To estimate the intraclass correlation (ICC) we fitted unconditional two-
level (students within teachers/classrooms) models separately to the PPS posttest and delayed
posttest. The ICC was .21 (p < .001) for the posttest and .18 (p < .001) for the delayed posttest,
indicating that 21% and 18% of the variance in these tests was between classrooms. These values
are consistent with those for mathematics data reported by Hedges and Hedberg (2007) as typical
in education. Next we fitted a model with student background variables and the PPS pretest at
Level 1, and teacher covariates plus the treatment at Level 2.
The results for the PPS posttest indicated that treatment was a statistically significant
predictor of PPS posttest scores, with SBI classrooms outperforming control classrooms on
average, γ01 = 1.70, t(72) = 5.38, p < .001. The standardized effect size for the treatment effect
was 0.46 SD, meaning that approximately 68% of treatment classrooms scored above the mean
of control classrooms (Lipsey et al., 2012); alternatively, the proportion of classroom intercept
variance explained by the addition of the treatment variable above and beyond that attributable to
other predictors in the model was 35%.
In addition, the Black and pretest variables were statistically significant predictors of PPS
posttest. The results indicated that Black students scored on average lower than White students,
γ30 = -1.06, t(1799) = -3.23, p = .002. For the PPS pretest the results indicated that this variable
was a significant predictor of the posttest, γ80 = 0.68, t(1799) = 27.64, p < .001 (see Table 4).

PROPORTIONAL PROBLEM SOLVING
31
The results for the PPS delayed posttest indicated that the treatment variable was a
statistically significant predictor of delayed posttest scores, with SBI classrooms outperforming
control classrooms, γ01 = 1.22, t(70) = 4.17 (p < .001), with a standardized effect = 0.32 SD
indicating that approximately 62% of treatment classrooms scored above the mean for control
classrooms. Treatment also accounted for 32% of the between-classroom intercept variance
above and beyond that attributable to other predictors in the model. The full set of HLM results
for the PPS delayed posttest can be found in Table 5.
Ancillary analysis of PPS longitudinal data. We also explored the impact of SBI on
students’ growth using the PPS data by fitting a three-level (repeated measures within students
within classrooms) model. The average PPS score at pretest was 14.0 (p < .001) and the average
linear slope over time was 0.78 (p < .001), the latter indicating that student scores on average
increased over time. The results indicated that the treatment variable was a statistically
significant predictor of student linear growth, with SBI students having steeper learning
trajectories than control students, 101g = 0.63, t(72) = 4.86, p < .001, suggesting that SBI was
associated with greater growth in learning over time than the control condition.
Treatment Effect on Mathematical Problem Solving (GMADE)
The second research question examined whether SBI results in improved overall
mathematical problem solving performance compared to business-as-usual instruction. The ICC
for the GMADE posttest was .20 (p < .001), indicating that 20% of the variance in the posttest
was between classrooms. Results of the fitted model for the GMADE posttest indicated that
treatment was not a significant predictor of the GMADE posttest, and that the Hispanic and
pretest variables were the only statistically significant Level 1 predictors. In addition, the results

PROPORTIONAL PROBLEM SOLVING
32
indicated that teachers’ years of experience was a significant predictor of the GMADE posttest,
γ02 = 0.07, t(72) = 3.37, p = .002 (see Table 6).
Moderating Effects of SBI
The third research question examined whether SBI and teacher-classroom characteristics
moderated the effect of student-level background variables on mathematical problem solving. To
address this research question, we fitted a model to each outcome where the Level 1 slopes
associated with the student demographic variables (e.g., sex) were allowed to vary. The results of
these analyses indicated no statistically significant between- classroom variance in Level 1
slopes for any of the outcomes (all p > .01), indicating that SBI and teacher-classroom
characteristics did not moderate the effect of student-level background variables on mathematical
problem solving.
Discussion
The main purpose of this study was to measure the efficacy of the SBI intervention. SBI
represents a promising approach for improving students’ problem solving performance based on
previous research (Jitendra et al., 2009, 2011, 2013), and was extended in the current study to a
larger number of teachers and students in middle schools that included rural, suburban, and urban
locations, and to a setting in which the level of support to teachers implementing the intervention
was removed. The first research question examined the effect of SBI on the proportional problem
solving performance of seventh-grade students, and whether the effect of SBI was maintained 9
weeks after its termination. Compared to the control condition, the SBI intervention had a
significant positive effect on the PPS posttest and PPS delayed posttest (i.e., the proportion of
between-classroom intercept variance attributable to the PPS posttest and delayed posttest effects
were 35% and 32%).
PROPORTIONAL PROBLEM SOLVING
33
Results of our longitudinal analysis showed that students in the treatment group
demonstrated significantly more growth on the PPS relative to students in the control classrooms.
These positive findings are notable because the control condition covered approximately the
same instructional topics as SBI and thus had the same advantage on the PPS assessment, which
assessed proportional reasoning.
The effects of the SBI intervention are not only statistically significant, but also are
substantively important (see What Works Clearinghouse, 2014). These results confirm findings
from previous evaluation studies of the SBI intervention (Jitendra et al., 2009, 2011, 2013) and
are noteworthy when we consider that the present study design was more rigorous (i.e., random
assignment of teachers to the treatment and control groups), involved a greater number of
teachers and students in more diverse locations, and that research staff were not present in
classrooms to provide instructional support to teachers, as in previous studies. Our results also
provide support for the efficacy of the SBI intervention in not only improving student learning
with regard to proportional problem solving, but also the retention of the effect nine weeks after
the end of the intervention, similar to prior findings (Jitendra et al., 2009, 2011, 2013).
The stronger results for the SBI condition may be explained by program differentiation
results from the fidelity data, which highlighted important instructional differences between the
treatment and control conditions. Although the content focus was the same in both conditions,
there were some clear and meaningful differences in instructional emphasis across conditions.
Treatment teachers implemented SBI lesson elements significantly more (i.e., moderate to high
level of implementation) than control teachers (i.e., low level of implementation). The fidelity
data indicated that the SBI lesson elements control teachers were most likely to implement
represented instructional practices that most mathematics teachers typically engage in (i.e.,
PROPORTIONAL PROBLEM SOLVING
34
providing a solution within the problem context). In contrast, control teachers were less likely to
implement SBI lesson elements that are relatively unique to SBI (e.g., identifying the problem
type).
In short, SBI, with its emphasis on the underlying problem structure that requires students
to categorize problem types by discerning the relevant elements, relations, and conditions
embedded in the problem, use of visual representations, and instructional strategies (problem
solving, metacognition, multiple solution) that encouraged students to engage in problem
solving, reason at high levels, and explain their thinking, resulted in superior problem solving
performance for treatment students compared to the control group. Integrating these strategies
with mathematics content is important in connecting mathematics practices to mathematical
content articulated in the CCSS (2010).
The second research question examined the effect of SBI on the overall mathematical
problem-solving performance of seventh-grade students. Our results indicate that the scores of
students in the treatment group on a standardized test (Process and Applications subtest of the
GMADE) were not significantly different from those of students in the control group. One
explanation for this finding is that only 33% of the items on the GMADE focused on proportion
and percent problem solving. The result supports our hypothesis and is not surprising in that the
SBI intervention addressed only one of several strands of mathematics that the GMADE
evaluates. However, the finding is discouraging even though it is consistent with that reported in
Jitendra et al. (2011, 2013), in which the SBI intervention did not result in a significant change in
performance on a domain-general measure of problem solving. Although SBI is designed to
develop student competence in problem solving and proportional reasoning, and we provided
multiple examples that emphasized the critical features of problem types that Wagner’s (2006)

PROPORTIONAL PROBLEM SOLVING
35
theory of transfer-in-pieces argues are essential for a transfer effect, the standardized test
comprised content that was less familiar and therefore less sensitive to the effects of SBI.
Taken together, these results suggest that there was value added to students’ proportional
problem solving performance as a result of the SBI intervention. Students in the treatment group
exhibited a deeper level of reasoning and thinking on the PPS test while doing as well as students
in the control group on a mathematical problem solving assessment that covers all content areas.
The third research question was whether SBI and teacher-classroom characteristics
moderated the effects of student-level background variables on mathematical problem solving.
Our analysis showed that student-level relationships did not vary across classrooms for the
outcome variables, meaning that the moderating effect of treatment could not be studied. Perhaps
the lack of variation was related to the percentage of classrooms (76%) located in rural settings
and that 77% of our student sample consisted of White students. The predominance of White
students in rural schools is widely documented (NCES, 2013b) and may produce a homogeneity
that leads to a lack of variation in student-level relationships across classrooms. Including
location of a school district as a predictor did not produce significant results or influence model
results in any noticeable way.
Limitations
This study has some limitations to be considered. One limitation of the study is that
control group teachers did not receive professional development. As such, it is possible that the
treatment effects were due, in part, to the 16 hours of professional development training the
treatment teachers received prior to the implementation of SBI. However, it is worth noting that
the aim of the study was to contrast SBI instruction with typical mathematics instruction (i.e.,
“business as usual”).
PROPORTIONAL PROBLEM SOLVING
36
Another potential limitation in this study is that fidelity was addressed by evaluating one
videotaped lesson, which may not have been representative of teachers’ fidelity of
implementation across the entire study. At the same time, one video-recorded observation may
be sufficient, given the relatively brief period of the intervention (six weeks), to provide a
representative sample of participant functioning (Breitenstein et al., 2010). Video-recorded data,
which have several important advantages (e.g., ability to capture complex interactions, allow
multiple viewings), helped us maintain the quality of the coding that was done. In addition,
because of scheduling constraints teachers were not evaluated on the exact same lesson (although
all lessons were about proportion problem-solving), which could affect the results; however, the
fidelity measure was designed to be used with all SBI lessons and was implemented in both
treatment and control classrooms. Finally, a novelty effect is plausible in that the treatment
teachers may have been motivated by the new approach, which is an advantage that the business-
as-usual teachers did not have.
Future Research
The results provide “proof of concept” (NCTM, 2007, p. 2) support for the efficacy of
SBI. Focusing on the mathematical problem structure via schematic diagrams within the context
of explicit instruction in problem solving and metacognition strategies, and encouraging students
to employ multiple solution methods was more than or as effective as control instruction on
mathematical problem solving. These conclusions and limitations of the study suggest several
possibilities for future research. First, we intend to investigate the sustainability of SBI when
implemented by SBI-experienced teachers as compared to SBI-novice teachers, which could also
address a novelty effect of implementing a new approach. Although our previous studies show
the promise of the SBI intervention when teachers implement SBI immediately after receiving
PROPORTIONAL PROBLEM SOLVING
37
training on its use, it is less clear whether teachers will persist in implementing SBI with fidelity
in subsequent years. Second, we will replicate the current study in a different geographic location
within the U.S. in a high needs urban district that includes substantial diversity in the student
population. We expect the forthcoming replication to not only speak to the generalizability of
SBI effects but also increase the between-classroom variance to better examine any moderating
effects of SBI or teacher-classroom characteristics on the relationships between student-level
background variables and mathematical problem solving.
SBI is a multicomponent intervention, and evidence from the fidelity of implementation
data confirmed that SBI teachers required students to identify the problem type as well as discuss
the similarities and differences between previously solved and new problems, identify relevant
information to represent in a diagram, solve problems by estimating the answer, use multiple
solution strategies, and check whether the answer makes sense, significantly more than control
teachers. However, the scope of the current study did not include an examination of which
features were most influential in student success on proportional reasoning suggesting that future
research is needed to determine why SBI is effective. For example, a study that compares SBI as
detailed in this study with SBI without the metacognitive strategy training is needed to examine
the effects of metacognitive strategy training.
Another area of future research would be to examine the influence of longer duration of
SBI to address the issue of transfer effects. Wagner (2006) argues that transfer is “the
incremental growth, systematization, and organization of knowledge resources that only
gradually extend the span of situations in which a concept is perceived as applicable” (p. 10). A
study in which participants are randomly assigned to receive SBI for different durations (e.g., 6
weeks vs. 8 weeks) is needed to examine whether there is a transfer effect favoring longer
PROPORTIONAL PROBLEM SOLVING
38
duration of SBI. In addition, the SBI intervention may need to be revised to not only provide
more general mathematics applications that include priming students to focus on the similarities
and differences between new domains (e.g., algebra) and previously learned topics (e.g., ratios
and proportion) to make explicit connections to content outside of the instructional domain, but
also cover other content areas across the school year. It is also important to examine the long-
term effects of SBI for students who have mastered the major SBI components in the context of
proportional reasoning. That is, does mastery of specific SBI components prepare students to
succeed in more advanced mathematics (e.g., algebra, geometry) and result in transfer of content
learned (e.g., ratios and proportions) to other content areas (e.g., science)?
PROPORTIONAL PROBLEM SOLVING
39
References
Adjiage, R., & Pluvinage, F. (2007). An experiment in teaching ratio and proportion.
Educational Studies in Mathematics, 65, 149-175. doi: 10.1007/s10649-006-9049-x
Al-Wattban, M. S. (2001). Proportional reasoning of quasi-illiterate adults. In M. J. Hoines & A.
B. Fuglestad (Eds.), Proceedings of the 28th conference of the international group for the
psychology of mathematics education (Vol. 2, pp. 9–16). Bergen, Norway: PME (ERIC
Document Reproduction Service No. ED 489 670).
Behr, M., Harel, G., Post, T., & Lesh, R. (1992). Rational number, ratio and proportion. In D.
Grouws (Ed.), Handbook of Research on Mathematics Teaching and Learning (pp. 296-
333). NY: Macmillan Publishing.
Ben-Chaim, D., Fey, J. T., Fitzgerald, W. M., Benedetto, C., & Miller, J. (1998). Proportional
reasoning among 7th grade students with different curricular experiences. Educational
Studies in Mathematics, 36, 247-273.
Bloom, H.S., Richburg-Hayes, L., & Black, A.R. (2007). Using covariates to improve precision:
Empirical guidance for studies that randomize schools to measure the impacts of
educational interventions. Educational Evaluation and Policy Analysis, 29(1), 30-59. doi:
10.3102/0162373707299550
Boyer, T. W., Levine, S. C., & Huttenlocher, J. (2008). Development of proportional reasoning:
Where young children go wrong. Developmental Psychology, 44, 1478–1490. doi:
10.1037/a0013110
Breitenstein, S. M., Gross, D., Garvey, C. A., Hill, C., Fogg, L., & Resnick, B. (2010).
Implementation fidelity in community-based interventions. Research in Nursing &
Health, 33, 164–173. doi: 10.1002/nur.20373
PROPORTIONAL PROBLEM SOLVING
40
Carpenter, T., Fennema, E., & Romberg, T. (1993). Rational numbers: An integration of
research. Hillsdale, NJ: Lawrence Erlbaum.
Chen, Z. (1999). Schema induction in children’s analogical problem solving. Journal of
Educational Psychology, 91, 703–715. doi:10.1037/0022-0663.91.4.703
Cohen, J. (1988). Statistical power analysis for the behavioral sciences, 2nd ed. New York:
Lawrence Erlbaum
Dane, A. V., & Schneider, B. H. (1998). Program integrity in primary and early secondary
prevention: Are implementation effects out of control? Clinical Psychology Review, 18,
23–45. doi: 10.1016/S0272-7358(97)00043-3
Dunn, T. J., Baguley, T., & Brunsden, V. (2013). From alpha to omega: A practical solution to
the pervasive problem of internal consistency estimation. British Journal of Psychology,
105, 399–412. doi: 10.1111/bjop.12046
Fernández, C., Llinares, S., Van Dooren, W., De Bock, D., Verschaffel, L. (2012). The
development of students' use of additive and proportional methods along primary and
secondary school. European Journal of Psychology of Education, 27 (3), 421-438.
doi:10.1007/s10212-011-0087-0
Fuchs, L. S., Fuchs, D., Prentice, K., Burch, M., Hamlett, C. L., Owen, R., & Schroeter, K.
(2003). Enhancing third-grade students’ mathematical problem solving with self-regulated
learning strategies. Journal of Educational Psychology, 95, 306. doi: 10.1037/0022-
0663.95.2.306
Fuchs, L. S., Seethaler, P. M., Powell, S. R., Fuchs, D., Hamlett, C. L. & Fletcher, J. M. (2008).
Effects of preventative tutoring on the mathematical problem solving of third-grade
students with math and reading difficulties. Exceptional Children, 74, 155–173.
PROPORTIONAL PROBLEM SOLVING
41
Fuchs, L. S., Zumeta, R. O., Schumacher, R. F., Powell, S. R., Seethaler, P. M., Hamlett, C. L. &
Fuchs, D. (2010). The effects of schema-broadening instruction on second graders’ word-
problem performance and their ability to represent word problems with algebraic equations:
A randomized control study. The Elementary School Journal, 110, 440–463. doi:
10.1086/621191
Fujimura, N. (2001). Facilitating children's proportional reasoning: A model of reasoning
processes and effects of intervention on strategy change. Journal of Educational
Psychology, 93, 589. doi: 10.1037//0022-0663.93.3.589
Fuson, K. C. & Willis, G. B. (1989). Second graders’ use of schematic drawings in solving
addition and subtraction word problems. Journal of Educational Psychology, 81, 514–520.
doi: 10.1037//0022-0663.81.4.514
Harel, G., Behr, M., Post, T., & Lesh, R. (1992). The Blocks Task: Comparative analyses of the
task with other proportion tasks and qualitative reasoning skills of seventh grade children in
solving the task. Cognition and Instruction, 9(1), 45-96.
Hatano, G. (2003). Foreword. In A. J. Baroody & A. Dowker (Eds.), The development of
arithmetic concepts and skills (pp. xi-xiii). Mahwah, NJ: Lawrence Erlbaum.
Hedges, L.V., & Hedberg, E.C. (2007). Intraclass correlation values for planning group-
randomized trials in education. Educational Evaluation and Policy Analysis, 29, 60–87.
doi: 10.3102/0162373707299706
Hedges, L. V., & Olkin, I. (1985). Statistical methods for meta-analysis. Orlando, FL: Academic
Press.
Jacobse, A. E., & Harskamp, E. G. (2012). Towards efficient measurement of metacognition in
PROPORTIONAL PROBLEM SOLVING
42
mathematical problem solving. Metacognition and Learning, 7, 133-149. doi:
10.1007/s11409-012-9088-x
Jitendra, A. K., Griffin, C., Haria, P., Leh, J., Adams, A. & Kaduvetoor, A. (2007). A
comparison of single and multiple strategy instruction on third grade students’
mathematical problem solving. Journal of Educational Psychology, 99, 115–127. doi:
10.1037/0022-0663.99.1.115
Jitendra, A. K., Star, J., Starosta, K., Leh, J., Sood, S., Caskie, G. & Mack, T. R. (2009).
Improving students’ learning of ratio and proportion problem solving: The role of schema-
based instruction. Contemporary Educational Psychology, 34, 250–264. doi:
10.1016/j.cedpsych.2009.06.001
Jitendra, A. K., Star, J. R., Dupuis, D. N., & Rodriguez, M. C. (2013). Effectiveness of schema-
based instruction for improving seventh-grade students’ proportional reasoning: A
randomized experiment. Journal of Research on Educational Effectiveness, 6, 114-136.
doi: 10.1080/19345747.2012.725804
Jitendra, A. K., Star, J. R., Rodriguez, M., Lindell, M., & Someki, F. (2011). Improving students’
proportional thinking using schema-based instruction. Learning and Instruction, 21, 731-
745. doi: 10.1016/j.learninstruc.2011.04.002
Kelly, D., Xie, H., Nord, C.W., Jenkins, F., Chan, J.Y., and Kastberg, D. (2013). Performance of
U.S. 15-Year-Old Students in Mathematics, Science, and Reading Literacy in an
International Context: First Look at PISA 2012 (NCES 2014-024). U.S. Department of
Education. Washington, DC: National Center for Education Statistics. Retrieved [February
3, 2014] from http://nces.ed.gov/pubsearch
PROPORTIONAL PROBLEM SOLVING
43
Kramarski, B., & Mevarech, Z. R. (2003). Enhancing mathematical reasoning in the classroom:
The effects of cooperative learning and metacognitive training. American Educational
Research Journal, 40(1), 281-310.doi: 10.3102/00028312040001281
Lamon, S. J. (1993). Ratio and proportion: Connecting content and children's thinking. Journal
for Research in Mathematics Education, 24, 41-61. Retrieved from
http://www.jstor.org/stable/749385
Lamon, S. J. (1995). Ratio and proportion: Elementary didactical phenomenology. In J. T.
Sowder & B. P. Schappelle (Eds.), Providing a foundation for teaching mathematics in the
middle grades (pp. 167-198). Albany, NY: State University of New York Press.
Lamon, S. J. (1999). Teaching fractions and ratios for understanding: Essential content
knowledge and instructional strategies for teachers. Mahwah, NJ: Lawrence Erlbaum.
Lamon, S. J. (2007). Rational numbers and proportional reasoning: Toward a theoretical
framework for research. In F. K. Lester (Ed.), Second handbook of research on
mathematics teaching and learning (pp. 629-667). Charlotte, NC: Information Age
Publishing.
Larson, R., Boswell, L., Kanold, T.D., & Stiff, L. (2007). McDougal Littell Math Course 3.
Evanston, IL: McDougal Littell.
Lipsey, M.W., Puzio, K., Yun, C., Hebert, M.A., Steinka-Fry, K., Cole, M.W., Roberts, M.,
Anthony, K.S., Busick, M.D. (2012). Translating the statistical representation of the
effects of education interventions into more readily interpretable forms. (NCSER 2013-
3000). Washington, DC: National Center for Special Education Research, Institute of
Education Sciences, U.S. Department of Education.
PROPORTIONAL PROBLEM SOLVING
44
Lobato, J., Ellis, A. B., Charles, R. I. & Zbiek, R. M. (2010). Developing essential understanding
of ratios, proportions & proportional reasoning. Reston, VA: National Council of
Teachers of Mathematics.
Martini, R., & Shore, B. M. (2008). Pointing to parallels in ability-related differences in the use
of metacognition in academic and psychomotor tasks. Learning and Individual Differences,
18, 237-247. doi: 10.1016/j.lindif.2007.08.004
Mayer, R. E. (1999). The promise of educational psychology Vol. I: Learning in the content
areas. Upper Saddle River, NJ: Merrill Prentice Hall.
McDonald, R. P. (1999). Test theory: A unified treatment. Mahwah, NJ: Lawrence Erlbaum
Associates. doi:10.1111/j.2044-8317.1981.tb00621.x
Mevarech, Z. R., & Kramarski, B. (2003). The effects of metacognitive training versus worked-
out examples on students' mathematical reasoning. British Journal of Educational
Psychology, 73(4), 449-471. doi: 10.1348/000709903322591181
Miyakawa, T., & Winslow, C. (2009). Didactical designs for students’ proportional reasoning:
An open approach lesson and a fundamental situation. Educational Studies in Mathematics,
72, 199–218. doi: 10.1007/s10649-009-9188-y
Meyer, J. P. (2007). jMetrik [Computer software]. ItemAnalysis.com/jMetrik.com
Miller, M. C. (1966). Simultaneous statistical inference. New York: McGraw-Hill.
National Center for Education Statistics (2013a). The Nation's Report Card: A First Look: 2013
Mathematics and Reading (NCES 2014–451). Institute of Education Sciences, U.S.
Department of Education, Washington, D.C. Retrieved from
http://nces.ed.gov/nationsreportcard/subject/publications/main2013/pdf/2014451.pdf
National Center for Education Statistics (2013b). The Condition of Education (2013-037).

PROPORTIONAL PROBLEM SOLVING
45
Institute of Education Sciences, U.S. Department of Education, Washington, D.C.
Retrieved from http://nces.ed.gov/pubs2013/2013037.pdf
National Council of Teachers of Mathematics (2000). Principles and Standards for School
Mathematics. Reston, VA: Author.
National Council of Teachers of Mathematics (2007). Curriculum research brief: Selecting the
right curriculum. Reston, VA: Author.
National Governors Association Center for Best Practices & Council of Chief State School
Officers. (2010). Common Core State Standards for Mathematics. Washington, DC:
Authors.
National Mathematics Advisory Panel. (2008). Foundations for success: The final report of the
National Mathematics Advisory Panel. Washington, DC: U.S. Department of Education.
Nunnally, J. C. (1978). Psychometric theory (2nd ed.). New York, NY: McGraw-Hill.
O’Donnell, C. (2008). Defining, conceptualizing, and measuring fidelity of implementation and
its relationship to outcomes in K–12 curriculum intervention research. Review of
Educational Research, 78(1), 33–84. doi:10.3102/0034654307313793
Ozgun-Koca, S. A., & Altay, M. K. (2009). An investigation of proportional reasoning skills of
middle school students. Investigations in Mathematical Learning, 2, 26-48.
Pearson (2004). Group Mathematics Assessment and Diagnostic Evaluation [GMADE] (Level
M, Form A). San Antonio, TX: Author.
Peng, C. Y., Harwell, M. R., Liou, S. M., & Ehman, L. H. (2006). Advances in missing data
methods and implications for educational research. In S.S. Sawilowsky (Ed.), Real data
analysis (pp. 31-78). New York, NY: Information Age Publishing.
PROPORTIONAL PROBLEM SOLVING
46
Provasnik, S., Kastberg, D., Ferraro, D., Lemanski, N., Roey, S., & Jenkins, F. (2012).
Highlights From TIMSS 2011: Mathematics and Science Achievement of U.S. Fourth- and
Eighth-Grade Students in an International Context (NCES 2013-009 Revised). National
Center for Education Statistics, Institute of Education Sciences, U.S. Department of
Education. Washington, DC.
Quilici, J. L., & Mayer, R. E. (1996). Role of examples in how students learn to categorize
statistics word problems. Journal of Educational Psychology, 88, 144–
161. doi:10.1037/0022-0663.88.1.144
Quilici, J. L., & Mayer, R. E. (2002). Teaching students to recognize structural similarities
between statistics word problems. Applied Cognitive Psychology, 16, 325-342.
doi:10.1002/acp.796
Raudenbush, S. W., Bryk, A. S., & Congdon, R. (2004). HLM 6.02: Hierarchical linear and
nonlinear modeling [Computer software]. Lincolnwood, IL: Scientific Software
International.
Revelle, W., & Zinbarg, R. E. (2009). Coefficients alpha, beta, omega, and the glb: Comments
on Sijtsma. Psychometrika, 74, 145-154. doi:10.1007/s11336-008-9102-z
Spybrook, L., Bloom, H., Congdon, R., Hill, C., Martinez, A., & Raudenbush, S. (2011).
Optimal design plus empirical evidence: Documentation for the “Optimal Design”
software (Version 3.0) [Computer software. Retrieved from
http://sitemaker.umich.edu/group-based.
Star, J. R. (2005). Reconceptualizing procedural knowledge. Journal for Research in
Mathematics Education, 36, 404–411.
PROPORTIONAL PROBLEM SOLVING
47
Star, J. R. (2007). Foregrounding procedural knowledge. Journal for Research in Mathematics
Education, 38, 132–135.
Star, J. R., & Rittle-Johnson, B. (2008). Flexibility in problem solving: The case of equation
solving. Learning and Instruction, 18, 565-579. doi: 10.1016/j.learninstruc.2007.09.018
Star, J. R., & Rittle-Johnson, B. (2009). It pays to compare: An experimental study on
computational estimation. Journal of Experimental Child Psychology, 102, 408-426. doi:
10.1016/j.jecp.2008.11.004
Thompson, P. W., & Thompson, A. G. (1994). Talking about rates conceptually, part 1: A
teacher’s struggle. Journal for Research in Mathematics education, 25, 279–303. doi:
10.2307/749339
Tourniaire, F., & Pulos, S. (1985). Proportional reasoning: A review of the literature.
Educational Studies in Mathematics, 16, 181-204. doi: 10.1007/BF02400937
Van Dooren, W., De Bock, D., Evers, M., Verschaffel, L. (2009). Students' overuse of
proportionality on missing-value problems: How numbers may change solutions. Journal
for Research in Mathematics Education, 40 (2), 187-211. Retrieved from
http://www.jstor.org/stable/40539331
Van Dooren, W., De Bock, D., Hessels, A., Janssens, D., Verschaffel, L. (2005). Not everything
is proportional: Effects of age and problem type on propensities for overgeneralization.
Cognition and Instruction, 23 (1), 57-86. doi:10.1207/s1532690xci2301_3
Van Dooren, W., De Bock, D., Vleugels, K., & Verschaffel, L. (2010). Just answering... or
thinking? Contrasting pupils' solutions and classifications of missing-value word problems.
Mathematical Thinking and Learning: An International Journal.
doi:10.1080/10986060903465806
PROPORTIONAL PROBLEM SOLVING
48
Verschaffel, L., Greer, B. & De Corte, E. (2000). Making sense of word problems. Lisse, The
Netherlands: Swets & Zeitlinger.
Wagner, J. F. (2006). Transfer in Pieces. Cognition And Instruction, 24(1), 1-71.
What Works Clearinghouse. (2014). WWC Procedures and Standards Handbook (version 3.0).
Retrieved May 27, 2014 from
http://ies.ed.gov/ncee/wwc/pdf/reference_resources/wwc_procedures_v2_1_standards_handb
ook.pdf
Weinberg, S. L. (2002). Proportional reasoning: One problem, many solutions! In B. Litwiller
(Ed.), Making sense of fractions, ratios, and proportions: 2002 yearbook (pp. 138-144).
Reston, VA: National Council of Teachers of Mathematics.
Williams, K. T. (2004). Technical Manual: Group Mathematics Assessment and Diagnostic
Evaluation [GMADE]. San Antonio, TX: Pearson Education, Inc.
Woodward, J., Beckmann, S., Driscoll, M., Franke, M., Herzig, P., Jitendra, A., Koedinger, K.
R., & Ogbuehi, P. (2012). Improving mathematical problem solving in grades 4 through 8:
A practice guide (NCEE 2012-4055). Washington, DC: National Center for Education
Evaluation and Regional Assistance, Institute of Education Sciences, U.S. Department of
Education. Retrieved from http://ies.ed.gov/ncee/wwc/PracticeGuide.aspx?sid=16
Xin, Y. P., Jitendra, A. K., & Deatline-Buchman, A. (2005). Effects of mathematical word
problem solving instruction on students with learning problems. Journal of Special
Education, 39, 181–192.
Xin, Y. P., Zhang, D., Park, J. Y., Tom, K., Whipple, A., & Si, L. (2011). A comparison of two
mathematics problem-solving strategies: Facilitate algebra-readiness. The Journal of
Educational Research, 104, 381-395. doi: 10.1080/00220671.2010.487080
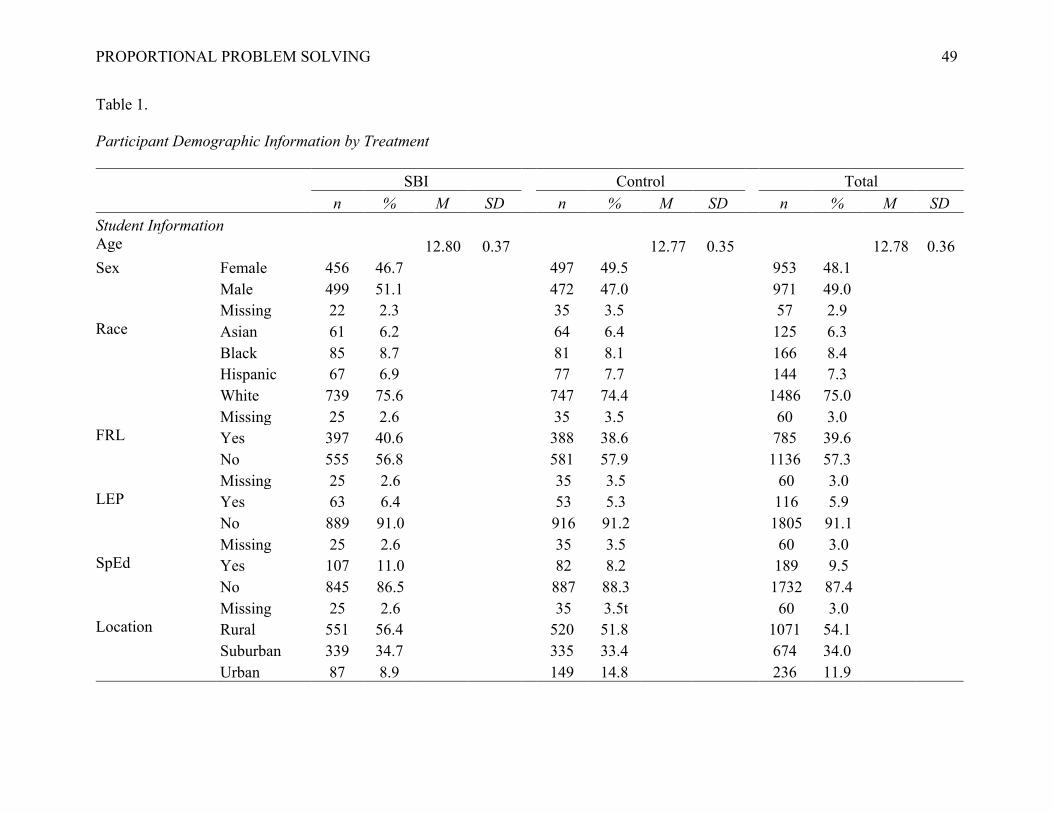
PROPORTIONAL PROBLEM SOLVING
49
Table 1. Participant Demographic Information by Treatment SBI Control Total
n % M SD n % M SD n % M SD Student Information Age 12.80 0.37 12.77 0.35 12.78 0.36 Sex Female 456 46.7 497 49.5 953 48.1
Male 499 51.1 472 47.0 971 49.0 Missing 22 2.3 35 3.5 57 2.9 Race Asian 61 6.2 64 6.4 125 6.3
Black 85 8.7 81 8.1 166 8.4 Hispanic 67 6.9 77 7.7 144 7.3 White 739 75.6 747 74.4 1486 75.0
Missing 25 2.6 35 3.5 60 3.0 FRL Yes 397 40.6 388 38.6 785 39.6 No 555 56.8 581 57.9 1136 57.3 Missing 25 2.6 35 3.5 60 3.0 LEP Yes 63 6.4 53 5.3 116 5.9 No 889 91.0 916 91.2 1805 91.1 Missing 25 2.6 35 3.5 60 3.0 SpEd Yes 107 11.0 82 8.2 189 9.5 No 845 86.5 887 88.3 1732 87.4 Missing 25 2.6 35 3.5t 60 3.0 Location Rural 551 56.4 520 51.8 1071 54.1
Suburban 339 34.7 335 33.4 674 34.0 Urban 87 8.9 149 14.8 236 11.9
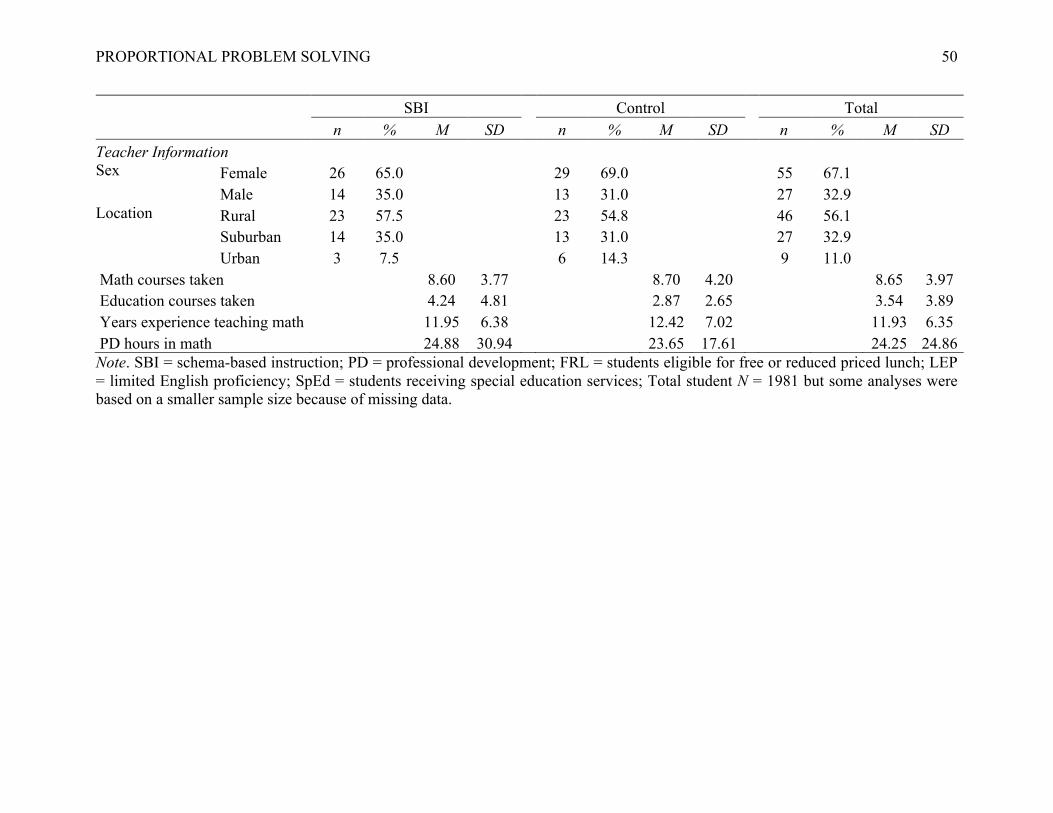
PROPORTIONAL PROBLEM SOLVING
50
SBI Control Total n % M SD n % M SD n % M SD
Teacher Information Sex Female 26 65.0 29 69.0 55 67.1
Male 14 35.0 13 31.0 27 32.9 Location Rural 23 57.5 23 54.8 46 56.1
Suburban 14 35.0 13 31.0 27 32.9 Urban 3 7.5 6 14.3 9 11.0
Math courses taken 8.60 3.77 8.70 4.20 8.65 3.97 Education courses taken 4.24 4.81 2.87 2.65 3.54 3.89 Years experience teaching math 11.95 6.38 12.42 7.02 11.93 6.35 PD hours in math 24.88 30.94 23.65 17.61 24.25 24.86 Note. SBI = schema-based instruction; PD = professional development; FRL = students eligible for free or reduced priced lunch; LEP = limited English proficiency; SpEd = students receiving special education services; Total student N = 1981 but some analyses were based on a smaller sample size because of missing data.
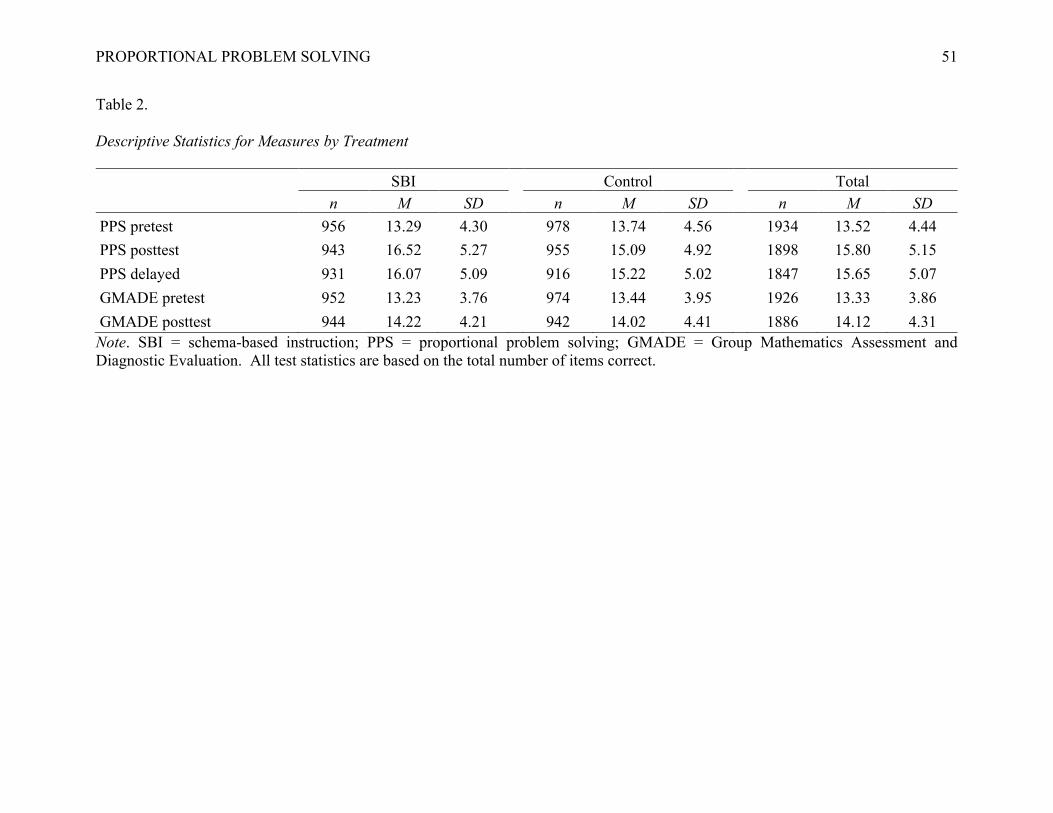
PROPORTIONAL PROBLEM SOLVING
51
Table 2. Descriptive Statistics for Measures by Treatment SBI Control Total
n M SD n M SD n M SD PPS pretest 956 13.29 4.30 978 13.74 4.56 1934 13.52 4.44 PPS posttest 943 16.52 5.27 955 15.09 4.92 1898 15.80 5.15 PPS delayed 931 16.07 5.09 916 15.22 5.02 1847 15.65 5.07 GMADE pretest 952 13.23 3.76 974 13.44 3.95 1926 13.33 3.86 GMADE posttest 944 14.22 4.21 942 14.02 4.41 1886 14.12 4.31 Note. SBI = schema-based instruction; PPS = proportional problem solving; GMADE = Group Mathematics Assessment and Diagnostic Evaluation. All test statistics are based on the total number of items correct.
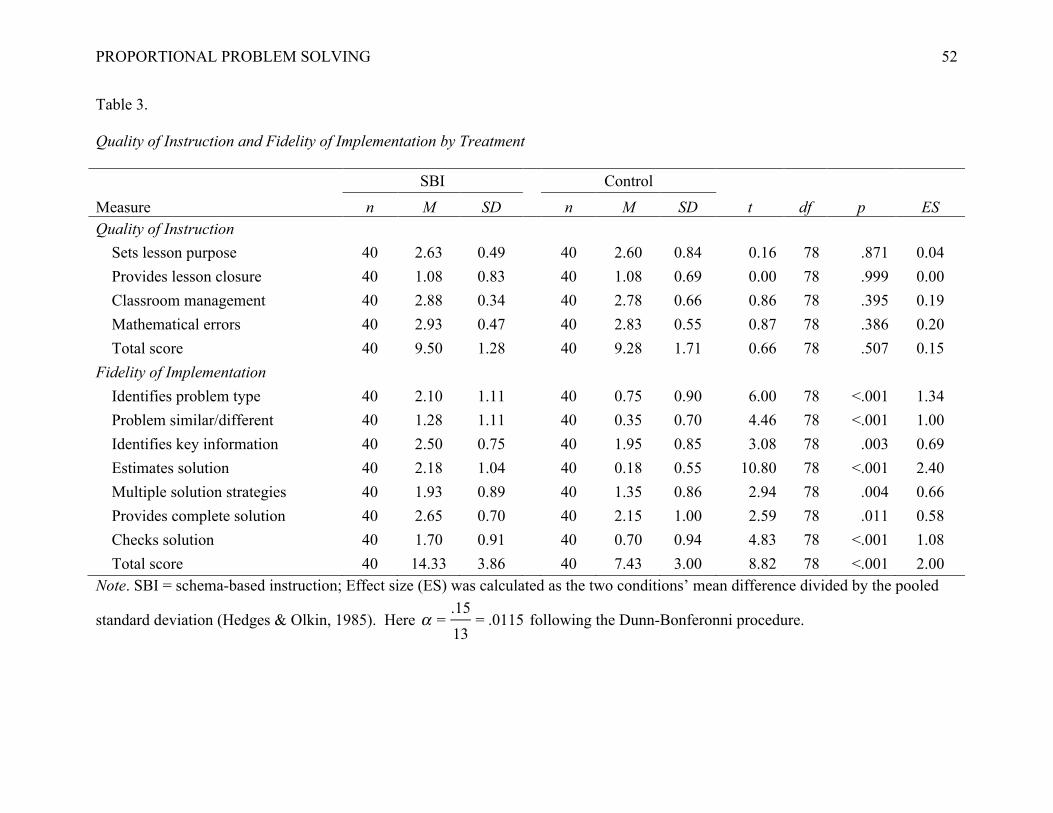
PROPORTIONAL PROBLEM SOLVING
52
Table 3.
Quality of Instruction and Fidelity of Implementation by Treatment
SBI Control
Measure n M SD n M SD t df p ES Quality of Instruction Sets lesson purpose 40 2.63 0.49 40 2.60 0.84 0.16 78 .871 0.04 Provides lesson closure 40 1.08 0.83 40 1.08 0.69 0.00 78 .999 0.00 Classroom management 40 2.88 0.34 40 2.78 0.66 0.86 78 .395 0.19 Mathematical errors 40 2.93 0.47 40 2.83 0.55 0.87 78 .386 0.20 Total score 40 9.50 1.28 40 9.28 1.71 0.66 78 .507 0.15 Fidelity of Implementation Identifies problem type 40 2.10 1.11 40 0.75 0.90 6.00 78 <.001 1.34 Problem similar/different 40 1.28 1.11 40 0.35 0.70 4.46 78 <.001 1.00 Identifies key information 40 2.50 0.75 40 1.95 0.85 3.08 78 .003 0.69 Estimates solution 40 2.18 1.04 40 0.18 0.55 10.80 78 <.001 2.40 Multiple solution strategies 40 1.93 0.89 40 1.35 0.86 2.94 78 .004 0.66 Provides complete solution 40 2.65 0.70 40 2.15 1.00 2.59 78 .011 0.58 Checks solution 40 1.70 0.91 40 0.70 0.94 4.83 78 <.001 1.08 Total score 40 14.33 3.86 40 7.43 3.00 8.82 78 <.001 2.00 Note. SBI = schema-based instruction; Effect size (ES) was calculated as the two conditions’ mean difference divided by the pooled
standard deviation (Hedges & Olkin, 1985). Here α =
.1513
= .0115 following the Dunn-Bonferonni procedure.
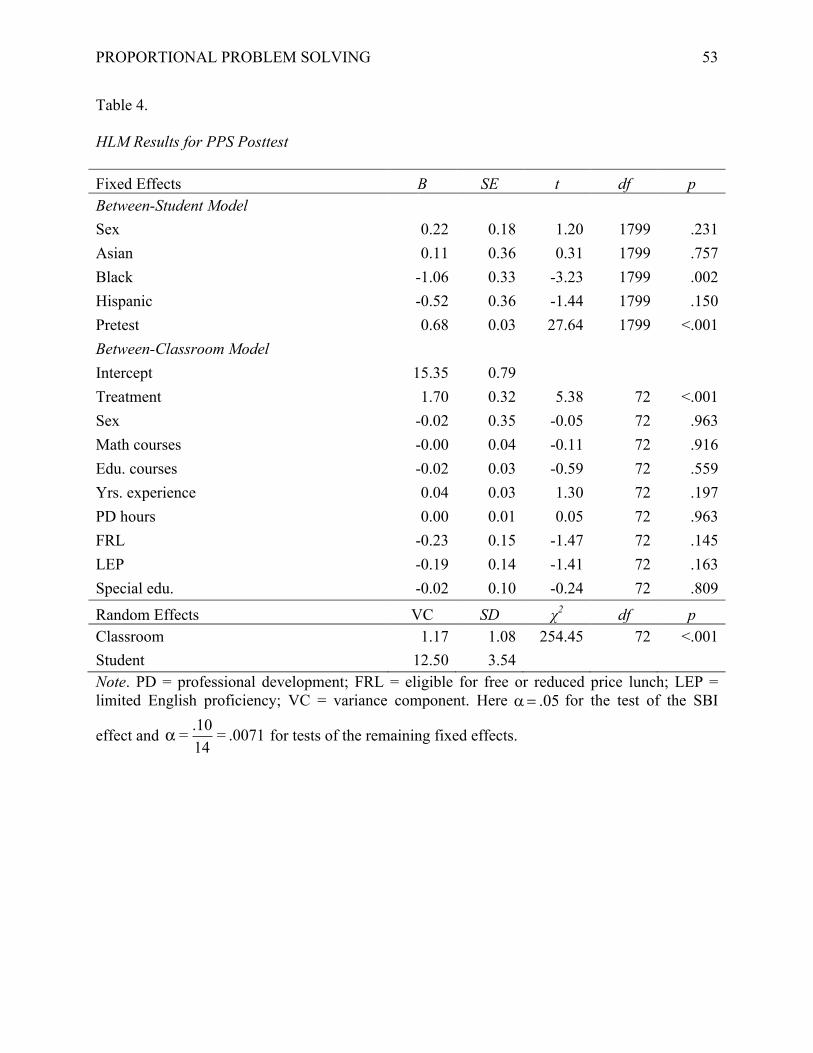
PROPORTIONAL PROBLEM SOLVING
53
Table 4. HLM Results for PPS Posttest Fixed Effects B SE t df p Between-Student Model Sex 0.22 0.18 1.20 1799 .231 Asian 0.11 0.36 0.31 1799 .757 Black -1.06 0.33 -3.23 1799 .002 Hispanic -0.52 0.36 -1.44 1799 .150 Pretest 0.68 0.03 27.64 1799 <.001 Between-Classroom Model Intercept 15.35 0.79 Treatment 1.70 0.32 5.38 72 <.001 Sex -0.02 0.35 -0.05 72 .963 Math courses -0.00 0.04 -0.11 72 .916 Edu. courses -0.02 0.03 -0.59 72 .559 Yrs. experience 0.04 0.03 1.30 72 .197 PD hours 0.00 0.01 0.05 72 .963 FRL -0.23 0.15 -1.47 72 .145 LEP -0.19 0.14 -1.41 72 .163 Special edu. -0.02 0.10 -0.24 72 .809
Random Effects VC SD χ2 df p Classroom 1.17 1.08 254.45 72 <.001 Student 12.50 3.54 Note. PD = professional development; FRL = eligible for free or reduced price lunch; LEP = limited English proficiency; VC = variance component. Here .05a= for the test of the SBI
effect and α = .1014= .0071 for tests of the remaining fixed effects.

PROPORTIONAL PROBLEM SOLVING
54
Table 5. HLM Results for PPS Delayed Posttest Fixed Effects B SE t df p Between-Student Model Sex 0.17 0.21 0.79 1755 .430 Asian 0.37 0.40 0.94 1755 .350 Black -0.60 0.40 -1.52 1755 .128 Hispanic -0.38 0.36 -1.05 1755 .293 Pretest 0.67 0.03 26.72 1755 <.001 Between-Classroom Model Intercept 15.07 0.64 Treatment 1.22 0.29 4.17 70 <.001 Sex 0.33 0.31 1.05 70 .296 Math courses -0.01 0.04 -0.16 70 .877 Edu. courses 0.02 0.03 0.89 70 .374 Yrs. experience 0.04 0.02 1.86 70 .067 PD hours -0.00 0.00 -0.40 70 .687 FRL -0.22 0.13 -1.74 70 .087 LEP -0.19 0.13 -1.47 70 .147 Special edu. -0.02 0.10 -0.22 70 .828
Random Effects VC SD χ2 df p Classroom 0.76 0.87 178.24 70 <.001 Student 13.64 3.69 Note. PD = professional development; FRL = eligible for free or reduced price lunch; LEP = limited English proficiency; VC = variance component. Here .05a= for the test of the SBI
effect and α = .1014= .0071
for tests of the remaining fixed effects.
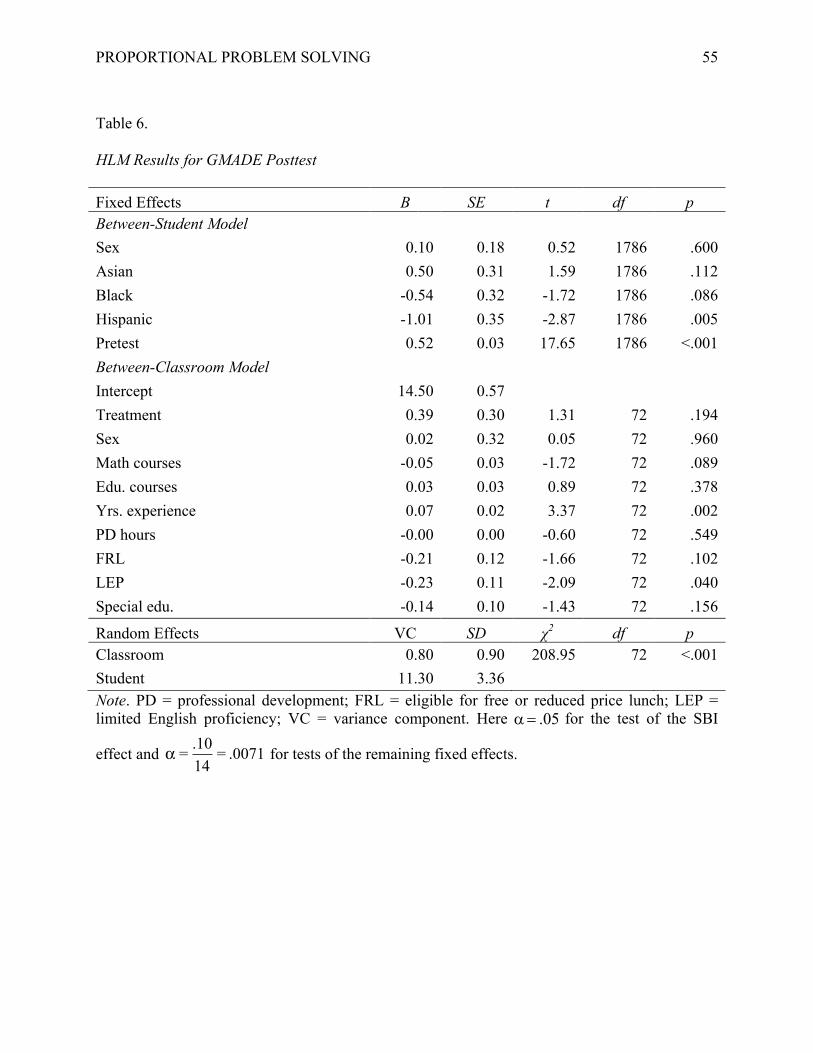
PROPORTIONAL PROBLEM SOLVING
55
Table 6. HLM Results for GMADE Posttest Fixed Effects B SE t df p Between-Student Model Sex 0.10 0.18 0.52 1786 .600 Asian 0.50 0.31 1.59 1786 .112 Black -0.54 0.32 -1.72 1786 .086 Hispanic -1.01 0.35 -2.87 1786 .005 Pretest 0.52 0.03 17.65 1786 <.001 Between-Classroom Model Intercept 14.50 0.57 Treatment 0.39 0.30 1.31 72 .194 Sex 0.02 0.32 0.05 72 .960 Math courses -0.05 0.03 -1.72 72 .089 Edu. courses 0.03 0.03 0.89 72 .378 Yrs. experience 0.07 0.02 3.37 72 .002 PD hours -0.00 0.00 -0.60 72 .549 FRL -0.21 0.12 -1.66 72 .102 LEP -0.23 0.11 -2.09 72 .040 Special edu. -0.14 0.10 -1.43 72 .156
Random Effects VC SD χ2 df p Classroom 0.80 0.90 208.95 72 <.001 Student 11.30 3.36 Note. PD = professional development; FRL = eligible for free or reduced price lunch; LEP = limited English proficiency; VC = variance component. Here .05a= for the test of the SBI
effect and α = .1014= .0071
for tests of the remaining fixed effects.

PROPORTIONAL PROBLEM SOLVING
56
Figure Caption
Figure 1. Ratio, Proportion, and Percent of Change Diagrams
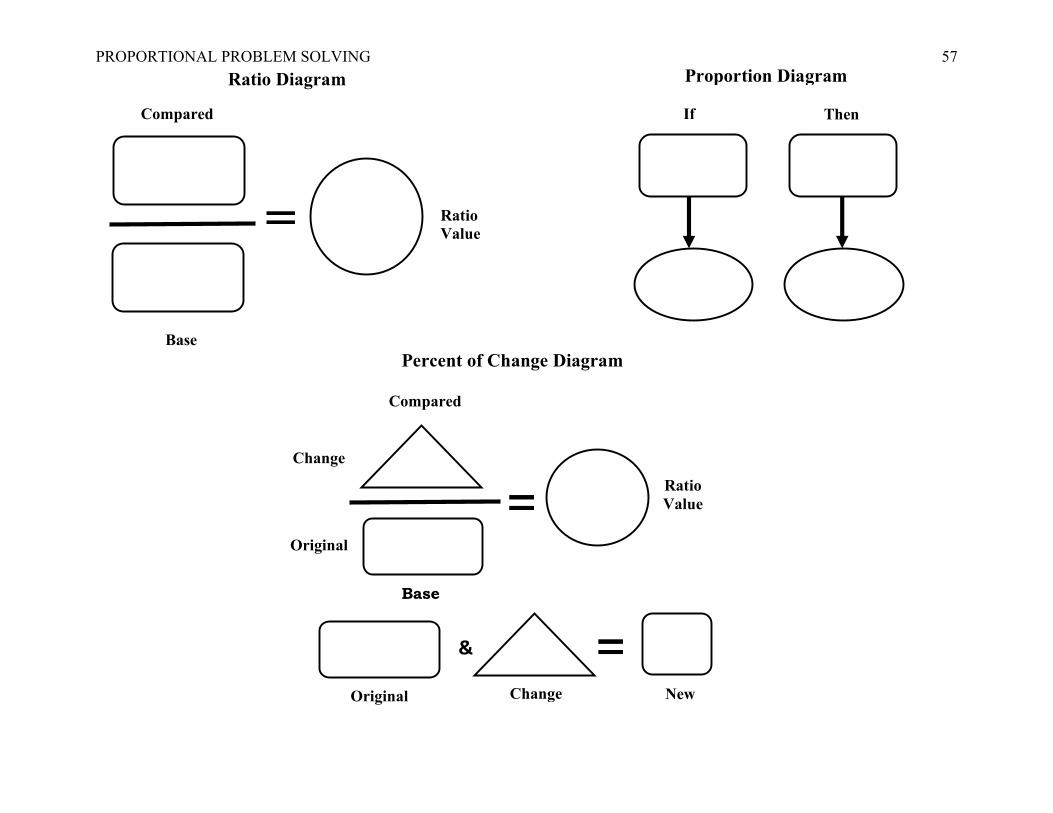
PROPORTIONAL PROBLEM SOLVING
57
Ratio Diagram Proportion Diagram
Percent of Change Diagram
If Then Compared
Base
Ratio Value
Compared
Base
Ratio Value
Change
Original
Original
Change
&
New
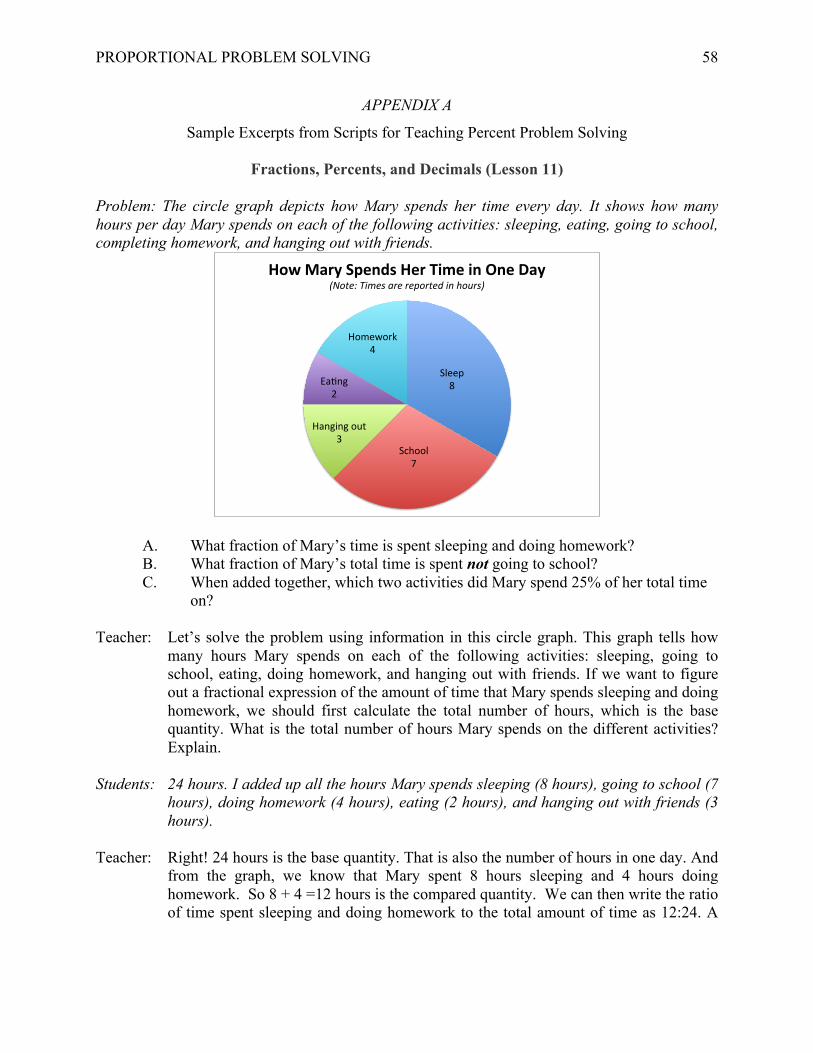
PROPORTIONAL PROBLEM SOLVING
58
APPENDIX A
Sample Excerpts from Scripts for Teaching Percent Problem Solving
Fractions, Percents, and Decimals (Lesson 11)
Problem: The circle graph depicts how Mary spends her time every day. It shows how many hours per day Mary spends on each of the following activities: sleeping, eating, going to school, completing homework, and hanging out with friends.
A. What fraction of Mary’s time is spent sleeping and doing homework? B. What fraction of Mary’s total time is spent not going to school? C. When added together, which two activities did Mary spend 25% of her total time
on? Teacher: Let’s solve the problem using information in this circle graph. This graph tells how
many hours Mary spends on each of the following activities: sleeping, going to school, eating, doing homework, and hanging out with friends. If we want to figure out a fractional expression of the amount of time that Mary spends sleeping and doing homework, we should first calculate the total number of hours, which is the base quantity. What is the total number of hours Mary spends on the different activities? Explain.
Students: 24 hours. I added up all the hours Mary spends sleeping (8 hours), going to school (7
hours), doing homework (4 hours), eating (2 hours), and hanging out with friends (3 hours).
Teacher: Right! 24 hours is the base quantity. That is also the number of hours in one day. And
from the graph, we know that Mary spent 8 hours sleeping and 4 hours doing homework. So 8 + 4 =12 hours is the compared quantity. We can then write the ratio of time spent sleeping and doing homework to the total amount of time as 12:24. A
Sleep%8%
School%7%
Hanging%out%3%
Ea4ng%2%
Homework%4%
How$Mary$Spends$Her$Time$in$One$Day$(Note:'Times'are'reported'in'hours)'
PROPORTIONAL PROBLEM SOLVING
59
ratio of 12:24 can be written in fraction form as 1224 . When we simplify the fraction
1224 ,
what do we get? Students: 1
2 . Teacher: How can we write
12 as a percent?
Students: We know that we can write
12 in many different ways. One fraction that is equivalent
to 12 is
50100 . For
50100 , the denominator is 100, so we can write
50100 as 50%.
Teacher: Next, we need to figure out what fraction of Mary’s total time is spent not going to
school. (Think aloud) Let’s see … we know from just solving the question (11.6A) about the amount of time Mary spent sleeping and doing homework that the base quantity (total time spent on all activities) is 24. We need to find the compared quantity, which is the time spent not going to school. What is this amount? Explain.
Students: 17 hours. With the exception of the hours spent going to school (i.e., 7 hours), I added
the hours spent sleeping (8 hours), doing homework (4 hours), eating (2 hours) and hanging out with friends (3 hours). So 8 + 4 + 2 + 3 = 17.
Teacher: So, 17 is our compared quantity, which is the time not spent going to school, and 24
is the base quantity (i.e., the total time spent going to school and not going to school). We need to write this as a fraction. How would you write the amount of time spent not going to school to the total amount of time as a fraction? Explain.
Students: We would write the compared quantity (numerator) over the base quantity
(denominator) to get 1724 .
Teacher: Great! Now,
1724 cannot be simplified, so Mary spends
1724 of her time not going to
school. Now, we are ready to solve the next question about which two activities Mary spends 25% of her time doing in one day. Let’s use these 4 steps (DISC) to solve this problem. To discover the problem type, I will read, retell, and examine information in the problem to recognize the problem type. (Read and retell the problem.) Now, I will ask myself if this is a percent problem. How do I know it is a percent problem? It’s a percent problem, because it tells about the percent of time Mary spends on a specific activity every day. The percent relationship describes a part-to-whole (time Mary spends doing each activity out of the total time of 24 hours) comparison.
Now I will ask if this problem is different from/similar to another problem we have already solved. (Remind students of the ratio problems just solved.) It is similar to ratio problems we solved earlier, because it compares a part (i.e., the number of
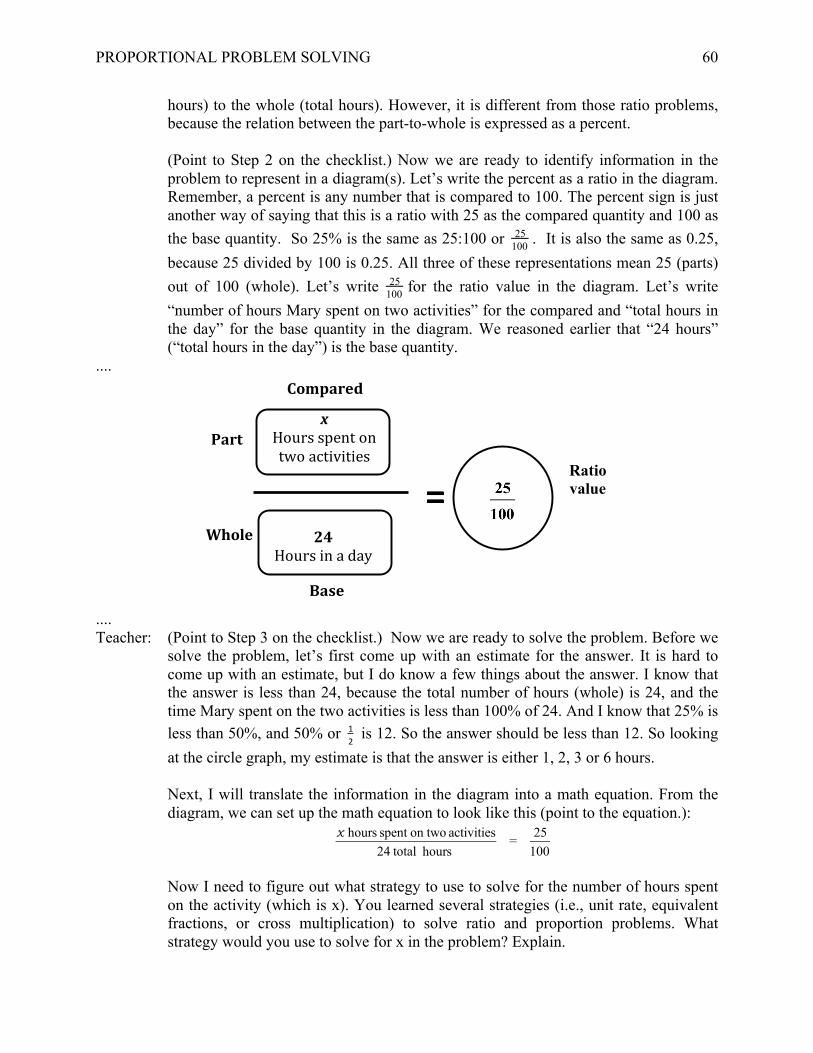
PROPORTIONAL PROBLEM SOLVING
60
hours) to the whole (total hours). However, it is different from those ratio problems, because the relation between the part-to-whole is expressed as a percent. (Point to Step 2 on the checklist.) Now we are ready to identify information in the problem to represent in a diagram(s). Let’s write the percent as a ratio in the diagram. Remember, a percent is any number that is compared to 100. The percent sign is just another way of saying that this is a ratio with 25 as the compared quantity and 100 as the base quantity. So 25% is the same as 25:100 or
25100 . It is also the same as 0.25,
because 25 divided by 100 is 0.25. All three of these representations mean 25 (parts) out of 100 (whole). Let’s write
25100 for the ratio value in the diagram. Let’s write
“number of hours Mary spent on two activities” for the compared and “total hours in the day” for the base quantity in the diagram. We reasoned earlier that “24 hours” (“total hours in the day”) is the base quantity.
....
.... Teacher: (Point to Step 3 on the checklist.) Now we are ready to solve the problem. Before we
solve the problem, let’s first come up with an estimate for the answer. It is hard to come up with an estimate, but I do know a few things about the answer. I know that the answer is less than 24, because the total number of hours (whole) is 24, and the time Mary spent on the two activities is less than 100% of 24. And I know that 25% is less than 50%, and 50% or !
12
is 12. So the answer should be less than 12. So looking at the circle graph, my estimate is that the answer is either 1, 2, 3 or 6 hours. Next, I will translate the information in the diagram into a math equation. From the diagram, we can set up the math equation to look like this (point to the equation.):
x hours spent on two activities24 total hours
=25
100
Now I need to figure out what strategy to use to solve for the number of hours spent on the activity (which is x). You learned several strategies (i.e., unit rate, equivalent fractions, or cross multiplication) to solve ratio and proportion problems. What strategy would you use to solve for x in the problem? Explain.
xHoursspentontwoactivities
Compared
Base
Part
Whole
Ratiovalue
24Hoursinaday
PROPORTIONAL PROBLEM SOLVING
61
Students: Unit rate strategy, because it works best with the numbers in the problem. Teacher: Solve for the unknown or x in the equation using the unit rate strategy we identified in
the plan step. When you use unit rate strategy, how do you set up the problem? Show all your work and explain.
Students:
x hours spent on two activities24 total hours
=25
100
First, ask 25 times what number gives 100. The answer is 4 (i.e., 25 · 4 = 100). Then,
we multiply x by 4 to get 4x = 24. So x = 24 ÷ 4, which is 6. Teacher: So, 6 hours is our compared quantity. (Point to the circle graph.) From the circle
graph, which two activities when you add together did Mary spend 6 hours on? Students: Mary spent 6 hours doing homework and eating. Teacher: Good. Let’s write 6 for “x” in the diagram and write the complete answer on the
answer line. What is the complete answer? Students: Mary spent 6 hours doing homework and eating. Teacher: Good. What do you do next? (Point to Step 4.)
Students: Check if the answer makes sense.
Teacher: To check the solution, what must you do first?
Students: Look back to see if our estimate in Step 3 is close to the exact answer.
Teacher: We estimated our answer to be less than 12 hours. The answer to this problem is 6. So, your estimate did a nice job of giving us a ballpark sense of what the answer should be. Now check to see if the answer makes sense. Does 6 seem right? Explain.
Students: We know that if 24 hours represent 100% of the total time in Mary’s day, then 6
hours going to school out of 24 hours seems right. The answer of 6 hours doing homework and eating seems right, because this is less hours (6) than the total number of hours in a day (24).
Teacher: You can also check the ratio 6:24 to see if this value is equal to the ratio 25:100.
When you simplify both ratios (i.e., using your calculator, divide the numerator by the denominator), you get !
624
(0.25), which tells me that they are equivalent.
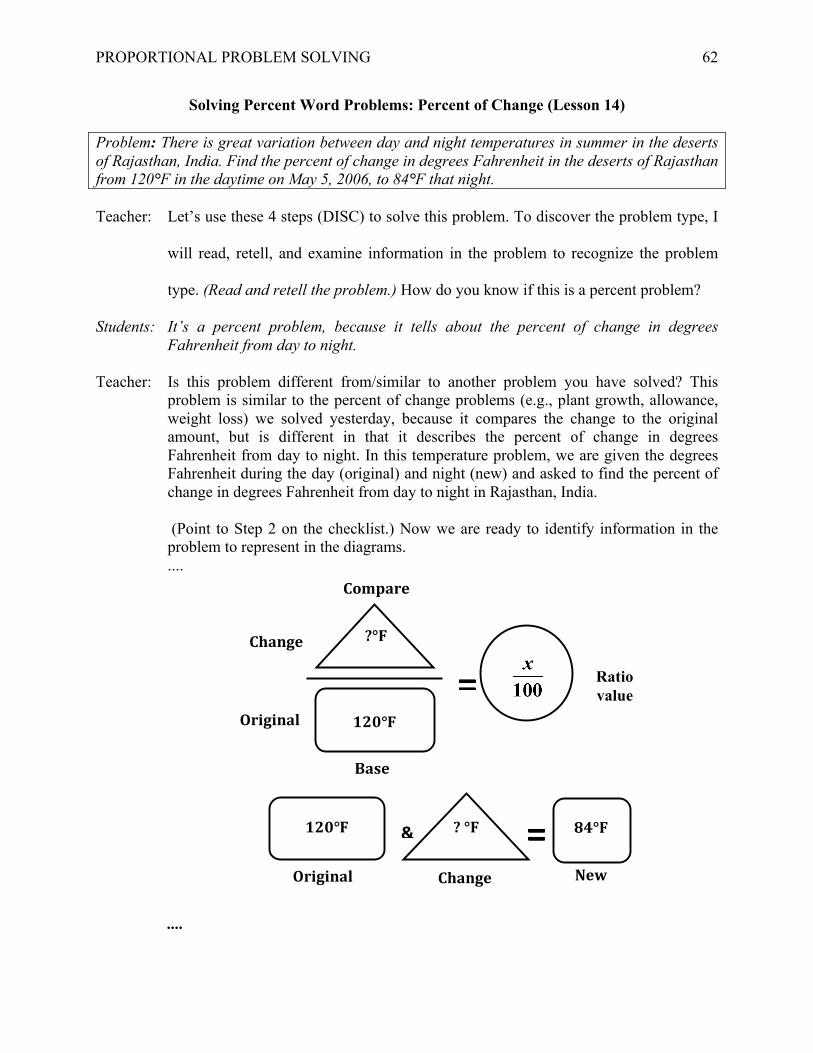
PROPORTIONAL PROBLEM SOLVING
62
Solving Percent Word Problems: Percent of Change (Lesson 14)
Problem: There is great variation between day and night temperatures in summer in the deserts of Rajasthan, India. Find the percent of change in degrees Fahrenheit in the deserts of Rajasthan from 120°F in the daytime on May 5, 2006, to 84°F that night. Teacher: Let’s use these 4 steps (DISC) to solve this problem. To discover the problem type, I
will read, retell, and examine information in the problem to recognize the problem
type. (Read and retell the problem.) How do you know if this is a percent problem?
Students: It’s a percent problem, because it tells about the percent of change in degrees Fahrenheit from day to night.
Teacher: Is this problem different from/similar to another problem you have solved? This
problem is similar to the percent of change problems (e.g., plant growth, allowance, weight loss) we solved yesterday, because it compares the change to the original amount, but is different in that it describes the percent of change in degrees Fahrenheit from day to night. In this temperature problem, we are given the degrees Fahrenheit during the day (original) and night (new) and asked to find the percent of change in degrees Fahrenheit from day to night in Rajasthan, India.
(Point to Step 2 on the checklist.) Now we are ready to identify information in the problem to represent in the diagrams.
....
....
Compared
Base
Ratio value
Change
Original 120°F
?°F
&
NewOriginal Change
120°F
?°F
84°F
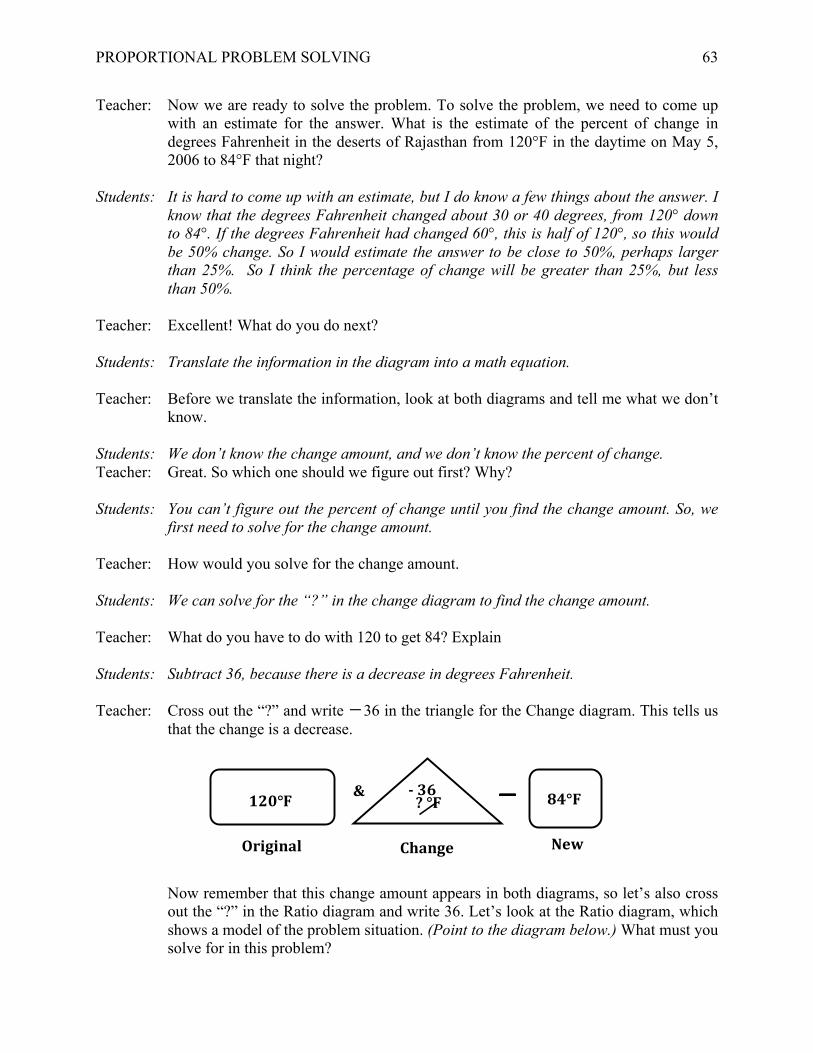
PROPORTIONAL PROBLEM SOLVING
63
Teacher: Now we are ready to solve the problem. To solve the problem, we need to come up with an estimate for the answer. What is the estimate of the percent of change in degrees Fahrenheit in the deserts of Rajasthan from 120°F in the daytime on May 5, 2006 to 84°F that night?
Students: It is hard to come up with an estimate, but I do know a few things about the answer. I
know that the degrees Fahrenheit changed about 30 or 40 degrees, from 120° down to 84°. If the degrees Fahrenheit had changed 60°, this is half of 120°, so this would be 50% change. So I would estimate the answer to be close to 50%, perhaps larger than 25%. So I think the percentage of change will be greater than 25%, but less than 50%.
Teacher: Excellent! What do you do next? Students: Translate the information in the diagram into a math equation. Teacher: Before we translate the information, look at both diagrams and tell me what we don’t
know. Students: We don’t know the change amount, and we don’t know the percent of change. Teacher: Great. So which one should we figure out first? Why? Students: You can’t figure out the percent of change until you find the change amount. So, we
first need to solve for the change amount. Teacher: How would you solve for the change amount. Students: We can solve for the “?” in the change diagram to find the change amount. Teacher: What do you have to do with 120 to get 84? Explain Students: Subtract 36, because there is a decrease in degrees Fahrenheit. Teacher: Cross out the “?” and write -36 in the triangle for the Change diagram. This tells us
that the change is a decrease.
Now remember that this change amount appears in both diagrams, so let’s also cross out the “?” in the Ratio diagram and write 36. Let’s look at the Ratio diagram, which shows a model of the problem situation. (Point to the diagram below.) What must you solve for in this problem?
&
NewOriginal Change Chan
120°F
84°F
?°F
-36
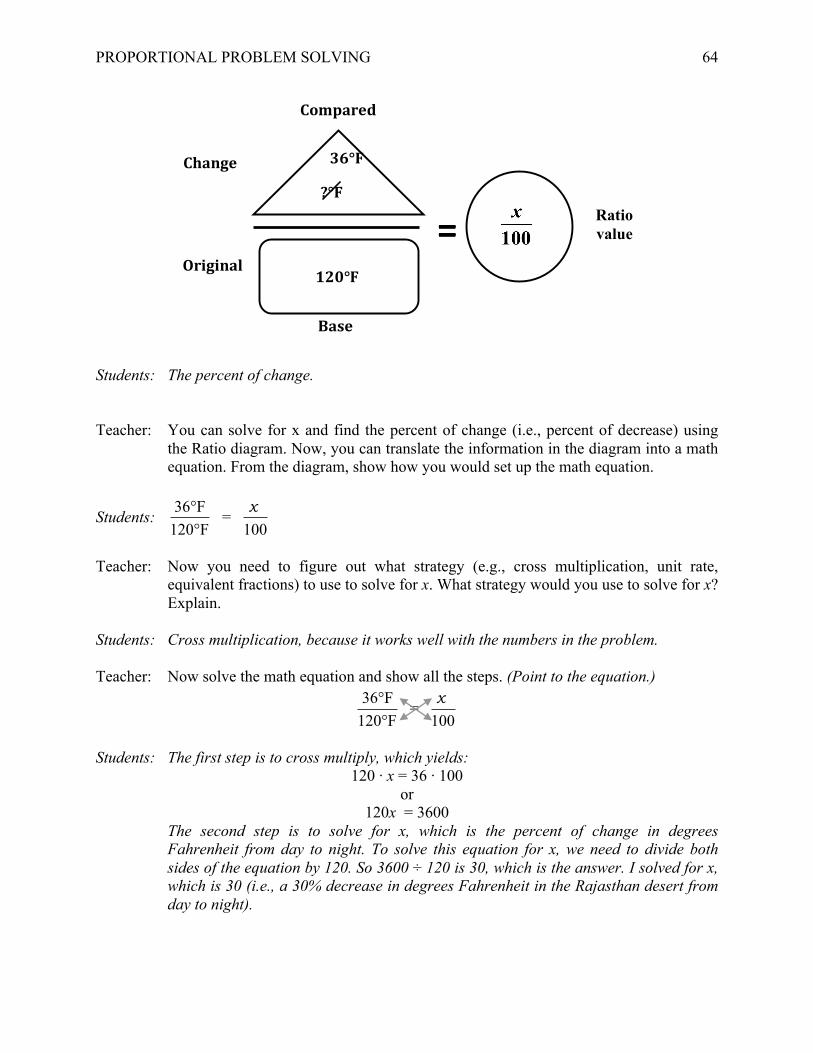
PROPORTIONAL PROBLEM SOLVING
64
Students: The percent of change.
Teacher: You can solve for x and find the percent of change (i.e., percent of decrease) using the Ratio diagram. Now, you can translate the information in the diagram into a math equation. From the diagram, show how you would set up the math equation.
Students: 36°F120°F
= x 100
Teacher: Now you need to figure out what strategy (e.g., cross multiplication, unit rate,
equivalent fractions) to use to solve for x. What strategy would you use to solve for x? Explain.
Students: Cross multiplication, because it works well with the numbers in the problem. Teacher: Now solve the math equation and show all the steps. (Point to the equation.)
36°F120°F
= x 100
Students: The first step is to cross multiply, which yields:
120 · x = 36 · 100 or
120x = 3600 The second step is to solve for x, which is the percent of change in degrees
Fahrenheit from day to night. To solve this equation for x, we need to divide both sides of the equation by 120. So 3600 ÷ 120 is 30, which is the answer. I solved for x, which is 30 (i.e., a 30% decrease in degrees Fahrenheit in the Rajasthan desert from day to night).
Compared
Base
Change
Original
Ratio value
120°F
?°F
36°F
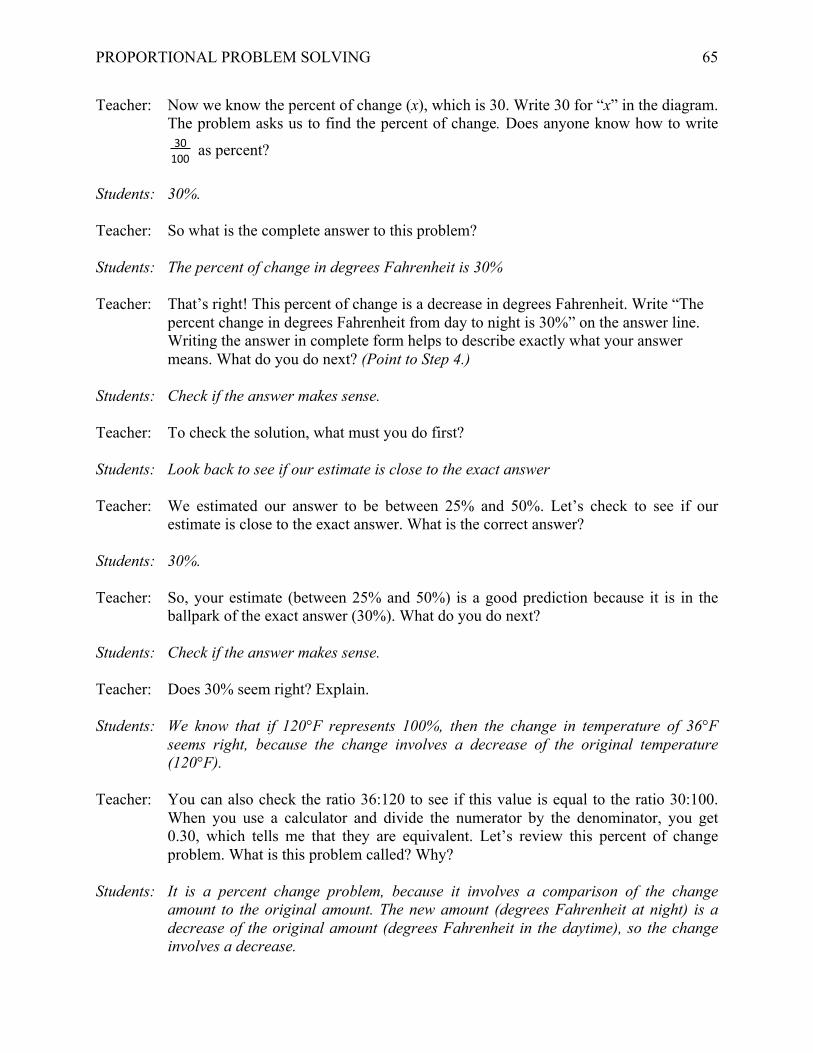
PROPORTIONAL PROBLEM SOLVING
65
Teacher: Now we know the percent of change (x), which is 30. Write 30 for “x” in the diagram. The problem asks us to find the percent of change. Does anyone know how to write
!30100 as percent?
Students: 30%. Teacher: So what is the complete answer to this problem? Students: The percent of change in degrees Fahrenheit is 30% Teacher: That’s right! This percent of change is a decrease in degrees Fahrenheit. Write “The
percent change in degrees Fahrenheit from day to night is 30%” on the answer line. Writing the answer in complete form helps to describe exactly what your answer means. What do you do next? (Point to Step 4.)
Students: Check if the answer makes sense. Teacher: To check the solution, what must you do first? Students: Look back to see if our estimate is close to the exact answer Teacher: We estimated our answer to be between 25% and 50%. Let’s check to see if our
estimate is close to the exact answer. What is the correct answer? Students: 30%. Teacher: So, your estimate (between 25% and 50%) is a good prediction because it is in the
ballpark of the exact answer (30%). What do you do next? Students: Check if the answer makes sense. Teacher: Does 30% seem right? Explain. Students: We know that if 120°F represents 100%, then the change in temperature of 36°F
seems right, because the change involves a decrease of the original temperature (120°F).
Teacher: You can also check the ratio 36:120 to see if this value is equal to the ratio 30:100.
When you use a calculator and divide the numerator by the denominator, you get 0.30, which tells me that they are equivalent. Let’s review this percent of change problem. What is this problem called? Why?
Students: It is a percent change problem, because it involves a comparison of the change
amount to the original amount. The new amount (degrees Fahrenheit at night) is a decrease of the original amount (degrees Fahrenheit in the daytime), so the change involves a decrease.

PROPORTIONAL PROBLEM SOLVING
66
APPENDIX B
Sample Items from the Proportional Problem Solving Test
1. The weight of an object on the Moon is
16
the weight of that object on the Earth. An object
that weighs 30 pounds on Earth would weigh how many pounds on the Moon?
A. 10 pounds B. 11 pounds C. 12 pounds D. 13 pounds
2. At the school carnival, Carmen sold 3 times as many hot dogs as Shawn. The two of them
together sold 152 hot dogs. How many hot dogs did Carmen sell?
A. 38 B. 51 C. 114
3. A club held a car wash and washed 21 cars. If the club raised $84, how much did it charge
per car?
A. $0.25 B. $4.00 C. $5.00 D. $4.50
4. If there are 300 calories in 200 g of a certain food, how many calories are there in a 40 g
portion of this food?
A. 60
B. 26 23
C. 6 D. 140
5. A machine uses 2.4 liters of gasoline for every 30 hours of operation. How many liters of
gasoline will the machine use in 100 hours?
A. 7.2
B. 8.0
C. 8.4
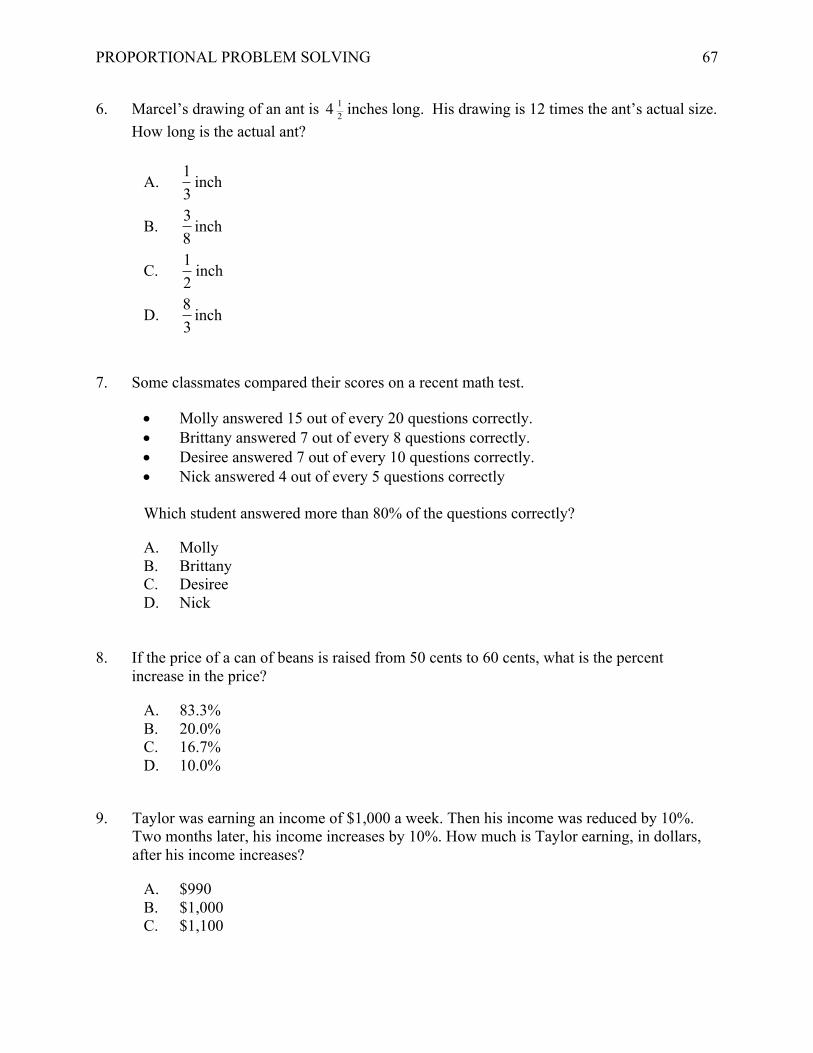
PROPORTIONAL PROBLEM SOLVING
67
6. Marcel’s drawing of an ant is 4 12 inches long. His drawing is 12 times the ant’s actual size.
How long is the actual ant?
A.
13
inch
B.
38
inch
C.
12
inch
D.
83
inch
7. Some classmates compared their scores on a recent math test.
• Molly answered 15 out of every 20 questions correctly. • Brittany answered 7 out of every 8 questions correctly. • Desiree answered 7 out of every 10 questions correctly. • Nick answered 4 out of every 5 questions correctly
Which student answered more than 80% of the questions correctly?
A. Molly B. Brittany C. Desiree D. Nick
8. If the price of a can of beans is raised from 50 cents to 60 cents, what is the percent increase in the price?
A. 83.3% B. 20.0% C. 16.7% D. 10.0%
9. Taylor was earning an income of $1,000 a week. Then his income was reduced by 10%. Two months later, his income increases by 10%. How much is Taylor earning, in dollars, after his income increases?
A. $990 B. $1,000 C. $1,100

PROPORTIONAL PROBLEM SOLVING
68
10. Jill and Dushawn joined a book club in middle school. The picture below shows how many books
Jill and Dushawn each read in September and December. In September, Jill read 5 books and
Dushawn read 6 books. In December, Jill read 8 books and Dushawn read 9 books.
September December
Jill
Jill
Dushaw
n
Dushaw
n
Dushawn thinks that the amount of books he and Jill read from September to December is the
same. Use mathematics to explain how Dushawn might have justified his claim.
Jill thinks that she has read more books than Dushawn from September to December. Use
mathematics to explain how Jill might have justified her claim.