Title : Chronic suppression of PDE10A alters striatal
48
JPET #173294 1 Title : Chronic suppression of PDE10A alters striatal expression of genes responsible for neurotransmitter synthesis, neurotransmission and signaling pathways implicated in Huntington’s Disease. Robin J. Kleiman, Lida H. Kimmel, Susan E. Bove, Thomas A. Lanz, John F. Harms, Alison Romegialli, Kenneth S. Miller, Amy Willis, Shelley des Etages, Max Kuhn, and Christopher J. Schmidt Neuroscience Research Unit (RJK, LHK, SEB, TAL, JFH, AR, AW, CJS) Genetically Modified Animals (KSM), Cardiovascular and Metabolic Disease Research Unit (SdE), Biostatistics Unit (MK) , Pfizer Global Research and Development, Pfizer, Inc., Eastern Point Road, Groton CT 06379. JPET Fast Forward. Published on October 5, 2010 as DOI:10.1124/jpet.110.173294 Copyright 2010 by the American Society for Pharmacology and Experimental Therapeutics. This article has not been copyedited and formatted. The final version may differ from this version. JPET Fast Forward. Published on October 5, 2010 as DOI: 10.1124/jpet.110.173294 at ASPET Journals on December 26, 2018 jpet.aspetjournals.org Downloaded from
Transcript of Title : Chronic suppression of PDE10A alters striatal

JPET #173294
1
Title : Chronic suppression of PDE10A alters striatal expression of genes responsible for
neurotransmitter synthesis, neurotransmission and signaling pathways implicated in
Huntington’s Disease.
Robin J. Kleiman, Lida H. Kimmel, Susan E. Bove, Thomas A. Lanz, John F. Harms, Alison
Romegialli, Kenneth S. Miller, Amy Willis, Shelley des Etages, Max Kuhn, and Christopher J.
Schmidt
Neuroscience Research Unit (RJK, LHK, SEB, TAL, JFH, AR, AW, CJS) Genetically Modified
Animals (KSM), Cardiovascular and Metabolic Disease Research Unit (SdE), Biostatistics Unit
(MK) , Pfizer Global Research and Development, Pfizer, Inc., Eastern Point Road, Groton CT
06379.
JPET Fast Forward. Published on October 5, 2010 as DOI:10.1124/jpet.110.173294
Copyright 2010 by the American Society for Pharmacology and Experimental Therapeutics.
This article has not been copyedited and formatted. The final version may differ from this version.JPET Fast Forward. Published on October 5, 2010 as DOI: 10.1124/jpet.110.173294
at ASPE
T Journals on D
ecember 26, 2018
jpet.aspetjournals.orgD
ownloaded from

JPET #173294
2
Running title: PDE10 suppression affects transmitter and signaling genes
Corresponding Author: Robin J Kleiman, Ph.D.
Neuroscience Research Unit
Eastern Point Road
Pfizer Inc, Global Research and Development
Groton, CT
Email: [email protected]
44 Text pages; 4 Tables; 4 Figures; 2 Supplementary Tables; 40 References
Abstract -243 words
Introduction-436 words
Discussion-1606 words
Nonstandard Abbreviations:
PDE10A, Phosphodiesterase 10A, Phosphodiesterase, PDE; TP-10: 2-{4-[-Pyridin-4-yl-1-(2,2,2-
trifluoro-ethyl)-1H-pyrazol-3-yl]-phenoxymethyl}-quinoline succinic acid; CREB, cAMP
responsive element binding protein; CRE, cAMP Response Element, RT-PCR, Real Time-
Polymerase Chain Reaction;WT, wild type; KO, knockout; PKA, Protein kinase A; ERK,
Extracellular signal-regulated kinase; MSK1, mitogen- and stress-activated kinases 1; FDR,
False Discovery Rate;DARPP32, dopamine- and cAMP-regulated phosphoprotein-32;
H3,Histone 3; HD, Huntington’s Disease; ChAT, Choline acetyltransferase; GAD67, Glutamate
decarboxylase 1,; DGAT2, Diacylglycerol O-acyltransferase ; PDE1C, Phosphodiesterase 1C,;
HDAC, Histone deacetylase
Recommended Section Assignment: Cellular and Molecular
This article has not been copyedited and formatted. The final version may differ from this version.JPET Fast Forward. Published on October 5, 2010 as DOI: 10.1124/jpet.110.173294
at ASPE
T Journals on D
ecember 26, 2018
jpet.aspetjournals.orgD
ownloaded from

JPET #173294
3
Abstract:
Inhibition of phosphodiesterase 10A (PDE10A) promotes cyclic nucleotide signaling, increases
striatal activation and decreases behavioral activity. Enhanced cyclic nucleotide signaling is a
well-establish route to producing changes in gene expression. We hypothesized that chronic
suppression of PDE10A activity would have significant effects on gene expression in the
striatum. A comparison of the expression profile of PDE10A knockout mice (KO) and wild-type
(WT) mice following chronic PDE10A inhibition revealed altered expression of 19 overlapping
genes with few significant changes outside the striatum or following administration of a
PDE10A inhibitor to KO animals. Chronic inhibition of PDE10A produced up-regulation of
mRNAs encoding genes that included prodynorphin, synaptotagmin10, phosphodiesterase 1C
(PDE1C), glutamate decarboxylase 1 (GAD67), diacylglycerol O-acyltransferase (DGAT2) and
a down regulation of mRNA encoding choline acetyltransferase (ChAT) and Kv1.6, suggesting
long-term suppression of the PDE10A enzyme is consistent with altered striatal excitability and
potential utility as a antipsychotic therapy. Additionally, upregulation of mRNA encoding
histone H3 and downregulation of histone deacetylase 4, follistatin and claspin mRNAs suggests
activation of molecular cascades capable of neuroprotection. We utilized lentiviral delivery of
CRE-luciferase reporter constructs into the striatum and live animal imaging of TP-10 induced
luciferase activity to further demonstrate PDE10 inhibition results in CRE-mediated
transcription. Consistent with potential neuroprotective cascades, we also demonstrate
phosphorylation of mitogen- and stress-activated kinases 1 (MSK1) and histone H3 in vivo
following TP-10 treatment. The observed changes in signaling and gene expression are predicted
to provide neuroprotective effects in models of Huntington’s Disease.
This article has not been copyedited and formatted. The final version may differ from this version.JPET Fast Forward. Published on October 5, 2010 as DOI: 10.1124/jpet.110.173294
at ASPE
T Journals on D
ecember 26, 2018
jpet.aspetjournals.orgD
ownloaded from

JPET #173294
4
Introduction:
Phosphodiesterase 10A (PDE 10A) is one of the eleven families of phosphodiesterases that
serve to limit cyclic nucleotide signaling via enzymatic hydrolysis of these widely utilized
second messengers. Phosphodiesterase (PDE) enzymes are precisely localized within specific
subcellular compartments to regulate discrete pools of cyclic nucleotides sub-serving
functionally distinct signaling events (Baillie et al., 2005). PDE10A is a dual-substrate PDE
expressed at high levels within medium spiny neurons of both the indirect and direct output
pathways of the striatum (Seeger et al., 2003; Coskran et al., 2006; Xie et al., 2006) where it is
primarily associated with membranes (Kotera et al., 2004; Xie et al., 2006). Outside the striatum,
PDE10A appears to be associated with the perinuclear region of neurons throughout the brain
(Seeger et al., 2003; Coskran et al., 2006). In vivo pharmacological inhibition of PDE10A has
been shown to produce a restricted accumulation of cGMP and cAMP within the striatum and to
trigger transient increases in the phosphorylation of CREB (Schmidt et al., 2008). Other studies
have shown enhanced phosphorylation of Extracellular signal-regulated kinase (ERK), protein
kinase A (PKA)-activated epitopes of dopamine- and cAMP-regulated phosphoprotein-32
(DARPP32) and GluR1 subunits following PDE10A inhibition (Siuciak et al., 2006a; Nishi et
al., 2008; Grauer et al., 2009).
Behavioral responses to acute inhibition with PDE10A inhibitors are consistent with striatal
activation and include decreases in spontaneous and amphetamine-stimulated locomotor activity
as well as disruption of conditioned avoidance responding (Siuciak et al., 2006a; Schmidt et al.,
2008). The behavioral consequences of PDE10A inhibition combined with the associated
biochemical indicators of striatal activation suggest that PDE10A inhibition can enhance the
signaling of medium spiny neurons to alter functional responses of the basal ganglia. Chronic
This article has not been copyedited and formatted. The final version may differ from this version.JPET Fast Forward. Published on October 5, 2010 as DOI: 10.1124/jpet.110.173294
at ASPE
T Journals on D
ecember 26, 2018
jpet.aspetjournals.orgD
ownloaded from

JPET #173294
5
suppression of PDE10A activity might therefore be expected to drive significant changes in
striatal gene expression. In the current study we use expression profiling following chronic
suppression of PDE10A activity via an inhibitor or gene knockout to identify significant and
overlapping changes in striatal gene expression. The observed changes in gene expression are
indicative of striatal activation and a putative neuroprotective signaling cascade. We also
generated lentiviral constructs to deliver a cAMP Response Element (CRE)-luciferase reporter
into mouse striatum and employed live animal imaging of light generated by the luciferase
reporter to confirm the role of CRE-mediated transcription in response to PDE10A inhibition.
Furthermore, acute pharmacological inhibition of PDE10A activity produced changes in the
phosphorylation state of multiple signaling kinases in the ERK pathway including ERK, MSK1
and the MSK1 substrate histone H3. This cascade has been suggested to provide neuroprotection
in preclinical models of Huntington’s disease (HD)(Roze et al., 2008).
This article has not been copyedited and formatted. The final version may differ from this version.JPET Fast Forward. Published on October 5, 2010 as DOI: 10.1124/jpet.110.173294
at ASPE
T Journals on D
ecember 26, 2018
jpet.aspetjournals.orgD
ownloaded from

JPET #173294
6
Methods:
Compounds:
TP-10 was synthesized at Pfizer Global Research and Development laboratories in Groton, CT.
Chronic dosing of WT and KO animals:
PDE10A knockout animals backcrossed on C57Bl6 background have been previously described
(Siuciak et al., 2006b). WT and PDE10A KO littermate mice (n=6 per group) were dosed daily
for 18 days with TP-10 by oral gavage (25mg/kg 2.5 mg/mL solution; dose volume of 10 mL/kg)
or methylcellulose vehicle 10 mL/kg body weight. Mice were housed singly and provided
routine ad lib feeding. Animals were sacrificed 1 day after the final dose of drug by CO2
euthanasia. Brains were removed and followed by dissection of striatum, hippocampus and
frontal cortex, and snap frozen. All animal treatment protocols were approved by Pfizer’s
Institutional Care and Use Committee and were compliant with Animal Welfare Act regulations.
Affymetrix chip profiling and data analysis:
RNA isolation and hybridizations to mouse 430 2.0 whole genome Affymetrix chips were performed by
Gene Logic. CEL files data were normalized using Robust Multi-array Analysis (RMA) and subjected to
pairwise comparison followed by Benjamini and Hochberg false discovery rate (FDR) correction. Probe
sets with the designation “_x” were removed from the dataset for potential lack of specificity. Probe
translation and pathway analysis was performed in IPA. Probes that could not be translated to genes
within IPA were identified using NetAffx (Affymetrix).
RT-PCR confirmation of changes in gene expression:
Total RNA was isolated from the striatum of PDE10A KO and PDE10A WT male mice (N=8
per group) using the Qiagen RNeasy Lipid Tissue Mini Kit (Qiagen, Valencia, CA) and cDNA
was made with Applied Biosystems High Capacity RNA-to-cDNA Master Mix (Applied
Biosystems, Foster City, CA) using 1 μg total RNA. Quantitative RT-PCR was performed with
This article has not been copyedited and formatted. The final version may differ from this version.JPET Fast Forward. Published on October 5, 2010 as DOI: 10.1124/jpet.110.173294
at ASPE
T Journals on D
ecember 26, 2018
jpet.aspetjournals.orgD
ownloaded from

JPET #173294
7
TaqMan® assays from Applied Biosystems using primer sets detailed in Table III. All qRT-PCR
assays were performed using TaqMan® Gene Expression Master Mix (Applied Biosystems,
Foster City, CA) and the following cycling conditions: (1) 50 °C hold for 2 min, (2) 95 °C hold
for 10 min, (3) 40 cycles of 3 sec at 95 °C, 30 sec at 60 °C. Ribophorin (Rpn1) was used as the
endogenous control gene and relative quantities for gene expression were calculated using RQ
manager software (Applied Biosystems, Foster City, CA).
Phosphoprotein Profiling:
CD-1 mice dosed with vehicle, haloperidol (0.32mg/kg) or TP-10 (3.2mg/kg), s.c in a vehicle
consisting of 30% b-cyclodextrin for the indicated times were sacrificed by 3 second focused
microwave irradiation to optimally preserve phosphorylation state of selected epitopes. Dissected
striatum were placed on dry ice and stored at -70 C. Homogenates prepared on a wt/vol basis
(100ug/uL) in 25mM Tris-HCL pH 7.4, 150mM NaCl, 0.1% NP-40, and one complete protease
inhibitor tablet (Roche). Samples homogenized on Mixer-Mill 300 (Retsch) at 25 shakes/sec for
4 min were placed on wet ice with 30ul of homogenate mixed with 50uL 4x LDS sample buffer
(Invitrogen) including 1mM DTT and 90uL water and warmed to 70oC for 10 minutes. Samples
(10 ul) were loaded onto EPAGE gels (Invitrogen) with seeBlueplus2 makers and transferred to
nitrocellulose using the I-blot system (Invitrogen). Membranes were blocked with Rockland
Near Infrared blocking solution for 1 hour and primary antibodies added overnight at 4 oC in
50/50 Rockland Block/PBS with 0.01% Tween 20. Blots were washed in PBS 0.01% Tween 20.
Incubation in secondary antibodies, goat anti-rabbit Alexa-680 and/or goat anti-mouse Alexa 800
(1:10K) were added before washing with PBS 0.01% Tween20 and imaging on the Odyssey
System (LiCor). Changes in phophoproteins were normalized to total ERK (Cell Signaling
#4696) at 1:5000. Background was removed using the median of 3 pixels from above and below
This article has not been copyedited and formatted. The final version may differ from this version.JPET Fast Forward. Published on October 5, 2010 as DOI: 10.1124/jpet.110.173294
at ASPE
T Journals on D
ecember 26, 2018
jpet.aspetjournals.orgD
ownloaded from

JPET #173294
8
the band of interest. Primary phospho-specific antibodies were from the following sources and
used at the indicated dilutions; ERK1/2 pTpY185/187 (Biosource #44-680G) at 1:5000, pCREB
ser133 (UPSTATE#05-807) at 1:2000 MSK pSer376 (Cell Signaling #9591) at 1:5000 and
Histone pH3Ser10(Cell Signaling) at 1:1000.
Construction of CRE-Luciferase reporter lentivirus:
A synthetic DNA (Integrated DNA Technologies, Coralville, Iowa, USA) containing six cyclic
AMP response elements (TGACGTCA) separated by 7 base pair spacers, followed by a 13 bp
minimal promoter sequence and a chimeric intron (pRL-SV40; Promega, Madison, Wisconsin,
USA) was cloned into the Xho/EcoRV sites of pGL4.10 (Promega) upstream of the luciferase
gene. Subsequently, the Xba to EcoRI sites were removed and subcloned into a pLL3.7 lentiviral
vector (Rubinson et al., 2003) which had been modified using Xba and EcoRI to remove the
polymerase III U6 promoter sequence. The final construct contained six copies of the cAMP
response element, followed by the Elb minimal promoter and the Luciferase 2 open reading
frame. High titer lentivirus (109 IU/mL) for injection was produced in 293FT cells (Invitrogen,
Carlsbad , CA, USA). 293FT cells were transfected using Lipofectamine 2000 per
manufacturer’s instructions (Qiagen, Valencia, CA, USA) overnight in two T175 flasks at 70%
confluence with a 3:1 ratio of Virapower Packaging Plasmids (Invitrogen, Carsbad, CA, USA)
and pLL3.7 containing 6x Cre-Luc2. Supernatants containing viral particles were collected after
14 hours and concentrated over a 100kd mw frit (Millipore, Billerica, MA, USA). Supernatants
were then ultracentrifuged for 3 hours, 25rpm, at 4 degrees Celsius. All supernatant was then
removed from the viral pellet and 200uL PBS was added. The pellet was resuspended by gentle
rocking overnight at 4 degrees Celsius. Viral particles were aliquoted in 10uL volumes and
This article has not been copyedited and formatted. The final version may differ from this version.JPET Fast Forward. Published on October 5, 2010 as DOI: 10.1124/jpet.110.173294
at ASPE
T Journals on D
ecember 26, 2018
jpet.aspetjournals.orgD
ownloaded from

JPET #173294
9
stored at -80 degrees Celsius until used. Functional viral titers were determined by Flow
cytometry using a BD FACSCalibur (BD Biosciences, San Jose, CA, USA)
Stereotaxic injection:
Fifteen male CD-1 mice, 60-90 days old, were ordered from Charles River and acclimated in-
house for 1 week prior to the start of the experiment. Mice were housed in 12:12 light/dark cycle
and fed standard chow available ad libitum. On the day of the stereotaxic surgery each mouse
was anesthetized with isoflurane (2% in oxygen). The top of the head was shaved and the mouse
was placed in a stereotaxic frame. The eyes were coated with lubricant to prevent drying out and
the shaved portion of the head and surrounding area was disinfected. Using a no. 15 blade, a
midline skin incision was made and a sterile swab was used to dry the surface of the scull.
Measurements were made from bregma and a small burr hole was drilled at the site of the
injection. The coordinates used for the striatal injections were as follows: left striatum =
Anterior/Posterior (A/P) +0.5, Lateral (L) +2.0, Dorsal/Ventral (D/V) (-) 3.0-2.0 mm. Each
mouse received 2 ul of high titer lenti-virus into the left striatum. The virus was delivered using a
10 ul Hamilton syringe with a 30g blunt tip needle. The syringe was attached to a syringe pump
to enable precise flow rate and volume. For the injection, the needle was slowly inserted to the
first D/V coordinate and left in place for 4 minutes to allow the tissue to settle. The virus was
injected at a rate of 0.25 μl/min. After 1 μl was injected (4 min) the needle was slowly raised to
the 2nd D/V coordinate for the second 1 μl injection (remaining 4 min). When the injection was
complete the needle was left in place for an additional 4 minutes to allow for diffusion of the
virus into the surrounding tissue before being slowly withdrawn. The animals were sutured with
6.0 absorbable Vicryl polysorb suture and administered a single 5 mg/kg, s.c. injection of
This article has not been copyedited and formatted. The final version may differ from this version.JPET Fast Forward. Published on October 5, 2010 as DOI: 10.1124/jpet.110.173294
at ASPE
T Journals on D
ecember 26, 2018
jpet.aspetjournals.orgD
ownloaded from

JPET #173294
10
Rimadyl (carprofen) and 500 μl saline sc. A topical antibiotic was used on the incision site and
the animals were allowed to recover in a warm cage prior to returning to the holding room.
Imaging of CRE-Luciferase reporter:
Mice were imaged using an IVIS® 200 Bioluminescent Imaging System (Caliper Life Sciences,
Hopkinton, MA). Each mouse was injected i.p. with 150 mg/kg D-luciferin K+ salt (Caliper Life
Sciences, Hopkinton, MA) substrate 10 min prior to imaging. The mice were then anesthetized
with 2.5-3% isoflurane in oxygen, placed in the prone position on the IVIS® platform and
imaged for 1 min. Baseline images were obtained immediately prior to injection of TP-10
compound (3.2 mg/kg, sc in 10% β−cyclodextrin vehicle). Sixteen hours post TP-10
administration, the mice were imaged again. Images obtained from the IVIS® 200 are an overlay
of the bioluminescent signal as a pseudocolor image on a black and white photograph. Data are
presented as total photon flux (photons/second; p/s) from a 1.5 cm2 circular region of interest.
Histology:
Ten weeks post lentiviral injection, 3 mice were selected for histological analysis to assess the
efficiency of lentiviral transduction in the striatum. The mice were deeply anesthetized with
sodium pentobarbital and transcardially perfused with ice-cold saline, followed by ice-cold 4%
paraformaldehyde solution in phosphate buffer. The brains were removed and post-fixed
overnight in 4% paraformaldehyde at 4°C before transferring to a 20% sucrose solution in
phosphate buffer. Brains were sectioned and stained with rabbit polyclonal anti-green fluorescent
protein (A11122; Invitrogen, Carlsbad, CA) at FD Neurotech.
This article has not been copyedited and formatted. The final version may differ from this version.JPET Fast Forward. Published on October 5, 2010 as DOI: 10.1124/jpet.110.173294
at ASPE
T Journals on D
ecember 26, 2018
jpet.aspetjournals.orgD
ownloaded from

JPET #173294
11
Results:
Chronic genetic and pharmacological suppression of PDE10A enzyme activity produces
significant changes in striatal gene expression.
Vehicle or 2-{4-[-Pyridin-4-yl-1-(2,2,2-trifluoro-ethyl)-1H-pyrazol-3-yl]-phenoxymethyl}-
quinoline succinic acid (TP-10), a selective PDE10A inhibitor (IC50= 0.3nM ; (Schmidt et al.,
2008)), was administered once daily for 18 days to both WT and PDE10A knockout mice. Oral
administration of TP-10 at 25 mg/kg results in a free plasma concentration of 7 nM or >10-fold
above the PDE10A IC50 1 h after drug administration (data not shown). Since TP-10 is brain
permeable, this dose should completely inhibit the enzyme and provide a comparator for changes
in gene expression between WT and KO animals. Given the high degree of selectivity (>1000
fold) of TP-10 over all other PDE enzymes, no off-target PDE activity is expected to contribute
to the changes in gene expression identified. This was confirmed by examination of the effect of
TP-10 on differential gene expression in PDE10A KO mice which produced no statistically
significant change in gene expression for any genes in either striatum or hippocampus after
correction for multiple comparisons using a Benjamini and Hochberg False Discovery Rate
(FDR) of p<0.05.
Following chronic dosing with vehicle or TP-10, RNA isolated from striatum and hippocampus
and subjected to microarray hybridization. Following Robust Multi-array Analysis (RMA)
normalization of hybridization intensities, pairwise comparisons were made between vehicle and
TP-10 treatment for WT and PDE10A KO animals as well as between the WT and KO animals
followed by application of Benjamini and Hochberg correction for multiple comparisons.
Changes in striatal gene expression that exhibited statistically significant differences between
vehicle and TP-10 in WT animals (FDR p<0.05) are displayed in Table 1, rank ordered by
This article has not been copyedited and formatted. The final version may differ from this version.JPET Fast Forward. Published on October 5, 2010 as DOI: 10.1124/jpet.110.173294
at ASPE
T Journals on D
ecember 26, 2018
jpet.aspetjournals.orgD
ownloaded from

JPET #173294
12
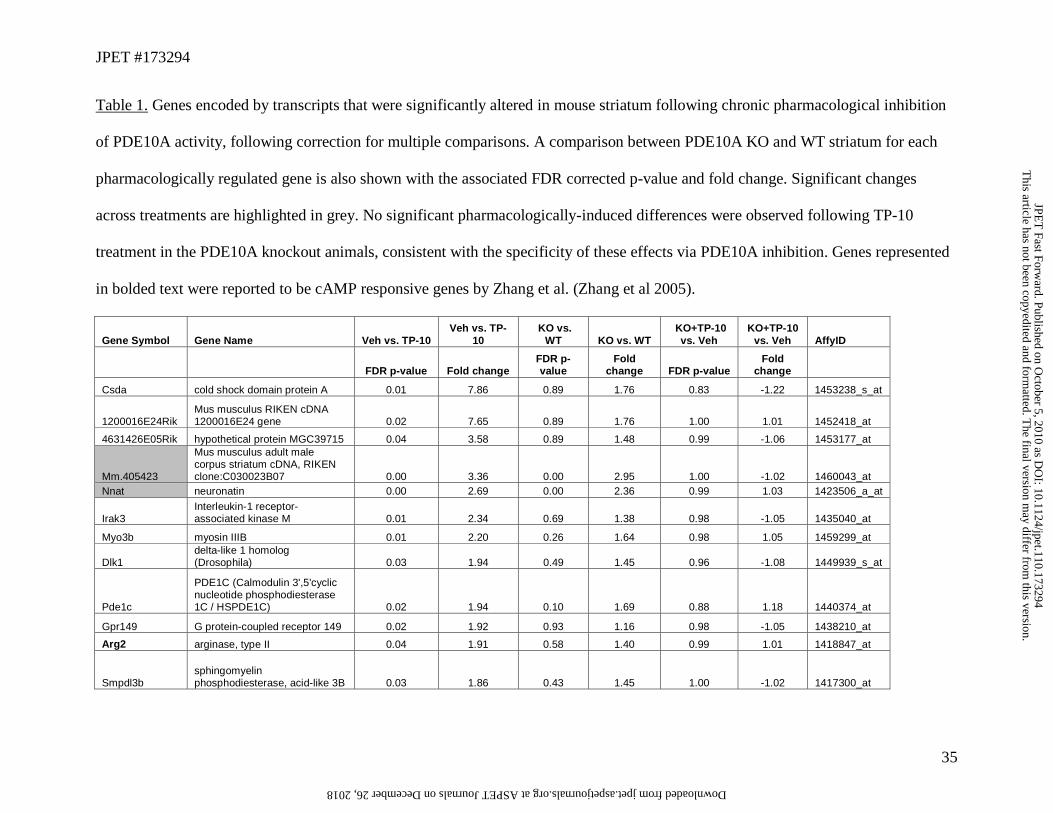
observed fold change in expression. Among the mRNAs significantly affected by TP-10
treatment were several transcripts encoding genes involved in neurotransmitter synthesis or
catabolism, including a 1.38 fold downregulation of the mRNA for the acetylcholine synthetic
enzyme ChAT. Additionally a 1.2 fold upregulation of mRNA for the GABA synthetic enzyme
GAD67 and 4-aminobutyrate aminotransferase, a GABA catabolic enzyme were observed
following chronic TP-10 treatment. Similarly the dynorphin precursor prodynorphin was
significantly upregulated 1.76 fold following chronic TP-10 treatment. ChAT and prodynorphin
were similarly affected in the WT vs. KO comparison. The arginase, type II enzyme, responsible
for limiting the availability of arginine required for production of the neurotransmitter NO was
upregulated by both TP-10 treatment and KO vs. WT comparisons, but only reached statistical
significance in the TP-10 treated WT animals. In addition to neurotransmitter regulation, many
genes involved in neurotransmission and neuronal excitability were altered by chronic exposure
to TP-10 including synaptotagmin X (increased 1.6 fold), the voltage gated potassium channel
protein Kv1.6 (decreased 1.64 fold) and the dihydropyridine-sensitive L-type calcium channel
beta 3 subunit (decreased 1.5 fold) and the synaptic rhoGEF kinase kalirin (decreased 1.6 fold).
The specificity of the TP-10 induced changes is highlighted by the lack of any significant
changes in transcript levels identified in the KO following TP-10 treatment, including any
significant changes among genes identified as significant following TP-10 treatment in the WT
mice (p-values are presented in Table 1).Very few significant changes were observed between
WT and KO comparisons of hippocampus (Rab11b, Lix1, Lnpep and Psmc2, FDR <0.05) and of
these only 2 were larger than a 1.3 fold change (Lix1 and Lnpep). Only 2 probe sets were altered
in hippocampus following TP-10 treatment and they did not map to any known genes, indicating
that the chronic changes in gene expression were largely confined to the striatum, where
This article has not been copyedited and formatted. The final version may differ from this version.JPET Fast Forward. Published on October 5, 2010 as DOI: 10.1124/jpet.110.173294
at ASPE
T Journals on D
ecember 26, 2018
jpet.aspetjournals.orgD
ownloaded from

JPET #173294
13
PDE10A expression is most highly concentrated (Seeger et al., 2003;Coskran et al., 2006)). A
complete list of striatal genes that displayed significant differential expression in a comparison of
WT vs. KO gene expression (FDR p<0.05) are displayed in Table 2. A set of 21 probe sets
representing 19 potential genes were significantly altered in both TP-10 treated vs. vehicle as
well as in the PDE 10 KO vs. WT comparisons, and are highlighted in grey in Table 1.
We were able to identify 18 overlapping genes with Taqman assays for RT-qPCR comparisons
between untreated WT and KO striatum utilizing a separate cohort of similarly aged animals to
provide independent confirmation of affected genes (probe set 1460043_at was significant across
both comparisons and mapped to an the unidentified cDNA mM.405423; it was not evaluated as
Taqman assays were not available). Seven additional genes exhibiting a significant change in the
affymetrix chip analysis of vehicle vs. TP-10 comparison and were selected for RT-PCR
confirmation in a replicate cohort of PDE10A WT and KO animals. Transcripts encoding 15 of
the 18 expected overlapping genes, an additional 3 genes with less stringent FDR corrected p-
values for the WT vs. KO comparison (p=0.1 and 0.25) showed experimentally determined
changes in gene expression via RT-PCR and are shown in Table 3. This result suggests that
stringent statistical criteria utilizing a FDR correction of p<0.05 may slightly underestimate the
actual number of genes in the overlapping sets, however we did fail to replicate the significant
effect of chronic PDE10A suppression on ChAT mRNA by RT-PCR, despite observed changes
in both WT vs. KO and TP-10 vs. vehicle comparisons, demonstrating that there is not perfect
correspondence between methods The relative magnitude and direction of changes in gene
expression observed by RT-PCR matched observations from affymetrix chip data.
To facilitate pathway level analysis of changes in gene expression produced by chronic PDE10A
suppression, two different approaches were taken to analyze the data. First, the significantly
This article has not been copyedited and formatted. The final version may differ from this version.JPET Fast Forward. Published on October 5, 2010 as DOI: 10.1124/jpet.110.173294
at ASPE
T Journals on D
ecember 26, 2018
jpet.aspetjournals.orgD
ownloaded from

JPET #173294
14
affected genes that survived FDR correction were analyzed using Ingenuity Pathway Analysis
(IPA) software (version 8.0) to identify top scoring canonical pathways. The eIF4 pathway was
identified as the sole overlapping pathway via identification of 2 pathway genes (EIF2C4,
PPP2R5B) present in both TP-10 induced genes and KO-induced gene sets. This was in contrast
to observations that 21 of the 95 probes sets altered by TP-10 were also significantly altered in
the KO vs. WT comparison. The latter comparison yielded 68 probe sets significantly altered out
of 45101 monitored on the microarray. Given the size of these datasets relative to the number of
total probe sets measured, only 0.14 probe sets would be expected to overlap by random chance.
The identification of 21 overlapping significant probe sets is highly significant using a Poisson
approximation of binomial probability (p=2.814 X 10-38). Additionally, a strong correlation
(r2=0.9) was observed between the direction and fold change in the 19 genes that were
significantly altered in both the WT vs. KO and the TP-10 vs. vehicle comparisons (Figure 1).
Identification of a single overlapping pathway between these data sets suggests that the FDR
correction may result in too small a data set for pathway analysis. To explore this possibility, we
repeated pathway analysis using larger gene sets chosen according to their uncorrected p-values.
We selected genes with nominal p value <0.01 and a minimum fold change > 1.2 for analysis in
IPA. Using these criteria we found 364 probe sets following chronic PDE10A inhibition and 289
probe sets altered in PDE10A KO (Supplemental Table 1). Analysis of these probe sets using
IPA software highlighted statistically significant differences in 4 common canonical pathways
(highlighted in bold font in Table 4). These pathways included the polo-like kinases (PLK)
which includes checkpoint kinases, the p38/MAPK (ERK) pathway, the protein kinase A (PKA)
pathway, and beta-adrenergic signaling. In addition, a significant enrichment was observed in a
cAMP-responsive CREB gene list previously described by Zhang and colleagues, which are
This article has not been copyedited and formatted. The final version may differ from this version.JPET Fast Forward. Published on October 5, 2010 as DOI: 10.1124/jpet.110.173294
at ASPE
T Journals on D
ecember 26, 2018
jpet.aspetjournals.orgD
ownloaded from

JPET #173294
15
identified in bold font in Table 1 (Zhang et al., 2005). We also identified genes altered following
TP-10 treatment of PDE10A KO striatum for comparison with the same criteria used for IPA
pathway analysis. Although no genes reached statistical significance after correction for multiple
comparisons, 34 genes were identified with a nominal p-value of less than 0.01 and a greater
than 1.2 fold change (Supplementary Table 2). However, none of these genes overlapped with
those identified following drug treatment in the WT animals.
Consistent with effects on 2 of these pathways, acute PDE10A inhibition has been previously
reported to produce changes in cAMP and the phosphorylation state of PKA pathway targets
including pCREB, GluR1 Ser845, DARPP32 Thr34 (Nishi et al., 2008; Grauer et al., 2009).
Similarly, the phosphorylation of ERK has been previously reported in response to PDE10A
inhibition, suggesting the identified overlapping pathways accurately reflect effects of PDE10A
disruption. A common theme among PKA and ERK affected pathways is that they have been
previously proposed as therapeutic strategies for treating Huntington’s disease (Steffan et al.,
2000; Giampa et al., 2006; Roze et al., 2008; )
Acute administration of TP-10 drives CRE-mediated transcription within the striatum in vivo.
To further demonstrate the functional effects of CREB phosphorylation on transcriptional
activation, we created a reporter vector with 6X-CREB Response Elements (CRE) upstream of a
luciferase reporter gene cloned into a lentiviral (pLL3.7) vector. High titer virus was prepared
and stereotaxically administered to the striatum of adult mice. Animals were allowed to recover
for 1 week prior to the administration of TP-10 (3.2 mpk, s.c.) and subsequent imaging. A
separate cohort of animals that received stereotaxic injection of the CRE-luciferase lentiviral
reporter into the striatum showed that the peak transcriptional response in response to PDE10A
inhibition was detected via in vivo imaging of luciferase activity at 16 hours post drug treatment
This article has not been copyedited and formatted. The final version may differ from this version.JPET Fast Forward. Published on October 5, 2010 as DOI: 10.1124/jpet.110.173294
at ASPE
T Journals on D
ecember 26, 2018
jpet.aspetjournals.orgD
ownloaded from

JPET #173294
16
(data not shown). This is consistent with a need to translate and accumulate sufficient luciferase
enzyme prior to significant detection of a bioluminescent enzyme derived signal over skulls of
treated animals. All studies were subsequently carried out approximately 16 hours post drug
treatment, when animals were administered luciferase substrate (luciferin) and briefly
anesthetized for imaging on an IVIS bioimager. Baseline imaging of animals showed no
significant luciferase bioluminescence in the brains of injected animals. TP-10 injected animals
exhibited robust bioluminescence over brain regions approximating the striatum, and confirming
a robust transcriptional activation of the striatally-injected reporter construct (Figure 2A).
Repeated injection and imaging of these mice demonstrated the response of the reporter
construct was stable over several weeks (Figure 2B). Animals were sacrificed 10 weeks post
stereotaxic injection and histochemical verification of the striatal location for the reporter
expression of GFP was confirmed (Figure 2A).
Acute inhibition of PDE10A increased phosphorylation of striatal ERK substrates.
To further probe the ERK pathway, we evaluated the phosphorylation state of several potential
ERK pathway components following PDE10A inhibition including ERK, MSK, and H3. Mice
were administered 3.2 mpk of TP-10 s.c., a dose previously shown to produce elevations of
striatal cAMP and cGMP as well as activity in established models of antipsychotic efficacy
(Schmidt et al., 2008). Western blot analysis of samples probed with antibodies to phospho-
epitopes of ERK (ERK1/2 pTpY185/187 ) and MSK1 (Ser 376) found both kinases were
phosphorylated rapidly and transiently following PDE10A inhibition, returning to baseline levels
by 3 hours post drug administration (Figure 3). MSK has been reported to phosphorylate both
CREB and histone H3, both of which can alter gene transcription (Deak et al., 1998; Arthur,
This article has not been copyedited and formatted. The final version may differ from this version.JPET Fast Forward. Published on October 5, 2010 as DOI: 10.1124/jpet.110.173294
at ASPE
T Journals on D
ecember 26, 2018
jpet.aspetjournals.orgD
ownloaded from

JPET #173294
17
2008). Consistent with this relationship, we observed an enhanced phosphorylation of Ser10 on
H3 histone, a substrate for MSK1 (Figure 3). It is worth noting that we also observed significant
upregulation of H3 histone mRNA in affy chip studies following chronic PDE10A inhibition (1.4
fold, p=0.01 following FDR correction).
MSK1 is reported to be phosphorylated within striatonigral and striatopallidal MSNs in response
to cocaine and haloperidol, respectively (Heffron and Mandell, 2005; Bertran-Gonzalez et al.,
2008). In our hands, the haloperidol-induced phosphorylation of ERK and MSK1 is significantly
smaller than that observed following inhibition of PDE10A, consistent with the mechanistic
distinction that the D2 antagonist only activates a subset of MSNs versus the simultaneous
activation of striatonigral and striatopallidal neurons by PDE10A inhibition (Figure 4).
Consistent with this, haloperidol did not produce detectable phosphorylation of MSK1 by
western blot analysis. The dose of haloperidol used in this experiment (0.32 mg/kg, s.c.) was 8X
higher than that needed to produce an ED50 response in the conditioned avoidance responding
assay (Schmidt et al., 2008). This assay is thought to be predictive of antipsychotic activity. By
comparison, the 3.2 mg/kg dose of TP-10 used in this experiment is only 3X the dose required to
produce a ED50 response in the conditioned avoidance response assay (Schmidt et al., 2008).
Thus, the smaller changes in phosphorylation produced by haloperidol as compared to TP-10 are
not due to sub-threshold activity of the drug. The enhanced MSK1 phosphorylation during
PDE10A inhibition treatment likely occurs in all MSNs, however the higher expression of MSK1
in D1-containing neurons (Bertran-Gonzalez et al., 2009) may contribute to the larger signal
observed following TP-10 administration. The MSK1 substrate, H3 showed an identical pattern
of phosphorylation.
This article has not been copyedited and formatted. The final version may differ from this version.JPET Fast Forward. Published on October 5, 2010 as DOI: 10.1124/jpet.110.173294
at ASPE
T Journals on D
ecember 26, 2018
jpet.aspetjournals.orgD
ownloaded from

JPET #173294
18
Discussion:
The current study utilized microarray profiling to characterize and contrast the effects of genetic
and pharmacological disruption of PDE10A. Changes in gene expression produced by both
approaches implicate PDE10A in the regulation of signaling cascades that impinge on PKA,
ERK and checkpoint kinase-mediated pathways. The lack of any significant changes in gene
expression produced by the PDE10A inhibitor TP-10 in PDE10A KO animal speaks to the high
degree of specificity of the gene expression signature produced by TP-10 in WT animals.
Similarly, the restriction of changes in gene expression identified within this study largely to the
striatum, despite evaluation of microarray data collected from hippocampus, suggests a lack of
circuit-level regulation of gene expression in other structures. These observations illustrate the
utility of using negative microarray data to demonstrate specificity of pathway manipulations and
differentiate PDE10A inhibitors from other antipsychotic approaches that have been previously
reported to alter gene expression in frontal cortex and striatal regions in rodents (MacDonald et
al., 2005) .
Analysis of changes in gene expression provides insight into striatal neurotransmitter systems
regulated by prolonged PDE10A inhibition with TP-10. The downregulation of mRNA encoding
cholinergic synthetic enzyme ChAT and upregulation of mRNA for the L-arginine catabolic
enzyme arginase II, in both PDE10A KO mice and following PDE10A inhibition, would be
expected to decrease availability of acetylcholine and NO, both used as neurotransmitters by
striatal interneurons. PDE10A protein is absent from striatal cholinergic interneurons ( Coskran
et al., 2006), suggesting changes in ChAT mRNA are a response to changes in neuronal activity
within MSNs. The utility of anticholinergics in the treatment of Parkinson’s disease, albeit
limited, is believed to be due to reductions in the exaggerated striatal output following loss of
This article has not been copyedited and formatted. The final version may differ from this version.JPET Fast Forward. Published on October 5, 2010 as DOI: 10.1124/jpet.110.173294
at ASPE
T Journals on D
ecember 26, 2018
jpet.aspetjournals.orgD
ownloaded from

JPET #173294
19
dopaminergic inhibition. Thus, the potential for decreased cholinergic signaling may be a
compensatory response to the enhanced striatal activation. Similarly, the breakdown of L-
arginine by arginase II regulates availability of L-arginine for NO production by NOS (Vockley
et al., 1996). Arginase II was recently identified as one of the most abundant transcripts
represented in D2-containing neurons using Translating Ribosome Affinity Purification (TRAP)
to characterize the translational profiles most highly represented in specific cell types (Doyle et
al., 2008). PDE10A inhibition elevates cGMP levels, increases the excitability of MSNs and the
probability that MSNs will fire action potentials in response to cortical stimulation, particularly
within the D2 expressing MSNs of the indirect pathway (West and Grace, 2004; Threlfell et al.,
2009). Thus, increased mRNA for arginase II in the chronic setting could represent a
compensatory response to limit excessive firing of the more excitable indirect pathway neurons.
However, transcriptional changes are not likely to be limited to indirect pathway neurons since
the upregulation of prodynorphin mRNA is often associated with activity-dependent signatures
of the cAMP dependent D1-mediated signaling cascades (Morris et al., 1988) and represents one
of the most abundant transcripts identified in D1 containing neurons by TRAP analysis of D1
expressing MSNs (Doyle et al., 2008).
The primary neurotransmitter of MSNs is GABA and preferential upregulation of mRNA
encoding the synthetic enzyme GAD67 has been previously associated with antagonism of D2
receptors and most clinically effective antipsychotic agents (Laprade and Soghomonian, 1995;
Zink et al., 2004). GAD67 mRNA was preferentially upregulated by the chronic suppression of
PDE10A activity by TP-10 administration but not genetic KO. Likewise, mRNA for 4-
aminobutyrate aminotransferase which encodes the transaminase responsible for GABA
catabolism, decreased in abundance, suggesting the potential for enhanced GABA levels in
This article has not been copyedited and formatted. The final version may differ from this version.JPET Fast Forward. Published on October 5, 2010 as DOI: 10.1124/jpet.110.173294
at ASPE
T Journals on D
ecember 26, 2018
jpet.aspetjournals.orgD
ownloaded from

JPET #173294
20
striatal neurons. Additionally, the mRNA encoding shaker family potassium channel Kv1.6 was
downregulated, and might be expected to increase the excitability of striatal neurons as has been
reported following acute inhibition of PDE10A (Threlfell et al., 2009). It is interesting to note
that downregulation of mRNA encoding potassium channel subunits and associated proteins in
brain tissue has been reported as a consequence of chronic exposure to both typical and atypical
antipsychotics and has been proposed as contributing primary mechanistic underpinnings of
antipsychotic efficacy across treatments (Duncan et al., 2008). Taken together, these changes in
gene expression within the striatal neurons are consistent with chronic changes in both direct and
indirect pathways and a prolonged increase in the excitability of striatal neurons that could be
therapeutically relevant in treating psychosis.
PDE10A KO animals exhibited a number of potential compensatory changes in gene expression
that were absent following pharmacological suppression of activity. The Dual Specificity
Phosphatase DUSP14 is a negative regulator of the mitogen-activated protein kinase
(MAPK)/extracellular signal–regulated kinase 1/2 (ERK1/2) pathway (Patterson et al., 2009) and
was upregulated in the striatum of PDE10A knockout mice. This could provide a compensatory
brake on the chronic stimulation of the ERK signaling cascade. Similarly, the PDE10A KO
animals display an upregulation of mRNA for CREM , the cAMP responsive element modulator
protein that contributes negative feedback control of CREB signaling (De Cesare and Sassone-
Corsi, 2000). Thus, several compensatory mechanisms to counteract the enhanced ERK and
CREB signaling have been invoked in the knockout animals that are not obvious following
inhibitor treatment.
Several lines of evidence suggest changes in transcriptional profiles produced by suppression of
PDE10A activity may offer neuroprotection in HD. Transcripts for PDE10A and PDE1B are
This article has not been copyedited and formatted. The final version may differ from this version.JPET Fast Forward. Published on October 5, 2010 as DOI: 10.1124/jpet.110.173294
at ASPE
T Journals on D
ecember 26, 2018
jpet.aspetjournals.orgD
ownloaded from

JPET #173294
21
abundant in striatum, but exhibit significant downregulation in HD brain and the R6/2 mouse
model. The decrease in PDE10A mRNA is due to decreases in transcriptional initiation of the
striatally expressed PDE10A2 gene, which initiates at sites 2 and 3 in the exon 1a-specific
promoter (Hu et al., 2004) and loss of the PDE10A enzyme early in disease has been proposed as
a contributing factor in progression of disease (Hebb et al., 2004). However, the loss of striatally
enriched transcripts early in disease or R6/2 model progression could be a consequence of
transcriptional dysfunction due to a direct interaction of soluble huntingtin protein with
transcription factors required to direct expression of particular mRNAs or compensation for
dysfunctional neuronal signaling. Studies of the regulation of the PDE10A promoter have not
revealed any candidate regulatory transcription factors capable of decreasing PDE10A mRNA as
observed in the R6/R2 mouse model (Hu et al., 2004). Given that inhibition of PDE10A is a
powerful inducer of CREB-mediated transcription in striatum, and the propensity of this circuit
to compensate for chronic deficits in signaling cascades, it seems possible that downregulation of
PDE10A early in the disease process may be an adaptive response to compensate for loss of
cAMP signaling. If so, therapeutic inhibition of the enzyme earlier in the disease (prior to loss of
the enzyme) may stall its progression. Consistent with this, Giampa et al (2009) have recently
reported that chronic PDE10A inhibition with TP-10 can provide striatal neuroprotection from
quinolinic acid lesions of the striatum (Giampa et al., 2009). This group has recently also
observed neuroprotection and improved life expectancy in the R6/2 HD model with chronic
administration of the PDE10A inhibitor TP-10 (Giampa et al., 2010). Downregulation of key
transcripts identified in the current study following chronic TP-10 treatment may contribute to
this neuroprotective effect including follistatin, claspin and histone deacetylase (HDAC) 4.
Follistatin is an endogenous antagonist of activin and its mRNA is highly enriched in MSNs
This article has not been copyedited and formatted. The final version may differ from this version.JPET Fast Forward. Published on October 5, 2010 as DOI: 10.1124/jpet.110.173294
at ASPE
T Journals on D
ecember 26, 2018
jpet.aspetjournals.orgD
ownloaded from

JPET #173294
22
from the D1 containing neurons in the direct pathway (Doyle et al 2008). Direct striatal
administration of recombinant human activin A has been demonstrated to be neuroprotective in
the quinolinic acid model of striatal neurodegeneration (Hughes et al., 1999). Additionally,
PDE10A inhibition induced a large downregulation of claspin, a checkpoint kinase (Mrc 1)
involved in S-phase checkpoint damage detection. Expanded CAG/CTG repeats can be detected
by checkpoint machinery via changes in their secondary structure. These expansions are prone to
chromosome breakage requiring DNA repair. Detection of DNA damage within neurons has
been associated with the induction of apoptotic cell death. Claspin checkpoint kinase (Mrc1)
inhibitors have been proposed as promising therapeutic target for degenerative trinucleotide
repeat diseases including Huntington’s Disease (Freudenreich and Lahiri, 2004; Lahiri et al.,
2004). HDAC inhibitors have also been proposed as therapeutic treatment for HD. The HDAC
inhibitor 4b, expected to inhibit both HDAC3 and HDAC4, provides significant neuroprotection
in the R6/2 model of HD (Thomas et al., 2008) and the genetic knockdown of HDAC4 has been
recently reported to improve the HD phenotype in the R6/2 mouse (Bates et al., 2009). The
downregulation of HDAC4 following chronic TP-10 treatment may provide an alternative path
to decreasing HDAC activity.
The potential significance of robust activation of the ERK pathway by TP-10 in striatum is
highlighted by studies in Huntington’s Disease animal models and post-mortem HD brain
analysis suggesting deficiencies in MSK1-induced phosphorylation of H3 or its transcription
may contribute to the degeneration of striatal neurons (Roze et al., 2008). Consistent with the
activation of the ERK cascade, we found enhanced phosphorylation of the nuclear ERK substrate
MSK1 at Ser376, an autophosphorylation site that suggests kinase activation (McCoy et al.,
2005). The overexpression of MSK1 has been demonstrated to provide neuroprotection in vitro
This article has not been copyedited and formatted. The final version may differ from this version.JPET Fast Forward. Published on October 5, 2010 as DOI: 10.1124/jpet.110.173294
at ASPE
T Journals on D
ecember 26, 2018
jpet.aspetjournals.orgD
ownloaded from

JPET #173294
23
models of polyglutamine expansion, suggesting that MSK1 activation, or downstream
upregulation of histone-mediated modifications, may be a viable approach to treatment of
Huntington’s Disease (Roze et al., 2008).
This is the first study to characterize the consequences of chronic PDE10A suppression on gene
expression. We have identified several novel changes in signaling within the ERK cascade that
support the therapeutic potential of PDE10A inhibitors in the treatment of both psychosis and
HD. Observed changes in gene expression within striatal neurotransmitter systems are consistent
with previous predictions that PDE10A inhibition may be a novel approach to the treatment of
schizophrenia by enhancing striatal output. The specific biochemical and transcriptional pattern
of activity produced by PDE10A inhibition reported here also points to the potential application
of such agents in neurodegenerative conditions such as HD. The current microarray analysis
highlights the power of evaluating therapeutic targets from both genetic and pharmacological
perspectives to gain a broader insight into the biological system impacted and to more fully
evaluate the therapeutic potential of novel biological targets.
This article has not been copyedited and formatted. The final version may differ from this version.JPET Fast Forward. Published on October 5, 2010 as DOI: 10.1124/jpet.110.173294
at ASPE
T Journals on D
ecember 26, 2018
jpet.aspetjournals.orgD
ownloaded from

JPET #173294
24
Acknowledgements: The authors would like to acknowledge the technical expertise of Kari
Fonseca, Fred Nelson, Caroline Proulx-LaFrance and the support of Patrick Verhoest and Dan
Morton in conducting these studies. We are grateful to Caroline Benn and Nick Brandon for
critical reading of this manuscript, and to Eric Blalock for helpful discussion and constructive
statistical advice.
This article has not been copyedited and formatted. The final version may differ from this version.JPET Fast Forward. Published on October 5, 2010 as DOI: 10.1124/jpet.110.173294
at ASPE
T Journals on D
ecember 26, 2018
jpet.aspetjournals.orgD
ownloaded from

JPET #173294
25
Authorship Contributions:
Participated in research design: Kleiman, Schmidt
Conducted experiments: Bove, Harms, Kimmel, Romegialli
Contributed new reagents: Miller, Willis
Performed data analysis: Kuhn, Des Etages, Lanz
Wrote the manuscripts: Kleiman, Schmidt
This article has not been copyedited and formatted. The final version may differ from this version.JPET Fast Forward. Published on October 5, 2010 as DOI: 10.1124/jpet.110.173294
at ASPE
T Journals on D
ecember 26, 2018
jpet.aspetjournals.orgD
ownloaded from

JPET #173294
26
References
Arthur JS (2008) MSK activation and physiological roles. Front Biosci 13:5866-5879.
Baillie GS, Scott JD and Houslay MD (2005) Compartmentalisation of phosphodiesterases and
protein kinase A: opposites attract. FEBS Lett 579:3264-3270.
Bates G (2009) CHDI 4th annual therapeutics conference
Bertran-Gonzalez J, Bosch C, Maroteaux M, Matamales M, Herve D, Valjent E and Girault JA
(2008) Opposing patterns of signaling activation in dopamine D1 and D2 receptor-
expressing striatal neurons in response to cocaine and haloperidol. J Neurosci 28:5671-
5685.
Bertran-Gonzalez J, Hakansson K, Borgkvist A, Irinopoulou T, Brami-Cherrier K, Usiello A,
Greengard P, Herve D, Girault JA, Valjent E and Fisone G (2009) Histone H3
Phosphorylation is Under the Opposite Tonic Control of Dopamine D2 and Adenosine
A2A Receptors in Striatopallidal Neurons. Neuropsychopharmacology. 34:1710-1720
Coskran TM, Morton D, Menniti FS, Adamowicz WO, Kleiman RJ, Ryan AM, Strick CA,
Schmidt CJ and Stephenson DT (2006) Immunohistochemical localization of
phosphodiesterase 10A in multiple mammalian species. J Histochem Cytochem 54:1205-
1213.
De Cesare D and Sassone-Corsi P (2000) Transcriptional regulation by cyclic AMP-responsive
factors. Prog Nucleic Acid Res Mol Biol 64:343-369.
Deak M, Clifton AD, Lucocq LM and Alessi DR (1998) Mitogen- and stress-activated protein
kinase-1 (MSK1) is directly activated by MAPK and SAPK2/p38, and may mediate
activation of CREB. Embo J 17:4426-4441.
This article has not been copyedited and formatted. The final version may differ from this version.JPET Fast Forward. Published on October 5, 2010 as DOI: 10.1124/jpet.110.173294
at ASPE
T Journals on D
ecember 26, 2018
jpet.aspetjournals.orgD
ownloaded from

JPET #173294
27
Doyle JP, Dougherty JD, Heiman M, Schmidt EF, Stevens TR, Ma G, Bupp S, Shrestha P, Shah
RD, Doughty ML, Gong S, Greengard P and Heintz N (2008) Application of a
translational profiling approach for the comparative analysis of CNS cell types. Cell
135:749-762.
Duncan CE, Chetcuti AF and Schofield PR (2008) Coregulation of genes in the mouse brain
following treatment with clozapine, haloperidol, or olanzapine implicates altered
potassium channel subunit expression in the mechanism of antipsychotic drug action.
Psychiatr Genet 18:226-239.
Freudenreich CH and Lahiri M (2004) Structure-forming CAG/CTG repeat sequences are
sensitive to breakage in the absence of Mrc1 checkpoint function and S-phase checkpoint
signaling: implications for trinucleotide repeat expansion diseases. Cell Cycle 3:1370-
1374.
Giampa C, DeMarch Z, D'Angelo V, Morello M, Martorana A, Sancesario G, Bernardi G and
Fusco FR (2006) Striatal modulation of cAMP-response-element-binding protein (CREB)
after excitotoxic lesions: implications with neuronal vulnerability in Huntington's disease.
Eur J Neurosci 23:11-20.
Giampa C, Patassini S, Borreca A, Laurenti D, Marullo F, Bernardi G, Menniti FS and Fusco FR
(2009) Phosphodiesterase 10 inhibition reduces striatal excitotoxicity in the quinolinic
acid model of Huntington's disease. Neurobiol Dis 34:450-456.
Giama C, Laurenti D, Anizilotti S, Bernardi G, Menniti FS and Fusco FR (2010) Inhibition of
the striatal specific phosphodiesterase PDE10A ameliorates striatal and cortical
pathology in R6/2 mouse model of Huntington's Disease. PLoS ONE, in press
This article has not been copyedited and formatted. The final version may differ from this version.JPET Fast Forward. Published on October 5, 2010 as DOI: 10.1124/jpet.110.173294
at ASPE
T Journals on D
ecember 26, 2018
jpet.aspetjournals.orgD
ownloaded from

JPET #173294
28
Grauer SM, Pulito VL, Navarra RL, Kelly M, Kelley C, Graf R, Langen B, Logue S, Brennan J,
Jiang L, Charych E, Egerland U, Liu F, Marquis KL, Malamas M, Hage T, Comery TA
and Brandon NJ (2009) PDE10A Inhibitor Activity in Preclinical Models of the Positive,
Cognitive and Negative Symptoms of Schizophrenia. J Pharmacol Exp Ther. 331:574-
590
Hebb AL, Robertson HA and Denovan-Wright EM (2004) Striatal phosphodiesterase mRNA and
protein levels are reduced in Huntington's disease transgenic mice prior to the onset of
motor symptoms. Neuroscience 123:967-981.
Heffron D and Mandell JW (2005) Differential localization of MAPK-activated protein kinases
RSK1 and MSK1 in mouse brain. Brain Res Mol Brain Res 136:134-141.
Hu H, McCaw EA, Hebb AL, Gomez GT, Denovan-Wright EM.(2004) Mutant
huntingtin affects the rate of transcription of striatum-specific isoforms of
phosphodiesterase 10A. Eur J Neurosci. 12:3351-63
Hu H, McCaw EA, Hebb AL, Gomez GT, Denovan-Wright EM (2004) Mutant huntingtin
affects the rate of transcription of striatum-specific isoforms of phosphodiesterase 10A.
Eur J Neurosci. 12:3351-63.
Hughes PE, Alexi T, Williams CE, Clark RG and Gluckman PD (1999) Administration of
recombinant human Activin-A has powerful neurotrophic effects on select striatal
phenotypes in the quinolinic acid lesion model of Huntington's disease. Neuroscience
92:197-209.
Kotera J, Sasaki T, Kobayashi T, Fujishige K, Yamashita Y and Omori K (2004) Subcellular
localization of cyclic nucleotide phosphodiesterase type 10A variants, and alteration of
This article has not been copyedited and formatted. The final version may differ from this version.JPET Fast Forward. Published on October 5, 2010 as DOI: 10.1124/jpet.110.173294
at ASPE
T Journals on D
ecember 26, 2018
jpet.aspetjournals.orgD
ownloaded from

JPET #173294
29
the localization by cAMP-dependent protein kinase-dependent phosphorylation. J Biol
Chem 279:4366-4375.
Lahiri M, Gustafson TL, Majors ER and Freudenreich CH (2004) Expanded CAG repeats
activate the DNA damage checkpoint pathway. Mol Cell 15:287-293.
Laprade N and Soghomonian JJ (1995) Differential regulation of mRNA levels encoding for the
two isoforms of glutamate decarboxylase (GAD65 and GAD67) by dopamine receptors
in the rat striatum. Brain Res Mol Brain Res 34:65-74.
MacDonald ML, Eaton ME, Dudman JT and Konradi C (2005) Antipsychotic drugs elevate
mRNA levels of presynaptic proteins in the frontal cortex of the rat. Biol Psychiatry
57:1041-1051.
McCoy CE, Campbell DG, Deak M, Bloomberg GB and Arthur JS (2005) MSK1 activity is
controlled by multiple phosphorylation sites. Biochem J 387:507-517.
Morris BJ, Hollt V and Herz A (1988) Dopaminergic regulation of striatal proenkephalin mRNA
and prodynorphin mRNA: contrasting effects of D1 and D2 antagonists. Neuroscience
25:525-532.
Nishi A, Kuroiwa M, Miller DB, O'Callaghan JP, Bateup HS, Shuto T, Sotogaku N, Fukuda T,
Heintz N, Greengard P and Snyder GL (2008) Distinct roles of PDE4 and PDE10A in the
regulation of cAMP/PKA signaling in the striatum. J Neurosci 28:10460-10471.
Patterson KI, Brummer T, O'Brien PM and Daly RJ (2009) Dual-specificity phosphatases:
critical regulators with diverse cellular targets. Biochem J 418:475-489.
Roze E, Betuing S, Deyts C, Marcon E, Brami-Cherrier K, Pages C, Humbert S, Merienne K and
Caboche J (2008) Mitogen- and stress-activated protein kinase-1 deficiency is involved in
This article has not been copyedited and formatted. The final version may differ from this version.JPET Fast Forward. Published on October 5, 2010 as DOI: 10.1124/jpet.110.173294
at ASPE
T Journals on D
ecember 26, 2018
jpet.aspetjournals.orgD
ownloaded from

JPET #173294
30
expanded-huntingtin-induced transcriptional dysregulation and striatal death. FASEB J
22:1083-1093.
Schmidt CJ, Chapin DS, Cianfrogna J, Corman ML, Hajos M, Harms JF, Hoffman WE, Lebel
LA, McCarthy SA, Nelson R, Proulx LC, Majchrzak MJ, Ramirez AD, Schmidt K,
Seymour PA, Siuciak JA, Tingley FD, III, Williams RD, Verhoest PR and Menniti FS
(2008) Preclinical characterization of selective phosphodiesterase 10A inhibitors: A new
therapeutic approach to the treatment of schizophrenia. JOURNAL OF
PHARMACOLOGY AND EXPERIMENTAL THERAPEUTICS 325:681-690.
Seeger TF, Bartlett B, Coskran TM, Culp JS, James LC, Krull DL, Lanfear J, Ryan AM, Schmidt
CJ, Strick CA, Varghese AH, Williams RD, Wylie PG and Menniti FS (2003)
Immunohistochemical localization of PDE10A in the rat brain. Brain Res 985:113-126.
Siuciak JA, Chapin DS, Harms JF, Lebel LA, McCarthy SA, Chambers L, Shrikhande A, Wong
S, Menniti FS and Schmidt CJ (2006a) Inhibition of the striatum-enriched
phosphodiesterase PDE10A: a novel approach to the treatment of psychosis.
Neuropharmacology 51:386-396.
Siuciak JA, McCarthy SA, Chapin DS, Fujiwara RA, James LC, Williams RD, Stock JL,
McNeish JD, Strick CA, Menniti FS and Schmidt CJ (2006b) Genetic deletion of the
striatum-enriched phosphodiesterase PDE10A: evidence for altered striatal function.
Neuropharmacology 51:374-385.
Steffan JS, Kazantsev A, Spasic-Boskovic O, Greenwald M, Zhu YZ, Gohler H, Wanker EE,
Bates GP, Housman DE and Thompson LM (2000) The Huntington's disease protein
interacts with p53 and CREB-binding protein and represses transcription. Proc Natl Acad
Sci U S A 97:6763-6768.
This article has not been copyedited and formatted. The final version may differ from this version.JPET Fast Forward. Published on October 5, 2010 as DOI: 10.1124/jpet.110.173294
at ASPE
T Journals on D
ecember 26, 2018
jpet.aspetjournals.orgD
ownloaded from

JPET #173294
31
Thomas EA, Coppola G, Desplats PA, Tang B, Soragni E, Burnett R, Gao F, Fitzgerald KM,
Borok JF, Herman D, Geschwind DH and Gottesfeld JM (2008) The HDAC inhibitor 4b
ameliorates the disease phenotype and transcriptional abnormalities in Huntington's
disease transgenic mice. Proc Natl Acad Sci U S A 105:15564-15569.
Threlfell S, Sammut S, Menniti FS, Schmidt CJ and West AR (2009) Inhibition of
Phosphodiesterase 10A Increases the Responsiveness of Striatal Projection Neurons to
Cortical Stimulation. J Pharmacol Exp Ther 328:785-795.
Vockley JG, Jenkinson CP, Shukla H, Kern RM, Grody WW and Cederbaum SD (1996) Cloning
and characterization of the human type II arginase gene. Genomics 38:118-123.
West AR and Grace AA (2004) The nitric oxide-guanylyl cyclase signaling pathway modulates
membrane activity States and electrophysiological properties of striatal medium spiny
neurons recorded in vivo. J Neurosci 24:1924-1935.
Xie Z, Adamowicz WO, Eldred WD, Jakowski AB, Kleiman RJ, Morton DG, Stephenson DT,
Strick CA, Williams RD and Menniti FS (2006) Cellular and subcellular localization of
PDE10A, a striatum-enriched phosphodiesterase. Neuroscience 139:597-607.
Zhang X, Odom DT, Koo SH, Conkright MD, Canettieri G, Best J, Chen H, Jenner R,
Herbolsheimer E, Jacobsen E, Kadam S, Ecker JR, Emerson B, Hogenesch JB, Unterman
T, Young RA and Montminy M (2005) Genome-wide analysis of cAMP-response
element binding protein occupancy, phosphorylation, and target gene activation in human
tissues. Proc Natl Acad Sci U S A 102:4459-4464.
Zink M, Schmitt A, May B, Muller B, Demirakca T, Braus DF and Henn FA (2004) Differential
effects of long-term treatment with clozapine or haloperidol on GABAA receptor binding
and GAD67 expression. Schizophr Res 66:151-157.
This article has not been copyedited and formatted. The final version may differ from this version.JPET Fast Forward. Published on October 5, 2010 as DOI: 10.1124/jpet.110.173294
at ASPE
T Journals on D
ecember 26, 2018
jpet.aspetjournals.orgD
ownloaded from

JPET #173294
32
Footnotes:
Financial support for this research was provided by Pfizer, Inc.
This article has not been copyedited and formatted. The final version may differ from this version.JPET Fast Forward. Published on October 5, 2010 as DOI: 10.1124/jpet.110.173294
at ASPE
T Journals on D
ecember 26, 2018
jpet.aspetjournals.orgD
ownloaded from

JPET #173294
33
Legends for Figures:
Figure 1. Transcripts altered by both TP-10 treatment and genetic knockout (FDR p<0.05) show
significant correlation of magnitude and direction of observed fold change between genetic and
pharmacological suppression of PDE10A. Ratio of TP-10 treated to vehicle treated striatum
(wild-type mice) is shown on the y-axis, and ratio of KO to WT striatum (vehicle treatment) is
shown on the x-axis. Dotted lines demarcate a ratio of 1.0, separating up-regulated genes from
down-regulated genes. Pearson correlation is shown in the upper left, p<0.0001.
Figure 2. Transduction of neurons in striatum with lentiviral CRE-luciferase reporter yields
activation of CREB-mediated transcription of luciferase reporter in vivo in response to PDE10
inhibition. Stereotaxic delivery of lentiviral CRE-luciferase reporter into striatum was completed
1 week prior to first TP-10 treatment. A) Mice were administered luciferin substrate (150 mpk,
i.p.) 10 minutes prior to collection of baseline images using IVIS platform. Subsequently, 3.2
mpk, s.c of TP-10 or vehicle was administered to N=15 animals per treatment group, and
repeated imaging of animals was conducted 16 hours post drug treatment. Confirmation of the
location of stereotaxic delivery was evaluated 10 weeks post lentiviral transduction by
immunohistochemical verification of GFP signal driven by lentiviral construct. Animals were
administered equivalent doses of TP-10 and imaged weekly. B) Quantitation of luciferase signals
collected from all animals 1 week post-lentiviral transduction and 6 weeks post-lentiviral
transduction are shown in panel B.
Figure 3. Western blot analysis of phosphorylation state of ERK cascade kinases following
inhibition of PDE10. TP-10 (3.2 mg/kg, s.c) or vehicle was administered to CD-1 mice ( N=4
This article has not been copyedited and formatted. The final version may differ from this version.JPET Fast Forward. Published on October 5, 2010 as DOI: 10.1124/jpet.110.173294
at ASPE
T Journals on D
ecember 26, 2018
jpet.aspetjournals.orgD
ownloaded from

JPET #173294
34
animals per group) for the length of time indicated prior to microwave fixation and collection of
striatal tissue for Western blot analysis. Each lane represents sample from an individual animal.
A) phosphorylation of ERK was detected within 15 minutes of drug treatment and remained high
for 60 minutes, dropping significantly by 3 hours. B) The ERK substrate MSK1 demonstrated
phosphorylation at Ser376 by 15 minutes, peaked at 30 minutes and began to drop off by 60
minutes. MSK1 phosphorylation state was returned to baseline by 3 hours post drug treatment. A
similar profile was observed for the phosphorylation profile of the MSK1 substrate histone H3
which was phosphorylated at Ser10 with a similar time course. Quantitative analysis of the C)
pERK D) pMSK and E) pHistone3 band intensity after normalization to total ERK band or total
NR1 protein (imaged in second channel on same blot) using the LiCOR Odyssey platform.
Figure 4. Western blot analysis of striatal tissues collected 30 minutes after administration of
haloperidol (0.32 mg/kg, s.c) and TP-10 (3.2 mg/kq, s.c.) reveals effects on phosphorylation of
ERK, MSK and H3 phosphorylation. Each lane represents a sample from an individual animal.
(A) Haloperidol induces a small increase in phosphorylation of ERK I as compared to increases
induced with TP-10 (3.2 mpk, s.c). Increases in phosphorylation of MSK1 (B) and Histone H3
(C) was not evident following haloperidol treatment, but was significant following PDE10A
inhibition.
This article has not been copyedited and formatted. The final version may differ from this version.JPET Fast Forward. Published on October 5, 2010 as DOI: 10.1124/jpet.110.173294
at ASPE
T Journals on D
ecember 26, 2018
jpet.aspetjournals.orgD
ownloaded from
JPET #173294
35
Table 1. Genes encoded by transcripts that were significantly altered in mouse striatum following chronic pharmacological inhibition
of PDE10A activity, following correction for multiple comparisons. A comparison between PDE10A KO and WT striatum for each
pharmacologically regulated gene is also shown with the associated FDR corrected p-value and fold change. Significant changes
across treatments are highlighted in grey. No significant pharmacologically-induced differences were observed following TP-10
treatment in the PDE10A knockout animals, consistent with the specificity of these effects via PDE10A inhibition. Genes represented
in bolded text were reported to be cAMP responsive genes by Zhang et al. (Zhang et al 2005).
Gene Symbol Gene Name Veh vs. TP-10 Veh vs. TP-
10 KO vs.
WT KO vs. WT KO+TP-10
vs. Veh KO+TP-10
vs. Veh AffyID
FDR p-value Fold change FDR p-value
Fold change FDR p-value
Fold change
Csda cold shock domain protein A 0.01 7.86 0.89 1.76 0.83 -1.22 1453238_s_at
1200016E24Rik Mus musculus RIKEN cDNA 1200016E24 gene 0.02 7.65 0.89 1.76 1.00 1.01 1452418_at
4631426E05Rik hypothetical protein MGC39715 0.04 3.58 0.89 1.48 0.99 -1.06 1453177_at
Mm.405423
Mus musculus adult male corpus striatum cDNA, RIKEN clone:C030023B07 0.00 3.36 0.00 2.95 1.00 -1.02 1460043_at
Nnat neuronatin 0.00 2.69 0.00 2.36 0.99 1.03 1423506_a_at
Irak3 Interleukin-1 receptor-associated kinase M 0.01 2.34 0.69 1.38 0.98 -1.05 1435040_at
Myo3b myosin IIIB 0.01 2.20 0.26 1.64 0.98 1.05 1459299_at
Dlk1 delta-like 1 homolog (Drosophila) 0.03 1.94 0.49 1.45 0.96 -1.08 1449939_s_at
Pde1c
PDE1C (Calmodulin 3',5'cyclic nucleotide phosphodiesterase 1C / HSPDE1C) 0.02 1.94 0.10 1.69 0.88 1.18 1440374_at
Gpr149 G protein-coupled receptor 149 0.02 1.92 0.93 1.16 0.98 -1.05 1438210_at
Arg2 arginase, type II 0.04 1.91 0.58 1.40 0.99 1.01 1418847_at
Smpdl3b sphingomyelin phosphodiesterase, acid-like 3B 0.03 1.86 0.43 1.45 1.00 -1.02 1417300_at
This article has not been copyedited and form
atted. The final version m
ay differ from this version.
JPET
Fast Forward. Published on O
ctober 5, 2010 as DO
I: 10.1124/jpet.110.173294 at ASPET Journals on December 26, 2018 jpet.aspetjournals.org Downloaded from

JPET #173294
36
BC022623 family with sequence similarity 43, member A 0.00 1.84 0.00 1.83 0.95 1.05 1426734_at
Ppp1r2 protein phosphatase 1, regulatory (inhibitor) subunit 2 0.02 1.78 0.86 1.20 0.99 -1.02 1456830_at
Pdyn prodynorphin 0.03 1.76 0.00 2.61 0.87 -1.07 1416266_at
Rgs5 regulator of G-protein signalling 5 0.04 1.71 0.65 1.30 0.93 -1.09 1420941_at
Pde1c
PDE1C (Calmodulin 3',5'cyclic nucleotide phosphodiesterase 1C / HSPDE1C) 0.02 1.70 0.71 1.24 0.95 -1.04 1436251_at
Syt10 synaptotagmin X 0.02 1.67 0.25 1.41 1.00 -1.01 1450347_at
Filip1 filamin A interacting protein 1 0.03 1.63 0.82 1.19 0.97 -1.03 1436650_at
Rgs5 regulator of G-protein signalling 5 0.03 1.62 0.62 1.26 0.91 -1.07 1417466_at
Ppp1r2 protein phosphatase 1, regulatory (inhibitor) subunit 2 0.00 1.59 0.35 1.25 0.73 -1.39 1448684_at
Hs6st2 Heparan-sulfate 6-sulfotransferase 2 0.03 1.56 0.68 1.22 0.94 1.09 1450047_at
1700012A16Rik RIKEN cDNA 1700012A16 gene 0.03 1.55 0.64 1.24 0.98 -1.03 1429324_at
Frem2 FRAS1 related extracellular matrix protein 2 0.03 1.54 0.24 1.37 0.96 -1.06 1457038_at
Dgat2 diacylglycerol O-acyltransferase homolog 2 (mouse) 0.01 1.54 0.03 1.46 1.00 -1.03 1422678_at
D10Ertd438e chromosome 6 open reading frame 68 0.03 1.54 0.29 1.34 1.00 -1.02 1419915_at
Lor loricrin 0.02 1.53 0.11 1.42 0.92 1.11 1448745_s_at
Dgat2 diacylglycerol O-acyltransferase homolog 2 (mouse) 0.04 1.53 0.06 1.51 0.75 -1.14 1422677_at
Slc7a8
solute carrier family 7 (cationic amino acid transporter, y+ system), member 8 (SLC7A8) 0.00 1.53 0.00 1.63 0.85 -1.29 1417929_at
Itm2a integral membrane protein 2A 0.02 1.51 0.53 1.23 0.22 1.42 1423608_at
Wdr17 WD repeat domain 17 0.00 1.48 0.11 1.28 0.92 1.14 1435392_at
This article has not been copyedited and form
atted. The final version m
ay differ from this version.
JPET
Fast Forward. Published on O
ctober 5, 2010 as DO
I: 10.1124/jpet.110.173294 at ASPET Journals on December 26, 2018 jpet.aspetjournals.org Downloaded from

JPET #173294
37
Dcbld1 Homo sapiens cDNA FLJ30900 fis, clone FEBRA2005752. 0.03 1.46 0.27 1.29 0.92 -1.71 1418966_a_at
Rasl10b RAS-like, family 10, member B 0.03 1.45 0.48 1.23 0.89 -1.10 1433566_at
Avpi1 arginine vasopressin-induced 1 0.01 1.41 0.03 1.36 0.95 -1.11 1423122_at Hist3h2ba histone 3, H2bb 0.01 1.41 0.20 1.23 0.95 -1.14 1449482_at
Lor loricrin 0.02 1.40 0.08 1.34 0.77 -1.11 1420183_at
1110018G07Rik KIAA0317 0.01 1.39 0.41 1.20 1.00 -1.04 1433767_at
0610012D17Rik hypothetical protein MGC33212 0.04 1.39 0.79 1.14 0.91 -1.73 1428972_at
Esm1 endothelial cell-specific molecule 1 0.05 1.36 0.88 1.11 0.90 -1.06 1449280_at
Chmp1b chromatin modifying protein 1B 0.02 1.35 0.00 1.49 0.99 1.02 1418817_at
Ninj1 ninjurin 1 0.03 1.33 0.44 1.18 0.99 -1.05 1441281_s_at
Tmem35 transmembrane protein 35 0.05 1.31 0.37 1.20 1.00 -1.01 1416710_at
Tmem41a transmembrane protein 41A 0.03 1.31 0.00 1.42 0.96 -1.08 1424191_a_at
Erlin1 ER lipid raft associated 1 0.04 1.30 0.87 1.09 0.98 -1.05 1424210_at
1110059G10Rik KIAA1143 0.04 1.30 0.87 1.09 1.00 -1.02 1418048_at
D10Ertd438e chromosome 6 open reading frame 68 0.02 1.30 0.38 1.16 0.95 -1.05 1419914_s_at
Pigx phosphatidylinositol glycan, class X 0.03 1.29 0.14 1.23 0.64 -1.05 1425134_a_at
Abat 4-aminobutyrate aminotransferase 0.01 1.29 0.07 1.23 1.00 -1.01 1433855_at
Znf346 zinc finger protein 346 0.04 1.28 0.88 1.08 0.91 1.13 1417088_at
Nudt11 nudix (nucleoside diphosphate linked moiety X)-type motif 11 0.01 1.28 0.12 1.19 0.92 -1.07 1426887_at
Ppp2r5b
protein phosphatase 2, regulatory subunit B (B56), beta isoform 0.01 1.27 0.02 1.24 0.95 -1.07 1426811_at
Tmem68 transmembrane protein 68 0.01 1.26 0.06 1.20 0.93 1.10 1423649_at
Gpr176 G protein-coupled receptor 176 0.02 1.25 0.29 1.15 0.94 -1.05 1442116_at
Fkbp1a FKBP (12 FK-506) 0.03 1.25 0.84 1.08 0.87 -1.16 1448184_at
Ppp1r7 protein phosphatase 1, regulatory subunit 7 0.04 1.24 0.05 1.25 0.98 -1.06 1417919_at
This article has not been copyedited and form
atted. The final version m
ay differ from this version.
JPET
Fast Forward. Published on O
ctober 5, 2010 as DO
I: 10.1124/jpet.110.173294 at ASPET Journals on December 26, 2018 jpet.aspetjournals.org Downloaded from

JPET #173294
38
Cbx4 chromobox homolog 4 (Pc class homolog, Drosophila) 0.01 1.23 0.01 1.24 0.89 1.11 1419583_at
Znrf1 zinc and ring finger 1 0.04 1.22 0.03 1.26 0.95 -1.09 1424384_a_at
Bzw2 basic leucine zipper and W2 domains 2 0.03 1.22 0.63 1.10 0.80 -1.16 1423456_at
Rnf103 ring finger protein 103 0.02 1.22 0.45 1.11 0.90 -1.23 1448434_at
Gad1 glutamate decarboxylase 1 (brain, 67kDa) (GAD1) 0.05 1.21 0.87 1.07 0.96 -1.03 1416561_at
Hif1a
hypoxia-inducible factor 1, alpha subunit (basic helix-loop-helix transcription factor) 0.03 1.19 0.55 1.10 0.98 1.07 1416035_at
Rwdd4a RWD domain containing 4A 0.04 1.18 0.54 1.10 1.00 -1.02 1424243_at
Rps2 ribosomal protein S2 0.04 1.17 0.33 1.11 0.91 -1.16 1431765_a_at
KIAA1109 KIAA1109 0.01 1.17 0.65 1.06 0.93 -1.12 1427016_at
Tsc22d1 TSC22 domain family 1 0.03 1.16 0.25 1.11 0.95 -1.05 1425742_a_at
Cox7a2l cytochrome c oxidase subunit VIIa polypeptide 2 like 0.04 1.15 0.98 -1.02 0.97 -1.03 1421772_a_at
Phb2 prohibitin 2 0.05 1.15 0.99 1.02 0.95 -1.15 1416202_at
Ngfrap1
nerve growth factor receptor (TNFRSF16) associated protein 1 0.04 1.13 0.18 1.10 0.98 -1.08 1428842_a_at
Usmg5 upregulated during skeletal muscle growth 5 0.02 1.11 0.58 1.05 0.98 -1.07 1448179_at
Slc25a3
solute carrier family 25 (mitochondrial carrier; phosphate carrier), member 3 0.03 1.10 0.43 1.06 0.74 1.15 1416300_a_at
Pttg1 pituitary tumor-transforming 1 0.02 -1.21 0.11 -1.16 0.91 -1.03 1438390_s_at
Snrpb small nuclear ribonucleoprotein polypeptide N 0.01 -1.23 0.46 -1.11 0.97 -1.04 1437193_s_at
D630004N19Rik RIKEN cDNA D630004N19 gene 0.03 -1.26 0.94 -1.06 1.00 1.03 1442016_at
Mm.326577 Mus musculus similar to cadherin 11 0.04 -1.26 0.65 -1.12 0.99 -1.02 1441565_at
This article has not been copyedited and form
atted. The final version m
ay differ from this version.
JPET
Fast Forward. Published on O
ctober 5, 2010 as DO
I: 10.1124/jpet.110.173294 at ASPET Journals on December 26, 2018 jpet.aspetjournals.org Downloaded from

JPET #173294
39
Rnf144a ring finger protein 144A 0.01 -1.29 0.00 -1.37 0.99 1.04 1438404_at
Chat Choline O-acetyltransferase 0.02 -1.38 0.03 -1.37 0.99 -1.04 1443372_at
Ankrd35 ankyrin repeat domain 35 0.03 -1.38 0.23 -1.27 0.87 -1.10 1438474_at
Hdac4 histone deacetylase 4 0.03 -1.38 0.85 -1.11 0.53 -1.14 1436758_at
Camkk2
Ca2+/calmodulin-dependent protein kinase kinase beta (CAMKKB) 0.03 -1.45 0.55 -1.21 1.00 -1.01 1455401_at
Il17rc interleukin 17 receptor C 0.01 -1.45 0.05 -1.36 0.85 -1.60 1419671_a_at
Eif2c4 eukaryotic translation initiation factor 2C, 4 0.00 -1.46 0.01 -1.39 0.92 -1.20 1453289_at
Nfix nuclear factor I/X (CCAAT-binding transcription factor) 0.01 -1.47 0.76 -1.15 0.84 1.16 1436363_a_at
Fst follistatin 0.04 -1.48 0.08 -1.44 0.95 -1.08 1421365_at
Eif2c4 eukaryotic translation initiation factor 2C, 4 0.00 -1.48 0.03 -1.39 0.94 -1.04 1429779_at
Cacnb3 Dihydropyridine-sensitive L-type calcium channel beta-3 subunit 0.01 -1.50 0.57 -1.20 0.98 -1.02 1448656_at
Camkk2
Ca2+/calmodulin-dependent protein kinase kinase beta (CAMKKB) 0.02 -1.53 0.31 -1.32 0.88 -1.09 1424474_a_at
Ptprv protein tyrosine phosphatase, receptor type, V (pseudogene) 0.01 -1.58 0.00 -1.74 1.00 1.01 1449957_at
1110032E23Rik hypothetical protein DKFZp434L142 0.03 -1.60 0.01 -1.72 0.97 -1.04 1416805_at
Kcna6 Voltage-gated potassium channel protein KV1.6 0.03 -1.64 0.57 -1.29 0.93 -1.16 1441049_at
EG625121 predicted gene, EG625121 0.03 -1.65 0.33 -1.38 0.99 -1.01 1457143_at
Fst follistatin 0.01 -1.65 0.03 -1.62 1.00 -1.01 1434458_at
Kalrn kalirin, RhoGEF kinase 0.01 -1.66 0.99 -1.06 1.00 1.00 1436066_at
1110032E23Rik hypothetical protein DKFZp434L142 0.00 -1.91 0.00 -2.24 0.96 -1.04 1429637_at
2210419I08Rik RIKEN cDNA 2210419I08 gene 0.01 -1.93 0.25 -1.52 1.00 -1.02 1441368_at
Clspn claspin homolog (Xenopus laevis) 0.00 -2.78 0.00 -2.55 1.00 -1.01 1456280_at
This article has not been copyedited and form
atted. The final version m
ay differ from this version.
JPET
Fast Forward. Published on O
ctober 5, 2010 as DO
I: 10.1124/jpet.110.173294 at ASPET Journals on December 26, 2018 jpet.aspetjournals.org Downloaded from
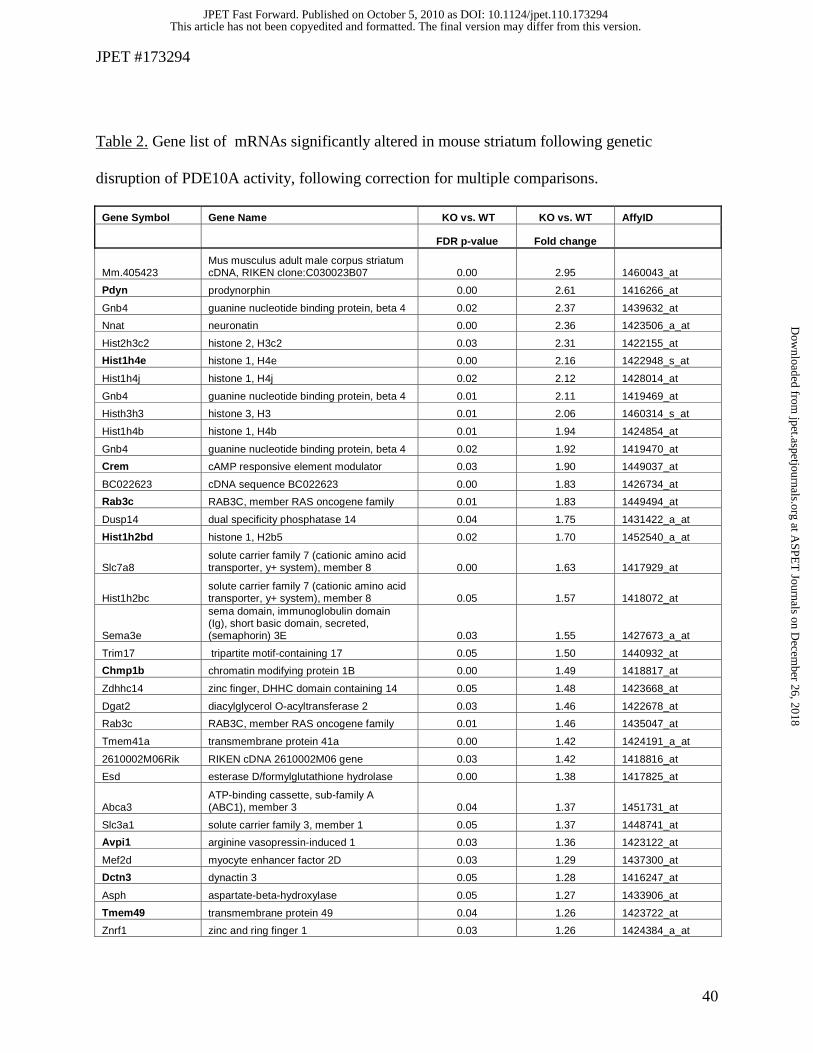
JPET #173294
40
Table 2. Gene list of mRNAs significantly altered in mouse striatum following genetic
disruption of PDE10A activity, following correction for multiple comparisons.
Gene Symbol Gene Name KO vs. WT KO vs. WT AffyID
FDR p-value Fold change
Mm.405423 Mus musculus adult male corpus striatum cDNA, RIKEN clone:C030023B07 0.00 2.95 1460043_at
Pdyn prodynorphin 0.00 2.61 1416266_at
Gnb4 guanine nucleotide binding protein, beta 4 0.02 2.37 1439632_at
Nnat neuronatin 0.00 2.36 1423506_a_at
Hist2h3c2 histone 2, H3c2 0.03 2.31 1422155_at
Hist1h4e histone 1, H4e 0.00 2.16 1422948_s_at
Hist1h4j histone 1, H4j 0.02 2.12 1428014_at
Gnb4 guanine nucleotide binding protein, beta 4 0.01 2.11 1419469_at
Histh3h3 histone 3, H3 0.01 2.06 1460314_s_at
Hist1h4b histone 1, H4b 0.01 1.94 1424854_at
Gnb4 guanine nucleotide binding protein, beta 4 0.02 1.92 1419470_at
Crem cAMP responsive element modulator 0.03 1.90 1449037_at
BC022623 cDNA sequence BC022623 0.00 1.83 1426734_at
Rab3c RAB3C, member RAS oncogene family 0.01 1.83 1449494_at
Dusp14 dual specificity phosphatase 14 0.04 1.75 1431422_a_at
Hist1h2bd histone 1, H2b5 0.02 1.70 1452540_a_at
Slc7a8 solute carrier family 7 (cationic amino acid transporter, y+ system), member 8 0.00 1.63 1417929_at
Hist1h2bc solute carrier family 7 (cationic amino acid transporter, y+ system), member 8 0.05 1.57 1418072_at
Sema3e
sema domain, immunoglobulin domain (Ig), short basic domain, secreted, (semaphorin) 3E 0.03 1.55 1427673_a_at
Trim17 tripartite motif-containing 17 0.05 1.50 1440932_at
Chmp1b chromatin modifying protein 1B 0.00 1.49 1418817_at
Zdhhc14 zinc finger, DHHC domain containing 14 0.05 1.48 1423668_at
Dgat2 diacylglycerol O-acyltransferase 2 0.03 1.46 1422678_at
Rab3c RAB3C, member RAS oncogene family 0.01 1.46 1435047_at
Tmem41a transmembrane protein 41a 0.00 1.42 1424191_a_at
2610002M06Rik RIKEN cDNA 2610002M06 gene 0.03 1.42 1418816_at
Esd esterase D/formylglutathione hydrolase 0.00 1.38 1417825_at
Abca3 ATP-binding cassette, sub-family A (ABC1), member 3 0.04 1.37 1451731_at
Slc3a1 solute carrier family 3, member 1 0.05 1.37 1448741_at
Avpi1 arginine vasopressin-induced 1 0.03 1.36 1423122_at
Mef2d myocyte enhancer factor 2D 0.03 1.29 1437300_at
Dctn3 dynactin 3 0.05 1.28 1416247_at
Asph aspartate-beta-hydroxylase 0.05 1.27 1433906_at
Tmem49 transmembrane protein 49 0.04 1.26 1423722_at
Znrf1 zinc and ring finger 1 0.03 1.26 1424384_a_at
This article has not been copyedited and formatted. The final version may differ from this version.JPET Fast Forward. Published on October 5, 2010 as DOI: 10.1124/jpet.110.173294
at ASPE
T Journals on D
ecember 26, 2018
jpet.aspetjournals.orgD
ownloaded from

JPET #173294
41
Cbx4 chromobox homolog 4 (Drosophila Pc class) 0.01 1.24 1419583_at
Slc3a2 solute carrier family 3 member 2 0.01 1.24 1425364_a_at
Ppp2r5b protein phosphatase 2, regulatory subunit B (B56), beta isoform 0.02 1.24 1426811_at
Trak1 trafficking protein, kinesin binding 1 0.04 1.19 1428327_at
Reps2 RALBP1 associated Eps domain containing 2 0.04 1.19 1435389_at
Tmem33 transmembrane protein 33 0.02 1.16 1436028_at
Atp5d ATP synthase, H+ transporting, mitochondrial F1 complex, delta subunit 0.03 1.15 1423716_s_at
Ckap5 cytoskeleton associated protein 5 0.04 -1.19 1442271_at
Ubxn2b UBX domain protein 2B 0.04 -1.24 1430816_at
2310069P03Rik RIKEN cDNA 2310069P03 gene 0.04 -1.25 1441006_at
Pard6g par-6 partitioning defective 6 homolog gamma (C. elegans) 0.04 -1.28 1420851_at
Taf1d
TATA box binding protein (TBP)-associated factor, RNA polymerase I, D, 41kDa 0.05 -1.30 1457292_at
Hla-dma major histocompatibility complex, class II, DM alpha 0.03 -1.36 1422527_at
Rnf144a ring finger protein 144A 0.00 -1.37 1438404_at
Chat choline acetyltransferase 0.03 -1.37 1443372_at
Cgref1 cell growth regulator with EF hand domain1 0.02 -1.38 1424529_s_at
Eif2c4 eukaryotic translation initiation factor 2C, 4 0.01 -1.39 1453289_at
BM119687.2
Mouse Newborn Kidney cDNA Library (Long) Mus musculus cDNA clone NIA:L0929D02 0.04 -1.39 1447060_at
Eif2c4 eukaryotic translation initiation factor 2C, 4 0.03 -1.39 1429779_at
Clca6 chloride channel calcium activated 6 0.01 -1.42 1443256_at
Gm715 gene model 715 0.01 -1.45 1445503_at
Kcns2 K+ voltage-gated channel, subfamily S, 2 0.02 -1.46 1457325_at
Mm.402736 transcribed locus 0.05 -1.48 1458052_at
Id4 inhibitor of DNA binding 4 0.04 -1.48 1423260_at
Id4 inhibitor of DNA binding 4 0.02 -1.59 1450928_at
Rps6ka5 ribosomal protein S6 kinase, polypeptide 5 0.01 -1.62 1440343_at
Fst follistatin 0.03 -1.62 1434458_at
C030009J22Rik RIKEN cDNA C030009J22 gene 0.02 -1.64 1458386_at
1110032E23Rik RIKEN cDNA 1110032E23 gene 0.01 -1.72 1416805_at
Ptprv protein tyrosine phosphatase, receptor type, V 0.00 -1.74 1449957_at
Neu2 neuraminidase 2 0.04 -1.83 1431936_a_at
1110032E23Rik RIKEN cDNA 1110032E23 gene 0.00 -2.24 1429637_at
Clspn claspin homolog (Xenopus laevis) 0.00 -2.55 1456280_at
This article has not been copyedited and formatted. The final version may differ from this version.JPET Fast Forward. Published on October 5, 2010 as DOI: 10.1124/jpet.110.173294
at ASPE
T Journals on D
ecember 26, 2018
jpet.aspetjournals.orgD
ownloaded from

JPET #173294
42
Table 3. RT-PCR confirmation of genes significantly regulated by inactivation of PDE10A activity. Significant changes in gene
expression between WT and KO striatum mRNA samples as determined by affy chip analysis were expected for the 18 genes
highlighted in grey. The directional fold change observed between KO and WT are listed next to p-values. Positive number indicate
more mRNA detected in KO animals relative to WT. Individual TaqMan assays used to carry out PCR are listed next to each result.
Gene Symbol Gene Name Veh vs. TP-10 affy KO vs. WT affy KO vs. WT qRT-PCR
TaqMan Assay AffyID FDR p-value Fold change FDR p-
value Fold
change p-value Fold change
Nnat neuronatin 0.0003 2.7 0.0031 2.4 0.0000 2.3 Mm00731416_s1 1423506_a_at
Pdyn prodynorphin 0.0328 1.8 0.0002 2.6 0.0000 3.3 Mm00457573_m1 1416266_at
Fam43a family with sequence similarity 43, member A 0.0004 1.8 0.0007 1.8 0.0000 1.8 Mm00617309_s1 1426734_at
Dgat2 diacylglycerol O-acyltransferase 2 0.0074 1.5 0.0297 1.5 0.0000 1.4 Mm00499536_m1 1422678_at
Slc7a8 solute carrier family 7, member 8 0.0017 1.5 0.0004 1.6 0.0000 1.9 Mm00444250_m1 1417929_at
Avpi1 Avpi1 arginine vasopressin-induced 1 0.0095 1.4 0.0329 1.4 0.0000 1.5 Mm00503550_m1 1423122_at
Chmp1b Chmp1b chromatin modifying protein 1B 0.0245 1.3 0.0023 1.5 0.0137 1.1 Mm04179599_s1 1418817_at
Tmem41a
Tmem41a transmembrane protein 41a 0.0333 1.3 0.0047 1.4 0.0000 1.4 Mm00508557_m1 1424191_a_at
Ppp2r5b
Ppp2r5b protein phosphatase 2, regulatory subunit B 0.0067 1.3 0.0228 1.2 0.2794 1.1 Mm01233429_m1 1426811_at
Cbx4
Cbx4 chromobox homolog 4 (Drosophila Pc class) 0.0089 1.2 0.0081 1.2 0.1303 1.1 Mm00483089_m1 1419583_at
Znrf1 Znrf1 zinc and ring finger 1 0.0447 1.2 0.0258 1.3 0.0237 1.1 Mm00460000_m1 1424384_a_at
Rnf144a Rnf144a ring finger protein 144A 0.0062 -1.3 0.0007 -1.4 0.0001 -1.4 Mm00475638_m1 1438404_at
This article has not been copyedited and form
atted. The final version m
ay differ from this version.
JPET
Fast Forward. Published on O
ctober 5, 2010 as DO
I: 10.1124/jpet.110.173294 at ASPET Journals on December 26, 2018 jpet.aspetjournals.org Downloaded from

JPET #173294
43
Chat choline acetyltransferase 0.0156 -1.4 0.0254 -1.4 0.1449 -1.2 Mm01221880_m1 1443372_at
Eif2c4 eukaryotic translation initiation factor 2C, 4
0.0011 -1.5 0.0088 -1.4
0.0000 -1.7 Mm01188521_m1
1453289_at
0.0036 -1.5 0.0267 -1.4 1429779_at
Ptprv
Ptprv protein tyrosine phosphatase, receptor type, V 0.0119 -1.6 0.0030 -1.7 0.0000 -3.9 Mm00468369_m1 1449957_at
1110032E23Rik (Fam198b)
Fam198b family with sequence similarity 198, member B 0.0303 -1.6 0.0130 -1.7 0.0000 -3.2 Mm00500026_m1 1416805_at
Fst follistatin 0.0139 -1.7 0.0272 -1.6 0.0000 -2.0 Mm03023987_m1 1434458_at
Clspn claspin homolog (Xenopus laevis) 0.0001 -2.8 0.0007 -2.5 0.0000 -3.3 Mm01181258_m1 1456280_at
Pde1c phosphodiesterase 1C 0.0156 1.9 0.1043 1.7 0.0001 1.5 Mm00478049_m1 1440374_at
Rgs5 regulator of G-protein signaling 5 0.0435 1.7 0.6516 1.3 0.3174 -1.1 Mm00501393_m1 1420941_at
Syt10 synaptotagmin 10 0.0192 1.7 0.2507 1.4 0.0000 2.8 Mm00444516_m1 1450347_at
Lor loricrin 0.0227 1.5 0.1051 1.4 0.0007 1.5 Mm01962650_s1 1448745_s_at
Ninj1 ninjurin 1 0.0259 1.3 0.4371 1.2 0.9999 1.0 Mm00479015_m1 1441281_s_at
Gad1 glutamic acid decarboxylase 1 0.0456 1.2 0.8697 1.1 0.9934 1.0 Mm00725661_s1 1416561_at
Kcna6
potassium voltage-gated channel, shaker-related, subfamily, member 6 0.0333 -1.6 0.5681 -1.3 0.0000 -1.6 Mm00496625_s1 1441049_at
This article has not been copyedited and form
atted. The final version m
ay differ from this version.
JPET
Fast Forward. Published on O
ctober 5, 2010 as DO
I: 10.1124/jpet.110.173294 at ASPET Journals on December 26, 2018 jpet.aspetjournals.org Downloaded from

JPET #173294
44
Table 4. Canonical Pathways identified by Ingenuity Pathway Analysis of statistically significant
genes (p<0.01, without FDR correction) and a greater than 1.2 fold difference between TP-10
and vehicle treated mouse striatum, or between PDE10 KO and WT mouse striatum. Genes
utilized for pathway analysis are listed in supplementary Table 1. Pathways identified in bold
font were determined to be significantly affected in both comparisons.
TP-10 vs. vehicle treated mouse striatum p-value PDE10 knockout vs. WT mouse striatum p-value
Alanine and Aspartate Metabolism 0.003 Protein Kinase A Signaling 0.003
GABA Receptor Signaling 0.003 p38 MAPK Signaling 0.003
Mitotic Roles of Polo-Like Kinase 0.007 ERK/MAPK Signaling 0.009
Aryl Hydrocarbon Receptor Signaling 0.009 Calcium-induced T Lymphocyte Apoptosis 0.015
Axonal Guidance Signaling 0.009 Mitotic Roles of Polo-Like Kinase 0.020
Taurine and Hypotaurine Metabolism 0.010 Growth Hormone Signaling 0.026
Glutamate Metabolism 0.012 ERK5 Signaling 0.026
Cyanoamino Acid Metabolism 0.020 Cardiac beta-adrenergic Signaling 0.035
Nitrogen Metabolism 0.022 Reelin Signaling in Neurons 0.042
Cardiac beta-adrenergic Signaling 0.022
Calcium Signaling 0.023
Hepatic Fibrosis / Hepatic Stellate Cell Activation 0.026
Ephrin Receptor Signaling 0.028
beta-alanine Metabolism 0.031
G Beta Gamma Signaling 0.032
Synaptic Long Term Depression 0.035
Protein Kinase A Signaling 0.035
p38 MAPK Signaling 0.038
Type I Diabetes Mellitus Signaling 0.039
Butanoate Metabolism 0.047
This article has not been copyedited and formatted. The final version may differ from this version.JPET Fast Forward. Published on October 5, 2010 as DOI: 10.1124/jpet.110.173294
at ASPE
T Journals on D
ecember 26, 2018
jpet.aspetjournals.orgD
ownloaded from

Figure 1. JPET #173294
This article has not been copyedited and formatted. The final version may differ from this version.JPET Fast Forward. Published on October 5, 2010 as DOI: 10.1124/jpet.110.173294
at ASPE
T Journals on D
ecember 26, 2018
jpet.aspetjournals.orgD
ownloaded from

Baseline
B
16 hrPost TP-10 treatment
A
Figure 2. JPET#179294
This article has not been copyedited and formatted. The final version may differ from this version.JPET Fast Forward. Published on October 5, 2010 as DOI: 10.1124/jpet.110.173294
at ASPE
T Journals on D
ecember 26, 2018
jpet.aspetjournals.orgD
ownloaded from

vehicle 15min 30min 60min 3hrs 6hrs
pMSKs376
pHistoneS10
NR1
pERK
Total ERK
vehicle 15min 30min 60min 3hrs 6hrsA
B
DC E
Figure 3. JPET #173294
This article has not been copyedited and form
atted. The final version m
ay differ from this version.
JPET
Fast Forward. Published on O
ctober 5, 2010 as DO
I: 10.1124/jpet.110.173294 at ASPET Journals on December 26, 2018 jpet.aspetjournals.org Downloaded from

B
Vehicle Haloperidol TP-10Vehicle Haloperidol TP-10Vehicle Haloperidol TP-10Vehicle Haloperidol TP-10
C
Vehicle Haloperidol TP-10
A Vehicle Haloperidol TP-10
Vehicle Haloperidol TP-10
pERK
tubulin
pMSK
tubulin
pHistone H3
tubulin
Figure 4. JPET 173294
This article has not been copyedited and formatted. The final version may differ from this version.JPET Fast Forward. Published on October 5, 2010 as DOI: 10.1124/jpet.110.173294
at ASPE
T Journals on D
ecember 26, 2018
jpet.aspetjournals.orgD
ownloaded from