TITLE: BIOFILTER CATALOG AND DATABASE FOR … IV. Biofilter Flora and Fauna - Elmer Avenue Biofilter...
16
1 TITLE: BIOFILTER CATALOG AND DATABASE FOR THE LOS ANGELES REGION AUTHORS: Lisa A. Levin 1 , Jennifer T. Le 1 , Jennifer P. Gonzalez 1 and Richard F. Ambrose 2 1 Center for Marine Biodiversity and Conservation Scripps Institution of Oceanography, UC San Diego, La Jolla, CA, 92093-0218 USA 2 Department of Environmental Health Sciences Institute of the Environment and Sustainability UC Los Angeles, Los Angles, CA, 90095 Email Contact: [email protected] TABLE OF CONTENTS: I. Introduction ………………………………………………………………………………………………….… 2 II. Biofilter Data Collection & Compilation ……..………………………………………………….………… 2 III. Biofilter Types …………………………………………………………………………..……………………… 2 IV. Biofilter Fauna ………………………………………………..…….……………….…….…………………… 4 V. Ecosystem Services of Biofilters ………………………..…….……….………….……….………………… 4 VI. Los Angeles Region Biofilter Map ……………..…………………………………………….……………… 6 VII. Database Compilation of Known Los Angeles Region Biofilter Sites .…………….………………… 7 VIII. Water Flow Pathways for Selected Biofilters .………….………………………………………………… 20 Acknowledgements The authors would like to thank Natasha Gunawan (UCSD) for her technical support. Katie Galloway, Andrew Mehring and Paloma Aguirre of UCSD provided technical support and participated in field data collection. Brandon Winfrey of UCI provided many leads and information for the biofilter database compilation. Funding support was provided by USC-NOAA Sea Grant Awards 61207781 & 75199714. The statements, findings, conclusions and recommendations are those of the authors and do not necessarily reflect the views of USC Sea Grant or NOAA.
Transcript of TITLE: BIOFILTER CATALOG AND DATABASE FOR … IV. Biofilter Flora and Fauna - Elmer Avenue Biofilter...
1
TITLE: BIOFILTER CATALOG AND DATABASE FOR THE LOS ANGELES REGION AUTHORS: Lisa A. Levin1, Jennifer T. Le1, Jennifer P. Gonzalez1 and Richard F. Ambrose2 1 Center for Marine Biodiversity and Conservation Scripps Institution of Oceanography, UC San Diego, La Jolla, CA, 92093-0218 USA
2 Department of Environmental Health Sciences Institute of the Environment and Sustainability UC Los Angeles, Los Angles, CA, 90095 Email Contact: [email protected] TABLE OF CONTENTS:
I. Introduction ………………………………………………………………………………………………….… 2
II. Biofilter Data Collection & Compilation ……..………………………………………………….………… 2
III. Biofilter Types …………………………………………………………………………..……………………… 2
IV. Biofilter Fauna ………………………………………………..…….……………….…….…………………… 4
V. Ecosystem Services of Biofilters ………………………..…….……….………….……….………………… 4
VI. Los Angeles Region Biofilter Map ……………..…………………………………………….……………… 6
VII. Database Compilation of Known Los Angeles Region Biofilter Sites .…………….………………… 7
VIII. Water Flow Pathways for Selected Biofilters .………….………………………………………………… 20
Acknowledgements The authors would like to thank Natasha Gunawan (UCSD) for her technical support. Katie Galloway, Andrew Mehring and Paloma Aguirre of UCSD provided technical support and participated in field data collection. Brandon Winfrey of UCI provided many leads and information for the biofilter database compilation. Funding support was provided by USC-NOAA Sea Grant Awards 61207781 & 75199714. The statements, findings, conclusions and recommendations are those of the authors and do not necessarily reflect the views of USC Sea Grant or NOAA.
2
I. Introduction Stormwater capture has historically been a wasted source for usable water in southern California. Urban areas waste vast quantities of stormwater by letting it flow directly to the ocean. This water acquires contaminants from residential and commercial activity, particularly from heavy automobile use and maintenance in the surrounding areas. One emerging solution to increase our water stores is to capture, treat, and harvest urban stormwater runoff by employing human ‘built,’ natural treatment systems such as biofilters (also known as rainwater gardens, bioswales, and bioretention systems). Furthermore, because these systems also contain soil, plants, and animals, they can also provide a suite of co-benefits that extend beyond water purification. These benefits are called ecosystem services and are largely ignored in the decision-making process of planning biofilter sites. An ecosystem services perspective presents a more holistic view of the full suite of benefits that low-impact development technologies can provide, creating a better understanding of the full impact a biofilter can have at a given location. In recent decades, biofilter systems have been constructed within southern California by individual developers, non-profit organizations, universities, municipalities, transportation authorities, and water districts, but there has been no list or database available that compiles all known biofilter site locations, along with the quantification of their ecological attributes or the ecosystem services provided by these systems. Here we consolidate known/publically available information for existing biofilter sites of Los Angeles County into an easily accessible database. II. Biofilter Data Collection & Compilation
A major effort was made to identify existing biofilter sites in the Los Angeles area. Primary resources for this information include the LA Council for Watershed Health (Chris Solek and Nancy Steele), Mike Antos (Cal State Northridge), Alberto Angelini (CalTRANS), the City of Los Angeles Stormwater Protection Program, and the Stormwater Quality Improvement Project website. Specific informative websites and contacts are indicated in the Database Compilation of Known Los Angeles Region Biofilters (Table 1). The list is not exhaustive, and represents only an initial effort to gather information on Los Angeles Biofilters. New installations occur continually and we welcome additional information about sites not on the list, as well as updated information about sites that have been included. PhD student J. Le evaluated potential ecosystem services provided by biofilters and the ways in which these services could be quantified. Soil fauna were collected, identified and counted at Elmer Avenue.
Please contact Lisa Levin at [email protected] with any updates, leads, or information on new or existing biofilters in the Los Angeles County area.
III. Biofilter Types
Biofilter design has recently been streamlined using new regional standards that were developed in the last few years (San Diego County Copermittees, 2016). There are many different configurations and inlet/outlet styles. Some common features of biofilters are described below:
BIOFILTER DESIGN IS A FUNCTION OF SOIL TYPE:
1) BIORETENTION: If soil is suitable for infiltration (soil types A & B – sand and loam), stormwater percolates (drains down) through the biofilter with the goal of groundwater recharge. (https://engineering.purdue.edu/mapserve/LTHIA7/documentation/hsg.html) As the San Diego County Copermittees describe, typical bioretention may include:
• Inflow distribution mechanisms (e.g. perimeter flow spreader or filter strips) • Energy dissipation mechanism for concentrated inflows (e.g. splash blocks or riprap)
3
• Shallow surface ponding for captured flows • Side slope and basin bottom vegetation • Media layer (planting mix/engineered media) capable of supporting vegetation growth • Filter coarse layer consisting of aggregate (river rock or actual filter) to prevent the migration of
fine particles into uncompacted native soils or aggregate storage layer • Optional aggregate storage layer for additional infiltration storage • Uncompacted native soils at the bottom of the facility • Overflow structure
2) BIOINFILTRATION: If the soils are unsuitable for infiltration (soil type C & D – more clay and silt),
infiltration rates are low and can be a hazard (flooding). (https://engineering.purdue.edu/mapserve/LTHIA7/documentation/hsg.html) In these cases, the stormwater is retained and will eventually evaporate or drain down into the soil. In addition, the bottom of the biofilter can be lined with an impermeable, nonporous liner, a perforated pipe can be installed at the bottom of the biofilter (this is called an underdrain) to collect water and connect back to the storm drain system. For lined biofilters, the pipe design usually depends on the size of the biofilter. Typical bioinfiltration (bioretention with underdrain components; San Diego County Copermittees 2016) include all of the features listed above for bioretention except the last three, which are replaced with:
• Aggregate storage layer with underdrain(s) • Impermeable liner or uncompacted native soils at the bottom of the facility
INLET STRUCTURES: Routes for water to enter the biofilter 1) Curb cuts: If the biofilter is along a roadway or in a parking lot, water usually enters the biofilter through
"curb cuts" – usually 1'-long sections of curb removed to allow the water to enter the biofilter. Elmer Avenue and the LA Zoo are configured in this manner.
2) Sheet flow: If the biofilter is not surrounded by an impervious surface (if it was in a larger landscaped area) water would enter the biofilter via sheet flow. The surrounding area must not exceed a slope of 3H:1V to prevent erosion/damage to the biofilter.
3) Incoming pipe: Water can be piped into the biofilter – usually with an "energy dissipation" device like rip rap – to slow the water down so it does not erode the area around the pipe. This is useful if the source of pollutants (e.g. parking lot, roadway) is not adjacent to the biofilter. The Chatsworth Station is configured this way.
OUTLET STRUCTURES: Routes for water to leave the biofilter
1) The perforated pipe underdrain in lined biofilters 2) An "overflow" device (for when the biofilter is at maximum ponding capacity) offers water another way
to escape to avoid damage to the biofilter and surrounding property • Curb cuts – Elmer Avenue has a curb cut on the upstream side and downstream side of the
biofilters in front of each house. Once it is fully ponded, water goes out the downstream side of the biofilter and back into the curb/gutter.
• Outlet riser – This is a catch basin (inlet with a grate) designed to be at an elevation slightly below the maximum ponding elevation. When a biofilter is dry the riser appears to emerge above the biofilter. When stormwater enters the biofilter it will pond up to a certain level. Then water escapes through the riser before the biofilter has reached its maximum capacity, allowing stormwater to enter the biofilter and erosion can be avoided.
REFERENCES San Diego County Copermittees. 2016. Model BMP Design Manual, Appendix E, Fact Sheets http://www.projectcleanwater.org/new-bmp-maintenance-fact-sheets/ https://engineering.purdue.edu/mapserve/LTHIA7/documentation/hsg.html
4
IV. Biofilter Flora and Fauna - Elmer Avenue
Biofilter design typically addresses the hydrology, filter media, and sometimes plants, but almost never the animals that dwell in these systems. Soil invertebrates may affect many different aspects of biofilter function: water infiltration, water storage, contaminant removal and other co-occurring ecosystem services. (Mehring and Levin 2015; Mehring et al. 2016). The soil invertebrate fauna of Elmer Avenue biofilters was analyzed by taking core samples, preserving them in formalin, sieving sediments on a 0.3 mm mesh, and sorting retained fauna under a dissecting microscope at 12x magnification. Plant cover was estimated on site and composition determined with photographs. Elmer Avenue is located in the Sun Valley subwatershed of the Los Angeles River, with 40 acres of residential land that originally drained to the roadway causing flooding problems, deteriorating street surfaces, and increased pollution along the block and downstream. Elmer Avenue did not have a traditional storm drain system to route flows off the street’s surface. Instead of installing a traditional drainage system, the city installed 24 biofilters (one in front of each residence) as well as one large site along an adjacent Paseo to reduce runoff and conserve water. The stormwater now enters catch basins that convey water into two infiltration galleries underneath the street. The bottomless catch basins allow particulates to settle out of the water before it enters the infiltration galleries. Based on historical rainfall data, the galleries are expected to infiltrate about 16 acre-feet of runoff annually. Plant cover in the 24 biofilters ranged from 20-95%. Dominant taxa were Salvia greggi, Juncus sp., Muhlenbergia rigens, and Carex sp. Soil faunas sampled in winter 2015 had few species of invertebrates at moderate densities. Cores were 18.09 cm2 in area and each contained from 1-8 invertebrate species. Average density was 13,365 individuals/m2. The soil fauna consisted largely of lumbrinicid and enchytraeid oligochaete worms (41%), insects (27%), arachnids (mites and spiders) (17%), nematodes (11%), as well as myriapods and isopods (crustaceans). The number of species (richness) was positively related to density (R2=0.55; P=0.001). There were no significant relationships between percent cover of plants and either species richness or density.
V. Ecosystem Services
TARGETED ECOSYSTEM SERVICES
Impermeable surfaces, such as concrete and asphalt, decrease water infiltration and evaporation (Wessolek, 2008), which can lead to flooding, property damage, and safety risks. Biofilters have the potential to address this issue by increasing water infiltration and evaporation via increased permeable surface area and plant cover, respectively. In addition to reduced flooding, increased water infiltration can recharge groundwater, which is an important water resource (Erickson and Stefan 2009). Biofilters also have the capacity to filter contaminants from stormwater runoff via physical filtration, adsorption, and uptake by plants and animals (Mehring and Levin, 2015). Heavy metals, organics, and pathogens can accumulate due to industrial activity, vehicular traffic, and sewage (Makepeace et al. 1995). In places that experience periodic drought, these contaminants can accumulate and increase pollution in stormwater runoff (Blecken et al. 2008). Contaminated stormwater runoff can make its way to the coastal ocean and cause illness in recreational water users (Tseng and Jeng 2012). NON-TARGETED ECOSYSTEM SERVICES (CO-BENEFITS)
Biodiversity is recognized as the source of most ecosystem services and often the focus of environmental management (Palumbi et al. 2009; Cardinale et al. 2012). Although biofilters are man-made structures, they also support biological communities that may contribute to additional ecosystem services. Biofilters provide habitat patches for mobile species and may increase connectivity to create more resilient communities that can recover from disturbances such as long periods of intense drought (Kremen et al. 2007). Increased connectivity among pollinators, such as bees and birds, can boost local productivity. Increased productivity in the form of plant growth can lead to more carbon sequestration, which is increasingly important in the face of climate change.
5
Bioretention and biofiltration systems also provide cultural services such as education and recreation. Biofilters present an opportunity for public outreach and education regarding pollution, urban management, and climate change. Increased awareness about biofilters and the services they provide may lead to more efficient water use and safer gardening practices. Biofilter design and functionality is an active area of research, and findings can be applied to urban planning and management. Biofilters also create recreational value when they are located in community spaces, such as parks. They can be congruent with recreational space but enhance water services and others discussed above. There is an opportunity to increase public awareness with signage in these places, educating people about stormwater runoff issues and the steps taken to address them. REFERENCES Blecken, G.-T., Zinger, Y., Deleti!, A., Fletcher, T.D. and M. Viklander. 2008. Impact of a submerged zone and a carbon source on heavy metal removal in stormwater biofilters. Ecological Engineering, 35: 769–778. https://doi.org/10.1016/j.ecoleng.2008.12.009 Cardinale, B.J., Duffy, J.E., Gonzalez, A., Hooper, D.U., Perrings, C., Venail, P., Narwani, A., Mace, G.M., Tilman, D., Wardle, D.A., Kinzig, A.P., Daily, G.C., Loreau, M. and J.B. Grace. 2012. Biodiversity loss and its impact on humanity. Nature, 486: 59–69. https://doi.org/10.1038/nature11148 Erickson, T.O. and H.G. Stefan. 2009. Natural Groundwater Recharge Response to Urbanization�: Vermillion River Watershed, Minnesota. Journal of Water Resources Planning and Management, 135: 512–520. http://dx.doi.org/10.1061/(ASCE)0733-9496(2009)135:6(512) - sthash.rxM5ys4N.dpuf Kremen, C., Williams, N.M., Aizen, M.A., et al. 2007. Pollination and other ecosystem services produced by mobile organisms: a conceptual framework for the effects of land-use change. Ecology Letters, 10: 299–314. https://doi.org/10.1111/j.1461-0248.2007.01018.x Makepeace, D.K., Smith, D.W. and S.J Stanley. 1995. Urban stormwater quality: Summary of contaminant data. Critical Reviews in Environmental Science and Technology, 25: 93–139. http://dx.doi.org/10.1080/10643389509388476 Mehring, A.S., Hatt, B.E., Kraikittikun, D., Orelo, B.D., Rippy, M.A., Grant, S.B., Gonzalez, J.P., Jiang, S.C., Ambrose, R.F. and L.A. Levin. 2017. Soil invertebrates in Australian rain gardens and their potential roles in storage and processing of nitrogen. Ecological Engineering, 97: 138–143. https://doi.org/10.1016/j.ecoleng.2016.09.005 Mehring, A.S. and L.A. Levin. 2015. Potential roles of soil fauna in improving the efficiency of rain gardens used as natural stormwater treatment systems. Journal of Applied Ecology, 52: 1445–1454. https://doi.org/10.1111/1365-2664.12525 Palumbi, S.R., Sandifer, P.A., Allan, J.D., et al. 2009. Managing for ocean biodiversity to sustain marine ecosystem services. Frontiers in Ecology and the Environment, 7: 204–211. https://doi.org/10.1890/070135 Tseng, L.Y. and S.C. Jiang. 2012. Comparison of recreational health risks associated with surfing and swimming in dry weather and post-storm conditions at Southern California beaches using quantitative microbial risk assessment (QMRA). Marine Pollution Bulletin, 64: 912–918. https://doi.org/10.1016/j.marpolbul.2012.03.009 Wessolek, G. 2008. Sealing of Soils. In J.M. Marzluff et al. (Eds), Urban Ecology, 161–179pp. Springer US. https://doi.org/10.1007/978-0-387-73412-5_10
6
VI. Los Angeles Region Biofilter Map
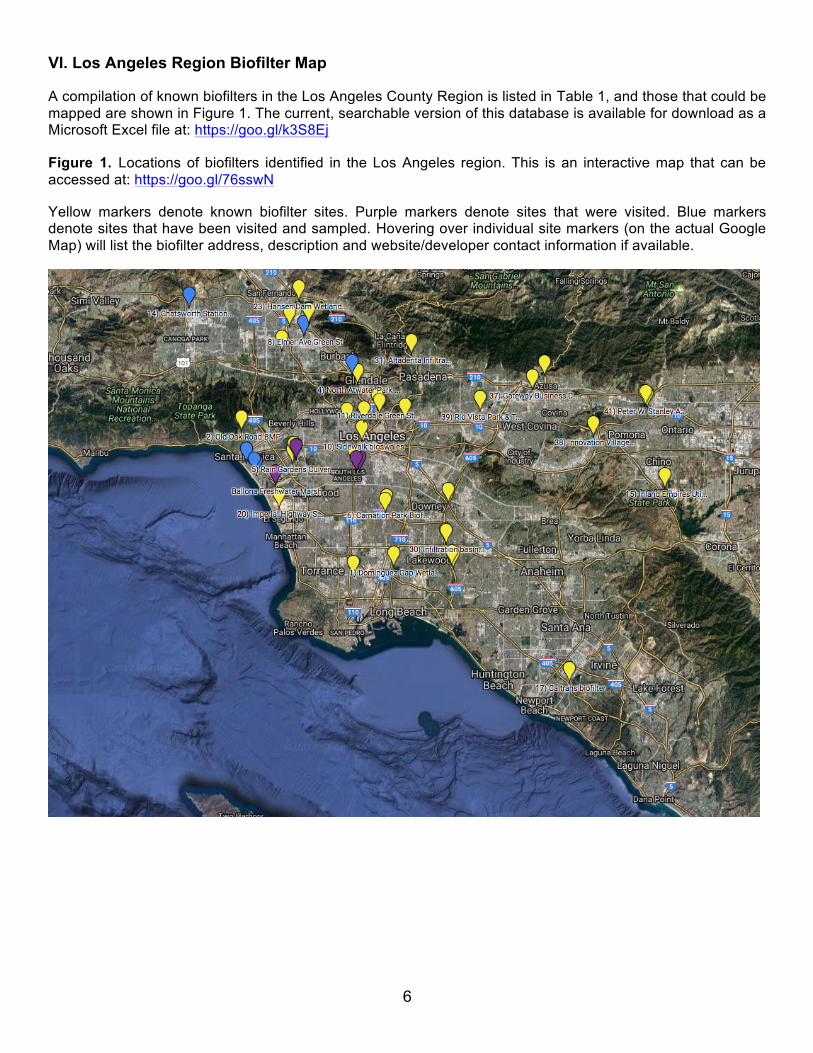
A compilation of known biofilters in the Los Angeles County Region is listed in Table 1, and those that could be mapped are shown in Figure 1. The current, searchable version of this database is available for download as a Microsoft Excel file at: https://goo.gl/k3S8Ej
Figure 1. Locations of biofilters identified in the Los Angeles region. This is an interactive map that can be accessed at: https://goo.gl/76sswN Yellow markers denote known biofilter sites. Purple markers denote sites that were visited. Blue markers denote sites that have been visited and sampled. Hovering over individual site markers (on the actual Google Map) will list the biofilter address, description and website/developer contact information if available.
7
VII. Table 1. Database Compilation of Known Los Angeles Region Biofilter Sites Compiled biofilter information for sites located within Los Angeles County and its surrounding areas. This is not a comprehensive list but provides a catalog of many of the biofilters in the region. * Nearest watershed and drainage pathways to said water body were identified and measured as described in Figure 2. A searchable version of this database is available for download at:
8
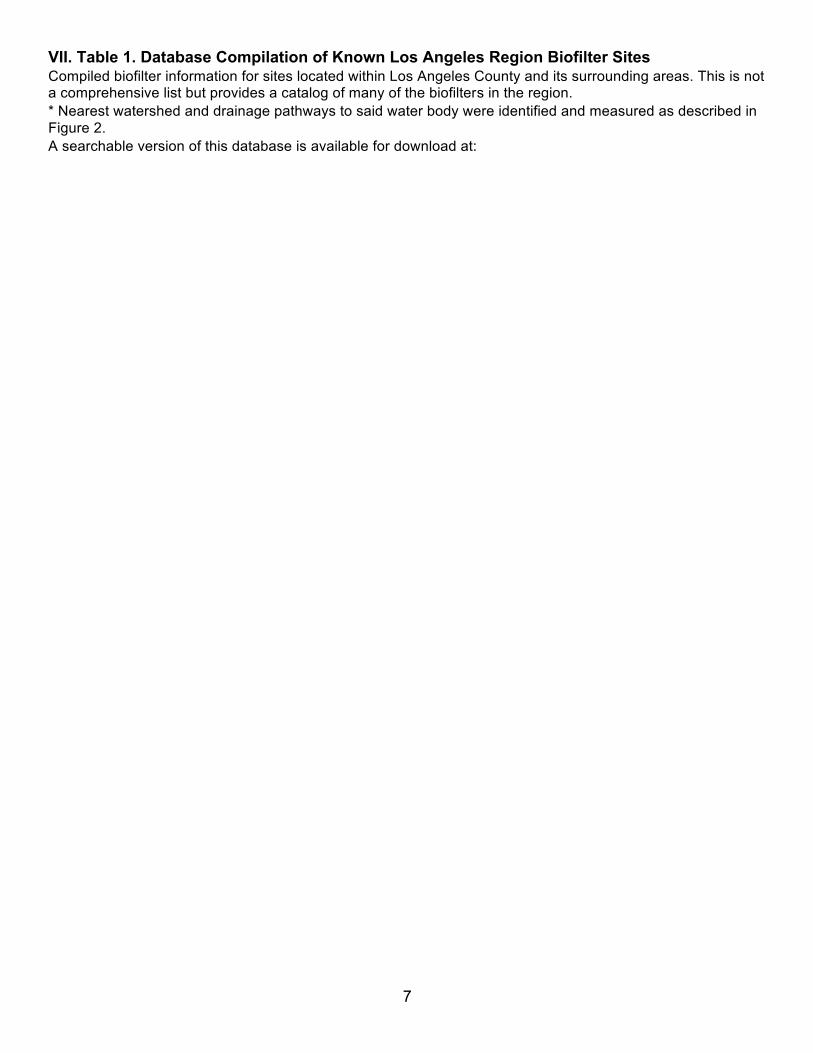
Water Flow Pathways for Selected Biofilters An interactive map from the LA Department of Public Works (http://dpw.lacounty.gov/fcd/stormdrain/index.cfm) was used to identify the closest watershed and the storm drains and catchments adjacent to a selected number of the biofilter sites listed in Table 1. This resource currently includes facilities owned and maintained by the Los Angeles County Flood Control District, the City of Los Angeles, and United States Army Corps of Engineers (Corps). Google Earth (pictures on the left side of the figure) was then used to measure the distance from the biofiler site to the nearest surface water body via the identified drainage pathway. These pathways are shown below in Figure 2. Figure 2. Water Flow Paths for Selected Biofilter Sites. (#) corresponds to the biofilter site number given in Table 1. (1) Dominguez Gap Wetlands (green star on street map, site drainage map on the right)
This area is a created wetland designed to capture and treat urban runoff before it enters the LA River. The nearest watershed is the Los Angeles River, which is within feet (at most, 408 ft) from the site.
9
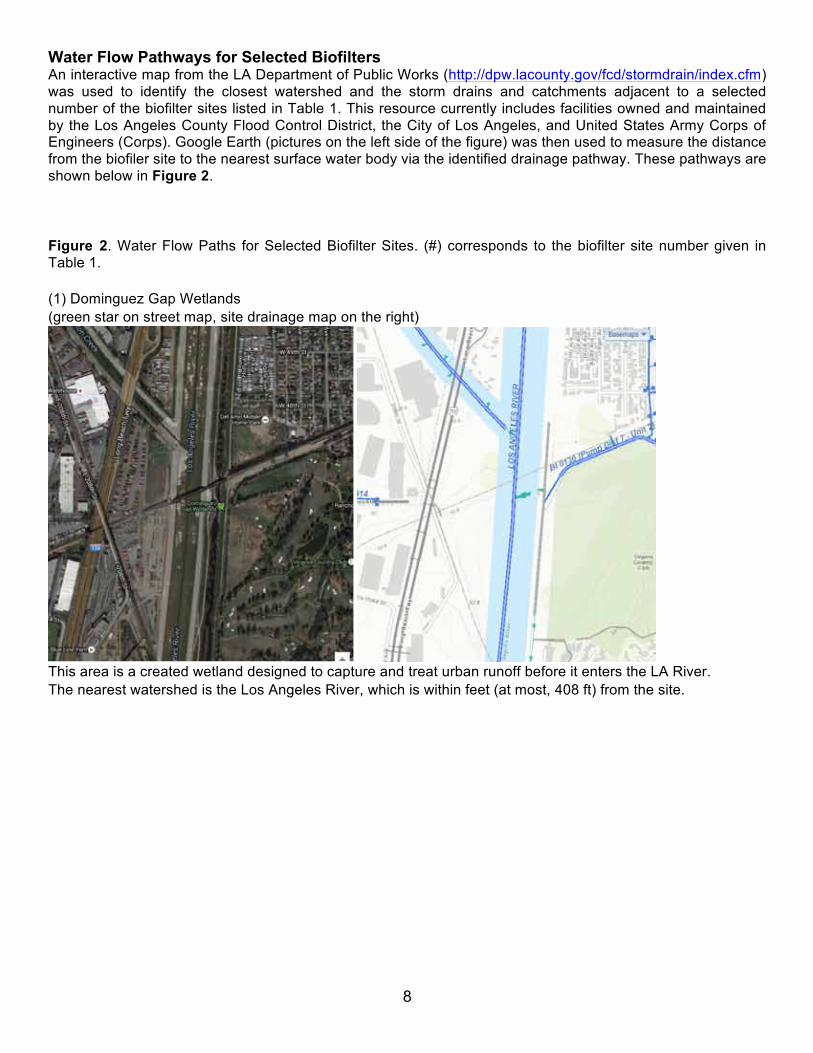
(2) Old Oak Road BMP (purple marker on street map, red square on drainage map on the right)
This area is a vegetated bioswale with catch basins designed to capture and treat stormwater. The nearest watershed is the Santa Monica Canyon Channel, located within 311 ft from the site. (3) Carson Rain Garden (teal marker on street map, red square on drainage map on the right)
This area is a vegetated rain garden located at Veteran’s Park in Carson. Right map shows no nearby drainage as the stormwater capture is via infiltration/groundwater recharge. The nearest watershed is the Long Beach Middle Harbor, located within 5.71 miles from the site.
10
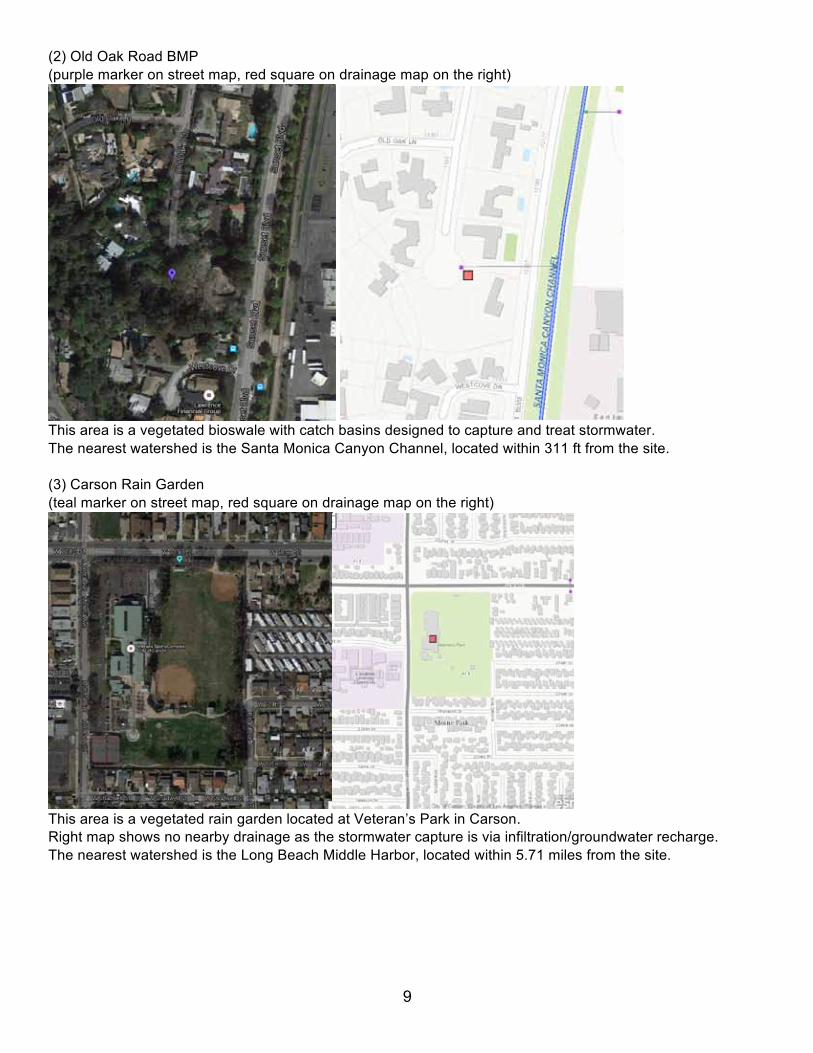
(4) North Atwater Park Restoration (purple marker on street map, red square on drainage map on the right)
A storm drain empties urban runoff through this created wetland before it enters the LA River. The nearest watershed is the Los Angeles River, which is located within 784 ft feet from the site. (5) Rain Gardens Culver City (teal marker on street map, red square on drainage map on the right)
Rain garden captures stormwater, then releases it into channels that drain to the Ballona Creek. The Ballona Creek is located within 141 ft feet from the site.
11
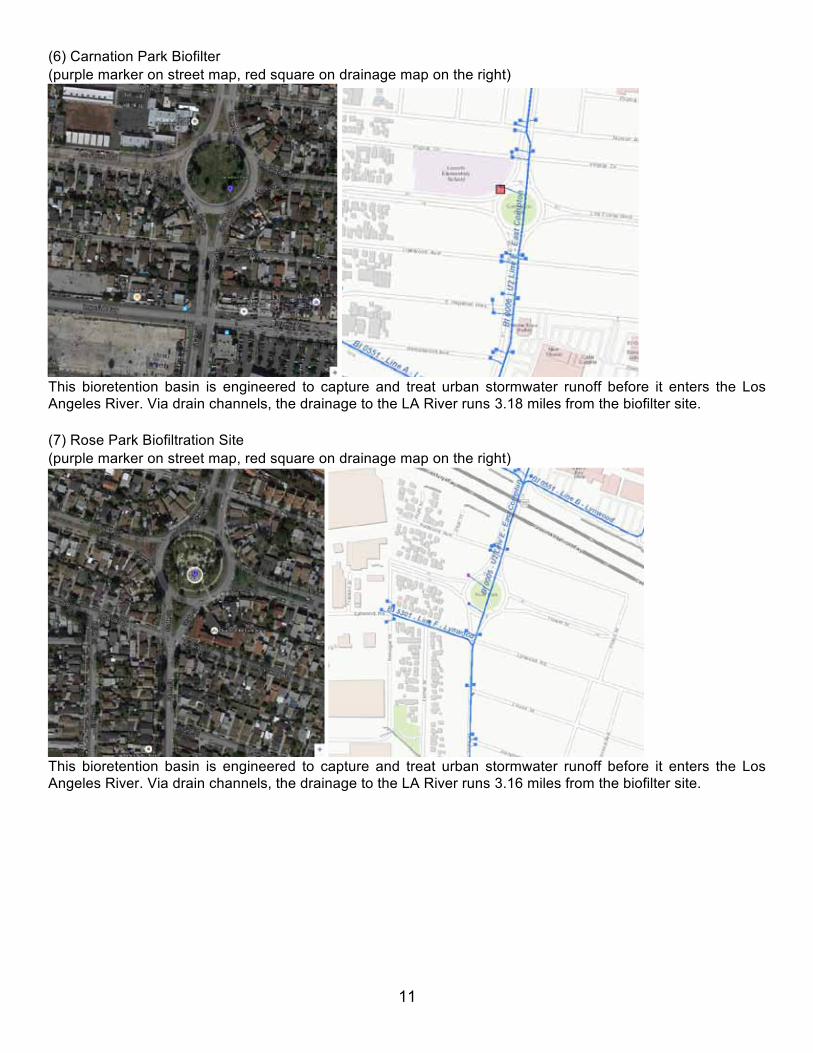
(6) Carnation Park Biofilter (purple marker on street map, red square on drainage map on the right)
This bioretention basin is engineered to capture and treat urban stormwater runoff before it enters the Los Angeles River. Via drain channels, the drainage to the LA River runs 3.18 miles from the biofilter site. (7) Rose Park Biofiltration Site (purple marker on street map, red square on drainage map on the right)
This bioretention basin is engineered to capture and treat urban stormwater runoff before it enters the Los Angeles River. Via drain channels, the drainage to the LA River runs 3.16 miles from the biofilter site.
12
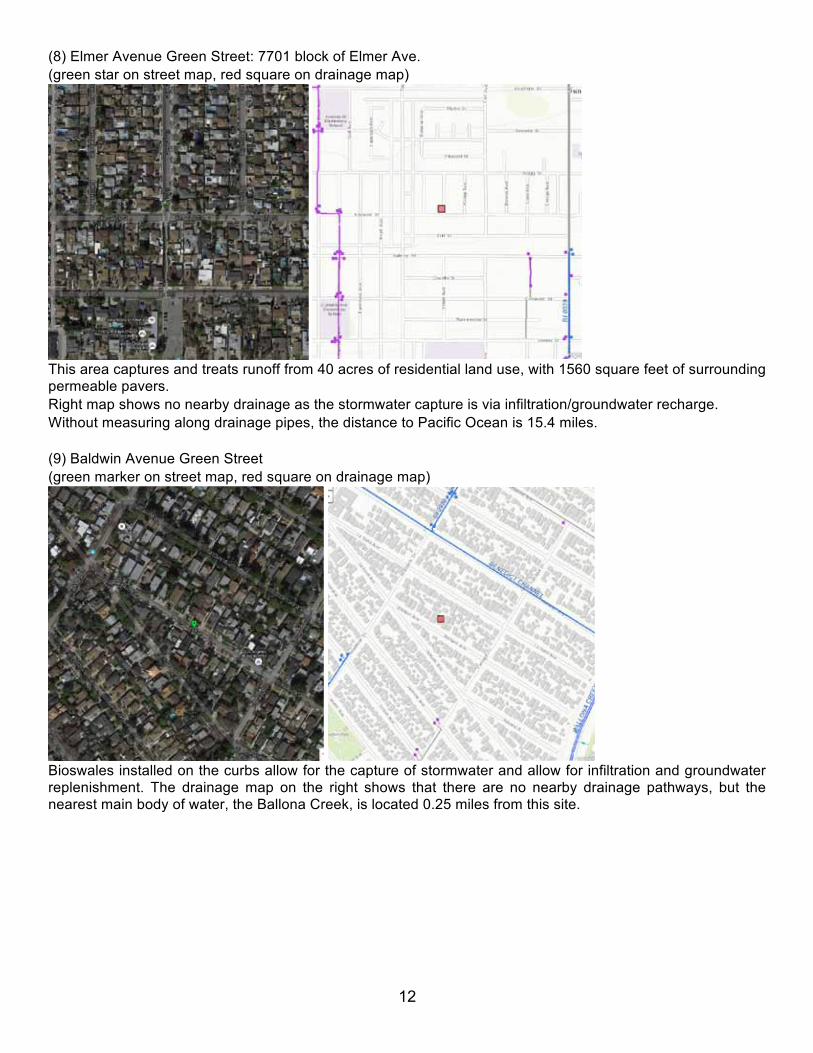
(8) Elmer Avenue Green Street: 7701 block of Elmer Ave. (green star on street map, red square on drainage map)
This area captures and treats runoff from 40 acres of residential land use, with 1560 square feet of surrounding permeable pavers. Right map shows no nearby drainage as the stormwater capture is via infiltration/groundwater recharge. Without measuring along drainage pipes, the distance to Pacific Ocean is 15.4 miles. (9) Baldwin Avenue Green Street (green marker on street map, red square on drainage map)
Bioswales installed on the curbs allow for the capture of stormwater and allow for infiltration and groundwater replenishment. The drainage map on the right shows that there are no nearby drainage pathways, but the nearest main body of water, the Ballona Creek, is located 0.25 miles from this site.
13
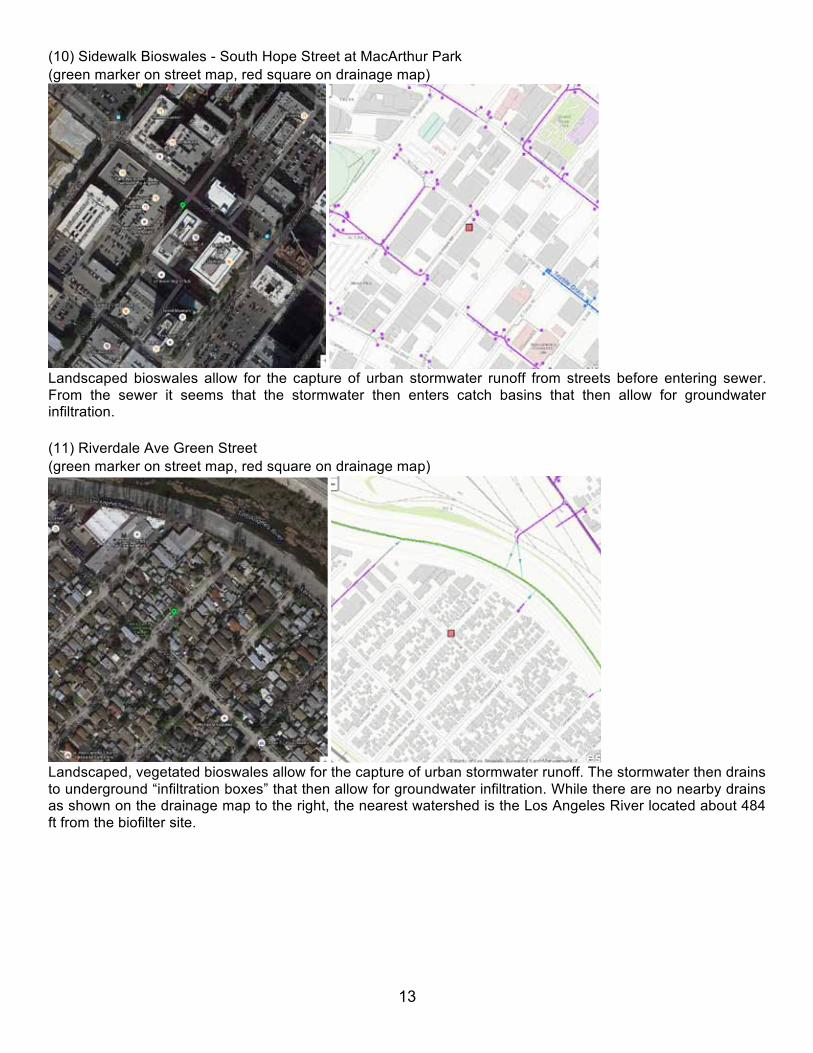
(10) Sidewalk Bioswales - South Hope Street at MacArthur Park (green marker on street map, red square on drainage map)
Landscaped bioswales allow for the capture of urban stormwater runoff from streets before entering sewer. From the sewer it seems that the stormwater then enters catch basins that then allow for groundwater infiltration. (11) Riverdale Ave Green Street (green marker on street map, red square on drainage map)
Landscaped, vegetated bioswales allow for the capture of urban stormwater runoff. The stormwater then drains to underground “infiltration boxes” that then allow for groundwater infiltration. While there are no nearby drains as shown on the drainage map to the right, the nearest watershed is the Los Angeles River located about 484 ft from the biofilter site.
14
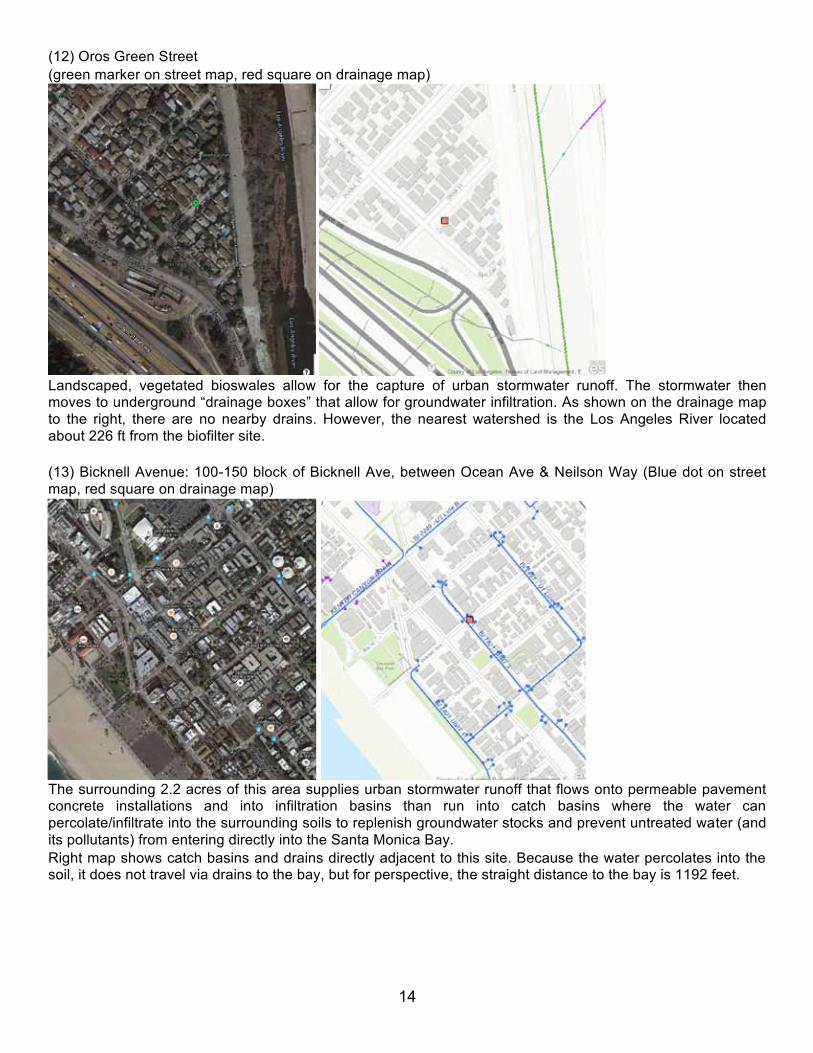
(12) Oros Green Street (green marker on street map, red square on drainage map)
Landscaped, vegetated bioswales allow for the capture of urban stormwater runoff. The stormwater then moves to underground “drainage boxes” that allow for groundwater infiltration. As shown on the drainage map to the right, there are no nearby drains. However, the nearest watershed is the Los Angeles River located about 226 ft from the biofilter site. (13) Bicknell Avenue: 100-150 block of Bicknell Ave, between Ocean Ave & Neilson Way (Blue dot on street map, red square on drainage map)
The surrounding 2.2 acres of this area supplies urban stormwater runoff that flows onto permeable pavement concrete installations and into infiltration basins than run into catch basins where the water can percolate/infiltrate into the surrounding soils to replenish groundwater stocks and prevent untreated water (and its pollutants) from entering directly into the Santa Monica Bay. Right map shows catch basins and drains directly adjacent to this site. Because the water percolates into the soil, it does not travel via drains to the bay, but for perspective, the straight distance to the bay is 1192 feet.
15
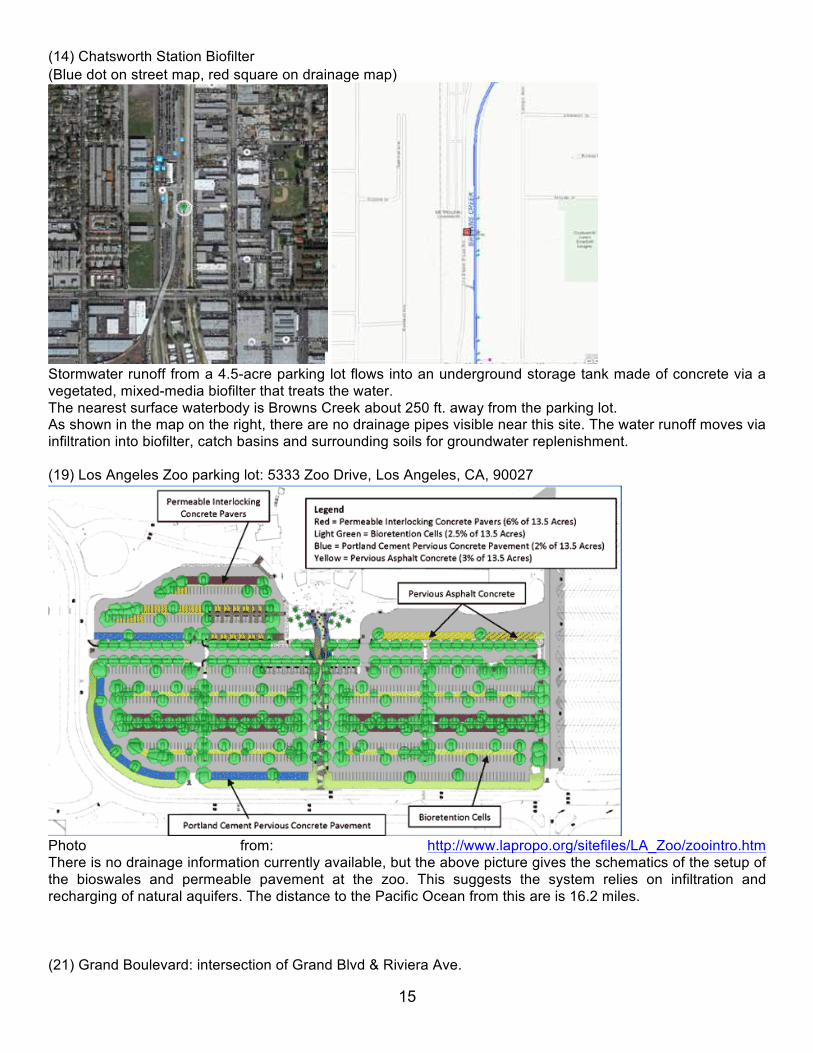
(14) Chatsworth Station Biofilter (Blue dot on street map, red square on drainage map)
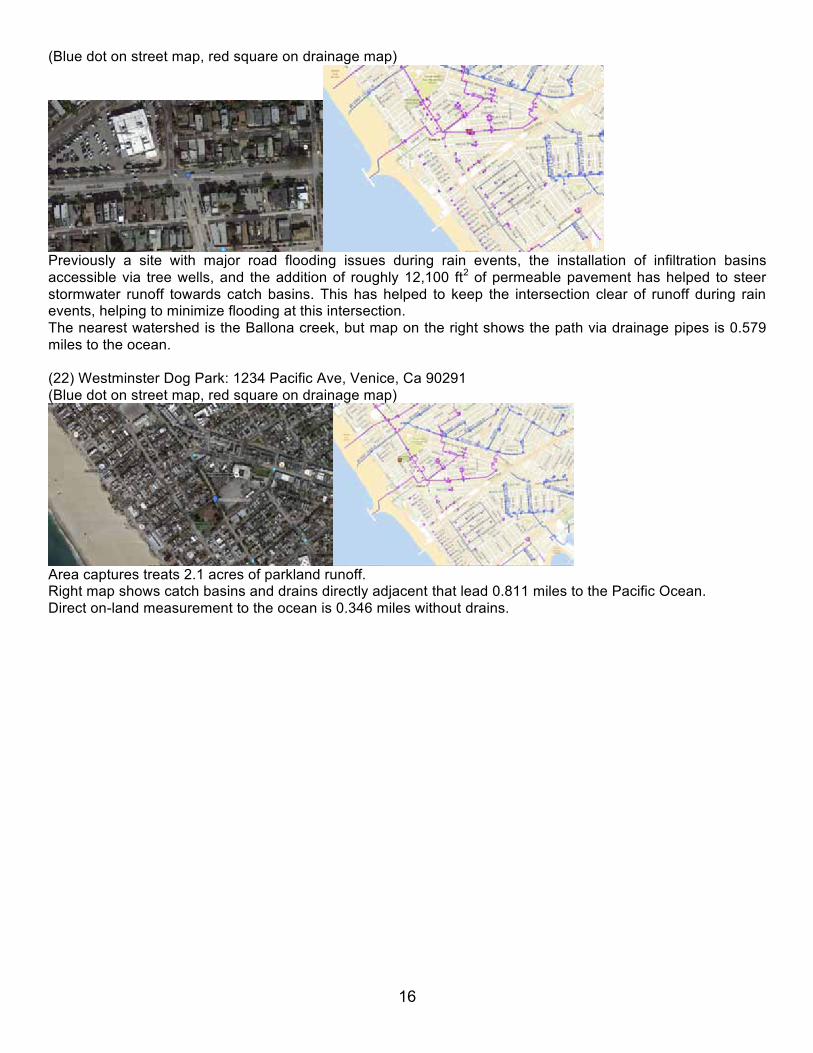
Stormwater runoff from a 4.5-acre parking lot flows into an underground storage tank made of concrete via a vegetated, mixed-media biofilter that treats the water. The nearest surface waterbody is Browns Creek about 250 ft. away from the parking lot. As shown in the map on the right, there are no drainage pipes visible near this site. The water runoff moves via infiltration into biofilter, catch basins and surrounding soils for groundwater replenishment. (19) Los Angeles Zoo parking lot: 5333 Zoo Drive, Los Angeles, CA, 90027
Photo from: http://www.lapropo.org/sitefiles/LA_Zoo/zoointro.htm There is no drainage information currently available, but the above picture gives the schematics of the setup of the bioswales and permeable pavement at the zoo. This suggests the system relies on infiltration and recharging of natural aquifers. The distance to the Pacific Ocean from this are is 16.2 miles. (21) Grand Boulevard: intersection of Grand Blvd & Riviera Ave.
16
(Blue dot on street map, red square on drainage map)
Previously a site with major road flooding issues during rain events, the installation of infiltration basins accessible via tree wells, and the addition of roughly 12,100 ft2 of permeable pavement has helped to steer stormwater runoff towards catch basins. This has helped to keep the intersection clear of runoff during rain events, helping to minimize flooding at this intersection. The nearest watershed is the Ballona creek, but map on the right shows the path via drainage pipes is 0.579 miles to the ocean. (22) Westminster Dog Park: 1234 Pacific Ave, Venice, Ca 90291 (Blue dot on street map, red square on drainage map)
Area captures treats 2.1 acres of parkland runoff. Right map shows catch basins and drains directly adjacent that lead 0.811 miles to the Pacific Ocean. Direct on-land measurement to the ocean is 0.346 miles without drains.