Title: Beyond the Lamppost: Optimal Prevention and Control ... · PDF fileTitle: Beyond the...
18
Title: Beyond the Lamppost: Optimal Prevention and Control of the Brown Tree Snake in Hawaii Authors: Kimberly M. Burnett 1 , Assistant Professor, Department of Economics University of Puget Sound, 1500 N. Warner Street, CMB 1057, Tacoma, WA 98416 Sean D’Evelyn, Ph.D. Student, Department of Economics University of Hawaii, Manoa, 2424 Maile Way Saunders Hall 542. Honolulu, HI 96822 Brooks A. Kaiser, Associate Professor, Department of Economics Gettysburg College, Box 391 Gettysburg, PA 17325; Adjunct faculty member, Department of Economics University of Hawaii, Manoa, 2424 Maile Way Saunders Hall 542. Honolulu, HI 96822 Porntawee Nantamanasikarn, Ph.D. Candidate, Department of Economics University of Hawaii, Manoa, 2424 Maile Way Saunders Hall 542. Honolulu, HI 96822 James A. Roumasset, Professor, Department of Economics University of Hawaii, Manoa, 2424 Maile Way Saunders Hall 542. Honolulu, HI 96822 Abstract We develop an integrated model for the prevention and control of an invasive species. The generality of the model allows its use for both existing and potential threats to the system of interest. The deterministic nature of arrivals in the model enables clear examination of the tradeoffs inherent when choosing between prevention and control strategies. We illuminate how optimal expenditure paths change in response to various biological and economic parameters for the case of the Brown Tree Snake in Hawaii. Results suggest that it is more advantageous to spend money finding the small population of snakes as they occur than attempting to prevent all future introductions. Like the drunk that looks for his keys only where the light is, public policy may fail to look “beyond the lamppost” for snakes that have already arrived but have not yet been detected. Actively searching for a potential population of snakes rather than waiting for an accidental discovery may save Hawaii tens to hundreds of millions of dollars in future damages, interdiction expenditures, and control costs. Key words: invasive species, Brown Tree Snake, Boiga irregularis, prevention and control, Hawaii 1 Corresponding author. Email: [email protected] Fax: 253-879-3556. Thanks to USDA/ERS (43-3AEM- 3-80083) for financial assistance.
Transcript of Title: Beyond the Lamppost: Optimal Prevention and Control ... · PDF fileTitle: Beyond the...
Title: Beyond the Lamppost: Optimal Prevention and Control of the Brown Tree Snake in Hawaii Authors: Kimberly M. Burnett1, Assistant Professor, Department of Economics University of Puget Sound, 1500 N. Warner Street, CMB 1057, Tacoma, WA 98416 Sean D’Evelyn, Ph.D. Student, Department of Economics University of Hawaii, Manoa, 2424 Maile Way Saunders Hall 542. Honolulu, HI 96822 Brooks A. Kaiser, Associate Professor, Department of Economics Gettysburg College, Box 391 Gettysburg, PA 17325; Adjunct faculty member, Department of Economics University of Hawaii, Manoa, 2424 Maile Way Saunders Hall 542. Honolulu, HI 96822 Porntawee Nantamanasikarn, Ph.D. Candidate, Department of Economics University of Hawaii, Manoa, 2424 Maile Way Saunders Hall 542. Honolulu, HI 96822 James A. Roumasset, Professor, Department of Economics University of Hawaii, Manoa, 2424 Maile Way Saunders Hall 542. Honolulu, HI 96822 Abstract We develop an integrated model for the prevention and control of an invasive species. The generality of the model allows its use for both existing and potential threats to the system of interest. The deterministic nature of arrivals in the model enables clear examination of the tradeoffs inherent when choosing between prevention and control strategies. We illuminate how optimal expenditure paths change in response to various biological and economic parameters for the case of the Brown Tree Snake in Hawaii. Results suggest that it is more advantageous to spend money finding the small population of snakes as they occur than attempting to prevent all future introductions. Like the drunk that looks for his keys only where the light is, public policy may fail to look “beyond the lamppost” for snakes that have already arrived but have not yet been detected. Actively searching for a potential population of snakes rather than waiting for an accidental discovery may save Hawaii tens to hundreds of millions of dollars in future damages, interdiction expenditures, and control costs. Key words: invasive species, Brown Tree Snake, Boiga irregularis, prevention and control, Hawaii 1 Corresponding author. Email: [email protected] Fax: 253-879-3556. Thanks to USDA/ERS (43-3AEM-3-80083) for financial assistance.

2
1. Introduction
The threat of invasive species stems from their ability to change, rapidly and irreversibly, ecosystems and the direct and indirect economic services that ecosystems provide. Species spread both accidentally and intentionally, aided by human travel and exchange. Each of several stages of invasion dictates different human response. In general, policy makers must determine the proper balance between “prevention” expenditures that lower the probability of new introductions and “control” expenditures that limit the growth rate and/or the pest population. Optimal policy regarding invasive species will minimize the expected damages and costs of control within an ecosystem and will include full consideration of the cycle of prevention (or avoidance) and control (or removals) needed over time.2 Rarely, however, have policy makers or economists integrated prevention and control for optimal intertemporal allocation of resources. The existing literature on the economics of invasive species has taken several complementary approaches to evaluating policy options, but to date these efforts remain fragmented across the timeline of an invasion. Due in part to the complexity of bioeconomic modeling and the specificity of biological factors involved in creating ecosystem changes, most studies focus on preventing entry of new species as a function of trade (Horan et al. 2002, Costello and McCausland 2003, McCausland and Costello 2004, Horan and Lupi 2005a, Horan and Lupi 2005b, Margolis, Shogren and Fischer 2005), preventing or controlling a single invading species (Olson and Roy 2002, Eiswerth and Johnson 2002, Knowler 2005, Knowler and Barbier 2000, Settle and Shogren 2002, Buhle, Margolis, and Ruesink 2005) or on broader ecosystem damages at a particular location and time (Kasulo 2000, Turpie and Heydenrych 2000). With few exceptions (Kaiser and Roumasset 2002, Burnett et al. 2006), the empirical literature has handled prevention and control separately. Either prevention or control policy is investigated, holding the other constant, and there is not a complete characterization of the threat. This separation presents particular challenges in translating theory to action because the net benefits of prevention and control are endogenous through the human policy interventions undertaken in each stage. In response, an economics of integrated prevention and control (e.g. Kaiser and Roumasset 2002, Pitafi and Roumasset 2005, Olson and Roy 2005, Perrings 2005) is slowly evolving. Insights and tools of optimal control theory are combined with biological and economic parameters to solve for the optimal expenditures on avoidance and removal over time. Applications, when attempted, have been mainly illustrative to date. In this paper we aim to improve both theory and application. We illuminate how optimal expenditure paths for prevention and control change simultaneously in response to various biological and economic parameters and solve for optimal expenditures for the real-world case of the
2 Prevention activities are generally thought of as those which reduce the likelihood of invasion, such as inspection, searches, quarantine, public education, risk assessments, import and exportation protocols, red (prohibited) listing, and green (allowed) listing. This term is somewhat misleading because expenditures on such activities only lower the probability of a pest arriving in a particular year. Accordingly, in what follows we use avoidance expenditures instead.
3
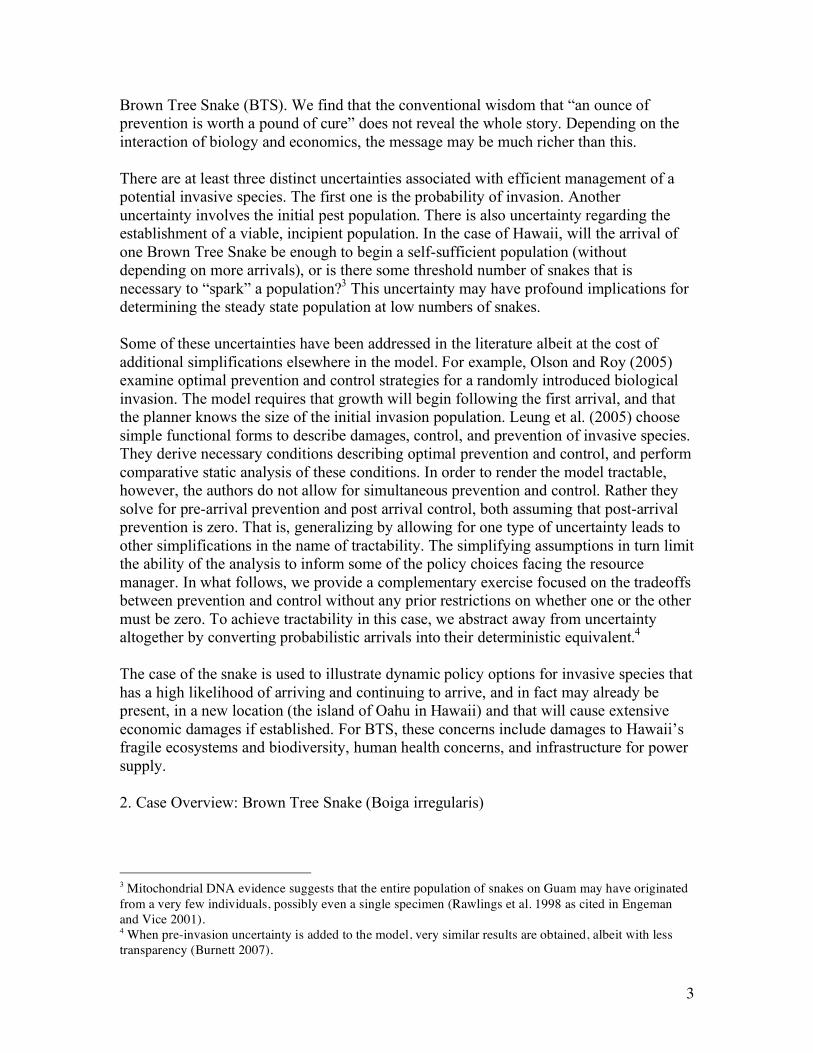
Brown Tree Snake (BTS). We find that the conventional wisdom that “an ounce of prevention is worth a pound of cure” does not reveal the whole story. Depending on the interaction of biology and economics, the message may be much richer than this. There are at least three distinct uncertainties associated with efficient management of a potential invasive species. The first one is the probability of invasion. Another uncertainty involves the initial pest population. There is also uncertainty regarding the establishment of a viable, incipient population. In the case of Hawaii, will the arrival of one Brown Tree Snake be enough to begin a self-sufficient population (without depending on more arrivals), or is there some threshold number of snakes that is necessary to “spark” a population?3 This uncertainty may have profound implications for determining the steady state population at low numbers of snakes. Some of these uncertainties have been addressed in the literature albeit at the cost of additional simplifications elsewhere in the model. For example, Olson and Roy (2005) examine optimal prevention and control strategies for a randomly introduced biological invasion. The model requires that growth will begin following the first arrival, and that the planner knows the size of the initial invasion population. Leung et al. (2005) choose simple functional forms to describe damages, control, and prevention of invasive species. They derive necessary conditions describing optimal prevention and control, and perform comparative static analysis of these conditions. In order to render the model tractable, however, the authors do not allow for simultaneous prevention and control. Rather they solve for pre-arrival prevention and post arrival control, both assuming that post-arrival prevention is zero. That is, generalizing by allowing for one type of uncertainty leads to other simplifications in the name of tractability. The simplifying assumptions in turn limit the ability of the analysis to inform some of the policy choices facing the resource manager. In what follows, we provide a complementary exercise focused on the tradeoffs between prevention and control without any prior restrictions on whether one or the other must be zero. To achieve tractability in this case, we abstract away from uncertainty altogether by converting probabilistic arrivals into their deterministic equivalent.4 The case of the snake is used to illustrate dynamic policy options for invasive species that has a high likelihood of arriving and continuing to arrive, and in fact may already be present, in a new location (the island of Oahu in Hawaii) and that will cause extensive economic damages if established. For BTS, these concerns include damages to Hawaii’s fragile ecosystems and biodiversity, human health concerns, and infrastructure for power supply. 2. Case Overview: Brown Tree Snake (Boiga irregularis)
3 Mitochondrial DNA evidence suggests that the entire population of snakes on Guam may have originated from a very few individuals, possibly even a single specimen (Rawlings et al. 1998 as cited in Engeman and Vice 2001). 4 When pre-invasion uncertainty is added to the model, very similar results are obtained, albeit with less transparency (Burnett 2007).

4
Hawaii faces several threats from invasive species, all of which must be considered simultaneously for optimal avoidance and removal efforts to minimize expected damages to the state’s ecological assets and economy. Perhaps the most dramatic candidate for Hawaii’s top pest is the Brown Tree Snake (Boiga irregularis). This native of Australia and New Guinea, upon establishment in Hawaii, would introduce snakes5 to the islands and create a list of damages that include direct economic impacts as well as widespread ecological disaster. Potential damages are inferred from Guam, where the snake was introduced to the previously snake-free island in the 1950s. Since then, high-density populations of 12,000 snakes per square mile have arisen, sending thousands to the hospital with venomous bites over the last 20 years. The snakes have been blamed for the extirpation of 11 of 18 bird species, and currently generate power outages 1.5 hours every other day (up from one every 3-4 days in 1997). Finally, poultry productivity has been adversely affected (Detailed power and medical data are courtesy of Stephanie Shwiff, USDA). The snake is an imminent threat to Hawaii. Eight snakes have been intercepted and verified as BTS in the state since 1981 (Rodda et al. 1999 and Rodda 2005, personal communication). Many more sightings of snakes that were neither caught nor identified have occurred as well. Between 1969 and 1988, over 150 snakes were discovered in the state, with 21 in 1987 alone. Authorities are unsure of the exact population of BTS in Hawaii, but estimate there may be between 0 and 100 individuals. Trade between Guam and Hawaii is extensive and Hawaii now pays to support Guam’s efforts to prevent the Brown Tree Snake from escaping the island. We use the considerable information from Guam’s infestation and expenditures to model an integrated avoidance and removal strategy for minimizing expenditures on and damages from the snake. 3. Methodology Optimal control theory is employed to determine the paths of expenditures that minimize the present value of avoidance expenses, removal costs, and damages over time. For the sake of computational simplicity and clarity of exposition, we use a deterministic model. Each period, the snake population is known and new entrants arrive on a continuous basis. The solution involves a steady state population of snakes and corresponding time paths of expenditures on avoidance and removals. The problem is to:
0
where ( ) ( )rtt t t tMax V V c D dtye n x n
!"= " + +# $% &'
(1) subject to
( ) ( )t t t tg f yn n x= ! +& (2)
5 With the exception of Ramphotyphlops braminus, a harmless blind snake present in Hawai`i since 1930.
5
0tx ! (3) 0ty ! (4)
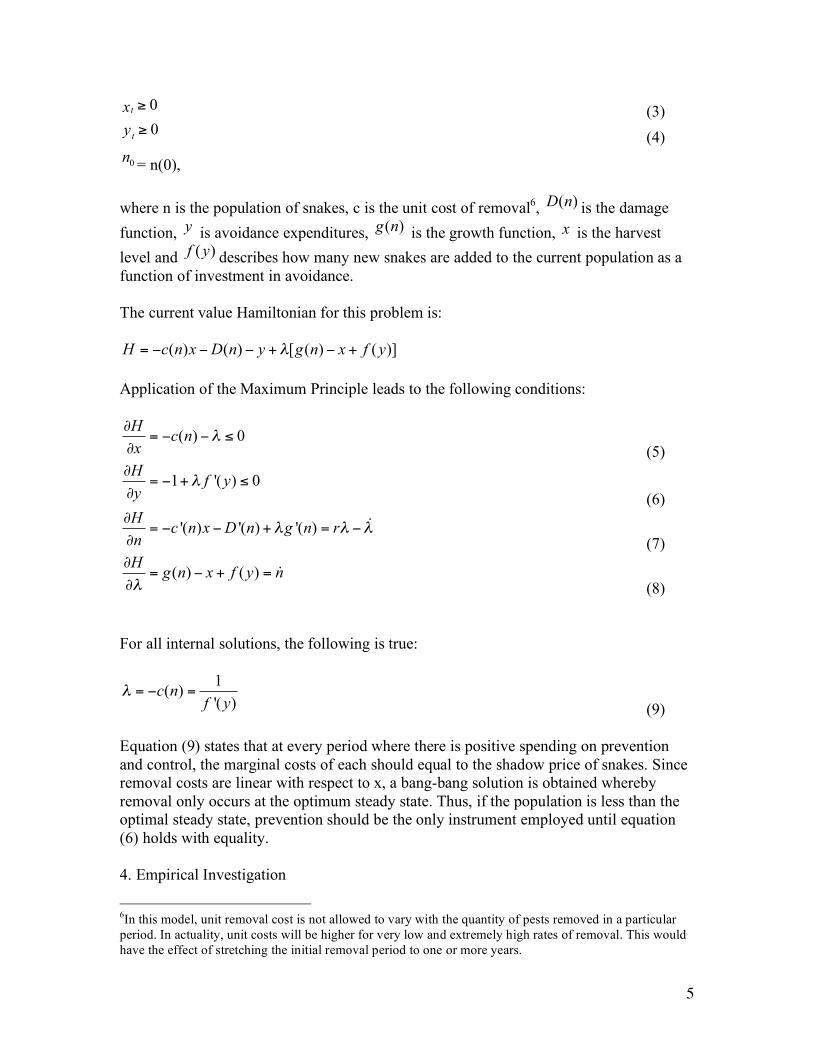
0n = n(0), where n is the population of snakes, c is the unit cost of removal6, ( )D n is the damage function, y is avoidance expenditures, ( )g n is the growth function, x is the harvest level and ( )f y describes how many new snakes are added to the current population as a function of investment in avoidance. The current value Hamiltonian for this problem is:
( ) ( ) [ ( ) ( )]H c n x D n y g n x f y!= " " " + " + Application of the Maximum Principle leads to the following conditions:
( ) 0H c nx
!"
= # # $" (5)
1 '( ) 0H f yy
!"
= # + $" (6)
'( ) '( ) '( )H c n x D n g n rn
! ! !"
= # # + = #"
&
(7)
( ) ( )H g n x f y n!
"= # + =
"&
(8) For all internal solutions, the following is true:
1( )'( )
c nf y
! = " = (9)
Equation (9) states that at every period where there is positive spending on prevention and control, the marginal costs of each should equal to the shadow price of snakes. Since removal costs are linear with respect to x, a bang-bang solution is obtained whereby removal only occurs at the optimum steady state. Thus, if the population is less than the optimal steady state, prevention should be the only instrument employed until equation (6) holds with equality. 4. Empirical Investigation
6In this model, unit removal cost is not allowed to vary with the quantity of pests removed in a particular period. In actuality, unit costs will be higher for very low and extremely high rates of removal. This would have the effect of stretching the initial removal period to one or more years.

6
The immediate obstacle to estimating economic impacts to Oahu, as with any potential invasive species in a new habitat, is that we have no direct evidence on which to base cost, damage, and growth function parameters. Instead, we obtain rough estimates based on indirect evidence from Guam and the subjective assessments of invasive-species research scientists and managers. The resulting parameters are discussed below, followed by results.
4.1 Growth Function
We utilize the following form of the logistic function,
minmin
max
( )( ) ( ) 1 ,
n ng n b n nn
! " #= " "$ %
& ' (11) to represent the potential growth of the snakes. This is equivalent to a logistic growth function starting at minn . In this case, the intrinsic growth rate, b, is 0.6, based on estimated population densities at different time periods on Guam (Rodda et al. 1992 and personal communication 2005). The maximum elevation range of the snake may be as high as 1,400 m (Kraus and Cravalho 2001), which includes the entire island of Oahu. There are approximately 150,000 hectares of potential snake habitat on Oahu. Assuming a maximum population density of 50 snakes/hectare, carrying capacity ( maxn ) for the island of Oahu is 7,500,000. Aside from integrated prevention and control, our model sets itself apart from current invasive species literature in one additional way. Unlike most bioeconomic models, where growth begins with the first individual, we assume a type of strong Allee effect (Stephens et al. 1999), with a minimum population level before which growth of the snake is not possible. For our case we assume this population ( minn ) is two. It is possible that the minimum reproducible population could be much higher than two, given the size of the island and possible gender distributions. It is also possible that the minimum population is one, as female snakes are capable of (1) delaying birth for several months through “freezing” fertilized embryos and (2) parthenogenesis (BTS Technical Meeting, 2005).While it is possible that the Guam population originated from a single specimen. we use two here as a reasonable estimate that allows a clear examination of the tradeoffs when arrival and establishment are not interchangeable. Once this minimum or ‘spark’ population is reached the population grows along a logistic growth path. 4.2 Damage Function
Major damages from BTS on Guam include lost productivity and repair costs due to power outages, medical costs from snakebites, and lost biodiversity from the extirpation of native bird species. Using data obtained from Guam, and positing a linear relationship between damages and number of snakes, we derive an equation for damages as a function of snakes.

7
122.31 tD n= ! . (12)
For a more complete look at the derivation of this function, see Appendix 1. 4.3 Removal Cost Function
While to date there has yet to be a successful capture of BTS based on a credible sighting report or other search activities in Hawaii, we were able to obtain success rates for various capture techniques in an enclosure in Guam.7 Using this data, we constructed a marginal cost function that is decreasing in n, but independent of x.
7*
0.8329
1.547 10( )c nn
= (13)
For a more complete look at the derivation of this function, see Appendix 2. 4.4 Arrival Function We assume that avoidance expenditures buy a reduction in the number of snakes that arrive and become established. Discussions with expert scientists and resource managers led us to believe that under current avoidance expenditures of $2.6 million, Oahu faces an approximate 90% probability that at least one snake will arrive over a ten-year time horizon. If expenditures increased to $4.7 million, the probability of at least one arrival would decrease two-fold, to about 45% over the ten-year horizon. Finally, if we increase preventative spending to $9 million per year, the probability of an arrival decreases another two-fold, to about 20%. We convert these probabilities to expected values using the Poisson distribution. We then use the Weibull curve to fit the arrival function because of its flexible shape and ability to model a wide range of failure rates (e.g., in engineering, such as capacitor, ball bearing, relay and material strength failures). Here, the Weibull describes failure of the avoidance barrier. The resulting function is
0.5( ) exp(2.3 0.00224 )f y y= ! (14) For tractability, we assume that arrivals and removals are continuous, that is the model allows for non-integer values of snakes to arrive, which is at odds with reality but helpful for approximation. Figure 1 illustrates this function. 7 There have been two recent combined attempts by state and federal agencies to catch snakes following single sighting events. One program was executed near Hana, Maui and the other in Kona, Hawaii. Each program lasted 3 weeks and entailed paying trained personnel overtime wages and flying specialized searchers out from Guam and the Northern Mariana Islands. Resource managers estimate each program to have cost around $76,000.

8
For more explanation on the Poisson distribution and the Weibull function, see Appendix 3.
<<Figure 1 here>> 4.5 Optimal Avoidance and Removal Results
As mentioned above, there is considerable uncertainty surrounding the present population of snakes in Hawaii. Leading biologists and resource managers studying BTS believe that there is a high likelihood that the current snake population is less that 100 and that the population is most likely to lie between zero and 50 (Burnett 2007). Accordingly we contrast optimal policy in the following application for the cases in which initial population is zero and 50. First consider the case wherein initial population is zero. Figure 2 illustrates the optimal expenditure paths for removing and avoiding snakes on Oahu. Under the optimal expenditure path, it takes roughly 10 years before the population approaches two snakes. Because we assume that population growth is zero until the threshold is crossed, it is optimal to maintain the population at minn , the maximum value of n such that the species does not reproduce.
<<Figure 2 here>> As the number of snakes grows from zero to two, optimal avoidance expenditures increase from $2.94 million to $3.2 million. As per Equation (7), the shadow value of removing snakes (λ) is increasing at approximately the rate of interest (since marginal damages are negligible and removal is zero); hence prevention expenditures increase over time. This increase will continue until approximately the tenth year, when the steady state of two snakes is reached and it becomes optimal to utilize both instruments. In the steady state, $3.2 million is spent annually to keep average arrivals equal to 0.84 snakes and $1.6 million to remove an average of 0.84 snakes every year. Optimal prevention and control changes fairly dramatically if we assume an initial population of 50 snakes on Oahu. After removing 48 snakes immediately at a cost of $74.0 million, we spend $1.6 million per year removing snakes and $3.2 million preventing more from entering. The high cost associated with removing the 48 snakes is due to the nature of the model. Optimal policy requires that the steady state be obtained instantly, since there is no constraint on the rate of removal. In practice this means that removal should be done as rapidly as possible, e.g. in one year. Table 1 reports the optimal policy of avoidance and removal under both of these assumptions.
<<Table 1 here>> Whether or not we are currently spending “enough” on avoidance or removals depends on the actual number of snakes currently present in Hawaii. If indeed there are no snakes

9
in the state, current avoidance expenditures are remarkably close to optimal. However, if there is a small population of, say, 50 snakes, optimal policy calls for significantly increased removal expenditures (from $76,000 to $75.6 million) and approximately $340,000 more in avoidance measures. This result emphasizes the need for better information regarding the current population of snakes in Hawaii. 4.6 Status Quo vs. Optimal Policy
In the status quo or business-as-usual scenario, managers continue to spend exactly $76,000 on control and 2005 prevention expenditures of $2.6 million, regardless of the actual population. This policy will result in a population right below the carrying capacity of 7.5 million and results in losses exceeding $20 billion. However, it is highly unlikely that the government would continue spending such a small amount in the face of large damages. Inasmuch as there is no way of knowing when the State would readjust their policy and how it would be readjusted, we consider various adjustments in Table 2.
<<Table 2 here>> All of the adjustments consist of “calling a halt” to growth, albeit at different populations, and removing thereafter just enough snakes to keep the population constant. Table 2 shows that improper management of BTS can easily cost Hawaii millions of dollars. Even if the problem is ignored only until the optimal population of 2 snakes is reached, almost a million dollars in value is still lost. The situation is much worse if status quo spending is adjusted later. For example, if spending is adjusted only when the snake population reaches 10,000, over $1 billion is lost. If the snakes multiply until they reach a population of 1 million, over $5 billion is foregone. 4.7 Sensitivity to minn A common tradition in modeling fisheries or other biological populations involves approximating growth with a logistic growth function without assuming any minimum viable or “spark” population size. We follow this tradition and solve the model without the spark population. The results are displayed in Table 3.
<<Table 3 here>> While the steady state population of 1.73 is not very different from the previous case, total expenditures are substantially higher, since there is more growth to prevent and control. Expenditure on prevention is also higher than in the previous case because reproducing snakes are more costly to the island and thus need to be controlled more intensively. In contrast, we also explore the case wherein spark population is four snakes. This allows some insights into sensitivity and also symmetry of losses regarding an estimate of spark population that is too high or too low. The higher spark population implies that the
10
marginal benefits of control are lower and both optimal prevention and control are lowered accordingly. For spark population of four and an initial population of zero, steady state prevention and control levels are $2.5 and $1.4 million a year respectively. The total value of this program is $179 million, about $50 million less than when the spark population is assumed to be two. As might be expected, losses from being too optimistic (setting spark population too high) results in larger losses than being conservative and setting the estimate too low; larger spark population assumptions may lead to drastic under-spending on both policies. The loss function of spark population error size is nonsymmetrical; underestimating the spark population will cause higher spending, thus avoiding higher losses, while overestimating the spark population will result in much lower spending, leading to more significant future losses due to unanticipated growth that is not being controlled. 5. Conclusions, Limitations and Directions for Further Research
In this paper, we develop an integrated model for the prevention and control of an invasive species. The generality of the model allows it to be used for both existing and potential threats to the system of interest. The deterministic nature of arrivals in the model enables clear examination of the tradeoffs inherent when choosing between prevention and control strategies. This work contributes to the economics of invasive species literature by explicitly considering the implications of minimum viable population levels. While our assumption of the spark population does not change the result that a low steady state population of snakes is optimal, this scenario is substantially less costly than the immediate-growth scenario. We also take a preliminary step towards recognizing uncertainty about initial pest population. Higher initial populations will call for significantly larger investments in removal to accommodate a rapid reduction to a low steady state. Application of this theory to the threat of the BTS to Hawaii provides useful insights and policy prescriptions. If the official count is correct and there are really no snakes in Hawaii, and the minimum viable population requires two snakes, current prevention expenditures are close to the optimal first period level of $2.94 million. In this scenario prevention expenditures should be gradually increased over the next ten years and maintained indefinitely at $3.2 million to keep average arrivals equal to 0.84 snakes. In contrast, if there are already fifty snakes in Hawaii, current expenditures should be set immediately at $3.2 million and maintained at that level indefinitely. Regarding population control, if there are currently zero snakes in Hawaii, the optimal policy requires zero removal expenditures. However, if there is even a small population of 50 snakes already on Oahu, the status quo policy falls glaringly short by over $75 million. The immense difference in recommended control policies is a result of high marginal costs of removal at low populations combined with rapid growth and high damages. Even a limited amount of additional information regarding the initial population may increase efficiency of policy recommendations. For example, if managers believe there is a 1/3 probability that there are currently 50 snakes and a 2/3 probability of zero snakes, then optimal removal expenditures will be greater than $25 million, due to
11
a nonsymmetrical loss function regarding over- versus under-estimating the actual population. Balancing prevention and control as if there are zero snakes when there is actually a substantial probability that some snakes are already present is clearly erring in the direction of too little control. Policy recommendations related to estimating the minimum viable population size are similar in spirit to those regarding initial population size. Sensitivity analysis regarding minn suggests that in the face of uncertainty, it is better to be conservative when setting
the minimum viable population than too optimistic. Higher estimated spark populations than actual may lead to drastic underspending on both policies. When the population has not been identified but there is a substantial probability that one exists, early detection is the appropriate strategy. While our analysis subsumes early detection and rapid response (ED/RR) into the control instrument, additional insight may be gained by modeling ED/RR explicitly, especially given the importance of management at very low population levels. Control at low populations will also help to focus attention on the technology of search; the main objective is keeping the population below that which is required for establishment. The deterministic model converts expected snake arrivals into actual arrivals, based on expert opinions about likelihood of invasion under different funding scenarios. This simplification was made for two reasons. First, because of the uncertainty surrounding the initial population, building a straightforward probability distribution is highly complex. Furthermore, there is imperfect scientific information concerning the probability distribution of a snake’s arrival to Hawaii. A natural extension of the model would replace this arrival function with a discrete probability distribution over snake arrivals in each period. Stochastic dynamic programming may prove a suitable tool for this case, albeit at the cost of lost transparency in analysis and complexity in numerical computation. Despite the limitations noted, the deterministic approach illuminates the tradeoffs between prevention and control and assists with practical policy formulation for BTS management in the Pacific. Results suggest that it is more advantageous to spend money finding the small population of snakes as they occur than concentrating almost all expenditures on prevention. Like the drunk that looks for his keys only where the light is though he dropped them elsewhere, public policy may fail to look “beyond the lamppost” for snakes that have already arrived but have not yet been detected. Actively searching for a potential population of snakes rather than waiting for an accidental discovery may save Hawaii tens to hundreds of millions of dollars in future damages, interdiction expenditures, and control costs.
12
Bibliography Buhle, E. R., M. Margolis, and J. L. Ruesink. 2005. “Bang for Buck: Cost-Effective
Control of Invasive Species with Different Life Histories.” Ecological Economics 52(3): 355-66.
Burnett, K. 2007. “Optimal Prevention and Control of Invasive Species: The Case of The Brown Tree Snake.” Ph.D. Dissertation, University of Hawaii at Manoa. http://www2.hawaii.edu/%7Ekburnett/Diss.pdf
Burnett, K., B. Kaiser, B. Pitafi, and J. Roumasset. 2006. “Prevention, Eradication, and Containment of Invasive Species: Illustrations from Hawaii.” Agricultural and Resource Economics Review 35(1): 63-77.
Costello, C. and C. McAusland. 2003. "Protectionism, Trade, and Measures of Damage from Exotic Species Introductions," American Journal of Agricultural Economics 85(4): 964-975.
Eiswerth, M.E. and W.S. Johnson. 2002. “Managing Nonindigenous Invasive Species: Insights from Dynamic Analysis.” Environment and Resource Economics 23(3): 319-342.
Fritts, T.H. and D. Chiszar. 1999. “Snakes on Electrical Transmission Lines: Patterns, Causes, and Strategies for Reducing Electrical Outages Due to Snakes.” In G. H. Rodda, Y. Sawai, D. Chiszar, and H. Tanaka, eds., Problem Snake Management: The Habu and the Brown Treesnake. Ithaca, New York: Cornell University Press.
Horan, R.D., C. Perrings, F.Lupi, and E.H. Bulte. 2002. “The Economics of Invasive Species Management: Biological Pollution Prevention Strategies under Ignorance.” American Journal of Agricultural Economics 84(5): 1303-1310.
Horan, R.D. and F. Lupi. 2005a. “Economic Incentives for Controlling Trade-Related Biological Invasions in the Great Lakes.” Agricultural and Resource Economics Review 34(1): 75-89.
Horan, R.D. and F. Lupi. 2005b. “Tradable Risk Permits to Prevent Future Introductions of Invasive Alien Species into the Great Lakes.” Ecological Economics 52(3): 289-304.
Kaiser, B. and J. Roumasset. 2002. “Optimal Control of Exotic Species: Preventing Snakes in Hawaii.” Manuscript, presented at the 77th Annual Conference of the Western Economic Association International, Seattle, WA (July 2002).
Kasulo, V. 2000. “The Impact of Invasive Species in African Lakes.” In C. Perrings, M. Williamson, and S. Dalmazzone, eds., The Economics of Biological Invasions. Cheltenham, UK: Edward Elgar.
Knowler, D. 2005. “Reassessing the Costs of Biological Invasion: Mnemiopsis leidyi in the Black Sea.” Ecological Economics 52(2): 187-199. Knowler, D. and E.B. Barbier. 2000. “The Economics of an Invading Species: A
Theoretical Model and Case Study Application.” In C. Perrings, M. Williamson, and S. Dalmazzone, eds., The Economics of Biological Invasions. Cheltenham, UK: Edward Elgar.
Loomis, J.B. and D.S. White. 1996. “Economic Benefits of Rare and Endangered Species: Summary and Meta-analysis.” Ecological Economics 18(3): 197-206. Margolis, M., J.F. Shogren, and C. Fisher. 2005. “How Trade Politics Affect Invasive
13
Species Control.” Ecological Economics 52(3): 305-313. McAusland, C. and C. Costello. 2004. “Avoiding Invasives: Trade-Related Policies for
Controlling Unintentional Exotic Species Introductions.” Journal of Environmental Economics and Management 48(2): 954-977.
Olson, L.J, S. Roy. 2005. “On Prevention and Control of an Uncertain Biological Invasion.” Review of Agricultural Economics 27(3): 491-497. Olson, L.J, S. Roy. 2002. “The Economics of Controlling a Stochastic Biological Invasion.” American Journal of Agricultural Economics 84(5): 1311-1316. Perrings, C. 2005. “Mitigation and Adaptation Strategies for the Control of Biological Invasions.” Ecological Economics 52(3): 315-325. Pitafi, B. and J. Roumasset. 2005. “The Resource Economics of Invasive Species.”
Manuscript presented at the NAREA Invasive Species Workshop, held in Annapolis, MA June 14-15, 2005.
Rodda, G.H., Y. Sawai, D. Chiszar, and H. Tanaka, editors. 1999. Problem Snake Management: The Habu and the Brown Treesnake. Ithaca, New York: Cornell University Press.
Rodda, G.H., T.H. Fritts, and P.J. Conry. 1992. “Origin and Population Growth of the Brown Treesnake, Boiga Irregularis, on Guam.” Pacific Science 46(1): 46-57. Settle, C. and J. Shogren. 2002. “Modeling Native-Exotic Species within Yellowstone Lake.” American Journal of Agricultural Economics 84(5): 1323-1328. Shwiff, S. 2005. APHIS/USDA/NWRC, Fort Collins, Colorado. Personal communication
regarding data for medical visits and power outages caused by Brown Tree Snakes on Guam.
Stephens, P.A., W.J. Sutherland and R.P. Freckleton. 1999. What is the Allee Effect? Oikos 87: 185-190. Turpie, J. and B. Heydenrych. 2000. “Economic Consequences of Alien Infestation of the
Cape Floral Kingdom’s Fynbos Vegetation.” In C. Perrings, M. Williamson, and S. Dalmazzone, eds., The Economics of Biological Invasions. Cheltenham, UK, Edward Elgar.
US Geological Survey. 2005. “Economic Damages from the Brown Tree Snake,” Available at http://www.fort.usgs.gov/resources/education/bts/impacts/economic.asp (accessed May 2005).

14
Table 1. A Summary of the Optimal Policy
1st period
Steady state
Present value
0n =0 0n =50 n=2 0n =0 0n =50 Removal, x 0 48.184 0.184 - - Cost of x 0 75.6 million 1.60 million 65 million 154 million y 2.94 million 3.19 million 3.19 million 158 million 195 million Arrivals 0.216 0.184 0.184 - - Damage $0 $243 $243 $11,000 $12,100 Total 2.94 million 78.8 million 4.79 million 223 million 349 million Table 2. Losses from Following Alternative Status Quo Policies Alternative status quo steady states Loss vs. Optimal
2 $973,000 10 $479.2 m
100 $614.9 m 10,000 $1.27 b
100,000 $2.09 b 1,000,000 $5.46 b
Business as usual $24.2 b Table 3. Optimal Policy with Standard Logistic Growth
1st period
Steady state
Present value
0n =0 0n =50 n=1.73 0n =0 0n =50 Removal, x 0 49.48 1.21 - - Cost 0 87.7 million 11.8 million 515 million 667 million y 11.1 million 3.34 million 3.34 million 190 million 167 million Arrivals 0.00574 0.167 0.167 - - Damage $0 $210 $210 $9,410 $10,500 Total 11.1 million 91.0 million 15.1 million 705 million 833 million
15
Appendix 1. Derivation of the damage function
Guam has a land area of approximately 53,900 hectares, with a maximum elevation of about 400 meters. With a population density of 50 snakes per hectare, the carrying capacity for Guam is 2,695,000 snakes. With approximately 272 hours of power outages per year attributable to snakes, we estimate that there are 1.01*10-4 power outages per snake per year. Fritts and Chiszar estimate that an hour-long power outage on Oahu causes $1.2 million in lost productivity and damages (Fritts and Chiszar 1997). Positing a linear relationship between snake population and power outages, the expected damage per snake on Oahu, in terms of power outage costs, is $121.11. Guam has experienced a snake-bite frequency average of 170 bites per year, at an average cost of $264.35 per hospital visit. Thus the expected number of bites per snake per year is at least 6.31*10-5, implying an expected cost of $0.02 per snake. Oahu’s population density below 1,400 m is approximately 3 times that of Guam’s, so we adjust the expected costs for Hawaii to $0.07 per snake. The Brown Tree Snake has extirpated 61% (11 of 18) of Guam’s native bird population since its arrival (USGS 2005). Contingent valuation studies have estimated the average value of the continued existence of an endangered bird species at $31 per household per year for Hawaii (Loomis and White 1996). There are 8 endangered bird species on Oahu whose main habitat is below 1,400 m and are at considerable risk of extirpation. To obtain a conservative interval estimate, we assume that the birds are valuable to households on Oahu alone. We assume that at carrying capacity, there is roughly a 98% chance of losing a single species and another 5% chance of losing a second bird species. Using an expected value to 280,000 Oahu households of losing one species of $8.68 million, the expected per snake damage level is $1.13 per year, assuming that each snake is equally likely to contribute to the extirpation. Thus, expected damages from human health factors, power outages, and expected endangered species losses can be expressed as:
122.31 tD n= ! .
16
Appendix 2. The Removal Cost Function For simplicity's sake we chose to start with a cost function whose marginal cost of removal was dependent of the stock of the invasive, but independent of the harvest rate. Parameterization of our cost function was based upon information provided by Gordon Rodda of the USGS Fort Collins Science Center. Rodda studied an enclosed area of 5 hectares containing roughly average levels of both snakes and prey for over a year. During that time, he observed the life cycle patterns, relative sizes, and most importantly to our study, the success rates of two capture techniques. The first method, setting traps, had a relatively high success rate with larger snakes but was completely ineffective at capturing the smaller ones. Visual searches, on the other hand, had much lower success rates than trapping, but were able to 'catch' all sizes of snakes. In Rodda's enclosure study, all 'capture' data was collected and the individual was recorded and then released back into the enclosure. This enabled a detailed study of individual snake heterogeneity. Results are presented below. Rodda estimated that were these methods put into practice on Hawaii, each night of trapping would cost roughly $150 per 5-hectare area, whereas visual searches would cost closer to $300 per area per night. We then estimated the expected number of nights to catch a single snake if somewhere on the island by each of the two methods. We also calculated the fraction of a night (or fraction of the island searched) before the first of 100 snakes were found by each of the two methods. Because in a steady state situation where larger snakes were continually trapped and removed, we estimated the distribution of a steady state population where trapping was frequent. From there we estimated that due to the rapid growth rate of the snakes, even when the larger snakes were killed off, we could still employ mostly trapping to catch the younger snakes as they grew. Thus the final cost function is based upon spending 1/6 of our time with visual searches and the other 5/6 removing the population through trapping.
17
Appendix 3. The Arrival Function The Poisson Distribution The binomial distribution converges towards the Poisson distribution as the number of trials goes to infinity while the mean remains fixed. The Poisson distribution is the limiting distribution of a series of Bernoulli trials as the time over which those trials take place approach zero. In our particular case this allows us the ability to predict the expected number of snake arrivals over any given period of time so long as a few conditions are met:
a) At least one probability of arrival for some number of snakes over a given amount of time is known
b) Snake arrivals can take place on a continuous time basis with no one time more probable than any others
c) Each snake arrival is independent of any others (note: this does rule out a group of snakes arriving together)
Once we know that the probability of x snakes arriving over the course of y days (or years or seconds), then we can use this simple formula to determine the Poisson distribution’s primary parameter, λ, by means of the following formula:
( )!
xeP xx
!!"
=over the given period of time. One interesting result of this is that λ is both
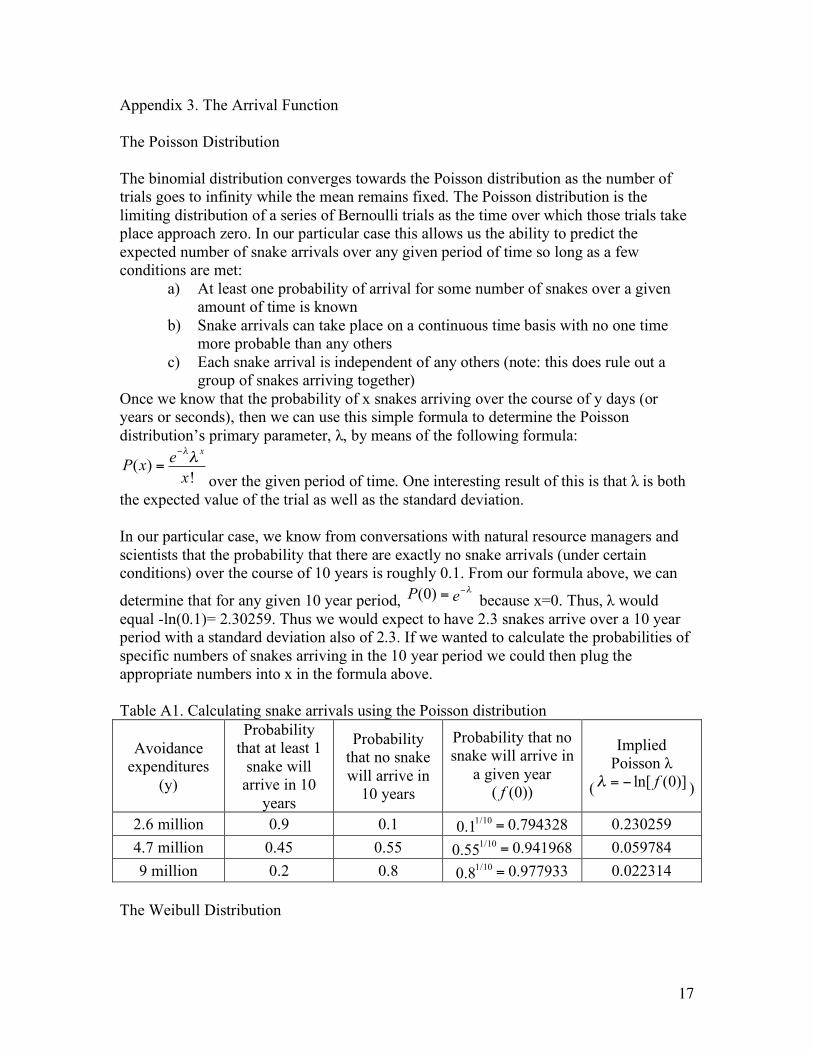
the expected value of the trial as well as the standard deviation. In our particular case, we know from conversations with natural resource managers and scientists that the probability that there are exactly no snake arrivals (under certain conditions) over the course of 10 years is roughly 0.1. From our formula above, we can
determine that for any given 10 year period, (0)P e !"= because x=0. Thus, λ would equal -ln(0.1)= 2.30259. Thus we would expect to have 2.3 snakes arrive over a 10 year period with a standard deviation also of 2.3. If we wanted to calculate the probabilities of specific numbers of snakes arriving in the 10 year period we could then plug the appropriate numbers into x in the formula above. Table A1. Calculating snake arrivals using the Poisson distribution
Avoidance expenditures
(y)
Probability that at least 1
snake will arrive in 10
years
Probability that no snake will arrive in
10 years
Probability that no snake will arrive in
a given year ( (0))f
Implied Poisson λ
( ln[ (0)]f! = " )
2.6 million 0.9 0.1 1/10 0.7943280.1 = 0.230259 4.7 million 0.45 0.55 1/10 0.9419680.55 = 0.059784 9 million 0.2 0.8 1/10 0.9779330.8 = 0.022314
The Weibull Distribution
18
The Weibull distribution takes the form ( )( )
ca bxf x e != . The Weibull distribution was chosen for several of its nice properties. First of all, we assume that the first dollar spent on prevention would be much more effective than the billionth dollar spent on control, but that every increase in spending would decrease the probability of arrival (and thus the expected value). A strictly decreasing convex function was thus desired. We also assume that as spending increased a perfectly impenetrable barrier with no BTS arrivals was approached. The Weibull also has the nice feature that the limit as prevention expenditures goes to 0, of marginal snakes prevented approaching infinity. This guarantees that we will spend on prevention in every period.