
TITLE: An Evaluation of Holographic Technology in Close ... · Evaluation of Holographic Technology...
47
AFRL-RH-AZ-TR-2008-0025 Evaluation of Holographic Technology in Close Air Support Mission Planning and Execution John J. Martin 1 Mark Holzbach 2 Joseph Riegler 3 Chin Ki Tam, 2d Lt, USAF 1 Adam Smith 4 Air Force Research Laboratory 1 6030 South Kent Street Mesa AZ 85212 Zebra Imaging, Incorporated 2 9801 Metric Blvd., Suite 200 Austin TX 78758 The Boeing Company 3 L-3 Communications 4 6030 South Kent Street Mesa AZ 85212 June 2008 Final Report for June 2007 to May 2008 Distribution A. Approved for public release; distribution unlimited. Air Force Research Laboratory Human Effectiveness Directorate Warfighter Readiness Research Division
Transcript of TITLE: An Evaluation of Holographic Technology in Close ... · Evaluation of Holographic Technology...
AFRL-RH-AZ-TR-2008-0025
Evaluation of Holographic Technology in Close Air Support
Mission Planning and Execution
John J. Martin1 Mark Holzbach2 Joseph Riegler3
Chin Ki Tam, 2d Lt, USAF1 Adam Smith4
Air Force Research Laboratory 1 6030 South Kent Street
Mesa AZ 85212
Zebra Imaging, Incorporated 2 9801 Metric Blvd., Suite 200
Austin TX 78758
The Boeing Company 3 L-3 Communications 4 6030 South Kent Street
Mesa AZ 85212
June 2008 Final Report for June 2007 to May 2008
Distribution A. Approved for public release; distribution unlimited. Air Force Research Laboratory
Human Effectiveness Directorate Warfighter Readiness Research Division

NOTICES This report is published in the interest of scientific and technical information exchange and its publication does not constitute the Government’s approval or disapproval of its idea or findings. Using Government drawings, specifications, or other data included in this document for any purpose other than Government procurement does not in any way obligate the U.S. Government. The fact that the Government formulated or supplied the drawings, specifications, or other data does not license the holder or any other person or corporation; or convey any rights or permission to manufacture, use, or sell any patented invention that may relate to them. The Government’s rights to use, modify, reproduce, release, perform, display, or disclose any technical data or computer software contained in this report are restricted by paragraph (b)(4) of the Rights in Noncommercial Technical Data and Computer Software, Small Business Innovation Research (SBIR) Program clause (DFARS 252.227-7018 (June 1995)) contained in the above identified contract. No restrictions apply after the expiration date shown above. Any reproduction of technical data, computer software, or portions thereof marked as SBIR data must also reproduce the markings. Qualified requestors may obtain copies of this report from the Defense Technical Information Center (DTIC) at http://www.dtic.mil. AFRL-RH-AZ-TR-2008-0025 HAS BEEN REVIEWED AND IS APPROVED FOR PUBLICATION IN ACCORDANCE WITH ASSIGNED DISTRIBUTION STATEMENT. //signed// //signed// JOHN J. MARTIN HERBERT H. BELL Government Principal Investigator Technical Advisor //signed// DANIEL R. WALKER, Colonel, USAF Chief, Warfighter Readiness Research Division Air Force Research Laboratory
ii

REPORT DOCUMENTATION PAGE Form Approved
OMB No. 0704-0188 Public reporting burden for this collection of information is estimated to average 1 hour per response, including the time for reviewing instructions, searching existing data sources, gathering and maintaining the data needed, and completing and reviewing this collection of information. Send comments regarding this burden estimate or any other aspect of this collection of information, including suggestions for reducing this burden to Department of Defense, Washington Headquarters Services, Directorate for Information Operations and Reports (0704-0188), 1215 Jefferson Davis Highway, Suite 1204, Arlington, VA 22202-4302. Respondents should be aware that notwithstanding any other provision of law, no person shall be subject to any penalty for failing to comply with a collection of information if it does not display a currently valid OMB control number. PLEASE DO NOT RETURN YOUR FORM TO THE ABOVE ADDRESS. 1. REPORT DATE (DD-MM-YYYY) March 18, 2008
2. REPORT TYPEFinal Report
3. DATES COVERED (From - To)5/31/07-4/30/08
4. TITLE AND SUBTITLE Evaluation of Holographic Technology in Close Air Support Mission Planning and Execution
5a. CONTRACT NUMBER FA8650-05-D-6502 5b. GRANT NUMBER 5c. PROGRAM ELEMENT NUMBER 63231F
6. AUTHOR(S) John J. Martin1 Mark Holzbach2 Joseph Riegler3 Chin Ki Tam, 2d Lt, USAF1 Adam Smith4
5d. PROJECT NUMBER 5e. TASK NUMBER 5f. WORK UNIT NUMBER1123AE09
7. PERFORMING ORGANIZATION NAME(S) AND ADDRESS(ES) 8. PERFORMING ORGANIZATION REPORT NUMBER
1 Air Force Research Laboratory Human Effectiveness Directorate Warfighter Readiness Research Division 6030 South Kent Street Mesa AZ 85212-6061
2 Zebra Imaging, Incorporated 9801 Metric Blvd., Suite 200 Austin TX 78758
3 The Boeing Company (address same as 1) 4 L-3 Communications (address same as 1)
9. SPONSORING / MONITORING AGENCY NAME(S) AND ADDRESS(ES) 10. SPONSOR/MONITOR’S ACRONYM(S)Air Force Research Laboratory Human Effectiveness Directorate Warfighter Readiness Research Division 6030 South Kent Street Mesa AZ 85212-6061
AFRL/RHA
11. SPONSOR/MONITOR’S REPORT NUMBER(S) AFRL-RH-AZ-TR-2008 - 0025
12. DISTRIBUTION / AVAILABILITY STATEMENT Distribution A. Approved for public release; distribution unlimited. (88ABW-2008-0018, 8 Sep 2008). 13. SUPPLEMENTARY NOTES
14. ABSTRACT The Air Force Research Laboratory (AFRL) initiated BAA-05-04-HE with an objective to assess human performance in identifying patterns or subtle targets, comparing the effectiveness of 2D and 3D static visual stimuli based on identical example data sets. The research was tailored to the mission and task of the Joint Terminal Attack Controller (JTAC), and was a joint effort between AFRL/RHA in Mesa, AZ, its on-site support contractors (L-3 Communications and The Boeing Company), and Zebra Imaging of Austin, TX. Nine experienced JTACs participated in the evaluation. They first read through a written scenario similar to ones used both in actual combat and also in training exercises. The JTACs then were shown conventional 2D imagery and 3D holograms relating to the scenario, and participated in a detailed survey interview. During the survey they verbally answered questionnaire questions including comparison ratings of various aspects of the 2D and 3D imagery on a scale of effectiveness ranging from 1 (poorest) to 10 (best). All nine JTACS rated the 3D holograms as more effective than 2D photos for all mission planning and execution tasks and subtasks. The most frequently cited benefits of the holograms were relative height information, enhanced collateral damage estimation (CDE), and determining lines of sight and lines of fire. The 1”:15m scale was considered the most useful for JTAC purposes. The success of this research leads to the primary recommendation that a proof-of-concept field deployment be undertaken. Other recommendations concerning mission applications, formats and night implementations also are cited. 15. SUBJECT TERMS Hologram, JTAC, 3D image, performance 16. SECURITY CLASSIFICATION OF: Unclassified
17. LIMITATION OF ABSTRACT
18. NUMBER OF PAGES
19a. NAME OF RESPONSIBLE PERSON John J. Martin
a. REPORT UNCLASSIFIED
b. ABSTRACT UNCLASSIFIED
c. THIS PAGEUNCLASSIFIED
UNLIMITED
47
19b. TELEPHONE NUMBER (include area code) 480-988-6561 x481
Standard Form 298 (Rev. 8-98)Prescribed by ANSI Std. Z39.18

This page intentionally left blank.
4

Table of Contents Table of Contents ................................................................................................................ 5 Table of Figures .................................................................................................................. 6 Executive Summary ............................................................................................................ 7 Preface ................................................................................................................................. 8 Introduction ......................................................................................................................... 9
JTAC Duties/Responsibilities ....................................................................................... 12 JTAC Mapping and Imagery Tools for Planning and Execution ................................. 13 Imagery Use in JTAC Planning .................................................................................... 15 JTAC Imagery for Mission Execution .......................................................................... 16 Limitations of Current 2D Imagery in Urban CAS Operations .................................... 16 Preliminary JTAC Interview Sessions .......................................................................... 18 San Saba TX Field Exercise ......................................................................................... 18 Description of Structured Interview-Questionnaire Approach ..................................... 21
Methods............................................................................................................................. 21 Participants .................................................................................................................... 21 Materials and Apparatus ............................................................................................... 22
Questionnaire ............................................................................................................ 22 Scenario..................................................................................................................... 22 2D Imagery ............................................................................................................... 22
Hologram description.................................................................................................... 24 Flip-book ................................................................................................................... 25
Procedure ...................................................................................................................... 27 Results ........................................................................................................................... 28
Conclusions ....................................................................................................................... 33 Recommendations ............................................................................................................. 35
Integration of Holograms with Existing Mission Planning Tools (PFPS, BFT) ...... 36 Use of Holograms for Night Operations ................................................................... 36 Hologram Training Requirements and Training Potential ........................................ 37
Appendix A: Verbatim Transcript: How might holograms assist you with mission planning and execution? ................................................................................................... 38 Appendix B: Glossary of Terms ....................................................................................... 39 Appendix C: Detailed Specifications of Lighting Systems .............................................. 41
Hologram Lighting Requirements ................................................................................ 41 Appendix D: JTAC Questionnaire ................................................................................... 42 Appendix E: JTAC Test Scenario ..................................................................................... 45 Appendix F: References .................................................................................................... 46
5

Table of Figures Figure 1: 2D representation of 3D hologram of Baghdad area using 1-meter resolution
LIDAR data. .............................................................................................................. 10 Figure 2: Suburban Washington DC - 2D Rendering of 3D Image Processed Using
Alias Maya Software................................................................................................. 11 Figure 3: Suburban Washington DC - 2D Rendering of 3D Image Processed Using
Leica Cyclone Software ............................................................................................ 11 Figure 4: Training at Ft Hood, JTACs calling an air strike. Photo from Airman magazine,
Summer 2007. Ref. http://www.af.mil/news/airman/0707/airman.shtml ................ 13 Figure 5: Example of a 1:25,000 scale map used by JTACs in central Baghdad, Iraq .... 14 Figure 6: Example of standard 2D imagery usually used in San Saba, TX exercise ....... 19 Figure 7: Monochrome content of San Saba hologram with overlay labels added ......... 20 Figure 8: Holograms of San Saba, TX being used during exercise at San Saba ............. 20 Figure 9: Sadr City “Point 9” image scale of 1 in : 37.5 m .............................................. 23 Figure 10: Sadr City “Point 9” image scale of 1 in : 15 m with JTAC overlay ............... 23 Figure 11: Sadr City “Point 9” image scale of 1 in : 2.5 m ............................................. 24 Figure 12: Sadr City 15 m hologram with yellow grease pencil marking overlay .......... 25 Figure 13: Rendering sketch of flip-book concept used in this study ............................... 26 Figure 14: JTAC subject evaluating the flip-book ............................................................ 26 Figure 15: AFRL researcher conducting survey with JTAC participant .......................... 27 Figure 16: Bar Chart showing mean ratings for 2D photo and 3D holograms for each task
and subtask in order of magnitude ............................................................................ 31 Figure 17: Two views of 3D measurement grid hologram used on top of Sadr City
hologram ................................................................................................................... 32 Figure 18: Rendering sketch of proposed new flip-book design ...................................... 34 Figure 19: AFRL JTAC-TRS dome. (Photo by Gina Cinardo AFRL/RHA) ................. 37
6

7
Executive Summary Introduction The Air Force Research Laboratory (AFRL) initiated BAA-05-04-HE with an objective to assess human performance in identifying patterns or subtle targets, comparing the effectiveness of 2D and 3D static visual stimuli based on identical example data sets. The research was a joint effort between AFRL/RHA in Mesa, AZ, its on-site support contractors (L-3 Communications and The Boeing Company), and Zebra Imaging of Austin, TX. This document is the written report for the work. After first considering a variety of alternatives, the AFRL-Zebra team jointly decided to focus and tailor the research to the mission and task of the Joint Terminal Attack Controller (JTAC). Methods Nine experienced JTACs participated in the evaluation. They first read through a written scenario similar to ones used both in actual combat and also in training exercises. The JTACs then were shown conventional 2D imagery and 3D holograms relating to the scenario, and participated in a detailed survey interview. During the survey they verbally answered questionnaire questions including comparison ratings of various aspects of the 2D and 3D imagery on a scale of 1 to 10. Results The nine JTACS rated the 3D hologram as more effective than the 2D photos for all mission planning and execution tasks and subtasks. Larger differences in ratings between the 2D photos and 3D holograms were observed for the subtasks. All JTACs indicated that the holograms would be useful for mission planning and/or execution. The most frequently cited benefits of the holograms were relative height information, enhanced collateral damage estimation (CDE), and determining lines of sight and lines of fire. Appendix A is a verbatim transcript of the JTACs answers to one important question. The JTACs average confidence ratings in the determination of the tallest structure were 2.7 for the 2D image and 9.0 for the 3D holograms. The JTACs also provided suggestions on how the 3D holograms might be improved to be of even more value. Conclusion Holograms are effective for both JTAC mission planning and execution duties. The 1”:15m scale was considered the most useful for JTAC purposes. A1 format holograms were useful for planning indoors such as in a Tactical Operations Center (TOC), but not well suited for use in cockpits, vehicles, or on foot primarily because of the unwieldy size. Recommendation The success of this research leads to the primary recommendation that a proof-of-concept field deployment be undertaken. Field deployment groups to consider include TOC-centric JTACS, aircrew flight planning prior to CAS missions, and other application areas such as counter-improvised explosive device (IED), counter mortar, and mission rehearsal/rock drills. A flip-book concept should be considered further, given that JTACs and other servicemen like to execute with the same tools with which they plan. Other recommendations include exploring the integration of 3D holograms with current Mission Planning software, and exploration of adapting holograms specifically for night missions.

Preface The Warfighter Readiness Research Division of the Human Effectiveness Directorate, Air Force Research Laboratory (AFRL/RHA), headquartered at Mesa, Arizona, has the mission to research, develop, demonstrate, evaluate and transition leading edge technologies and methodologies to train warfighters and improve logistic processes. AFRL/RHA accomplishes its objectives of developing and exploiting new technologies, methods, applications and environments through an open collaborative environment between government, academia, and industry teams. It is within this context that the Division applied for and was awarded discretionary Director funds for BAA-05-04-HE with an objective to research and assess the value of 3D holographic maps in comparison to standard 2D imagery. This document is the written report of that research. Zebra Imaging, a company established in Austin, TX in 1996 with the mission to develop and provide technologies and products for three-dimensional visual communications, successfully applied for and received an AFRL contract under this BAA, entitled “Hologram-based Pattern Recognition and Human Performance Enhancement Testing and Evaluation.” The contract was issued on 29 June 2007 with a period of performance of 11 months, under which Zebra Imaging generated custom 3D holographic maps and provided technical expertise to support the subject research effort. This effort was completed by AFRL/RHA with on-site contractor support from L-3 Communications and The Boeing Company. The work was completed under Contract No. FA8650-05-D-6502, Task Order 0016. The AFRL contract monitor was Mr. M. Jay Carroll; the government principal investigator was Mr. John J. Martin. The information, results, conclusions, and recommendations presented in this document were generated solely from the opinions of the study participants and do not represent USAF policy or endorsement of any product or corporation mentioned.
8

Introduction In the summer of 2006 the detection of improvised explosive devices (IEDs) in the southwest Asian theater was a topic of keen interest and particular concern, and means of training personnel and/or helping improve their performance in the detection of IEDs were being actively sought across services. AFRL had received specific expressions of interest in improving methods for IED detection from the Joint Improvised Explosive Device Defeat Organization (JIEDDO) community. One of five stated focus areas for the JIEDDO community is:
Detect: Identify acceptable, suitable, and feasible material and non-material solutions that locate enemy personnel, explosives devices, and their component parts, equipment, logistics operations, and infrastructure in order to provide accurate and timely information to military operations and planners.
Within the context of this discussion, IEDs are assumed to be camouflaged or concealed in various manners such that their detection is very difficult. In that same time period, AFRL/RHA first learned of Zebra Imaging, a company founded in Austin TX in 1996, who had developed a unique capability to create large-scale true auto-stereoscopic (3D) static imagery presentations (e.g., holograms) providing full parallax, viewable without requiring use of a special light source (e.g., laser) or spectacles. After investigating Zebra’s hologram technology in greater depth, AFRL/RHA theorized that such holographic presentations, generated from collected imagery and elevation data, might prove to be an effective means of presenting subtle visual cues that could help in training people and/or improving their performance of various tasks. AFRL/RHA further theorized that 3D holographic imagery might be beneficial as a comparison tool for making more evident any subtle changes in an area of interest that were not readily apparent in conventional 2D imagery of that same area, thus improving the probability of visually detecting IEDs. AFRL/RHA applied for and was awarded discretionary AFRL/RH Director funds to research and assess the value of 3D holographic maps in comparison to standard 2D imagery, with application as a training tool to help solve problems in the JIEDDO community. The adopted research approach was to assess human performance in identifying patterns or subtle targets, comparing effectiveness of 2D and 3D static visual stimuli based on identical example data sets. Because a comparison of human performance using such 2D and 3D static imagery had not previously been investigated, the research effort was structured as a set of three spirals, necessarily beginning with exploration and definition of a scenario, closely followed by generation of a corresponding first set of visual stimuli. Performance findings from the stimuli utilized in the first spiral were to be reviewed and used as guidance in altering or iterating the 2D and 3D renderings used for the second spiral; findings from the second spiral were to be similarly reviewed and used to iterate and/or define imagery used in the third spiral.
9

A review of available elevation information from digital elevation models (DEMs), digital terrain elevation data (DTED), and light detection and ranging (LIDAR) sensors for several geographic areas was performed in parallel with formulation of the approach. Elevation resolution on the order of a few centimeters or a couple inches was estimated as a minimum requirement to depict the introduction of a “subtle anomaly” such as a dead animal, a pile of rubble, and/or disturbed earth hiding an IED. Given the coarseness of resolution (e.g., 10 or more meters), elevation data from DEMs and DTED models were ignored and emphasis was placed on LIDAR data due to its finer resolution, field deployment, and ability to cover specific areas of interest on a recurring and timely basis. The best available elevation data from in-theater at the time this research was performed was from LIDAR. A 2D representation of a 3D image made using LIDAR data typical of that available in mid-2007 is shown in Figure 1. The resolution is approximately 1 meter.
Figure 1: 2D representation of 3D hologram of Baghdad area using 1-meter resolution LIDAR data.
In creating the image shown in Figure 1, digital imagery was accurately registered and draped over the elevation data. Cast shadows provide useful cues, but note the “draped canvas” effect over structures and trees due to the 1-meter level of LIDAR resolution. Building face features such as windows are absent. Also note the vehicles along the road and parked in the courtyard (left center of image). By their locations and size they may be inferred as being vehicles, but they are not recognizable as to type. Smaller objects, such as a dog or small pile of rubble, would not register at all in the 3D model, although they might be visible in imagery. A larger object (e.g., a shed or small land-sea container) would register in the 3D model, but would exist only as an amorphous ‘blob’ without sufficient 3D detail to allow identification without accompanying accurately-registered imagery.
10

11
In late 2007 Zebra Imaging acquired sample 5cm resolution raw LIDAR point cloud data of suburban Washington DC terrain from GSTI (recently acquired by SAIC), who had just begun street level collection of such data. Sample 2D representations of 3D images created using the Washington DC 5cm data are shown in Figure 2 and Figure 3. Although this scanning technology is now being introduced in the battlefield, data from in-theater with such resolution were not available in time for the subject research study.
Figure 2: Suburban Washington DC - 2D Rendering of 3D Image Processed Using Alias Maya Software
Figure 3: Suburban Washington DC - 2D Rendering of 3D Image Processed Using Leica Cyclone Software
The rendering of objects and surface heights in 3D holographic imagery for a given geographic area is only as good as the resolution of the elevation data and the accuracy of its registration with all corresponding imagery and geographic surfaces in that area. Given the premise that IEDs are deliberately concealed, we assumed that evidence of their existence would only exist as subtle anomalies or changes in a pattern from one day to the next. Zebra Imaging investigated various 3D graphics workflow tools to artificially add subtle 3D anomalies to the raw “before” scene point cloud datasets, to create one or more “after” scenarios incorporating concealed IEDs. However, extremely high resolution (finer than 5cm) elevation data, and its correspondingly accurate registration with all geographic objects, surfaces and digital imagery in an area of interest, appeared necessary to create holographic imagery having sufficient detail to potentially allow visual detection of subtle anomalies or pattern changes. We therefore concluded that even 5cm LIDAR data might not be sufficient to show evidence of IEDs. Software tools that could derive or generate high-resolution 3D model data from a set of high-resolution digital images taken from different angles also were investigated. No suitable and available tools were identified that could combine multiple photos to generate a highly detailed terrain file. Based on the above findings, we concluded that no readily available terrain datasets existed that were adequate to generate 3D renderings for the desired IED/disturbed earth/subtle anomaly detection task(s).

Although the resolution of current 3D sensor data was determined to be unsuitable for helping in IED detection, discussions with representatives of various user communities suggested potential for generating holograms applicable and useful in other problem areas such as mission planning, mission briefing/debriefing, or airspace deconfliction. The task of flight planning was suggested as an application for holographic imagery more than once by pilots with whom we came in contact. The USAF Joint Terminal Attack Controller (JTAC) community also expressed particular interest. Although any one of a number of other areas might have been an equally good or better fit, the study shifted toward urban planning / low-level assault and JTAC scenario applications; this turned out to be an ideal fit because of the JTAC community’s mission, needs, and extraordinary receptivity to participation in this study. An added benefit of this scenario choice was that, because AFRL/RHA already had “ownership” of the urban planning / low-level assault and JTAC scenario contexts due to training research work already being done at Mesa, holographic presentations (compared to conventional tools) could be fully evaluated in those scenarios and their potential could be mapped directly. AFRL/RHA also could directly access people experienced in those types of scenarios (unlike the JIEDDO community). In order to provide a contextual foundation for the results of this study, as given later in this document, it is necessary and appropriate to first describe the JTAC role, the methods, sources and types of imagery they employ in performing their mission, and related AFRL/RHA research. JTAC Duties/Responsibilities Joint Tactics, Techniques, and Procedures for Close Air Support (Joint Publication [JP] 3-09.3) defines a JTAC as a “qualified (certified) service member who, from a forward position, directs the action of combat aircraft engaged in close air support (CAS) and other offensive air operations. A qualified and current JTAC will be recognized across the DoD as capable and authorized to perform terminal attack control.” A certified JTAC is an individual who has completed all training requirements of the core curriculum and a comprehensive evaluation, whereas a qualified JTAC has maintained currency by achieving the established minimum recurring training and evaluation requirements (JCAS Action Plan MOA 2004-01; JTAC (Ground)). JP 3-09.3 defines CAS as air action by fixed- and rotary-wing aircraft against hostile targets that are in close proximity to friendly forces, and requires detailed integration of each air mission with the fire and movement of those forces. The primary JTAC duty during CAS missions is to support the ground combat maneuver plan. This support encompasses planning CAS requirements and suppression of enemy air defense, conducting target analysis and providing recommendations to weaponeering, providing terminal attack control, and conducting post-strike battle damage assessment (BDA).
12

Reed (2006) further defines the JTAC role as being the vital link between ground maneuver units and airborne aircraft providing CAS. The JTAC is an expert in the tactical application of airpower, and is familiar with the capabilities and limitations of aircraft platforms, delivery tactics, and the characteristics of the many different munitions. JTACs also provide Intelligence, Surveillance, and Reconnaissance (ISR) support and requests for unmanned aerial vehicle (UAV) support (Reed, 2006).
Figure 4: Training at Ft Hood, JTACs calling an air strike. Photo from Airman magazine, Summer
2007. Ref. http://www.af.mil/news/airman/0707/airman.shtml
JTAC Mapping and Imagery Tools for Planning and Execution The application of the products of the intelligence cycle to support the CAS mission is a key JTAC duty area. These intelligence products encompass geospatial intelligence consisting of maps and airborne platform imagery, human intelligence, as well as signals and imagery intelligence. The most commonly used map for foot navigation and mission planning by JTACs is a 1:50,000 topographic line map (TLM). A 1:250,000 scale Joint Operations Graphic-Air is used for vehicle navigation, plotting initial points for aircraft, or any mission that will cover a large area or airspace. The source of these mapping tools is the National Geospatial-Intelligence Agency (NGA), formerly the National Imagery and Mapping Agency.
13

NGA employs imagery from across the electromagnetic spectrum using both literal and nonliteral exploitation, referred to as advanced geospatial intelligence. NGA also uses airborne, commercial, and Overhead Non-Imaging Infrared imagery. New airborne platforms and sensors, such as the Army's Buckeye and a number of commercial LIDAR systems, will dramatically increase the content and quality of GEOINT (Wallach, 2007). High resolution photos obtained via satellite or UAV feeds serve as an additional source of JTAC imagery to support mission planning and execution. However, declassification and prioritization of these requests often result in longer access times than ideal for tactical missions.
Figure 5: Example of a 1:25,000 scale map used by JTACs in central Baghdad, Iraq
JTACs use several commercial and government-off-the-shelf (GOTS) software applications to access and manipulate imagery for mission planning and execution. The most common of these is FalconView(tm), a non-proprietary GOTS application developed by Georgia Tech Research Institute in the early 1990s for analyzing and displaying geographical data. Its ease of use and wide variety of applications has made it the system of choice for the warfighter and the standard for data interchange in Iraq and Afghanistan (Bailey, 2004). The combination of FalconView and the Combat Flight Planning Software make up the Portable Flight Planning Software (PFPS). FalconView is essentially a digital version of the classic military map board with transparent overlays to display terrain features, enemy disposition, friendly scheme of maneuver, etc.; it is presented in the familiar Microsoft Office style with buttons, menus, and a large graphical workspace (Lindsay 2006). Functions that make it appealing to a broad user group include an intuitive PC environment for viewing a wide variety of maps and imagery at different scales, custom overlays that can be saved and shared as small files, a connection for hand-held GPS receivers and a real-time moving map display, and
14

a tactical radio feed to display intelligence data and friendly force locations. Most JTACs have FalconView imagery readily available at their units or via hard drives and laptops used in theater. One limitation of FalconView for tactical operations noted by an AFRL JTAC subject matter expert (SME) is difficulty in determining when the imagery was taken, which can potentially result in an inaccurate or outdated image of the actual location. More detailed information about FalconView's capabilities and usage can be found on the internet at: http://www.falconview.org/. Buckeye is a relatively new system fielded by the Army which serves as a relatively expedient way to obtain imagery. It utilizes a camera mounted on either a helicopter or fixed wing aircraft, and is not limited to Army platforms. As a brigade level asset, it enables the JTAC to be much more responsive to the Army battalion's requests for imagery. This is advantageous because the head JTAC or air liaison office (ALO) is usually at the brigade level with the front line JTACs at the battalion level. Typical resolution of Buckeye imagery ranges from 1 meter down to 10 centimeters. Miles (2006) describes Buckeye as a high-quality digital camera with an extra-large focal plane used to capture overhead images from an aircraft. Imagery specialists remove geometric distortions in combining multiple shots into one extra-large image. Images taken at different angles also can be used to create a “stereoscopic pair” that enables viewers wearing special spectacles to see an image in apparent 3D. Buckeye also can be used with a detailed map that includes grid coordinates in order to give troops an enhanced level of situational awareness relative to standard overhead imagery. Another software tool employed by JTACs during the mission planning/execution is the recently-developed Precision-Strike Suite for Special Operations Force (PSS-SOF). Mission planners use PSS-SOF to automatically pull up appropriate stereo pair images of the target area. The operator locates the intended feature on both images, and PSS-SOF calculates and returns precision coordinates and elevation. This allows the observer on the front lines to determine precise coordinates for GPS-guided bombs such as Joint Direct Attack Munitions. PSS-SOF allows ground-based observers with eyes on the target to quickly determine, refine, and transmit precise coordinates to strike assets for precision strike munitions (Kinne, Tanzi, & Yaeger, 2006). PSS-SOF was originally designed to provide frontline operators (usually Special Operations Terminal Attack Controllers) access to mensurated (measured) coordinates, and therefore the ability to drop GPS-guided munitions. Prior to the introduction of PSS-SOF, a call to a targeting shop would have to be made days in advance so mensurated coordinates could be derived using classified imagery and special targeting software such as Dewdrop and Rainstorm. These software tools are typically used at the strategic level, however, and are not practical for use against time-sensitive targets. Imagery Use in JTAC Planning A JTAC uses both PowerPoint and FalconView software to develop overlays for the imagery used in planning and execution. JP 3-09.3 dictates that detailed mission planning should be implemented to maximize the effectiveness of all available assets. Regardless of the method utilized, the critical element is directing CAS aircraft onto the
15

target. Some of the planning considerations for a typical CAS mission include availability of ISR assets, how terrain can affect communications and visual line of sight for identifying the target and/or aircraft, time available for planning, and collateral damage risk to civilians, civilian structures and properties associated with CAS attacks. JTAC mission planning involves applying grids to imagery; labeling routes, buildings, prominent features, and defining/labeling sectors within target area. Direction from JP 3-.09.3 specifies that aircrew and JTACs should ensure that the maps and other geospatial products they use incorporate the Military Grid Reference System (MGRS) during pre-mission planning for CAS and assault support. Further guidance suggests that grid sectors be based on what the aircrew/aircraft sensors can most easily see, such as rivers, road junctions, buildings and bridges. Aircrew should avoid over-targeting (i.e., numbering every building in the city versus numbering the buildings in the expected and adjacent objective area). Over-targeting can lead to time delays and confusion for aircrew. JTAC Imagery for Mission Execution Depending on the type of mission and the operating environment, the imagery tools used during JTAC mission execution consist of a combination of hardcopy maps/photos and/or electronic versions of such information. The 1:50,000 scale TLMs, with JTAC markings (e.g. artillery lines), are employed during mission execution. Hardcopy photos and overlays constructed during mission planning using FalconView and/or PSS-SOF are also used by the JTAC in the field during execution. Overhead aerial photos provide the JTAC with a better understanding of the view of the pilot, and assist with developing a better situation awareness (SA) of the target area. These images are used to facilitate the target talk-on process between the JTAC and the aircrew. For operations carried out in a tactical operations center (TOC) or in a vehicle, the JTAC will often use a laptop computer with electronic versions of the mapping and imagery tools. An additional hardcopy reference is the standardized 9-Line briefing form to pass information to the aircrew rapidly. The 9-Line form helps aircrews in determining if they have the information required to perform the mission. Limitations of Current 2D Imagery in Urban CAS Operations The compressed battlespace of the urban environment creates unique considerations in the planning and execution of CAS operations. These include deconfliction of confined airspace, restrictive rules of engagement (ROE), difficulty in threat analysis, presence of noncombatants, the potential for collateral damage, and increased risk of fratricide (JP 3-09.3). The information contained in 2D images of the CAS environment used to make these determinations is often of limited value due to the absence of relative height and depth information. JTAC-specific 3D geospatial problems which 2D imagery and mapping tools often do not adequately address include the detection of geospatial features and anomalies, determining relative heights and breaks in buildings, identification of
16

landing zones (LZs), and determination of line of sight (LOS) for over-watch positions. Navigation over urban terrain can be more difficult than over natural terrain. This is further complicated by the inability of maps to provide the vertical development of urban terrain. Rapid movement from position to position can often create confusion between aerial and ground observers as to friendly and enemy locations. Although familiarity with the characteristics of urban terrain allows aircrews to discern key features in this environment, urban CAS operations may be significantly enhanced by use of 3D visualization technologies. The more encompassing processes of mission planning/briefing and after-action review, intelligence analysis, and threats portrayal also have the potential to be enhanced by 3D visualization technologies. Success in addressing these areas can be expected to lead to enhancements in information superiority and predictive battlespace awareness. Application of Holographic Technology Zebra Imaging, Inc. was founded in 1996 to develop display technologies and products for 3-D visual communications. The company's primary business areas include hologram production using client-supplied data, holographic imager/printer manufacturing, and research and development of dynamic, auto-stereoscopic 3-D displays and advanced hardcopy hologram technologies. Zebra has produced and marketed the world's largest and highest-fidelity static holograms to date, and has pioneered the development of a unique, scalable, dynamic 3-D display technology. The company has focused on geo-spatial applications of its products, developing both software and hardware components to serve this market. Hardcopy holograms produced for government and military applications are portable, scalable, intuitively understood, group-viewable communication tools that facilitate planning, orientation, and intelligence and reconnaissance visualization. Users have included Department of Defense, federal, and civilian topographic agencies and other groups having a need to easily and intuitively visualize sophisticated 3-D data in a comprehensive, durable, portable medium. In early 2007 Zebra Imaging technology was under contract with the US Army and was shipping thousands of holograms of urban terrain in Iraq for warfighting use in-theater. Sheer demand coupled with occasional anecdotal accounts that emerged from theater suggested that benefits were accruing from their use, but the effectiveness of holographic map technology had not been quantified and documented. The present AFRL research effort provided a first opportunity to evaluate, quantify and document the use and effectiveness of holograms as tools within an initial context of JTAC mission planning and execution. The adopted approach involved obtaining feedback from experienced JTACs on the effectiveness of holograms in the context of an urban CAS scenario. Two interview and feedback sessions, described below, provided essential information for formulating the final evaluation test plan.
17

Preliminary JTAC Interview Sessions The dimensions of scale, size, and resolution of the imagery (photos and holograms) used in this research are expressed in inches (in), feet (ft), and meters (m) as appropriate. The abbreviations of these units of measure are used throughout this report. The AFRL-Zebra Imaging research team conducted preliminary interviews with JTAC SMEs in order to define the role, duties, and tasks of a JTAC, and to effectively design an evaluation to examine the utility of 3D holograms. To facilitate and act as a basis for the preliminary interviews, the research team used monochrome holograms and monochrome Buckeye 2D imagery. Imagery from various locations initially had been considered for a scenario, including imagery acquired from the Goldwater range in Arizona, but imagery from Sadr City in Iraq ultimately was selected because it was of more relevance and because it contained complex urban imagery as opposed to the mostly unbuilt landscape of the Goldwater range. The team therefore utilized three A1 (approximately 2 ft x 3 ft) monochrome holograms of Sadr City at three different scales; 1:100 (close), 1:600 (mid), and 1:1500 (far), three corresponding 8.5 x 11 inch monochrome 2.5 meter resolution Buckeye images, a sample Special Operations Forces (SOF) scenario, and a draft questionnaire. The JTAC SMEs first were individually interviewed regarding their role, duties, and how they would plan and execute their missions. Following that, the AFRL-Zebra team presented the sample scenario and monochrome 2D images, and asked the SMEs to describe how they would conduct the mission. Finally, the team presented three holograms of the same area and asked the SMEs to describe what additional information was gained or lost, how they would use the holograms, and any recommended modifications to improve their utility. The primary result from these interviews consisted of input related to specific JTAC duties in an urban CAS environment and how holograms might best be implemented. These inputs were used to identify relevant parameters for a rating scale; examples included judging relative heights of buildings, CDE assessment, and determining line of sight. A secondary result was determination of the necessary content of the overlays used on top of the holograms; these included gridlines, building numbers and street names. The JTAC SMEs also provided comments on the three different types of JTAC missions; SOF, conventional, and TOC-centric; they recommended a conventional or TOC-centric mission, making our scenario more relevant to conventional JTAC operations. San Saba TX Field Exercise The potential for use of holograms in JTAC mission planning and execution was further examined in interviews during a routine field training exercise in San Saba, TX. San Saba is a rural community in central Texas periodically employed by the 9th Air Support Operations Squadron (ASOS) at Ft Hood as a JTAC training site. The 9th ASOS invited the AFRL-Zebra team to observe such an exercise, and provided all the necessary tools for their mission including scenarios, briefing materials, and corresponding 2D imagery.
18

Given this opportunity, Zebra collected overhead imagery and developed corresponding holograms of the operational area for the JTACs to employ for mission planning and execution during an actual exercise they conducted at San Saba. Three monochrome holograms at three different scales [1:170 (close), 1:380 (mid), 1:500 (far)] plus one color hologram at 1:380 (mid) scale were employed. Sample images from the San Saba exercise are shown in Figures 6, 7 and 8. Various light sources were used with the holograms, including both AC-powered LED lamps and battery-operated LED flashlights (see Appendix F for lighting specifications). Five JTACs and one Joint Fires Observer (JFO) were interviewed. The JFO is the equivalent of a lower level non-certified JTAC for the Army; they are attached to the Army unit and perform JTAC duties when certain conditions are met. Each individual JTAC had to run the exercise, and all had the opportunity to observe the holograms before the mission, during mission planning, and during mission execution. Most JTACs used the holograms at a static observation point (OP) prior to mission execution. A few used them meticulously while others simply glanced at them. None opted to use the holograms in the vehicle during mission execution. At the end of each exercise, the participants were interviewed based on our questionnaire and were asked to complete a rating scale comparing several parameters of 2D imagery versus the 3D holograms.
Figure 6: Example of standard 2D imagery usually used in San Saba, TX exercise
The primary findings were: 1) the holograms that were tested (A1 size, measuring approximately 2 ft x 3 ft) were too big and JTACS would not use them during execution, 2) holograms are good for static OP missions, 3) lighting conditions impacted the usefulness of the holographic effect; holograms were difficult to view in heavy overcast
19

conditions, 4) the ability to write on the holograms is beneficial, and 5) the medium range is the most beneficial scale. Miscellaneous findings included possibly making the holograms smaller and binding them into a flip-book, color holograms did not add significant additional value over monochrome holograms, suggestions for modifying overlays, and insight on how the JTACs used the holograms for mission planning and execution. From this feedback session, we were able to redefine the parameters of the rating scale and restructure the questionnaire. Discussions during the San Saba field exercise also led to the design, creation and subsequent compilation of JTAC reactions to a hologram “flip-book” described later in this report.
Figure 7: Monochrome content of San Saba hologram with overlay labels added
Figure 8: Holograms of San Saba, TX being used during exercise at San Saba
20

As a result of the two preliminary interview efforts the AFRL-Zebra team gained a good understanding of the role, duties, and tasks of a JTAC, allowing it to design an evaluation to examine the effectiveness of 3D holograms for use in JTAC mission planning and execution and compare them to relevant 2D imagery in the context of a relevant scenario. The team developed a conventional JTAC cordon and search scenario adapted from the San Saba, TX exercise and selected a set of holograms and images of Sadr City, Iraq, for use in the more formal data collection effort. Using the feedback from the preliminary efforts, the team refined the questionnaire and rating scale. Having generated an operationally relevant scenario, corresponding imagery, a structured questionnaire, and a comprehensive rating scale with applicable parameters, the team revisited the 9th ASOS at Ft Hood to conduct the formal hologram evaluations. Description of Structured Interview-Questionnaire Approach The purpose of this evaluation was to assess the effectiveness of the holograms in the realm of mission planning and execution of conventional JTAC missions. The adopted evaluation approach was a structured interview-questionnaire exercise where individual JTACs described their planning and execution process in the context of the scenario using the imagery tools we presented. The rating scale was used to obtain additional data relevant to the effectiveness of a 2D photo and 3D hologram, in a side-by-side comparison, in accomplishing a variety of JTAC planning and execution tasks. The team also aimed to identify any specific attributes of the holograms that provided an advantage over currently used two-dimensional imagery tools, sought specific recommendations on how to improve holograms to enhance their benefit to the JTAC mission, and explored other relevant areas of application.
Methods Participants Nine experienced JTACs participated in the evaluation. Eight JTACs were in continuation training at Ft. Hood, one of whom was an Air Liaison Office (ALO) F-16 pilot with two years experience as a JTAC. The ninth individual was a former JTAC (just separated from service) supporting AFRL as a JTAC SME. The participants had an average of 5.7 years of JTAC conventional ops experience. Four individuals had terminal attack control instructor (TAC-I) certification, and three were standards and evaluation certified.
21

Materials and Apparatus
Questionnaire A questionnaire and rating scale (Appendix G) were used to obtain a qualitative assessment of the effectiveness of the holograms from each JTAC. The questionnaire contained questions regarding the imagery/mapping tools currently used for mission planning and execution, limitations of these tools, content of overlays, and how the holograms might benefit mission planning and execution. The rating scale contained a list of JTAC-specific mission planning and execution tasks/subtasks. Two columns on the rating scale were used for the JTACs to rate the effectiveness in completing each task, on a scale of 1 (poorest) to 10 (best), for both a 2D image and a 3D hologram.
Scenario A cordon and search (a.k.a. cordon and knock) scenario was developed to provide the context for the questionnaire and rating scale. The scenario (Appendix H) consisted of a hard-copy brief that provide a description of mission objective, concept of the operation, ground commander's intent, and information relevant to coordination of intelligence and air support assets. This scenario was adapted from the field training exercise at San Saba.
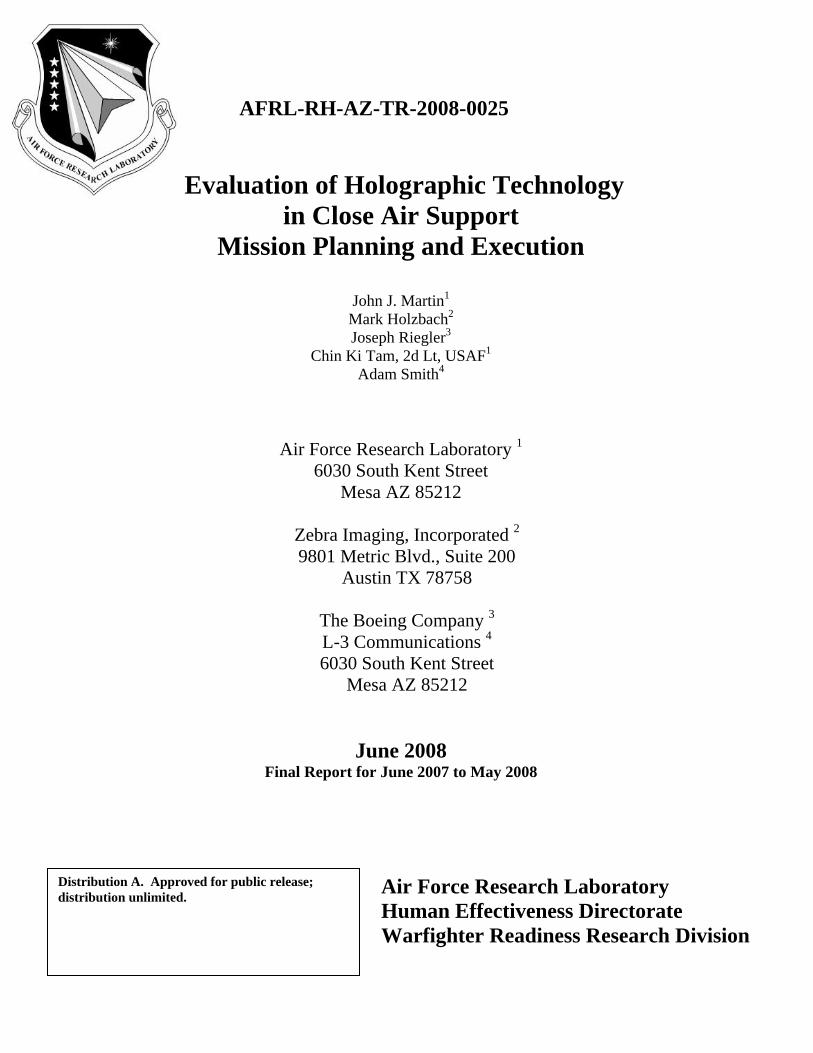
2D Imagery The dimensions of scale, size, and resolution of the imagery (photos and holograms) used in this evaluation are expressed in inches (in), feet (ft), and meters (m) as appropriate. The abbreviations of these units of measure are used throughout this report. Imagery from Sadr City, Iraq was utilized because of its relevance and urban complexity. The scenario brief contained three 8.5 x 11 inch b/w photos of Sadr City of varying scales (approximately 37.5, 15, and 2.5 meters to the inch). These images, provided by Zebra Imaging, were created from a combination of two-dimensional Buckeye camera imagery integrated with LIDAR digital elevation data. A target house identified in the scenario was at the approximate center of each image. A large (approximately 22 x 38 in) printout of the mid-scale Sadr City imagery was used as the 2D comparison image in the rating scale exercise. Overlays were constructed for each image using PowerPoint. These overlays consisted of route names, lines indicating major routes, and numbered sectors and buildings. Examples of the Sadr City imagery are shown in Figures 9, 10 and 11.
22
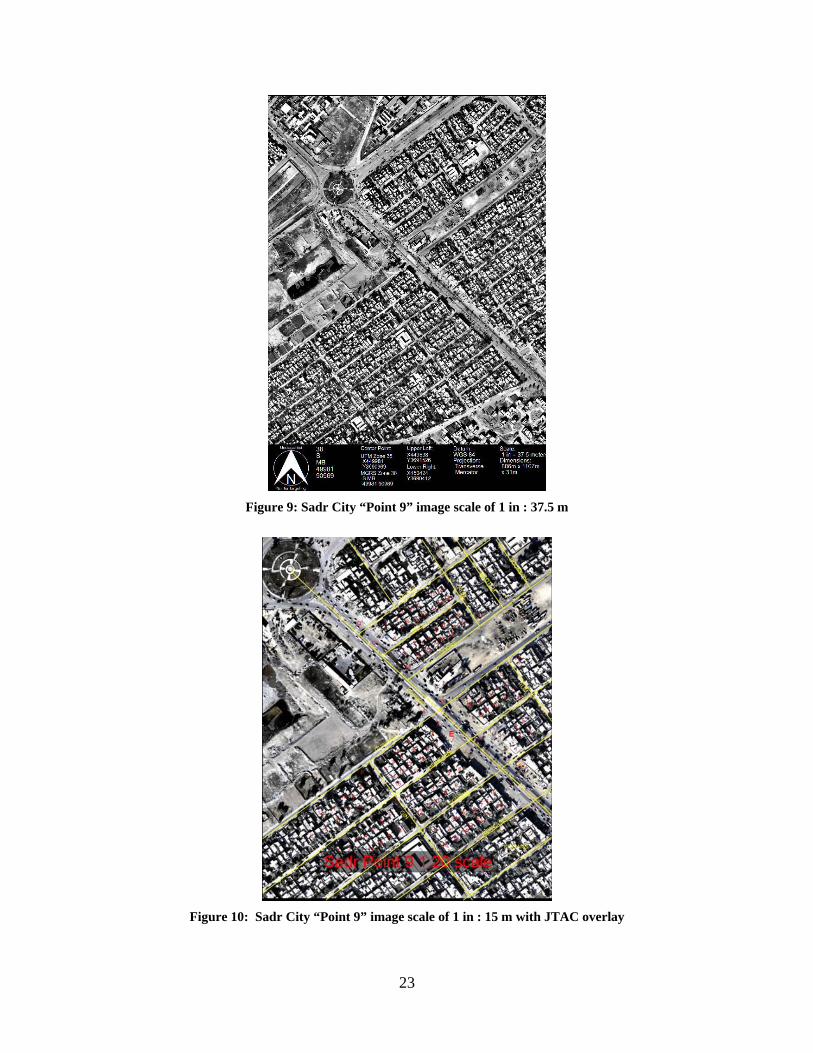
Figure 9: Sadr City “Point 9” image scale of 1 in : 37.5 m
Figure 10: Sadr City “Point 9” image scale of 1 in : 15 m with JTAC overlay
23

Figure 11: Sadr City “Point 9” image scale of 1 in : 2.5 m
Hologram description Three monochromatic A1 size (approximately 2 ft x 3 ft) holograms were evaluated in this study. The holograms were produced from the LIDAR data used in the 2-D photos of Sadr City described above. The scale of the “far” holograms had 1 inch on the hologram corresponding to 37.5 meters or 123 feet in the real world. The scale of the “medium” shots had 1 inch on the hologram corresponding to 15.0 meters or 49 feet in the real world. The close-up shots of the target building were roughly on the order of 1 inch on the hologram corresponding to 2.5 meters or 8 feet in the real world. The dimensionless scale ratios of the three holograms were approximately 1:1500, 1:600, and 1:100. The three hologram scales are referred to 37.5 m, 15 m, and 2.5 m in this report. A standard yellow grease pencil (also known as a “china marker” and sold at many drafting supply stores) was used to draw overlays on each hologram that corresponded directly to the overlays generated for the 2D photos. An example is shown in Figure 12.
24

Figure 12: Sadr City 15 m hologram with yellow grease pencil marking overlay
Flip-book On the basis of comments during the San Saba exercise, a separate 15 m scale hologram of Sadr City was used to construct smaller 8 x 10 inch and 4 x 5 inch holograms and gather feedback on a “flip-book” concept for use during mission execution. Each flip-book consisted of a 2D overhead photo of Sadr City (at 15 meter to 1 inch scale) and close-up views of five sections of the overview photo. Corresponding holograms of the same size and coverage area of each photo were produced and placed in a spiral bound notebook, so that the 2D photo and the matching hologram were on subsequent pages. A removable piece of dark film was placed behind the transparent hologram film to provide better contrast when viewing the hologram. The flip-book is configured as shown in Figure 13, and is shown in use in Figure 14.
25

Figure 13: Rendering sketch of flip-book concept used in this study
Figure 14: JTAC subject evaluating the flip-book
26

The pages of the flip-book were a series of transparent holograms with an intentionally darkened 2D image behind it and registered with it. The notion behind this was that a darkened 2D image would be visible in lighting situations and at angles when the hologram would not be visible, and therefore could enhance this format to work in a wider variety of environments than a standard hologram. A standard contrast 2D image page was inserted behind the darkened 2D image, enabling the user to view a standard image if desired. The plastic spiral binding allowed the pages to be flipped while keeping pages in registered alignment, and the book could lay flat. A separate black plastic page was also included to be used behind the transparent hologram when maximum contrast was desired. Procedure Each JTAC participated in one structured questionnaire/interview session that lasted approximately 1.5 hours. The session began with a brief description of the purpose of the evaluation and the procedure to follow. The JTAC was then provided the scenario briefing slides handout to read and review. After reading through the scenario, the questionnaire was administered in an interview format. The JTAC participants were asked to provide responses to each question in the context of the scenario provided, although additional comments were encouraged. The responses to each question were recorded as written notes by the experimenters and also as audio files.
Figure 15: AFRL researcher conducting survey with JTAC participant
27

Each participant completed the rating scale exercise using the 15 m size hologram and the corresponding 2D photo, placed side-by-side on the floor in front of the JTAC. Participants were provided a copy of the rating scale, which they used to record their rating of effectiveness for the 2D and 3D images for each task and subtask. An AC-powered 15-watt LED (green) lamp was mounted to the ceiling directly above the hologram to provide illumination. Upon completion of the rating scale, each JTAC was asked to identify the tallest structure in the 2D photo, and then to identify the tallest structure in the 3D hologram. They also were asked to provide a confidence rating between 1 (poorest) and 10 (best) in their response. No feedback was provided until the participants made judgments for both the 2D and 3D images. Lastly, each participant viewed the two hologram flip-books using a variety of light sources including: a 5-watt green Luxeon Star LED flashlight, a 1-watt head-mounted white LED light, and a green microlight LED from Inova. JTACs provided feedback regarding effectiveness of the flip-book of holograms and light sources, and their potential for use during mission execution. Results The nine JTACs completed the questionnaire and rating scale exercise. The responses to each question were recorded on audio and as hand written notes during each data collection session. The responses were then consolidated into Excel worksheet files to facilitate data analysis and summarization. When asked what mapping/imagery tools are most commonly used to plan, all JTACs reported that they would use high resolution photos accessed via FalconView and/or PSS-SOF during mission planning. Five of the individuals cited PSS-SOF as a tool that they would use in addition to FalconView to obtain photos of higher resolution and at more oblique angles. One of the JTACs, the Chief of Standardization and Evaluation (STANEVAL) at the 9th ASOS, commented that he would use PSS-SOF for the target picture and FalconView for developing grids. For mission execution, all but one of the JTACs reported that they would use hard copies of the photos (and with grid overlays) that they used for planning. Three JTACs commented that they would use 1:50,000 scale maps during mission planning, in addition to the photos. When asked how they would use the imagery during mission planning, all JTACs stated that they would build overlays for the images, using either FalconView or PowerPoint. The most frequently cited types of information that would be used for image overlays were gridlines (MGRS and/or latitude/longitude), building numbers, route/street names, rally points, possible targets, target coordinates, and CDE information. Specific planning objectives mentioned by three JTACs were obtaining more information about friendly forces on the ground, providing aircrew with an overview of the situation, including routes, and building a strategy for target talk-on.
28

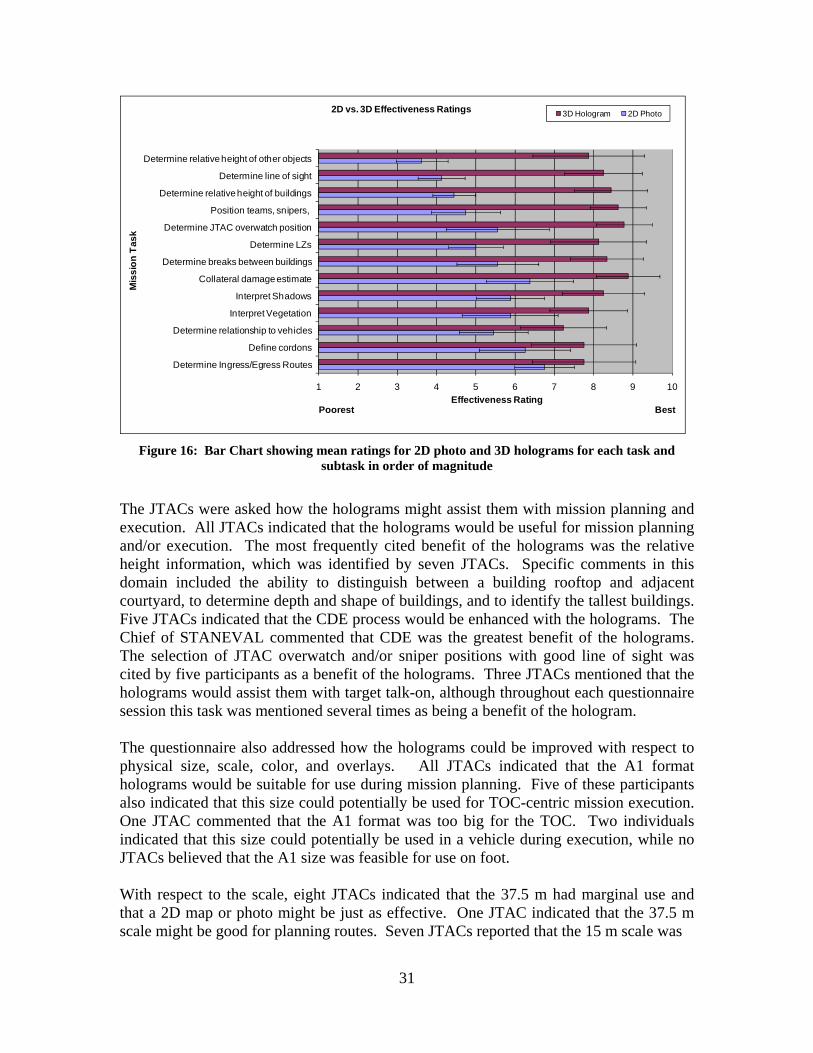
Only one JTAC reported that he would not use the same products (photos, maps) during mission execution that he had used for planning. This JTAC stated that he would use the ROVER feed in the vehicle during execution. All other JTACS reported that they would use 8.5 x 11 in photo(s) with overlays to execute the mission. All JTACs stated that during execution they use their imagery tools for target talk-on. The ALO stated that he used kneeboard size photos/maps during execution (as a pilot) to reference routes. The features most frequently noted as being important during talk-on were roads/routes, rally points, largest features, and grids references to specific targets. Eight JTACs indicated that gridlines were the most critical type of information used in constructing overlays for the imagery. Six of the individuals specified MGRS as critical. Four JTACs commented that routes also were critical for overlays, while three mentioned elevation data (or spot elevations) and numbered buildings as being critical information for overlays. One JTAC indicated that he used target rings for CDE for overlays. The JTACs were asked to identify some limitations of current imagery and mapping tools. The most frequently cited limitation (four JTACs) was that some imagery/mapping tools are outdated, or they are uncertain as to the accuracy of the date. The quality of the image related to clarity and/or depth was noted by two JTACs as a limitation. One JTAC identified the speed at which they can get the imagery as being a limitation. The nine JTACS completed the rating scale exercise. The average ratings of effectiveness of the 2D photographs and 3D holograms are listed in Table 1 for each mission planning and execution task/subtask. As evident from inspection of Table 1 and the corresponding bar chart in Figure 16, the 3D holograms were rated as more effective than the 2D photos for all mission planning and execution tasks and subtasks. Larger differences in ratings between the 2D photos and 3D holograms were observed for the subtasks. This is likely due to the fact that the planning and execution tasks were rated initially and did not require close examination of the two images to make the comparison. Also, some JTACs reported that they did not always perform the higher order tasks listed. Independent one-tailed t-tests were conducted to determine the level of significance of the observed differences in mean ratings. Separate t-tests were conducted to compare the means of the four mission planning tasks (6.1 for 2D vs. 7.5 for 3D) and the three mission execution tasks (6.7 vs. 8.4). Additional t-tests were conducted to compare the means for each of the planning/execution subtasks. The t-test results indicated that the differences in the mean ratings for 2D and 3D were statistically significant at the p < .05 level for all tasks/subtasks, with the exception of determining ingress/egress routes.
29

Mission Planning Tasks
Mean Rating 2D Photograph
Mean Rating 3D Hologram
ID Threats 5.8 7.2 Target Analysis 6.3 7.5 Friendly Disposition 6.7 7.4 Weapons Employment 5.9 7.9 Mission Planning Tasks (Mean) 6.1 7.5
Mission Execution Tasks Target talk-on 7.1 8.4 Collateral damage estimate 6.4 8.9 Battle damage assessment 6.6 8.0 Mission Execution Tasks (Mean) 6.7 8.4
Planning and Execution Subtasks Determine relative height of buildings 4.4 8.4 Determine relative height of other objects 3.6 7.9 Determine relationship to vehicles 5.4 7.2 Determine LZs 5.0 8.1 Determine Ingress/Egress Routes 6.8 7.8 Interpret Shadows 5.9 8.3 Interpret Vegetation 5.9 7.9 Determine line of sight 4.1 8.3 Determine line of fire 4.0 8.7 Determine breaks between buildings 5.6 8.3 Position teams, snipers, 4.8 8.6 Define cordons 6.3 7.8 Determine JTAC overwatch position 5.6 8.8 Planning / Execution Subtasks (Mean) 5.2 8.2
Table 1: Mean ratings for 2D photo and 3D holograms for each task and subtask
30
31
1 2 3 4 5 6 7 8 9 10
Determine Ingress/Egress Routes
Define cordons
Determine relationship to vehicles
Interpret Vegetation
Interpret Shadows
Collateral damage estimate
Determine breaks between buildings
Determine LZs
Determine JTAC overwatch position
Position teams, snipers,
Determine relative height of buildings
Determine line of sight
Determine relative height of other objects
Effectiveness RatingPoorest Best
Mis
sion
Tas
k
2D vs. 3D Effectiveness Ratings 3D Hologram 2D Photo
Figure 16: Bar Chart showing mean ratings for 2D photo and 3D holograms for each task and
subtask in order of magnitude
The JTACs were asked how the holograms might assist them with mission planning and execution. All JTACs indicated that the holograms would be useful for mission planning and/or execution. The most frequently cited benefit of the holograms was the relative height information, which was identified by seven JTACs. Specific comments in this domain included the ability to distinguish between a building rooftop and adjacent courtyard, to determine depth and shape of buildings, and to identify the tallest buildings. Five JTACs indicated that the CDE process would be enhanced with the holograms. The Chief of STANEVAL commented that CDE was the greatest benefit of the holograms. The selection of JTAC overwatch and/or sniper positions with good line of sight was cited by five participants as a benefit of the holograms. Three JTACs mentioned that the holograms would assist them with target talk-on, although throughout each questionnaire session this task was mentioned several times as being a benefit of the hologram. The questionnaire also addressed how the holograms could be improved with respect to physical size, scale, color, and overlays. All JTACs indicated that the A1 format holograms would be suitable for use during mission planning. Five of these participants also indicated that this size could potentially be used for TOC-centric mission execution. One JTAC commented that the A1 format was too big for the TOC. Two individuals indicated that this size could potentially be used in a vehicle during execution, while no JTACs believed that the A1 size was feasible for use on foot. With respect to the scale, eight JTACs indicated that the 37.5 m had marginal use and that a 2D map or photo might be just as effective. One JTAC indicated that the 37.5 m scale might be good for planning routes. Seven JTACs reported that the 15 m scale was

the most useful of the three examined. Five participants indicated that the 2.5 m hologram was useful for deriving more information about building details and structure. The remaining four JTACs indicated that this hologram did not have sufficient resolution and/or was too close-up to be useful. All JTACs indicated that an overlay, either embedded in or placed above the holographic image, would be beneficial. In addition, the JTACs also expressed the desire to be able to write/erase their own overlay information on the hologram. The inclusion of grids (namely MGRS) as an overlay was recommended by eight individuals. Other types of information recommended for overlays by at least three JTACs were labeled roads/routes, spot elevations, and a compass or “North” arrow. A transparent 3D measurement grid hologram was generally considered useful, although no survey questions included it.
Figure 17: Two views of 3D measurement grid hologram used on top of Sadr City hologram
With respect to the color hologram, six JTACs thought that color would be beneficial and would be a good cue for target talk-on. These individuals noted improved contrast of objects in the scene (due to wider variation of colors vs. monochrome image). Three individuals commented that the color hologram was not a necessity. The Chief of STANEVAL commented that color might result in miscommunication between the JTAC and the aircrew. An important consideration mentioned by several JTACs was the increased development and delivery time involved with a color hologram. Eight JTACs provided an assessment of the flip-book concept. All of them liked the concept and thought it was feasible for use during execution. Five participants stated that they would use the 8 x 10 in format for execution. Three participants preferred the smaller 4 x 5 in size for execution. The consensus was that the flip-book concept is feasible for mission execution, but the final product of the hologram should match that used in the 2 x 3 ft size. All JTACs preferred the dark film background sheet behind the hologram. Both the AFRL MH-53 pilot SME and the ALO (F-16 pilot) indicated that the flip-book concept would not be feasible for aircrew use in the cockpit.
32

Seven JTACs completed the exercise of identifying the tallest structure in both the 2D photo and the 3D A1 size hologram. The tallest structure was a power line tower located just north of the scenario target house. The tower was difficult to discern in the 2D photo, although its shadow was distinct. All participants took several seconds inspecting the 2D image before providing a response. Three were unwilling to venture a guess, three selected a building or mosque based on width/length dimensions, and one selected the tower but mistook it for a tree. All JTACs readily and immediately identified the tower as the tallest structure in the 3D hologram. The average confidence ratings in the determination of the tallest structure provided by the JTACs were 2.7 for the 2D image and 9.0 for the 3D hologram.
Conclusions The results of the evaluation indicate that the 3D holograms are an effective tool for JTAC mission planning and execution. JTACs were very receptive to the potential use of holograms to plan and execute the cordon and search scenario provided and identified other missions that would benefit from their use. The JTACs rated the holograms more effective than the corresponding 2D photo for all mission planning and execution tasks examined. The determinations of CDE, relative height of buildings, lines of fire and sight, and JTAC over-watch position were the tasks judged to benefit the most from the use of holograms. The effectiveness of the holograms in completing the CDE mission task received the highest overall rating of 8.9. The hologram effectiveness rating results were very consistent with the comments made by JTACs when asked how the holograms might best benefit their mission duties. During the interviews, the most frequently cited benefit was the relative height information. Specific comments in this domain included the ability to distinguish between a building rooftop and adjacent courtyard, to determine depth and shape of buildings, and to identify the tallest buildings. The majority of the JTACs also stated that CDE would be significantly enhanced with the hologram. The only mission planning and execution subtask not rated to be significantly enhanced by use of the holograms was the determination of ingress/egress routes. The average ratings for the definition of cordons also were similar for both the 3D and 2D images. This finding suggests that 2D imagery of a target area with overlays contain sufficient information to make determinations relevant to routes to/from a target area and cordon boundaries. The enhanced depth information provided by the hologram will have its greatest advantage in determinations of collateral damage, positioning of JTACs, snipers and friendly forces, and in deriving critical target details relevant to size, shape, and height. The finding that all JTACs more readily and confidently (9 to 3) identified the tallest structure in the hologram versus the 2D photo further supports this conclusion. The average rating of effectiveness of the 2D photos with embedded overlays for completing the planning and execution subtasks was 5.2, whereas the average effectiveness rating for the holograms was above 8.0. This finding suggests that JTACs
33

regard a 2D photo as only marginally effective for use in planning and execution, and there is some degree of uncertainty in the determinations made using 2D tools. The tasks of determination of relative building heights, lines of sight and fire, and positioning of teams received average ratings of below 5.0 using the 2D photos. The 2D tools rated in this exercise were derived from high resolution Buckeye imagery, and the JTACs noted it to be representative of current tools. The consensus of the JTACs was that the A1 size hologram would be highly effective for mission planning and during execution from a TOC. Of the scales examined, the 15 m proved to be the most useful, although the results suggest that additional scales may be useful for certain missions and would warrant further investigation. The largest scale examined here (37.5 m) was not judged to be more effective than a 2D photo or map by most JTACs. An important consideration highlighted several times throughout this effort was that the JTACs prefer to execute their missions using the same materials used in planning. For example, an 8.5 x 11 in 2D photo overlaid with MGRS grids, route names, and building numbers would be carried on foot or in the vehicle. The concept of a flip-book containing smaller size holograms was developed with this intention. The JTAC could use the 8 x 10 in holograms to derive critical information during mission planning and apply overlays to them using a grease pencil. The completed product would be in a format suitable for operations in the field on foot or in a vehicle. The flip-book holograms evaluated in the current effort were limited in effectiveness due to image registration issues between the hologram sheet and the 2D photo. A new flip-book design should be considered with facing pages being the same content, one in conventional 2D form, and the other being in Zebra 3D hologram form. This multi-modal presentation will enable the strengths of both to be available to the warfighter in a convenient and portable form-factor.
Figure 18: Rendering sketch of proposed new flip-book design
34

All JTACs wanted the capability to write/erase on the holograms to aid them in mission planning. The JTACs also believed that certain information such as MGRS grid lines, spot elevations, North compass arrow, and date should be embedded in the holograms during the development process. The potential benefit of color holograms to the JTAC mission was addressed both in the San Saba field exercise and in the interview sessions. Most JTACs thought that color would be an additional feature that would benefit target talk-on. However, the added expense and time of delivery are two important considerations that were raised by JTACs, and should be considered in future development and evaluation of this feature. A variety of light sources was used with the holograms during the field and indoor exercises. Unobstructed sunlight constitutes an excellent light source for viewing the holograms. Of the artificial light sources used, an AC-powered 15-watt green LED lamp generally provided the best results for viewing the holograms. LED flashlights and headlamps were also used successfully to view the holograms. The operating environment (e.g. vehicle, TOC, or planning room) and the desired level of covertness are important considerations in selecting an appropriate light source. The light sources examined in this effort were all considered feasible for the JTAC mission. Other scenarios identified by the JTACs as being good candidates for the application of 3D holographic technology included SOF urban assault, counter IED, counter mortar and TOC-centric missions. The aircrew members involved in this effort strongly suggested that holograms would be beneficial in flight planning prior to CAS operations.
Recommendations The use of holographic technology to benefit other JTAC missions should be explored. Relevant mission areas on which to focus future JTAC applications, identified during the present effort, include counter IED, counter mortar, mission rehearsal/rock drill, and SOF missions. Exploration of the use of holograms also is recommended for aircrew flight planning and mission briefing prior to CAS operations. Based on feedback from the ALO and an MH-53 pilot SME member of the AFRL-Zebra team, holograms would be a valuable aircrew mission planning tool. A user-centered evaluation similar to that completed for the JTACs should be conducted within the USAF special operations and/or air combat aircrew community to elicit feedback from pilots and mission planners on potential applications of holographic technology. An additional recommendation of this effort is that the A1 monochromatic holograms be further examined in a TOC-based field deployment study to acquire additional feedback from warfighters on their benefits to mission planning and execution. A key finding of the evaluation was that JTACs prefer to execute the CAS mission using the same imagery and mapping tools that they developed during mission planning. A field study that encompassed both mission planning and execution phases and employed the same hologram(s) throughout these phases would provide vital feedback. If feasible, this field
35
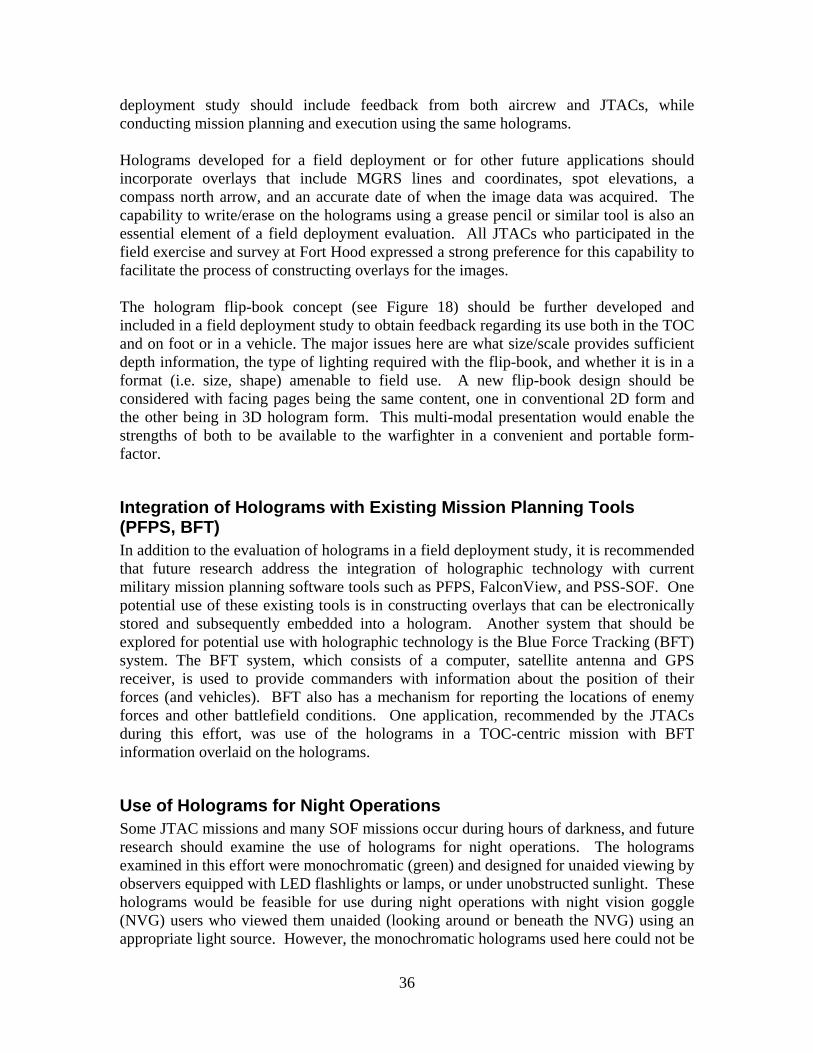
deployment study should include feedback from both aircrew and JTACs, while conducting mission planning and execution using the same holograms. Holograms developed for a field deployment or for other future applications should incorporate overlays that include MGRS lines and coordinates, spot elevations, a compass north arrow, and an accurate date of when the image data was acquired. The capability to write/erase on the holograms using a grease pencil or similar tool is also an essential element of a field deployment evaluation. All JTACs who participated in the field exercise and survey at Fort Hood expressed a strong preference for this capability to facilitate the process of constructing overlays for the images. The hologram flip-book concept (see Figure 18) should be further developed and included in a field deployment study to obtain feedback regarding its use both in the TOC and on foot or in a vehicle. The major issues here are what size/scale provides sufficient depth information, the type of lighting required with the flip-book, and whether it is in a format (i.e. size, shape) amenable to field use. A new flip-book design should be considered with facing pages being the same content, one in conventional 2D form and the other being in 3D hologram form. This multi-modal presentation would enable the strengths of both to be available to the warfighter in a convenient and portable form-factor.
Integration of Holograms with Existing Mission Planning Tools (PFPS, BFT) In addition to the evaluation of holograms in a field deployment study, it is recommended that future research address the integration of holographic technology with current military mission planning software tools such as PFPS, FalconView, and PSS-SOF. One potential use of these existing tools is in constructing overlays that can be electronically stored and subsequently embedded into a hologram. Another system that should be explored for potential use with holographic technology is the Blue Force Tracking (BFT) system. The BFT system, which consists of a computer, satellite antenna and GPS receiver, is used to provide commanders with information about the position of their forces (and vehicles). BFT also has a mechanism for reporting the locations of enemy forces and other battlefield conditions. One application, recommended by the JTACs during this effort, was use of the holograms in a TOC-centric mission with BFT information overlaid on the holograms.
Use of Holograms for Night Operations Some JTAC missions and many SOF missions occur during hours of darkness, and future research should examine the use of holograms for night operations. The holograms examined in this effort were monochromatic (green) and designed for unaided viewing by observers equipped with LED flashlights or lamps, or under unobstructed sunlight. These holograms would be feasible for use during night operations with night vision goggle (NVG) users who viewed them unaided (looking around or beneath the NVG) using an appropriate light source. However, the monochromatic holograms used here could not be
36

used for viewing through NVGs because the NVG sensor is sensitive primarily to near infrared (IR) energy, and this band is not reflected by the green monochromatic holograms. Development work is required to manufacture holograms that reflect IR energy, making them visible in the spectral response range of the NVG device.
Hologram Training Requirements and Training Potential Both the training requirements and the training potential of holographic technology in mission planning and execution should be explored. Since the hologram is a new technology and differs from currently used imagery tools, specific training requirements regarding hologram interpretation and use should be identified. Holograms may also have potential value in improving training. An evaluation of both the training requirements and potential of holograms could be accomplished in the context of a simulator testbed or in the field as part of “on-the-job” training. Research and development efforts at AFRL/RHA to support the Joint Close Air Support (JCAS) tactical mission have been directed at the development of a science and technology proof-of-concept known as the JTAC Training and Rehearsal System (TRS). The JTAC-TRS environment was designed to provide JTACs with a high-fidelity, fully-immersive training and rehearsal environment with real-time sensor, simulator and database correlation. The JTAC-TRS environment at AFRL/RHA would be a good candidate for researching the training value of this technology in a simulator testbed. The focus of such an effort would be the use of static 3D holograms in an immersive environment mission rehearsal, execution, and debrief, where complex 3D data visualization and information extraction is critical to the warfighter, mission director, equipment maintenance, and/or mission planners.
Figure 19: AFRL JTAC-TRS dome. (Photo by Gina Cinardo AFRL/RHA)
37

Appendix A: Verbatim Transcript: How might holograms assist you with mission planning and execution? DB: For mission planning biggest benefit is seeing how tall everything is, the relative height of everything. When going on a search for a target house, it is nice to see how big the house is. 2D looks too flat and I can't determine size of it. Using 2D map, I would think this was tallest building but with 3D I see there are actually taller buildings around it. JR: The largest benefit is CDE. Definitely benefits me to know where friendly forces need to be when munitions are being deployed. I can tell ground commander where guys need to move before deploying munitions. It would definitely help with describing what I am looking at to pilot; shapes of buildings, where courtyards are in relationship to building. I really like the 15m scale in particular. SD: I would use it as an advisement tool to advise the commander regarding certain positions, building heights, hazards, course of action regarding sniper positions, blocking positions; definition of primary and secondary threats. This is a great tool. AS: Hologram allows operator to determine height above ground of natural and man-made features; this helps in predicting collateral damage assessments, choosing overwatch positions with good line of sight, and determining DMPI's (desired mean point of impact). SP: The depth of 3D gives more perspective than the 2D for mission planning. The hologram does give better SA as compared to 2D image; I would think that everyone of these buildings are the same but actually I can tell that some of the buildings are taller than others. AP: Planning would be majority of the use of holograms. Several instances in Iraq where I was helping plan artillery and it was hard to decipher on some of the rooftops if there was another level or not; coordinating that with guys on the ground was sketchy, using hologram, everyone can see that there are different levels to every building. Would help out in planning process to be actually able to look at building and how they are laid out and oriented rather than having to use 2D and "guesstimate". CC: Holograms would be useful for weaponeering, determining CDE, and positioning of JTACs for good line of sight. Anything that has to do with height; If I am determining deconfliction issues with vertical structures, if you throw vertical in the loop, I would rather have this (referring to 3D hologram). DG: The hologram helps me determine heights of everything. Also useful in determining the highest point for an overwatch position and addressing CDE concerns. JK: This size hologram (A1 size) good for around the table planning for six people (JTAC, commander, FSO, any other players involved). Can see different heights of buildings for planning overwatch and sniper positions, we are able to determine this building is bigger than that building. Wouldn't want to position teams back here, since these buildings are higher; Can also identify hazards for aviation guys.
38

Appendix B: Glossary of Terms 2D: Two Dimensional 3D: Three Dimensional A1 size: 600 x 850 mm, or approximately 2 ft x 3 ft AFRL: Air Force Research Laboratory AGI: Advanced Geospatial Intelligence AGOS: Air Ground Operator School (at Nellis AFB, NV) ALO: Air Liason Officer AO: Area of Operations ASOS: Air Support Operations Squadron BDA: Battle Damage Assessment BFT: Blue Force Tracking BN HVI: Batallion High Value Individual CAS: Close Air Support CDE: Collateral Damage Estimate CFPS: Combat Flight Planning Software CY: Court Yard DEM: Digital Elevation Model DMPI: Desired Mean Point of Impact DoD: Department of Defense FB: Forward Base FF: Friendly Forces FOB: Forward Operations Base FSO: Field Service Officer or Field Security Officer GEOINT: Geospatial Intelligence GOTS: Government-Off-The-Shelf GPS: Global Positioning System GRG: Gridded Reference Graphic HOGEL: Holographic Element HUMINT: Human Intelligence HVI: High Value Individual IED: Improvised Explosive Device I/ITSEC: Intersevice/Industry Training Simulation & Education Conference IP: Initial Point IRGC: Islamic Revolutionary Guard Corps ISO: in support of ISR: Intelligence Surveillance & Reconnaissance IVO: in vicinity of JAGOG: Joint Air Ground Operations Group - new name for former AGOS JCAS: Joint Close Air Support JDAM: Joint Direct Attack Munition JFO: Joint Fires Officer JOGA: Joint Operations Graphic - Air JTAC: Joint Terminal Attack Controller
39

LED: Light Emitting Diode LIDAR: Light Detection and Ranging LOS: Line of Sight LZ: Landing Zone MGRS: Military Grid Reference System NGA: National Geospatial-Intelligence Agency NVG: Night vision goggles ONIR: Overhead Non-imaging Infrared OP: Observation Point OPORD: Operation Order PC: Personal Computer PFPS: Portable Flight Planning Software PID: positive ID PLT: Platoon PSD: personal security detachment PSS-SOF: Precision Strike Suite for Special Operations Forces QRF: Quick Reaction Force ROE: Rules of Engagement ROVER: Remotely Operated Viewing Enhanced Receiver SA: Situational Awareness Smartpack: a “book” that JTACs carry, containing all the relevant imagery and
information needed for a particular mission SME: Subject Matter Expert SOF: Special Operations Force SOTAC: Special Operations Terminal Attach Controller SP: starting point SPINS: special instructions SSGT: Staff Sergeant STANEVAL: Standardization and Evaluation TIC: troops in contact TLM: Topographic Line Map TOC: Tactical Operations Center TOT: Time on Target TSGT: Tech Sergeant TST: Time-Sensitive Target TRS: Training and Rehearsal System UAV: Unmanned Aerial Vehicle VRML: Virtual Reality Modeling Language
40

Appendix C: Detailed Specifications of Lighting Systems Hologram Lighting Requirements Holograms require a point-like and narrow-spectral-band illumination light source for sharpest detail reconstruction. Extended white light sources such as a long fluorescent lights or a cloudy sky will reconstruct holographic images that will be blurred and lacking in contrast, and therefore difficult or impossible to interpret. A selection of some highly recommended hologram lighting follows below. Barring combat situations where low light levels are tactically advantageous, generally speaking, the brighter a hologram illumination light source, the better the viewability. Unobstructed sunlight is ideal. In an environment where artificial light sources are required and standard AC power is available (possibly even provided by a generator in the field), the higher power of a 15 Watt LED lamp is usually best. In the field where an AC generator is impractical or unavailable, a flashlight or head-mounted light source may be best. Inside a vehicle, it is also possible to power a 5 Watt LED light using the standard 12 V cigarette lighter. Low-intensity LED illumination sources for use in combat on the ground, in a vehicle, or in a cockpit are readily available commercially. Most of the light sources recommended above have a low-intensity output setting, and in all cases a darkening filter may be added if desirable.
41

Appendix D: JTAC Questionnaire Imagery Tools for Mission Planning and Execution
JTAC Survey Name: _____________________________ Date: ___________________ Time: __________________ Phase of Training: IQT ______ MQT ________ CT ________ Years Exp: JTAC conventional: ________ SOF/Ranger: _______ Additional Certifications: TAC-I ________ SEE _________ In the context of the briefed mission scenario _______________________ Please list the tools (e.g., imagery, maps, photos, other intelligence data) that you would use during: Mission Planning: Mission Execution: How would you use these tools to: Plan the mission: Execute the mission:
42

On a scale of 1 to 10 with “1” being Highly Ineffective and “10” being Highly Effective, please rate the effectiveness of the 2D imagery and 3D holograms for use in completing each Mission Task and Sub-task:
Highly Ineffective _______________________________Highly Effective 1 10
JTAC Mission Duties
Effectiveness of Image for
use in Completing the Task/Sub-Task
2D 3D Mission Planning Tasks ID Threats Target Analysis Friendly Disposition Weapons Employment Mission Execution Tasks Target talk-on Collateral damage estimate Battle damage assessment Planning and Execution Subtasks Determine relative height of buildings Determine relative height of other objects Determine relationship to vehicles Determine LZs Determine Ingress/Egress Routes Interpret Shadows Interpret Vegetation Determine line of sight Determine line of fire Determine breaks between buildings Position teams, snipers, Define cordons Determine JTAC overwatch position Other: Other: Other: Other:
43

Are the mapping/imagery tools you use consistent across different types of missions, (e.g. SOF, Conventional JTAC, TOC Centric)? If not, please explain. What types of information is most critical in the overlays that you use with the imagery? (eg. Coordinate systems, LZs, elevation data etc.) What are the limitations of the current 2D mapping tools/imagery that you use? How might the 3-D holograms assist in mission planning/ execution? How could the holograms be modified to make them more useful to mission planning and execution regarding: Scale: Physical Size: Overlays: Color:
44

Appendix E: JTAC Test Scenario OPERATION HAMMER FIST Friendly Force Information: OP Staging at FOB DALEY 2-4 BN Alpha, Bravo, and Charlie Companies are at the AA located at FOB DALEY preparing to SP to the operation. FF JTAC is colocated at FOB DALEY with the 2-4 BN TAC on the west side of Sadr City Situation Update: A credible HUMINT source has tipped off Coalition forces to the possibility that #3 BN HVI Ahmed Abdul Ismail will be attending a high level meeting in Sadr City. Ahmed is a member of the IRGC's Qods force and is known to recruit and fund foreign fighters to act as suicide bombers. Mission Objective: 2-4 BN is tasked with the kill/capture of HVI#3. Bravo Co is tasked with setting up a cordon after the HVI's enter the target area. Alpha Company will provide assault force and prisoner containment and transport back to FOB DALEY if necessary. Charlie Co is tasked as the QRF (quick reaction force) and will remain at FOB Daley until needed. JTAC will be collocated with the members of the BN TAC in a suitable over-watch position. Concept of the Operation: After PID that HVI #3 has entered the target area, Bravo Co will move out of FOB Daley along RTE Guinness and turn South at RTE Vodka. Bravo Co will turn East on Heineken and split forces at the intersection of Heineken and Gin with a single Platoon moving North and setting up a blocking position at the intersections of Gin and Guinness and the rest of the Company setting up a blocking position at the intersection of Whiskey and Heineken . Alpha Co and the BN TAC will move out from FOB Daley and approach the target area from the North along RTE Whiskey. Alpha Co will surround the target building and provide the assault force while the BN TAC will seal the intersection of Whiskey and Guinness and provide over-watch. Alpha Co will fix in place vehicles attempting to depart the area as well as provide the assault force on the building. Bravo Co will contain any escaping vehicles and squirters. Initial trigger for SP from FB Daley are a HUMINT source PID HVI #3 is at the target building or PID from A/C or UAV of HVI #3's convoy entering the target area. Ground Commander's Intent for CAS: Provide over-watch and counter IED support to FF vehicles ingressing to target area Observe and report personnel and vehicle traffic IVO HVI target building. Provide ISR ISO locating and PID HVI #3. On order TIC support. Provide fire support locating and neutralizing escaping vehicles and squirters.
45

Appendix F: References AIR FORCE INSTRUCTION 13-112, (2006). JTAC Training Program, Bailey, C. (2005). Department of Defense usage of FalconView, White Paper, Georgia Research Institute, http://www.falconview.org/docs/ Cockburn, A., & McKenzie B. (2002). Evaluating the Effectiveness of Spatial Memory in 2D and 3D Physical and Virtual Environments. Proceedings of the ACM Computer-Human Interaction Conference, Human Factors in Computing Systems, ACM Press, pp.203-210. Harrower, M., & Sheesley, B.(2005). Moving beyond novelty: Creating effective 3-D fly-over maps. Proceedings of 22nd International Cartographic Conference, A Coruña, Spain. Hoffpauir, C. (2005). USJFCOM Works to Standardize Joint Close Air Support. JFCOM.mil Public Affairs, http://www.jfcom.mil/newslink/storyarchive/2005/pa080205.htm JCAS AP MOA 2004-01 (2004), Joint Terminal Attack Controller (JTAC) (Ground), US JFCOM Memorandum of Agreement. Joint Publication 3-.09.3 (2003) Joint Tactics, Techniques, and Procedures for Close Air Support (CAS). Kinne, G.S., Tanzi, J.A., & Yaeger, J.W. (2006). FA PGMs: Revolutionizing Fires for the Ground Forces Commander, Field Artillery, pp. 16-21. Lindsay J. (2006). War Upon the Map: The Politics of Military User Innovation. MIT Political Science Dept., DRAFT v2.0, 20 April 2006. Reed, J.D. (2006). Army Transformation's Impact on Close Air Support Terminal Attack Control, Technical Report, U.S. Army War College, Carlisle Barracks, Carlisle, PA. Schanz, M.V. (2005). ROVER's Here. Air Force Magazine Online, http://dailyreport.afa.org/AFA/Features/airpower/box122205rover.htm St. John, M., & Cowen, M.B. (1999). Using 2-D vs. 3-D Displays: Gestalt and Precision Tasks, In Proceedings of the Human Factors and Ergonomics Society 43rd Annual Meeting, Santa Monica, CA. St. John, M., Smallman, H.S., Oonk, H.M., & Cowen, M.B. (2000). Navigating Two- Dimensional and Perspective Views of Terrain. SPAWAR System Center, Tech. Rep. 1827, San Diego, CA.
46

47
Wallach, S. (2007). Technology expands GEOINT capabilities, Pathfinder Magazine Vol. 5, No. 6, http://www.nga.mil/NGASiteContent/StaticFiles/OCR/novdec07.pdf


