
Tissue microarrays for miniaturized high-throughput molecular profiling of tumors
8
Experimental Hematology 30 (2002) 1365–1372 0301-472X/02 $–see front matter. Copyright © 2002 International Society for Experimental Hematology. Published by Elsevier Science Inc. PII S0301-472X(02)00965-7 Tissue microarrays for miniaturized high-throughput molecular profiling of tumors Ronald Simon and Guido Sauter Institute of Pathology, University of Basel, Basel, Switzerland (Received 10 June 2002; revised 26 August 2002; accepted 29 August 2002) New high-throughput screening technologies such as complementary (cDNA) microarrays al- low identification of hundreds of candidate genes in one experiment. To prioritize the leads ob- tained in such studies, it is necessary to analyze a large number of tissues for candidate gene expression. Tissue microarray (TMA) technology greatly facilitates such analyses. In this method, hundreds of minute tissue samples (0.6-mm diameter) can be placed on one micro- scope glass slide. The TMA approach allows simultaneous analysis of all tissues with in situ methods (immunohistochemistry, fluorescence in situ hybridization, RNA in situ hybridiza- tion) of all tumors in one experiment under highly standardized conditions. TMAs are not re- stricted to solid tumors but can be manufactured from a variety of other sources, including cell lines, xenografts, and hematologic tissues. In addition to tumor type–specific applications that comprise large numbers of one particular tumor type with extensive histopathologic and clini- cal data, TMAs are well suited for large-scale molecular epidemiologic studies. For example, genes of interest can be analyzed in multitissue TMAs containing a variety of different human normal tissues and tumor entities. Once tumor types are identified, where a given molecular alteration plays a role, the clinical significance of this molecular alteration can be investigated on tumor-specific TMAs. Thus, TMA technology allows miniaturized high-throughput molec- ular epidemiologic studies. The TMA technique will markedly accelerate the transition from basic research to clinical applications. © 2002 International Society for Experimental Hematology. Published by Elsevier Science Inc. The completion of the human genome sequence has pro- vided comprehensive information on the structure of all hu- man genes (http://www.ncbi.nlm.nih.gov/). Based on these data, high-throughput analysis methods such as cDNA mi- croarrays have been developed, allowing simultaneous ex- pression analysis of tens of thousands of genes in one exper- iment [1]. Similarly, modern proteomic tools allow survey of hundreds (or thousands) of proteins at once [2]. These high throughput-screening techniques have fundamentally changed biomedical research. They now are used extensively in both academic and industrial settings. Consequently, hundreds or thousands of expressed sequence tags (ESTs), genes, or gene products with a potential role in one or several nonneoplastic or neoplastic diseases have been discovered. As a next step after genomics, protein validation studies are essential to identify candidates that eventually will lead to clinically use- ful applications. For example, knowledge of the molecular epidemiology of a protein—that is, the distribution of the pro- tein across all different types of diseased and nondiseased tis- sues—will allow identification of diseases that might benefit from a new treatment. New technology is facilitating high-throughput analysis of multiple different tissues, e.g., by multitissue Northern blots, protein arrays, or high-throughput real-time polymer- ase chain reaction assays [3–6]. However, all of these meth- ods share the disadvantage that disintegrated tissues are used and that the cell types expressing a gene of interest cannot be identified. This is a problem because candidate genes can be expressed in multiple different tissue compart- ments. For example, it is possible that the same genes can be expressed in tumor cells, tumor stroma, or newly formed blood vessels in different tumor types. In situ technologies, such as immunohistochemistry (IHC), RNA in situ hybrid- ization (RNA-ISH), or fluorescence in situ hybridization (FISH), are optimal for analyzing molecular epidemiology. However, using traditional methods of molecular pathol- Offprint requests to: Guido Sauter, M.D., Institute of Pathology, Univer- sity of Basel, Schoenbeinstrasse 40, CH-4031 Basel, Switzerland; E-mail: [email protected]
-
Upload
ronald-simon -
Category
Documents
-
view
218 -
download
1
Transcript of Tissue microarrays for miniaturized high-throughput molecular profiling of tumors
Experimental Hematology 30 (2002) 1365–1372
0301-472X/02 $–see front matter. Copyright © 2002 International Society for Experimental Hematology. Published by Elsevier Science Inc.PII S0301-472X(02)00965-7
Tissue microarrays for miniaturizedhigh-throughput molecular profiling of tumors
Ronald Simon and Guido Sauter
Institute of Pathology, University of Basel, Basel, Switzerland
(Received 10 June 2002; revised 26 August 2002; accepted 29 August 2002)
New high-throughput screening technologies such as complementary (cDNA) microarrays al-low identification of hundreds of candidate genes in one experiment. To prioritize the leads ob-tained in such studies, it is necessary to analyze a large number of tissues for candidate geneexpression. Tissue microarray (TMA) technology greatly facilitates such analyses. In thismethod, hundreds of minute tissue samples (0.6-mm diameter) can be placed on one micro-scope glass slide. The TMA approach allows simultaneous analysis of all tissues with in situmethods (immunohistochemistry, fluorescence in situ hybridization, RNA in situ hybridiza-tion) of all tumors in one experiment under highly standardized conditions. TMAs are not re-stricted to solid tumors but can be manufactured from a variety of other sources, including celllines, xenografts, and hematologic tissues. In addition to tumor type–specific applications thatcomprise large numbers of one particular tumor type with extensive histopathologic and clini-cal data, TMAs are well suited for large-scale molecular epidemiologic studies. For example,genes of interest can be analyzed in multitissue TMAs containing a variety of different humannormal tissues and tumor entities. Once tumor types are identified, where a given molecularalteration plays a role, the clinical significance of this molecular alteration can be investigatedon tumor-specific TMAs. Thus, TMA technology allows miniaturized high-throughput molec-ular epidemiologic studies. The TMA technique will markedly accelerate the transition frombasic research to clinical applications. © 2002 International Society for Experimental
Hematology. Published by Elsevier Science Inc.
The completion of the human genome sequence has pro-vided comprehensive information on the structure of all hu-man genes
(http://www.ncbi.nlm.nih.gov/).
Based on thesedata, high-throughput analysis methods such as cDNA mi-croarrays have been developed, allowing simultaneous ex-pression analysis of tens of thousands of genes in one exper-iment [1]. Similarly, modern proteomic tools allow survey ofhundreds (or thousands) of proteins at once [2]. These high
throughput-screening techniques have fundamentally changedbiomedical research. They now are used extensively in bothacademic and industrial settings. Consequently, hundreds orthousands of expressed sequence tags (ESTs), genes, or geneproducts with a potential role in one or several nonneoplasticor neoplastic diseases have been discovered. As a next stepafter genomics, protein validation studies are essential to
identify candidates that eventually will lead to clinically use-ful applications. For example, knowledge of the molecularepidemiology of a protein—that is, the distribution of the pro-tein across all different types of diseased and nondiseased tis-sues—will allow identification of diseases that might benefitfrom a new treatment.
New technology is facilitating high-throughput analysisof multiple different tissues, e.g., by multitissue Northernblots, protein arrays, or high-throughput real-time polymer-ase chain reaction assays [3–6]. However, all of these meth-ods share the disadvantage that disintegrated tissues areused and that the cell types expressing a gene of interestcannot be identified. This is a problem because candidategenes can be expressed in multiple different tissue compart-ments. For example, it is possible that the same genes canbe expressed in tumor cells, tumor stroma, or newly formedblood vessels in different tumor types. In situ technologies,such as immunohistochemistry (IHC), RNA in situ hybrid-ization (RNA-ISH), or fluorescence in situ hybridization(FISH), are optimal for analyzing molecular epidemiology.However, using traditional methods of molecular pathol-
Offprint requests to: Guido Sauter, M.D., Institute of Pathology, Univer-sity of Basel, Schoenbeinstrasse 40, CH-4031 Basel, Switzerland; E-mail:[email protected]

1366
R. Simon and G. Sauter/Experimental Hematology 30 (2002) 1365–1372
ogy, large-scale in situ tissue analyses are labor intensiveand slow. Moreover, cutting traditional tissue sections for insitu analysis would rapidly exhaust valuable tissue re-sources because not more than 200 sections can be madefrom one tissue block. To overcome these shortcomings ofin situ techniques, we recently developed the tissue microar-ray (TMA) technique [7]. In this method, up to 1000 differ-ent tissue samples from routinely formalin-fixed paraffinblocks can be placed on one microscope glass slide and thenbe analyzed simultaneously by in situ analysis methods.
Description of the technology
Most of the work related to manufacture of TMAs is a “sim-ple” logistics exercise consisting of the following steps. 1)Identification of tissues that are potentially useful for array-ing from databases. 2) Collecting the respective hematoxy-lin-and-eosin–stained slides from the archive. 3) Reviewingall these slides and marking representative areas. 4) Collect-ing the respective blocks from the archive. 5) Sorting se-lected blocks and the marked slides together next to the ar-raying device. Depending on the degree of organization of atissue archive and its related databases, the resources re-quired for this part of the project vary greatly.
There are no imperative regulations for designing TMAs.However, the layout of the array should facilitate the analy-
sis. Dividing large TMAs into subsections reduces the riskof “getting lost” during analysis. Distributing the samplesrandomly across the array (and not sorted, e.g., by tumorstage or histologic grade) helps to avoid bias of the person
Figure 1. Example of a multitumor tissue microarray (TMA). (Left) Section containing 596 tissue samples (hematoxylin-and-eosin stain). The completeTMA comprises 10 sections with a total of 4788 samples. The diameter of each tissue spot is 0.6 mm. (Right) Schematic layout of the TMA section. TheTMA has been divided into six sections to facilitate navigation during microscopy.
Figure 2. Paraffin block after multiple 0.6-mm cores have been punched out.

R. Simon and G. Sauter/Experimental Hematology 30 (2002) 1365–1372
1367
reading the slide. In addition, it is advisable to include intoeach TMA a standard control section that consists of differ-ent normal tissues to check for antibody specificity andoverall staining quality. An example of a TMA containing596 tissue samples and a control area is shown in Figure 1.The control area consists of multiple punches of 15 differentnormal tissues, including skin, lymph node, heart, skeletalmuscle, smooth muscle, myometrium, thyroid gland, liver,kidney cortex, submandibular gland, endometrium, lung,cerebrum, prostate, and testis.
The tissue arraying process itself is simple. Currentlythere are two commercial vendors for tissue microarrayers
(http://www.
beecherinstruments.com; http://www.chemi-con.com). The hand-operated devices basically consist of twohollow needles and a block holder that can be positionedwith high precision. Holes are punched into empty “recipi-ent” paraffin blocks using one needle. The second needle isused to take tissue cylinders from the “donor” paraffinblock and transfer them into the premade holes of the recip-ient block at specific coordinates. A diameter of 0.6 mm hasbecome the standard size for tissue punches, because up to1000 samples can be placed into a recipient block whilesome histologic information is conveyed (one spot containsup to 500 cells depending on the tissue type). This proce-dure causes only minimal damage to the original tissueblock (Fig. 2) so that it still can be used for large-sectionanalysis if necessary.
Regular microtomes can be used to cut 4 -to 8-
�
m TMAsections. In our experience, an average of 200 sections canbe cut from one TMA block. It is advisable to perform he-matoxylin and eosin staining for histologic verification aftera number of sections (e.g., 50), particularly if FISH orRNA-ISH is performed because neither technique allowschecking for spot histology during analysis. A commercialparaffin sectioning aid kit (Instrumedics, Hackensack, NJ,USA;
http://www.instrumedics.com/PSA.htm
) that includesspecially coated microscopic slides and tissue transfer tapesfacilitates slide cutting. Most of all, it ensures that every in-dividual slice taken from the TMA block can be used. Someinvestigators dislike this tape system, mainly because theglue remains visible on the slides. At the cost of losing someslices during the cutting, TMA sections can be made with-out the tape system. The greater the number of samplesplaced into one TMAs block, the more the yield is depen-dent on the skill and experience of the person cutting thesections. The process of IHC on TMAs is basically the sameas for conventional large-sections, and the same antigen re-trieval techniques can be used.
Applications
TMAs have a variety of applications. Virtually all researchinvolving in situ tissue analysis can be done in TMA format.Most of the previous applications of the technology werebased on five different types of TMAs.
Multitumor TMAs
Samples from multiple different tumor types are included insuch TMAs. The largest TMA of this kind manufactured inour laboratory contained 4788 different samples from 130different tumor types distributed over 10 TMA blocks (oneof them shown in Fig. 1) [8]. This TMA currently is usedfor analysis of multiple different markers on the DNA andprotein level. An example of the power of this method isgiven in Table 1, which shows the frequency of CA125 ex-pression in various tumor types. CA125 has been suggestedas a diagnostic marker for ovarian carcinoma [9,10]. Thesedata confirm that ovarian cancer is the most frequently posi-tive tumor; however, other tumor types can express CA125.
Normal tissue TMAs
Normal TMAs are especially important if candidate genesare being evaluated for their potential utility as diagnosticreagents or therapeutic targets. In case of potential therapeu-tic targets, it would be most important to know whether vitalorgans such as brain, heart, kidney, liver, and bone marrowcells expressed a candidate gene.
Progression TMAs
These TMAs contain samples of different stages of one par-ticular disease. For example, in prostate cancer TMAs weremade containing normal prostate, benign prostatic hyperpla-sia, prostatic intraepithelial neoplasia, early-stage prostatecancer, advanced prostate cancer, metastatic prostate can-cer, and hormone-refractory prostate cancer after initiallysuccessful hormonal treatment [11,12]. In another study weused a “progression array” to investigate the heterogeneityof HER2 alterations between primary breast cancer andtheir metastasis, as well as between different metastasisfrom the same primary tumor [13]. Importantly, this study
Table 1.
Tumor categories showing strong CA125 expression by immunohistochemistry
Tumor category
No. ofinterpretable
samples
Samples withstrong CA125expression (%)
Adenomatoid tumor 10 60.0Ovary, serous carcinoma 45 28.9Ovary, mucinous cancer 15 26.7Ovary, endometroid cancer 43 11.6Ovarian cancer, other types 16 6.3Endometrium, serous carcinoma 23 4.3Endometrium, endometroid carcinoma 48 2.1Uterus cervix, squamous cell carcioma 45 6.7Uterus cervix, CIN III 30 3.3Breast, tubular cancer 24 4.2Malignant mesothelioma 28 3.6Gall bladder, adenocarcinoma 31 6.5Pancreas, adenocarcinoma 48 6.3Penile cancer 46 2.2Thyroid, follicular cancer 50 2.0All tumors 3578 1.4
1368
R. Simon and G. Sauter/Experimental Hematology 30 (2002) 1365–1372
revealed that HER2/neu-amplified metastasis can be foundin a small subgroup of HER2/neu-negative breast cancers.
Prognosis TMAs
These TMAs contain samples from tumors with availableclinical follow-up data. Several studies comparing molecu-lar data with clinical endpoints have been executed on
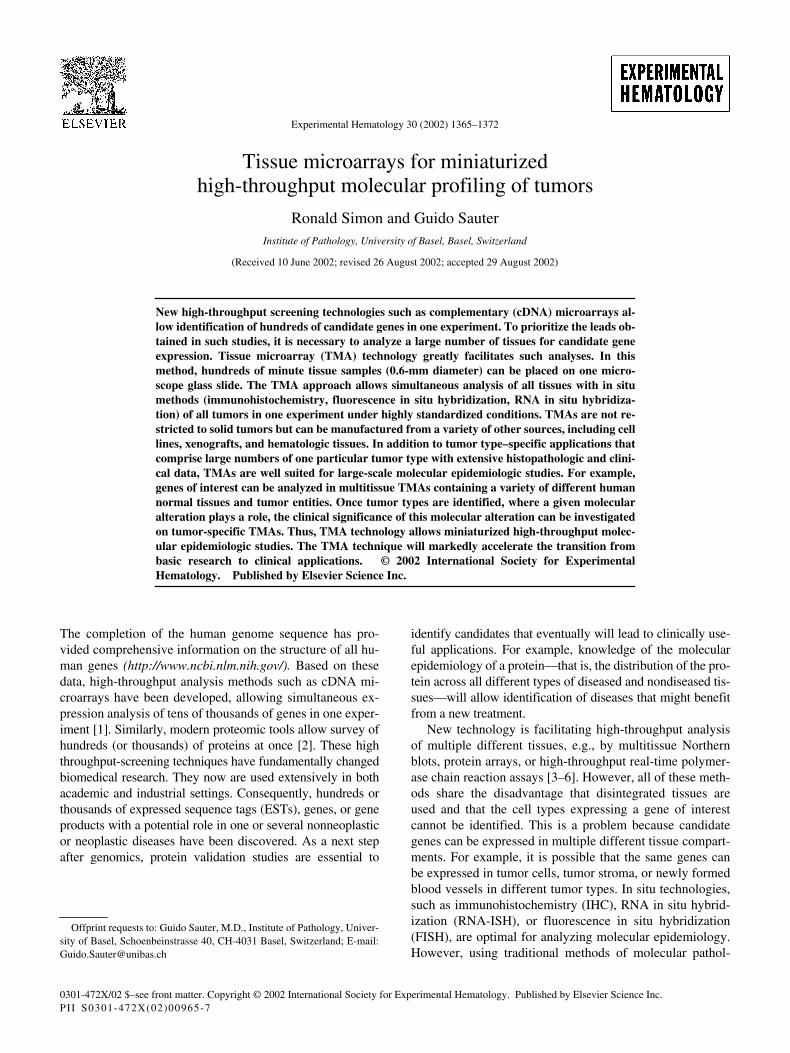
Figure 3. Section of a tissue microarray made from formalin-fixed blad-der cancer cell lines (hematoxylin and eosin stain). (Bottom) Overview.(Middle) A 100-fold magnification of two spots. (Top) A 400-fold magni-fication of the area marked in the left tissue spot.
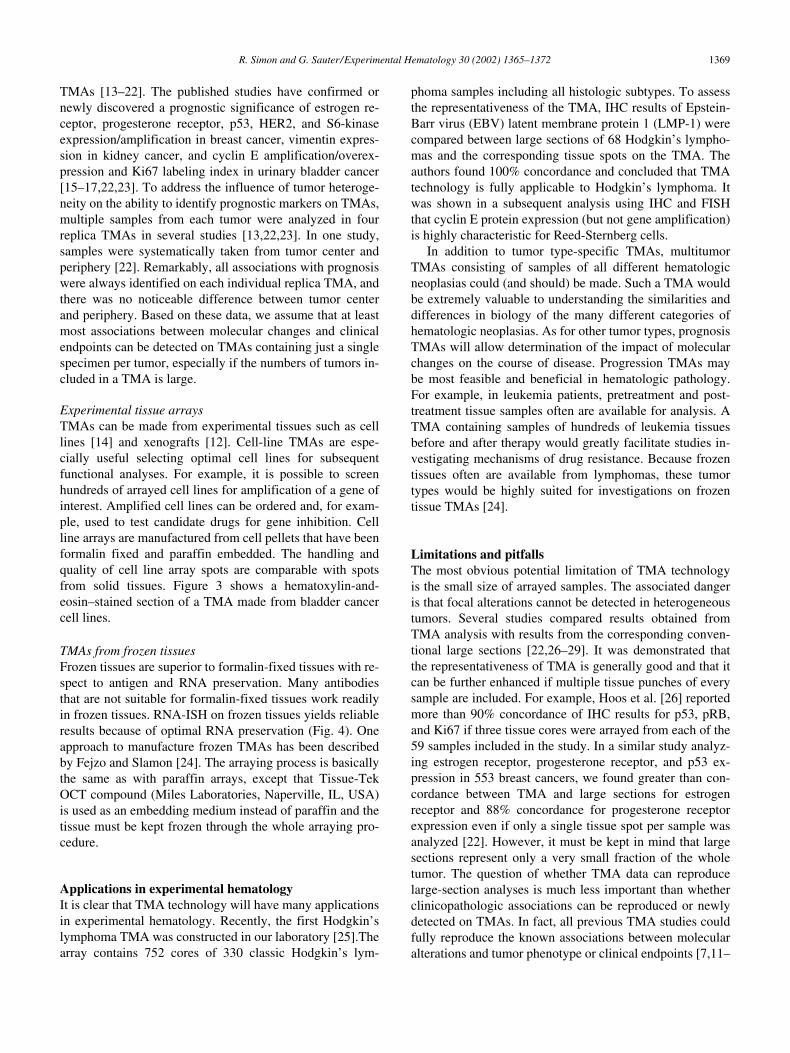
Figure 5. Tissue spot of a Hodgkin’s lymphoma. Inset: Magnification ofthe framed region showing a Reed-Sternberg cell.
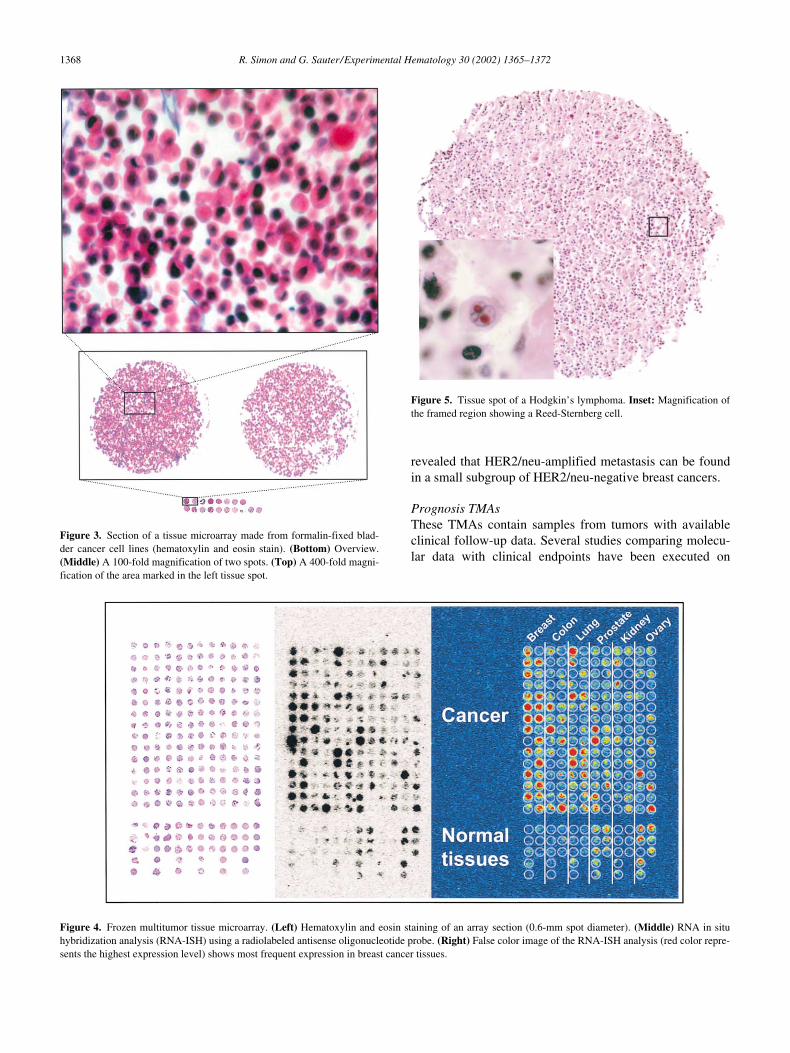
Figure 4. Frozen multitumor tissue microarray. (Left) Hematoxylin and eosin staining of an array section (0.6-mm spot diameter). (Middle) RNA in situhybridization analysis (RNA-ISH) using a radiolabeled antisense oligonucleotide probe. (Right) False color image of the RNA-ISH analysis (red color repre-sents the highest expression level) shows most frequent expression in breast cancer tissues.
R. Simon and G. Sauter/Experimental Hematology 30 (2002) 1365–1372
1369
TMAs [13–22]. The published studies have confirmed ornewly discovered a prognostic significance of estrogen re-ceptor, progesterone receptor, p53, HER2, and S6-kinaseexpression/amplification in breast cancer, vimentin expres-sion in kidney cancer, and cyclin E amplification/overex-pression and Ki67 labeling index in urinary bladder cancer[15–17,22,23]. To address the influence of tumor heteroge-neity on the ability to identify prognostic markers on TMAs,multiple samples from each tumor were analyzed in fourreplica TMAs in several studies [13,22,23]. In one study,samples were systematically taken from tumor center andperiphery [22]. Remarkably, all associations with prognosiswere always identified on each individual replica TMA, andthere was no noticeable difference between tumor centerand periphery. Based on these data, we assume that at leastmost associations between molecular changes and clinicalendpoints can be detected on TMAs containing just a singlespecimen per tumor, especially if the numbers of tumors in-cluded in a TMA is large.
Experimental tissue arrays
TMAs can be made from experimental tissues such as celllines [14] and xenografts [12]. Cell-line TMAs are espe-cially useful selecting optimal cell lines for subsequentfunctional analyses. For example, it is possible to screenhundreds of arrayed cell lines for amplification of a gene ofinterest. Amplified cell lines can be ordered and, for exam-ple, used to test candidate drugs for gene inhibition. Cellline arrays are manufactured from cell pellets that have beenformalin fixed and paraffin embedded. The handling andquality of cell line array spots are comparable with spotsfrom solid tissues. Figure 3 shows a hematoxylin-and-eosin–stained section of a TMA made from bladder cancercell lines.
TMAs from frozen tissues
Frozen tissues are superior to formalin-fixed tissues with re-spect to antigen and RNA preservation. Many antibodiesthat are not suitable for formalin-fixed tissues work readilyin frozen tissues. RNA-ISH on frozen tissues yields reliableresults because of optimal RNA preservation (Fig. 4). Oneapproach to manufacture frozen TMAs has been describedby Fejzo and Slamon [24]. The arraying process is basicallythe same as with paraffin arrays, except that Tissue-TekOCT compound (Miles Laboratories, Naperville, IL, USA)is used as an embedding medium instead of paraffin and thetissue must be kept frozen through the whole arraying pro-cedure.
Applications in experimental hematology
It is clear that TMA technology will have many applicationsin experimental hematology. Recently, the first Hodgkin’slymphoma TMA was constructed in our laboratory [25].Thearray contains 752 cores of 330 classic Hodgkin’s lym-
phoma samples including all histologic subtypes. To assessthe representativeness of the TMA, IHC results of Epstein-Barr virus (EBV) latent membrane protein 1 (LMP-1) werecompared between large sections of 68 Hodgkin’s lympho-mas and the corresponding tissue spots on the TMA. Theauthors found 100% concordance and concluded that TMAtechnology is fully applicable to Hodgkin’s lymphoma. Itwas shown in a subsequent analysis using IHC and FISHthat cyclin E protein expression (but not gene amplification)is highly characteristic for Reed-Sternberg cells.
In addition to tumor type-specific TMAs, multitumorTMAs consisting of samples of all different hematologicneoplasias could (and should) be made. Such a TMA wouldbe extremely valuable to understanding the similarities anddifferences in biology of the many different categories ofhematologic neoplasias. As for other tumor types, prognosisTMAs will allow determination of the impact of molecularchanges on the course of disease. Progression TMAs maybe most feasible and beneficial in hematologic pathology.For example, in leukemia patients, pretreatment and post-treatment tissue samples often are available for analysis. ATMA containing samples of hundreds of leukemia tissuesbefore and after therapy would greatly facilitate studies in-vestigating mechanisms of drug resistance. Because frozentissues often are available from lymphomas, these tumortypes would be highly suited for investigations on frozentissue TMAs [24].
Limitations and pitfalls
The most obvious potential limitation of TMA technologyis the small size of arrayed samples. The associated dangeris that focal alterations cannot be detected in heterogeneoustumors. Several studies compared results obtained fromTMA analysis with results from the corresponding conven-tional large sections [22,26–29]. It was demonstrated thatthe representativeness of TMA is generally good and that itcan be further enhanced if multiple tissue punches of everysample are included. For example, Hoos et al. [26] reportedmore than 90% concordance of IHC results for p53, pRB,and Ki67 if three tissue cores were arrayed from each of the59 samples included in the study. In a similar study analyz-ing estrogen receptor, progesterone receptor, and p53 ex-pression in 553 breast cancers, we found greater than con-cordance between TMA and large sections for estrogenreceptor and 88% concordance for progesterone receptorexpression even if only a single tissue spot per sample wasanalyzed [22]. However, it must be kept in mind that largesections represent only a very small fraction of the wholetumor. The question of whether TMA data can reproducelarge-section analyses is much less important than whetherclinicopathologic associations can be reproduced or newlydetected on TMAs. In fact, all previous TMA studies couldfully reproduce the known associations between molecularalterations and tumor phenotype or clinical endpoints [7,11–

1370
R. Simon and G. Sauter/Experimental Hematology 30 (2002) 1365–1372
23,30–32]. In the study mentioned earlier we found a prog-nostic significance of nuclear p53 protein accumulation onTMAs but not on the corresponding large sections [22]. Inan attempt to explain this result, we reanalyzed the data bydividing the tumors into groups with discordant or concor-dant results between the TMA and the large sections. Re-markably, tumors that were positive only on large sectionsand not on TMAs had an identical prognosis as tumors thatwere considered negative on both TMAs and large sections.It showed that focal p53 staining on large sections had beeninterpreted as “p53 positive” but that these small areas werenot relevant for prognosis. This example demonstrates thatthe conceptual disadvantage of tissue analysis limited to onesmall tumor area is at least partly compensated by thegreater objectivity of analysis. In TMAs, the predefinedscoring criteria (e.g., fraction of cells showing staining andthe intensity of the staining) are applied to a defined tissuearea while the scoring criteria are applied to an arbitrarilyselected tumor region in large-section analyses.
Several tumor entities are sufficiently heterogeneous toimpact data obtained on TMAs, such as dedifferentiatedchondrosarcoma and some follicular lymphomas. In suchtumors, randomly taken TMA samples are not always repre-sentative. Nevertheless, if 100 follicular lymphomas are an-alyzed on TMA, the analysis will reveal whether or not anewly detected genetic alteration occurs in follicular lym-phomas. However, the true incidence of alterations will behigher than that found in a TMA setting for such tumors.Hodgkin’s lymphoma often has been named as an exampleof a tumor that is not suited for TMA analysis; however,Hodgkin’s lymphoma can be analyzed in a TMA format.Our multitumor TMA contains about 80 Hodgkin’s lym-phomas, and in about 60% of these cases unequivocalHodgkin or Reed-Sternberg cells can be found on TMA sec-tions (Fig. 5). This TMA provides valid information onwhether or not genes of interest can be expressed inHodgkin’s lymphoma.
The unprecedented standardization of all in situ methodsis another potential “pitfall” of TMA analyses. In TMAprojects, all tissues involved in a study typically are placed onone glass slide. This procedure assures absolute standardiza-tion of parameters such as section thickness, slide age, tem-perature and composition of all reagents, and incubation time;therefore, TMA studies are not subjected to intra-assay varia-tions. However, it is not unusual for results of a TMA studyto be different if an experiment is repeated under “identical”conditions. These interassay variations between experimentshighlight an inherent weakness of immunohistochemistrywhere minor changes of experimental conditions can have arecognizable influence on the outcome of experiments. It is ofcrucial importance to make every possible effort to optimizeall conditions before a TMA experiment is performed. To setup the optimal experimental conditions, we typically usesmall test TMAs containing a number of normal tissues, aswell as a small selection of tumors.
As in large-section studies, tissue quality can affect theoutcome of analyses. Despite the possibility of testing thereactivity of tissues with antibodies against ubiquitous pro-teins such as cytokeratins, it often is difficult to discern truenegative IHC results from lack of staining due to inappro-priate sample preparation conditions. We assume that allour TMAs contain a fraction of nonreactive tissues. Becauseit is likely that these cases are equally distributed among allgroups of tumors, we anticipate that this problem will notaffect the outcome of statistical analyses if sufficiently largeTMAs are analyzed. In contrast to IHC, false-negative re-sults cannot occur in FISH analyses if a centromeric probeis included as an internal reference. Tissue spots that cannotbe analyzed can be easily identified and excluded becauseof the total lack of FISH signals.
Future directions
TMA technology has become a widely accepted standardtechnology. In addition to its applications in disease re-search, TMAs will be highly instrumental for all areas ofantibody evaluation, such as screening phage display single-chain antibodies or monoclonal antibodies against noveltherapeutic targets, or screening antibodies directed againstdifferent epitopes of the same antigen. To optimize the tech-nology for high-throughput applications, several groups areattempting to automate the technology. Manufacturing ofTMAs is one area where automation can be applied. How-ever, the availability of automated tissue arrayers will notsignificantly improve the availability of TMAs because au-tomated arrayers will only improve the speed of a relativelysmall fraction (5%) of the entire TMA-making process.
Much more promising is the possibility of automatedTMA analysis. Because one technician can manually stain upto 200,000 tissues per week (1000 tissue spots per slide
�
50 slides per day
�
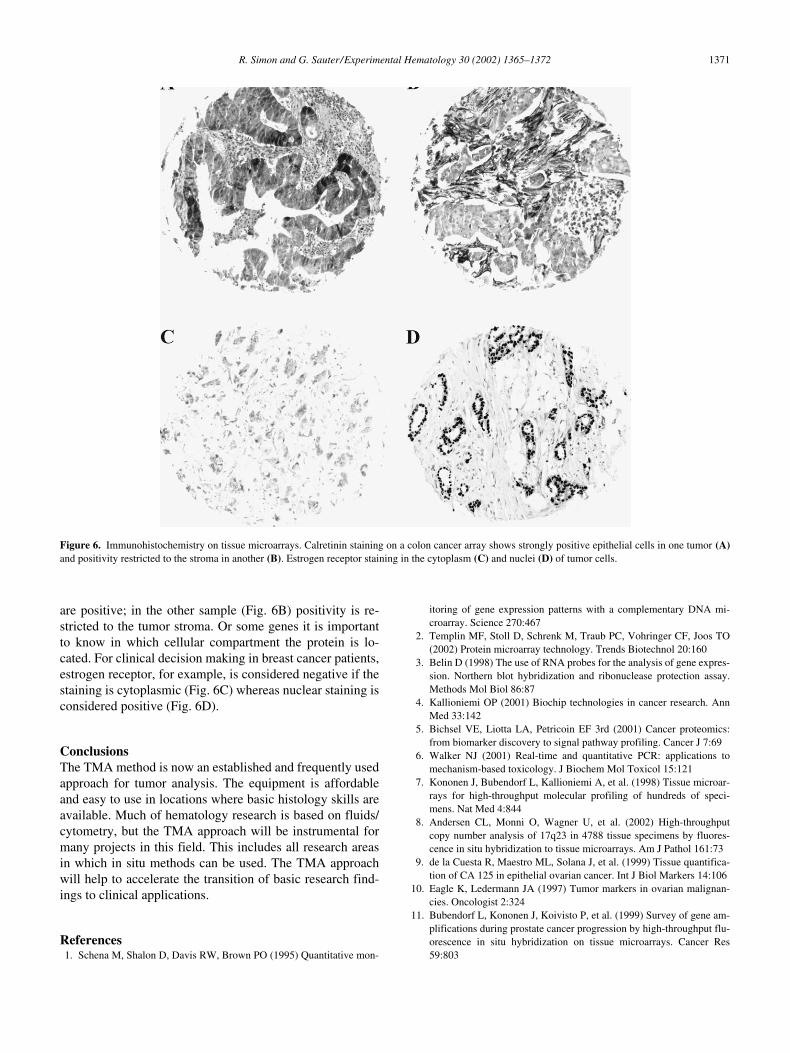
4 days per week), reading of TMAslides has become the major bottleneck in the system. Inprinciple, TMAs are optimally suited for automated IHCanalysis. The most critical step for automation of IHC anal-ysis is selection of the area to be analyzed. This selectionhas already taken place in TMAs. It is expected that systemssoon will become available that will automatically scanTMA slides and measure the intensity of staining for eachindividual TMA spot. In our study using the ChromaVision(San Juan Capistrano, CA, USA) system, we comparedmanual versus automated analysis of HER2 staining on abreast cancer TMA and found a 92.1% concordance [21].Once automated analysis can be performed, it is possible tolink these data to other databases containing molecular, pa-thology, or clinical data. The major limitation of automatedIHC analysis will be that some of the genes of interest canbe expressed in more than one cell type and in different cel-lular compartments. Figure 6 shows examples of colon can-cer stained with an antibody against the calcium-bindingprotein calretinin. In one sample (Fig. 6A) the tumor cells
R. Simon and G. Sauter/Experimental Hematology 30 (2002) 1365–1372
1371
are positive; in the other sample (Fig. 6B) positivity is re-stricted to the tumor stroma. Or some genes it is importantto know in which cellular compartment the protein is lo-cated. For clinical decision making in breast cancer patients,estrogen receptor, for example, is considered negative if thestaining is cytoplasmic (Fig. 6C) whereas nuclear staining isconsidered positive (Fig. 6D).
Conclusions
The TMA method is now an established and frequently usedapproach for tumor analysis. The equipment is affordableand easy to use in locations where basic histology skills areavailable. Much of hematology research is based on fluids/cytometry, but the TMA approach will be instrumental formany projects in this field. This includes all research areasin which in situ methods can be used. The TMA approachwill help to accelerate the transition of basic research find-ings to clinical applications.
References
1. Schena M, Shalon D, Davis RW, Brown PO (1995) Quantitative mon-
itoring of gene expression patterns with a complementary DNA mi-croarray. Science 270:467
2. Templin MF, Stoll D, Schrenk M, Traub PC, Vohringer CF, Joos TO(2002) Protein microarray technology. Trends Biotechnol 20:160
3. Belin D (1998) The use of RNA probes for the analysis of gene expres-sion. Northern blot hybridization and ribonuclease protection assay.Methods Mol Biol 86:87
4. Kallioniemi OP (2001) Biochip technologies in cancer research. AnnMed 33:142
5. Bichsel VE, Liotta LA, Petricoin EF 3rd (2001) Cancer proteomics:from biomarker discovery to signal pathway profiling. Cancer J 7:69
6. Walker NJ (2001) Real-time and quantitative PCR: applications tomechanism-based toxicology. J Biochem Mol Toxicol 15:121
7. Kononen J, Bubendorf L, Kallioniemi A, et al. (1998) Tissue microar-rays for high-throughput molecular profiling of hundreds of speci-mens. Nat Med 4:844
8. Andersen CL, Monni O, Wagner U, et al. (2002) High-throughputcopy number analysis of 17q23 in 4788 tissue specimens by fluores-cence in situ hybridization to tissue microarrays. Am J Pathol 161:73
9. de la Cuesta R, Maestro ML, Solana J, et al. (1999) Tissue quantifica-tion of CA 125 in epithelial ovarian cancer. Int J Biol Markers 14:106
10. Eagle K, Ledermann JA (1997) Tumor markers in ovarian malignan-cies. Oncologist 2:324
11. Bubendorf L, Kononen J, Koivisto P, et al. (1999) Survey of gene am-plifications during prostate cancer progression by high-throughput flu-orescence in situ hybridization on tissue microarrays. Cancer Res59:803
Figure 6. Immunohistochemistry on tissue microarrays. Calretinin staining on a colon cancer array shows strongly positive epithelial cells in one tumor (A)and positivity restricted to the stroma in another (B). Estrogen receptor staining in the cytoplasm (C) and nuclei (D) of tumor cells.
1372
R. Simon and G. Sauter/Experimental Hematology 30 (2002) 1365–1372
12. Bubendorf L, Kolmer M, Kononen J, et al. (1999) Hormone therapyfailure in human prostate cancer: analysis by complementary DNA andtissue microarrays. J Natl Cancer Inst 91:1758
13. Simon R, Nocito A, Hubscher T, et al. (2001) Patterns of her-2/neuamplification and overexpression in primary and metastatic breast can-cer. J Natl Cancer Inst 93:1141
14. Simon R, Struckmann K, Schraml P, et al. (2002) Amplification pat-tern of 12q13-q15 genes (MDM2, CDK4, GLI) in urinary bladder can-cer. Oncogene 21:2476
15. Moch H, Schraml P, Bubendorf L, et al. (1999) High-throughput tissuemicroarray analysis to evaluate genes uncovered by cDNA microarrayscreening in renal cell carcinoma. Am J Pathol 154:981
16. Barlund M, Forozan F, Kononen J, et al. (2000) Detecting activation ofribosomal protein S6 kinase by complementary DNA and tissue mi-croarray analysis. J Natl Cancer Inst 92:1252
17. Richter J, Wagner U, Kononen J, et al. (2000) High-throughput tissuemicroarray analysis of cyclin E gene amplification and overexpressionin urinary bladder cancer. Am J Pathol 157:787
18. Simon R, Richter J, Wagner U, et al. (2001) High-throughput tissuemicroarray analysis of 3p25 (raf1) and 8p12 (fgfr1) copy number alter-ations in urinary bladder cancer. Cancer Res 61:4514
19. Barlund M, Monni O, Kononen J, et al. (2000) Multiple genes at17q23 undergo amplification and overexpression in breast cancer.Cancer Res 60:5340
20. Kallioniemi OP, Wagner U, Kononen J, Sauter G (2001) Tissue mi-croarray technology for high-throughput molecular profiling of cancer.Hum Mol Genet 10:657
21. Bucher C, Torhorst J, Kononen J, et al. (2000) Automated, high-throughput tissue microarray analysis for assessing the significance ofHER-2 involvement in breast cancer. Proceedings of the ASCO annualmeeting, New Orleans, LA, abstract 2388 (abstr)
22. Torhorst J, Bucher C, Kononen J, et al. (2001) Tissue microarrays for
rapid linking of molecular changes to clinical endpoints. Am J Pathol159:2249
23. Nocito A, Bubendorf L, Maria Tinner E, et al. (2001) Microarrays ofbladder cancer tissue are highly representative of proliferation indexand histological grade. J Pathol 194:349
24. Fejzo MS, Slamon DJ (2001) Frozen tumor tissue microarray technol-ogy for analysis of tumor RNA, DNA, and proteins. Am J Pathol159:1645
25. Tzankov A, Zimpfer A, Lugli A, et al. (2002) High-throughput tissuemicroarray analysis of g1-cyclin alterations in classical Hodgkin’s lym-phoma indicates overexpression of cyclin E1. J Pathol (in press)
26. Hoos A, Urist MJ, Stojadinovic A, et al. (2001) Validation of tissue mi-croarrays for immunohistochemical profiling of cancer specimens usingthe example of human fibroblastic tumors. Am J Pathol 158:1245
27. Sallinen SL, Sallinen PK, Haapasalo HK, et al. (2000) Identification ofdifferentially expressed genes in human gliomas by DNA microarrayand tissue chip techniques. Cancer Res 60:6617
28. Camp RL, Charette LA, Rimm DL (2000) Validation of tissue mi-croarray technology in breast carcinoma. Lab Invest 80:1943
29. Mucci NR, Akdas G, Manely S, Rubin MA (2000) Neuroendocrineexpression in metastatic prostate cancer: evaluation of high throughputtissue microarrays to detect heterogeneous protein expression. HumPathol 31:406
30. Schraml P, Kononen J, Bubendorf L, et al. (1999) Tissue microarraysfor gene amplification surveys in many different tumor types. ClinCancer Res 5:1966
31. Rubin MA, Mucci NR, Figurski J, Fecko A, Pienta KJ, Day ML(2001) E-cadherin expression in prostate cancer: a broad survey usinghigh-density tissue microarray technology. Hum Pathol 32:690
32. Rubin MA, Dunn R, Strawderman M, Pienta KJ (2002) Tissue mi-croarray sampling strategy for prostate cancer biomarker analysis. AmJ Surg Pathol 26:312