TIRCP Quantification Methodology and Calculator …...Webinar Outline 1. Background on...
33
TIRCP Quantification Methodology and Calculator Tool Training Webinar November 22, 2019
Transcript of TIRCP Quantification Methodology and Calculator …...Webinar Outline 1. Background on...

TIRCP Quantification Methodology and Calculator Tool
Training Webinar
November 22, 2019
Webinar Outline
1. Background on Quantification Methodology (QM) and Benefits Calculator Tool
2. QM and Calculator Tool Basics
3. Changes to the QM and Calculator Tool
4. Calculator Tool Demo
5. Q&A
2
3
1. Background on QM and Benefits Calculator Tool
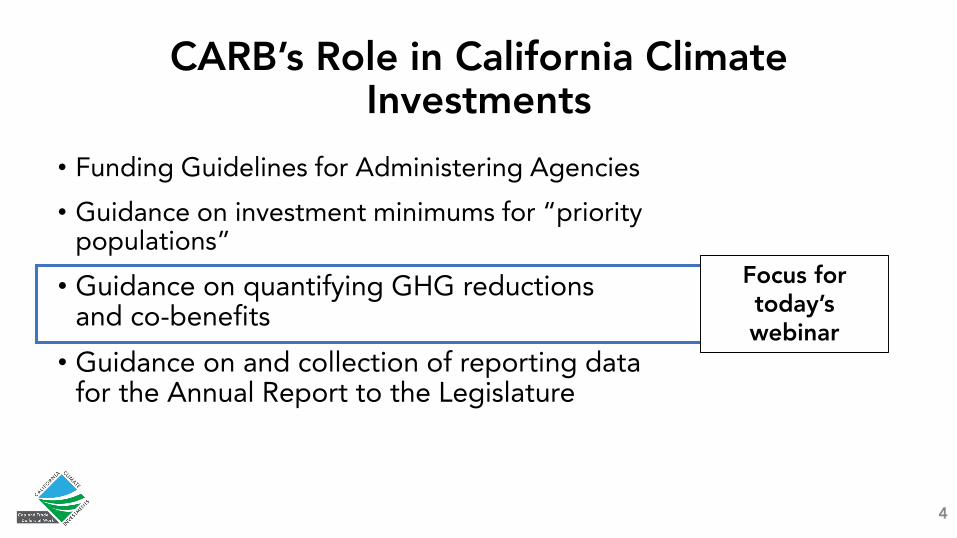
CARB’s Role in California Climate Investments
• Funding Guidelines for Administering Agencies
• Guidance on investment minimums for “priority populations”
• Guidance on quantifying GHG reductions and co-benefits
Focus for today’s webinar
• Guidance on and collection of reporting data for the Annual Report to the Legislature
4
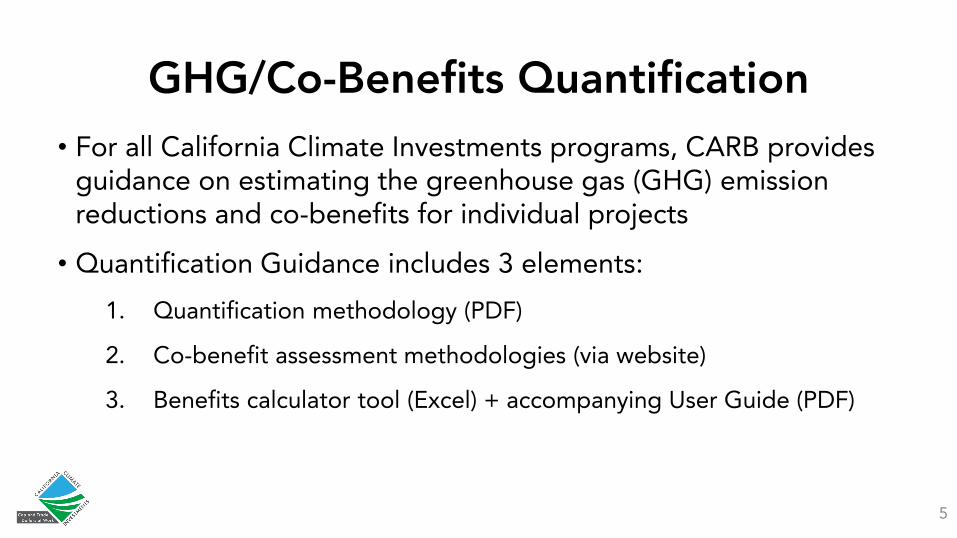
GHG/Co-Benefits Quantification• For all California Climate Investments programs, CARB provides
guidance on estimating the greenhouse gas (GHG) emission reductions and co-benefits for individual projects
• Quantification Guidance includes 3 elements:
1. Quantification methodology (PDF)
2. Co-benefit assessment methodologies (via website)
3. Benefits calculator tool (Excel) + accompanying User Guide (PDF)
5
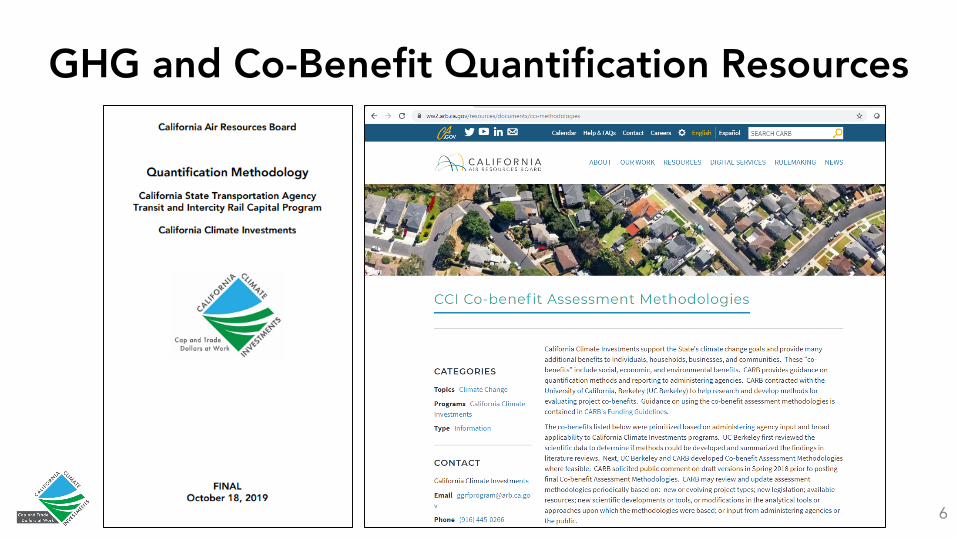
GHG and Co-Benefit Quantification Resources
6
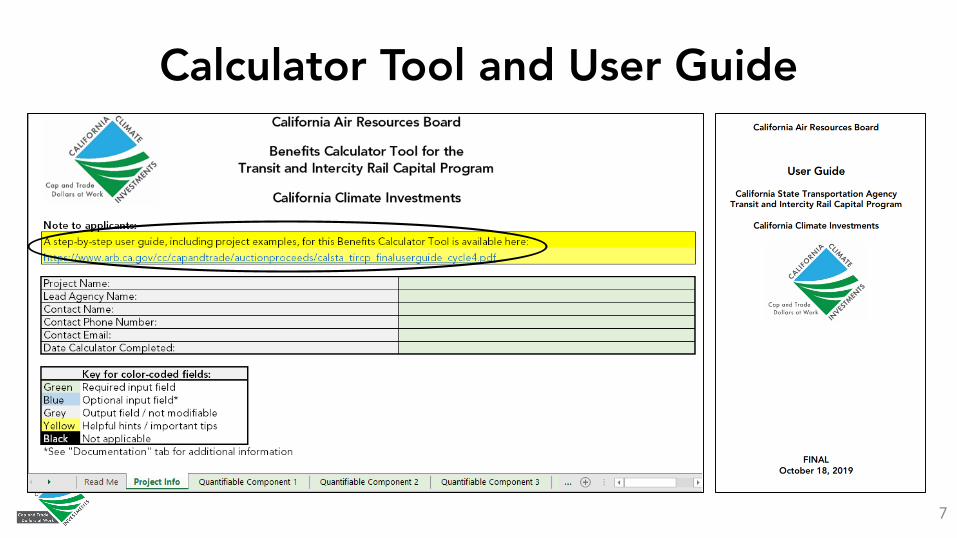
Calculator Tool and User Guide
7
8
2. QM and Calculator Tool Basics

How Project Subcomponents and Components Combine to Create a Project
9
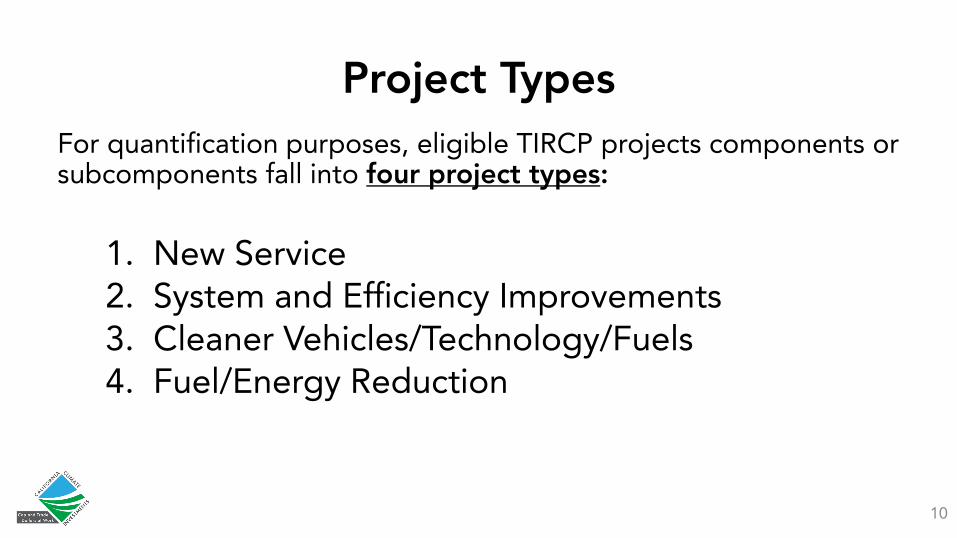
Project TypesFor quantification purposes, eligible TIRCP projects components or subcomponents fall into four project types:
1. New Service2. System and Efficiency Improvements3. Cleaner Vehicles/Technology/Fuels4. Fuel/Energy Reduction
10
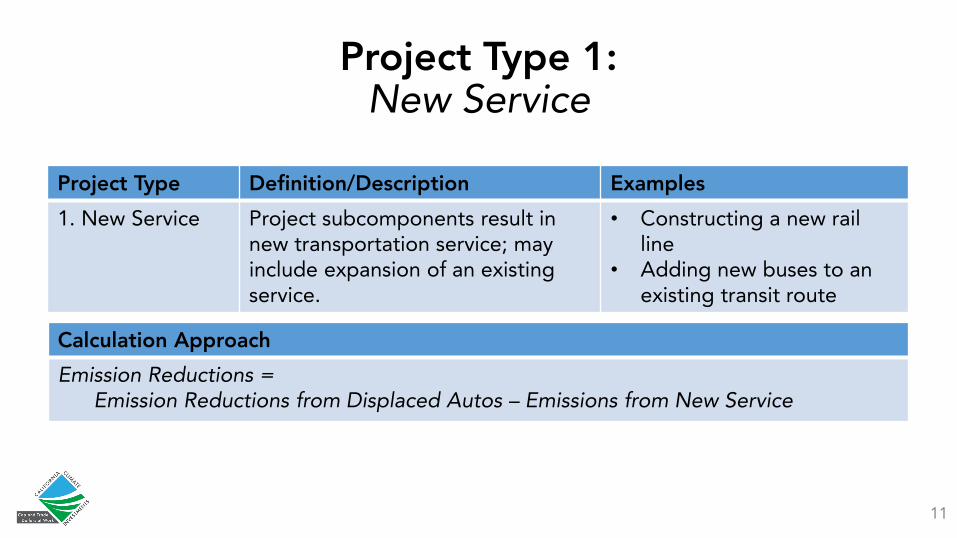
Project Type 1: New Service
11
Project Type
1. New Service
Definition/Description
Project subcomponents result in new transportation service; may include expansion of an existing service.
Examples
• Constructing a new railline
• Adding new buses to anexisting transit route
Calculation Approach
Emission Reductions =Emission Reductions from Displaced Autos – Emissions from New Service
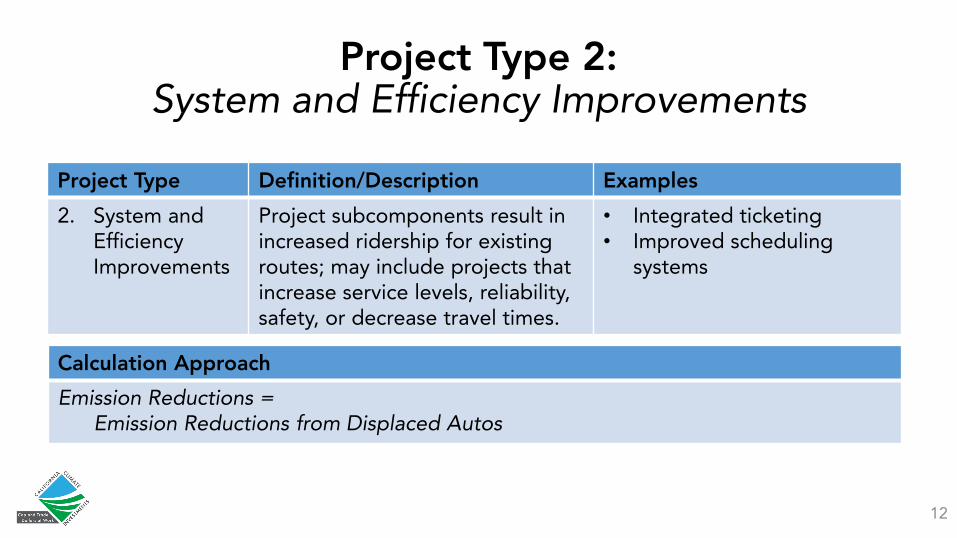
Project Type 2: System and Efficiency Improvements
12
Project Type
2. System and Efficiency Improvements
Definition/Description
Project subcomponents result in increased ridership for existing routes; may include projects that increase service levels, reliability, safety, or decrease travel times.
Examples
• Integrated ticketing• Improved scheduling
systems
Calculation Approach
Emission Reductions = Emission Reductions from Displaced Autos
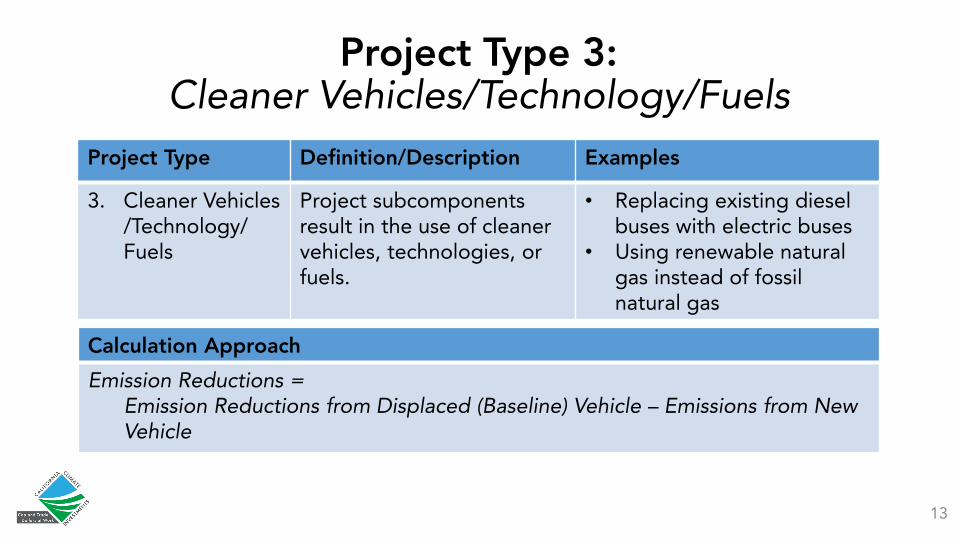
Project Type 3: Cleaner Vehicles/Technology/Fuels
13
Project Type
3. Cleaner Vehicles /Technology/ Fuels
Definition/Description
Project subcomponents result in the use of cleaner vehicles, technologies, or fuels.
Examples
• Replacing existing diesel buses with electric buses
• Using renewable natural gas instead of fossil natural gas
Calculation Approach
Emission Reductions = Emission Reductions from Displaced (Baseline) Vehicle – Emissions from New Vehicle
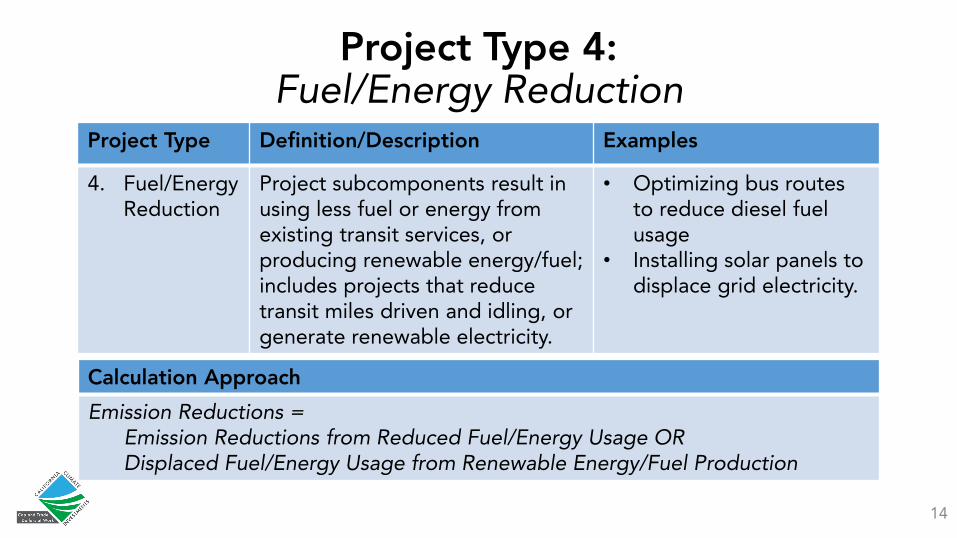
Project Type 4: Fuel/Energy Reduction
14
Project Type
4. Fuel/Energy Reduction
Definition/Description
Project subcomponents result in using less fuel or energy from existing transit services, or producing renewable energy/fuel;includes projects that reduce transit miles driven and idling, or generate renewable electricity.
Examples
• Optimizing bus routes to reduce diesel fuel usage
• Installing solar panels to displace grid electricity.
Calculation Approach
Emission Reductions = Emission Reductions from Reduced Fuel/Energy Usage OR Displaced Fuel/Energy Usage from Renewable Energy/Fuel Production
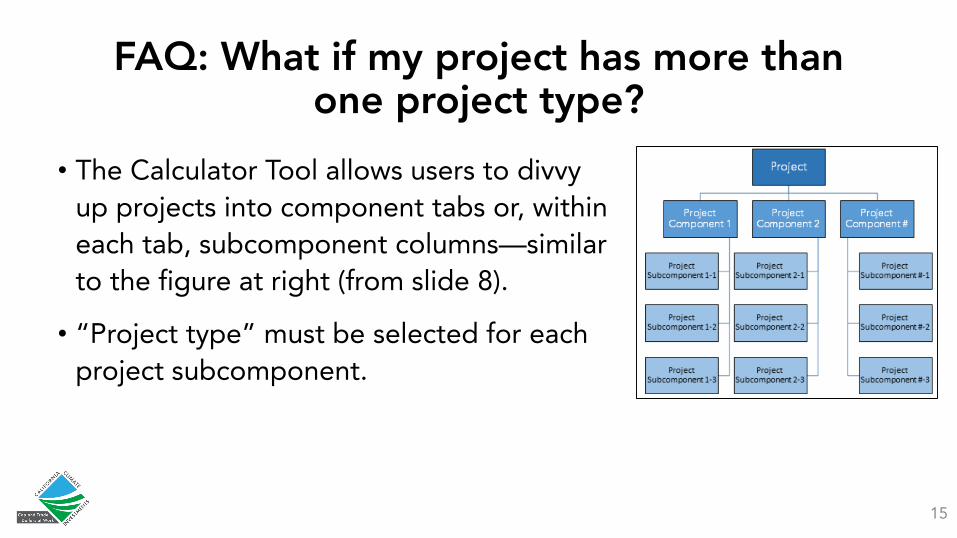
FAQ: What if my project has more than one project type?
• The Calculator Tool allows users to divvy up projects into component tabs or, within each tab, subcomponent columns—similar to the figure at right (from slide 8).
• “Project type” must be selected for each project subcomponent.
15
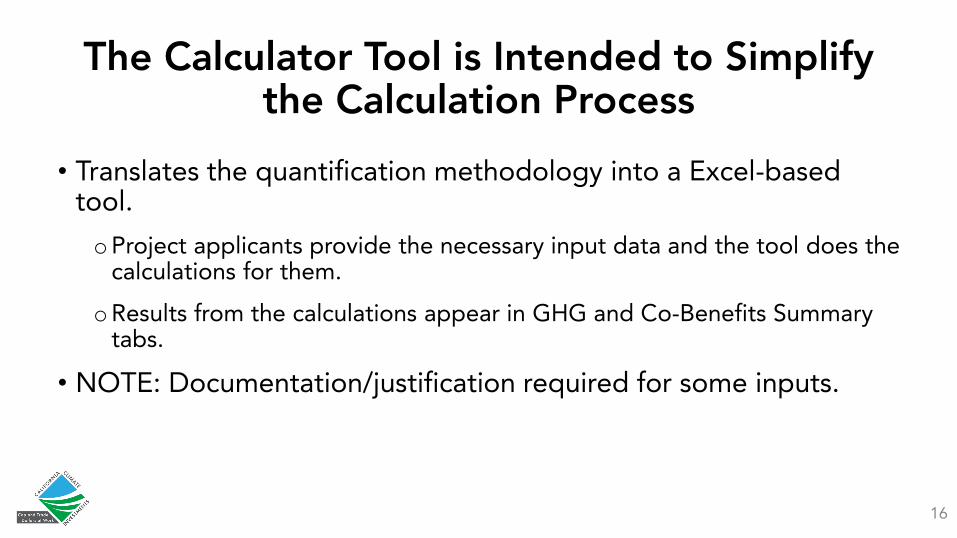
The Calculator Tool is Intended to Simplify the Calculation Process
• Translates the quantification methodology into a Excel-based tool.
oProject applicants provide the necessary input data and the tool does the calculations for them.
oResults from the calculations appear in GHG and Co-Benefits Summary tabs.
• NOTE: Documentation/justification required for some inputs.
16
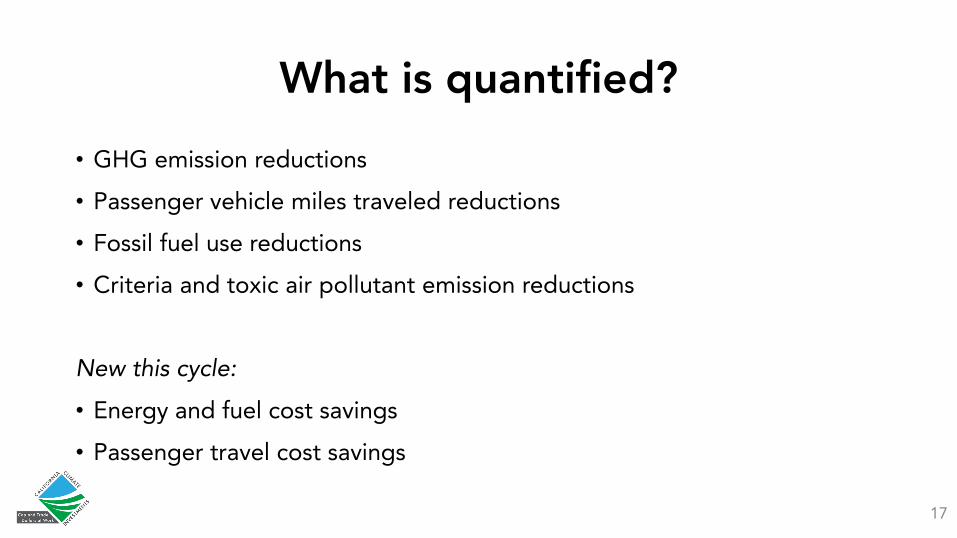
What is quantified?
• GHG emission reductions
• Passenger vehicle miles traveled reductions
• Fossil fuel use reductions
• Criteria and toxic air pollutant emission reductions
New this cycle:
• Energy and fuel cost savings
• Passenger travel cost savings
17
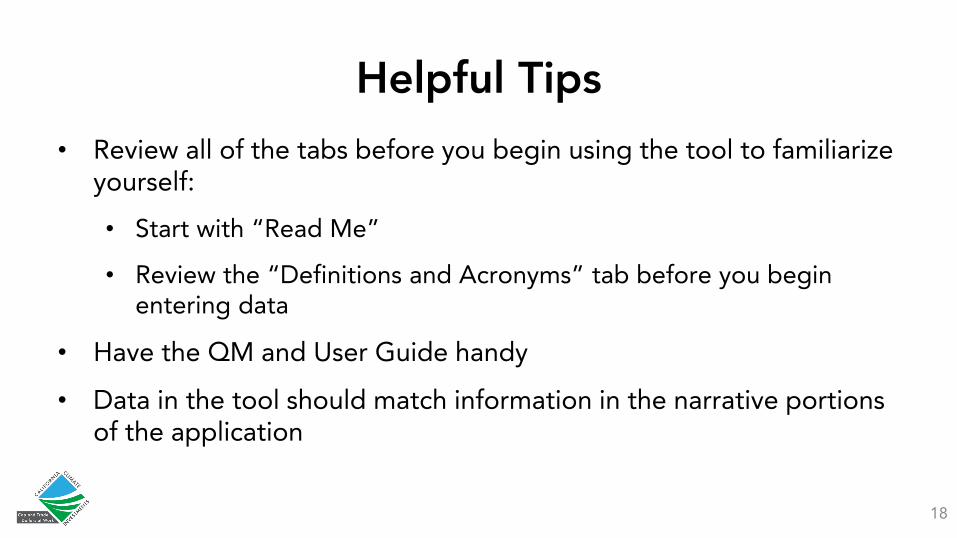
Helpful Tips
18
• Review all of the tabs before you begin using the tool to familiarize yourself:
• Start with “Read Me”
• Review the “Definitions and Acronyms” tab before you begin entering data
• Have the QM and User Guide handy
• Data in the tool should match information in the narrative portions of the application

3. Changes to the QM and Calculator Tool
19
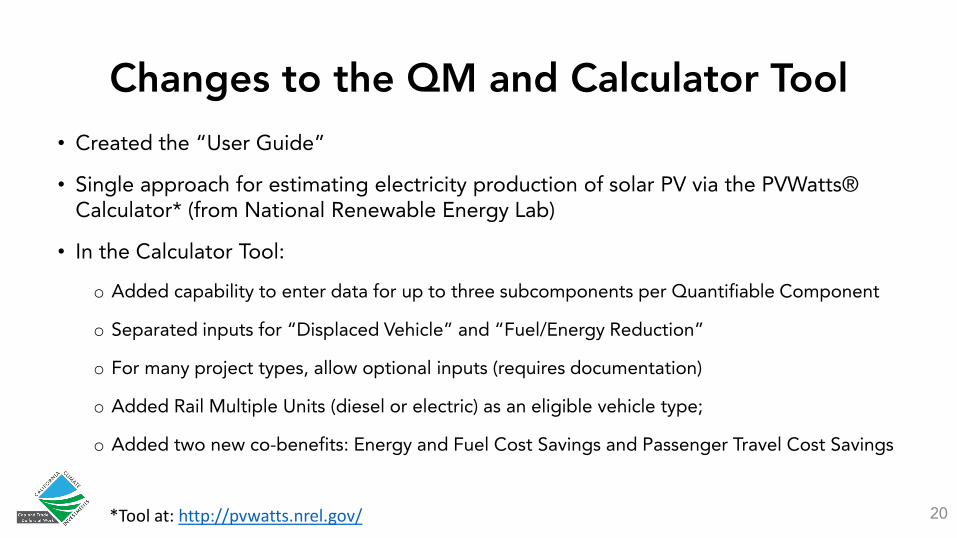
Changes to the QM and Calculator Tool• Created the “User Guide”
• Single approach for estimating electricity production of solar PV via the PVWatts® Calculator* (from National Renewable Energy Lab)
• In the Calculator Tool:
o Added capability to enter data for up to three subcomponents per Quantifiable Component
o Separated inputs for “Displaced Vehicle” and “Fuel/Energy Reduction”
o For many project types, allow optional inputs (requires documentation)
o Added Rail Multiple Units (diesel or electric) as an eligible vehicle type;
o Added two new co-benefits: Energy and Fuel Cost Savings and Passenger Travel Cost Savings
20*Tool at: http://pvwatts.nrel.gov/
21
4. Calculator Tool Demo

Note to applicants:
A step-by-step user guide, including project examples, for this Benefits Calculator Tool is available here:
https://www.arb.ca.gov/cc/capandtrade/auctionproceeds/calsta_tircp_finaluserguide_cycle4.pdf
Project Name: Expanded Commuter Services Lead Agency Name: Miscellaneous Transit Agency Contact Name: John Smith Contact Phone Number: 916-123-4567 Contact Email: [email protected] Date Calculator Completed: 11/22/2019
Key for color-coded fields: Green Required input field Blue Optional input field* Grey Output field / not modifiable Yellow Helpful hints / important tips Black Not applicable *See "Documentation" tab for additional information
FINAL October 18, 2019 1 of 1 Project Info
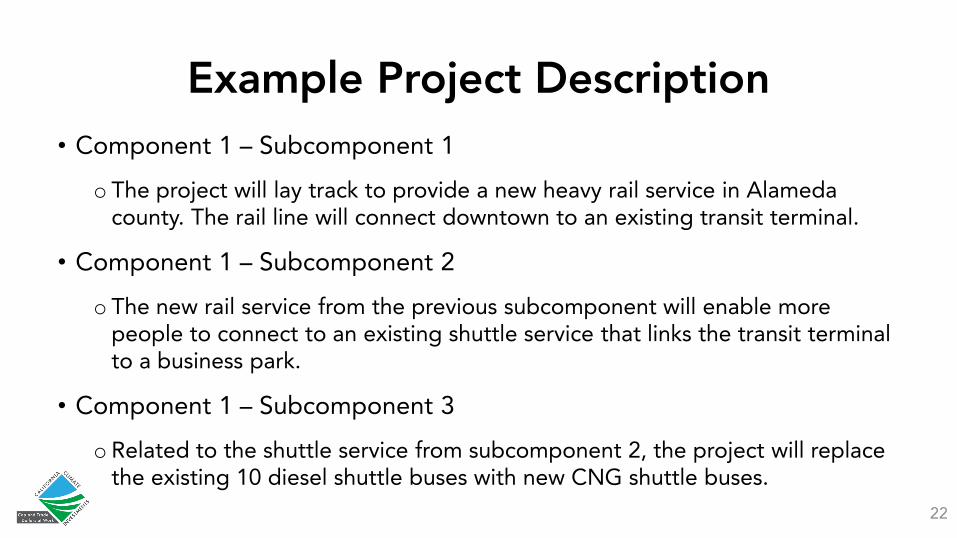
Example Project Description• Component 1 – Subcomponent 1
o The project will lay track to provide a new heavy rail service in Alamedacounty. The rail line will connect downtown to an existing transit terminal.
• Component 1 – Subcomponent 2
o The new rail service from the previous subcomponent will enable morepeople to connect to an existing shuttle service that links the transit terminalto a business park.
• Component 1 – Subcomponent 3
o Related to the shuttle service from subcomponent 2, the project will replacethe existing 10 diesel shuttle buses with new CNG shuttle buses.
22
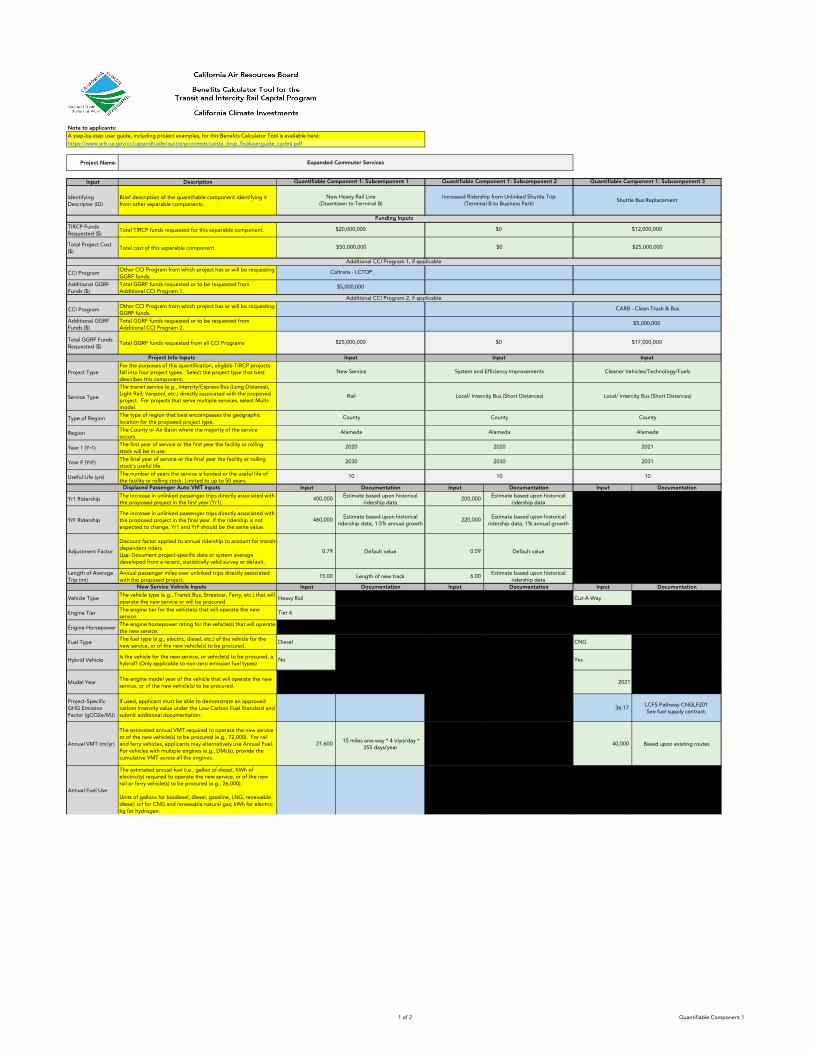
Input Description Quantifiable Component 1: Subcomponent 1
New Heavy Rail Line (Downtown to Terminal B)
Funding Inputs
$20,000,000
Quantifiable Component 1: Subcomponent 2 Quantifiable Component 1: Subcomponent 3
Identifying Descriptor (ID)
Brief description of the quantifiable component identifying it from other separable components.
Increased Ridership from Unlinked Shuttle Trip (Terminal B to Business Park)
Shuttle Bus Replacement
$0 $12,000,000 TIRCP Funds Requested ($)
Total TIRCP funds requested for this separable component.
Total Project Cost ($)
Total cost of this separable component. $50,000,000 $0 $25,000,000
Additional CCI Program 1, if applicable
CCI Program Other CCI Program from which project has or will be requesting GGRF funds.
Caltrans - LCTOP
Additional GGRF Funds ($)
Total GGRF funds requested or to be requested from Additional CCI Program 1.
$5,000,000
Additional CCI Program 2, if applicable
CCI Program Other CCI Program from which project has or will be requesting GGRF funds.
CARB - Clean Truck & Bus
Additional GGRF Funds ($)
Total GGRF funds requested or to be requested from Additional CCI Program 2.
$5,000,000
Total GGRF Funds Requested ($)
Total GGRF funds requested from all CCI Programs $25,000,000 $0 $17,000,000
Project Info Inputs Input Input Input
Project Type For the purposes of this quantification, eligible TIRCP projects fall into four project types. Select the project type that best describes this component.
New Service System and Efficiency Improvements Cleaner Vehicles/Technology/Fuels
Service Type
The transit service (e.g., Intercity/Express Bus (Long Distance), Light Rail, Vanpool, etc.) directly associated with the proposed project. For projects that serve multiple services, select Multi-modal.
Rail Local/ Intercity Bus (Short Distances) Local/ Intercity Bus (Short Distances)
Type of Region The type of region that best encompasses the geographic location for the proposed project type.
County County County
Region The County or Air Basin where the majority of the service occurs.
Alameda Alameda Alameda
Year 1 (Yr1) The first year of service or the first year the facility or rolling stock will be in use.
2020 2020 2021
Year F (YrF) The final year of service or the final year the facility or rolling stock's useful life.
2030 2030 2031
Useful Life (yrs) The number of years the service is funded or the useful life of the facility or rolling stock. Limited to up to 50 years.
10 10 10
Displaced Passenger Auto VMT Inputs Input Documentation Input Documentation Input Documentation
Yr1 Ridership The increase in unlinked passenger trips directly associated with the proposed project in the first year (Yr1).
400,000 Estimate based upon historical ridership data
200,000 Estimate based upon historical ridership data
YrF Ridership The increase in unlinked passenger trips directly associated with the proposed project in the final year. If the ridership is not expected to change, Yr1 and YrF should be the same value.
460,000 Estimate based upon historical ridership data, 1.5% annual growth
220,000 Estimate based upon historical ridership data, 1% annual growth
Adjustment Factor
Discount factor applied to annual ridership to account for transit-dependent riders. Use: Document project-specific data or system average developed from a recent, statistically valid survey or default.
0.79 Default value 0.59 Default value
Length of Average Trip (mi)
Annual passenger miles over unlinked trips directly associated with the proposed project.
15.00 Length of new track 6.00 Estimate based upon historical ridership data
New Service Vehicle Inputs Input Documentation Input Documentation Input Documentation
Vehicle Type The vehicle type (e.g., Transit Bus, Streetcar, Ferry, etc.) that will operate the new service or will be procured.
Heavy Rail Cut-A-Way
Engine Tier The engine tier for the vehicle(s) that will operate the new service.
Tier 4
Engine Horsepower The engine horsepower rating for the vehicle(s) that will operate the new service.
Fuel Type The fuel type (e.g., electric, diesel, etc.) of the vehicle for the new service, or of the new vehicle(s) to be procured.
Diesel CNG
Hybrid Vehicle Is the vehicle for the new service, or vehicle(s) to be procured, a hybrid? (Only applicable to non-zero emission fuel types)
No Yes
Model Year The engine model year of the vehicle that will operate the new service, or of the new vehicle(s) to be procured.
2021
Project-Specific GHG Emission Factor (gCO2e/MJ)
If used, applicant must be able to demonstrate an approved carbon intensity value under the Low Carbon Fuel Standard and submit additional documentation.
36.17 LCFS Pathway CNGLF201 See fuel supply contract.
Annual VMT (mi/yr)
The estimated annual VMT required to operate the new service or of the new vehicle(s) to be procured (e.g., 72,000). For rail and ferry vehicles, applicants may alternatively use Annual Fuel. For vehicles with multiple engines (e.g., DMUs), provide the cumulative VMT across all the engines.
21,600 15 miles one-way * 4 trips/day * 355 days/year
40,000 Based upon existing routes
Annual Fuel Use
The estimated annual fuel (i.e., gallon of diesel, KWh of electricity) required to operate the new service, or of the new rail or ferry vehicle(s) to be procured (e.g., 26,000).
Units of gallons for biodiesel, diesel, gasoline, LNG, renewable diesel; scf for CNG and renewable natural gas; kWh for electric; kg for hydrogen.
Note to applicants:
Project Name: Expanded Commuter Services
A step-by-step user guide, including project examples, for this Benefits Calculator Tool is available here: https://www.arb.ca.gov/cc/capandtrade/auctionproceeds/calsta_tircp_finaluserguide_cycle4.pdf
1 of 2 Quantifiable Component 1
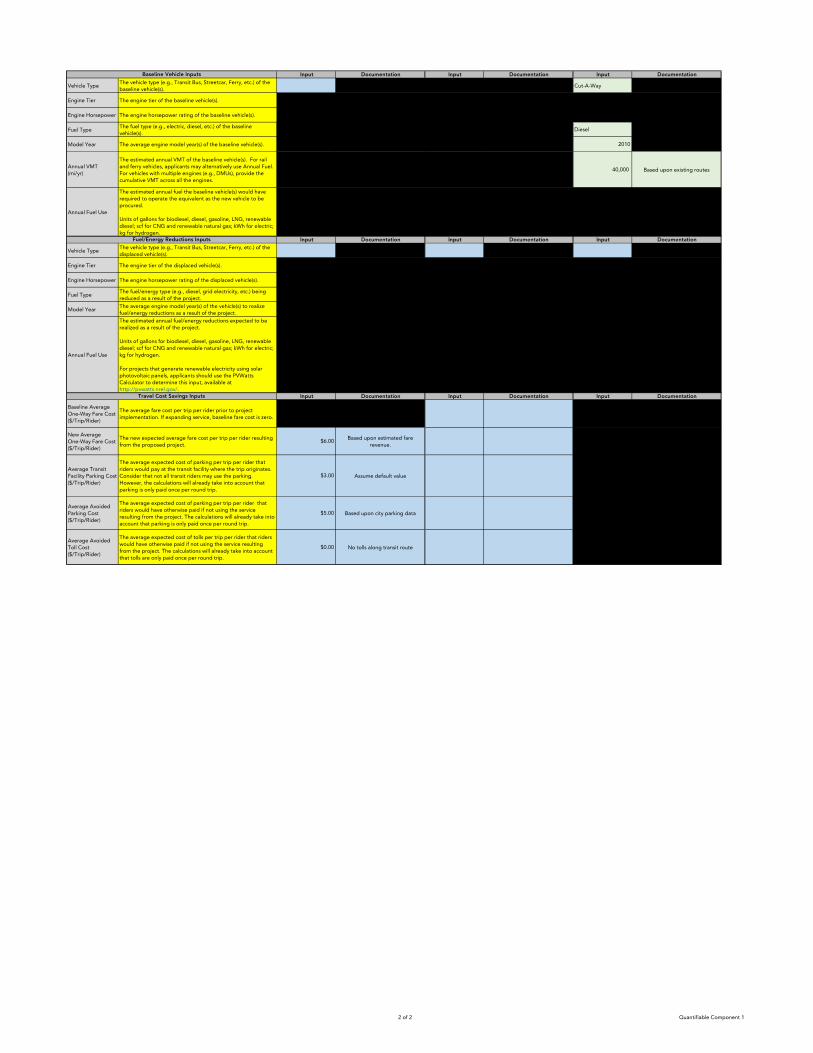
Baseline Vehicle Inputs Input Documentation Input Documentation Input
Cut-A-Way
Documentation
Vehicle Type The vehicle type (e.g., Transit Bus, Streetcar, Ferry, etc.) of the baseline vehicle(s).
Engine Tier The engine tier of the baseline vehicle(s).
Engine Horsepower The engine horsepower rating of the baseline vehicle(s).
Fuel Type The fuel type (e.g., electric, diesel, etc.) of the baseline vehicle(s).
Diesel
Model Year The average engine model year(s) of the baseline vehicle(s). 2010
Annual VMT (mi/yr)
The estimated annual VMT of the baseline vehicle(s). For rail and ferry vehicles, applicants may alternatively use Annual Fuel. For vehicles with multiple engines (e.g., DMUs), provide the cumulative VMT across all the engines.
40,000 Based upon existing routes
Annual Fuel Use
Vehicle Type
The estimated annual fuel the baseline vehicle(s) would have required to operate the equivalent as the new vehicle to be procured.
Units of gallons for biodiesel, diesel, gasoline, LNG, renewable diesel; scf for CNG and renewable natural gas; kWh for electric; kg for hydrogen.
Fuel/Energy Reductions Inputs Input Documentation Input Documentation Input Documentation The vehicle type (e.g., Transit Bus, Streetcar, Ferry, etc.) of the displaced vehicle(s).
Engine Tier The engine tier of the displaced vehicle(s).
Engine Horsepower The engine horsepower rating of the displaced vehicle(s).
Fuel Type The fuel/energy type (e.g., diesel, grid electricity, etc.) being reduced as a result of the project.
Model Year The average engine model year(s) of the vehicle(s) to realize fuel/energy reductions as a result of the project.
Annual Fuel Use
The estimated annual fuel/energy reductions expected to be realized as a result of the project.
Units of gallons for biodiesel, diesel, gasoline, LNG, renewable diesel; scf for CNG and renewable natural gas; kWh for electric; kg for hydrogen.
For projects that generate renewable electricity using solar photovoltaic panels, applicants should use the PVWatts Calculator to determine this input, available at http://pvwatts.nrel.gov/.
Travel Cost Savings Inputs Input Documentation Input Documentation Input Documentation
Baseline Average One-Way Fare Cost ($/Trip/Rider)
The average fare cost per trip per rider prior to project implementation. If expanding service, baseline fare cost is zero.
New Average One-Way Fare Cost ($/Trip/Rider)
The new expected average fare cost per trip per rider resulting from the proposed project.
$6.00 Based upon estimated fare revenue.
Average Transit Facility Parking Cost ($/Trip/Rider)
The average expected cost of parking per trip per rider that riders would pay at the transit facility where the trip originates. Consider that not all transit riders may use the parking. However, the calculations will already take into account that parking is only paid once per round trip.
$3.00 Assume default value
Average Avoided Parking Cost ($/Trip/Rider)
The average expected cost of parking per trip per rider that riders would have otherwise paid if not using the service resulting from the project. The calculations will already take into account that parking is only paid once per round trip.
$5.00 Based upon city parking data
Average Avoided Toll Cost ($/Trip/Rider)
The average expected cost of tolls per trip per rider that riders would have otherwise paid if not using the service resulting from the project. The calculations will already take into account that tolls are only paid once per round trip.
$0.00 No tolls along transit route
2 of 2 Quantifiable Component 1

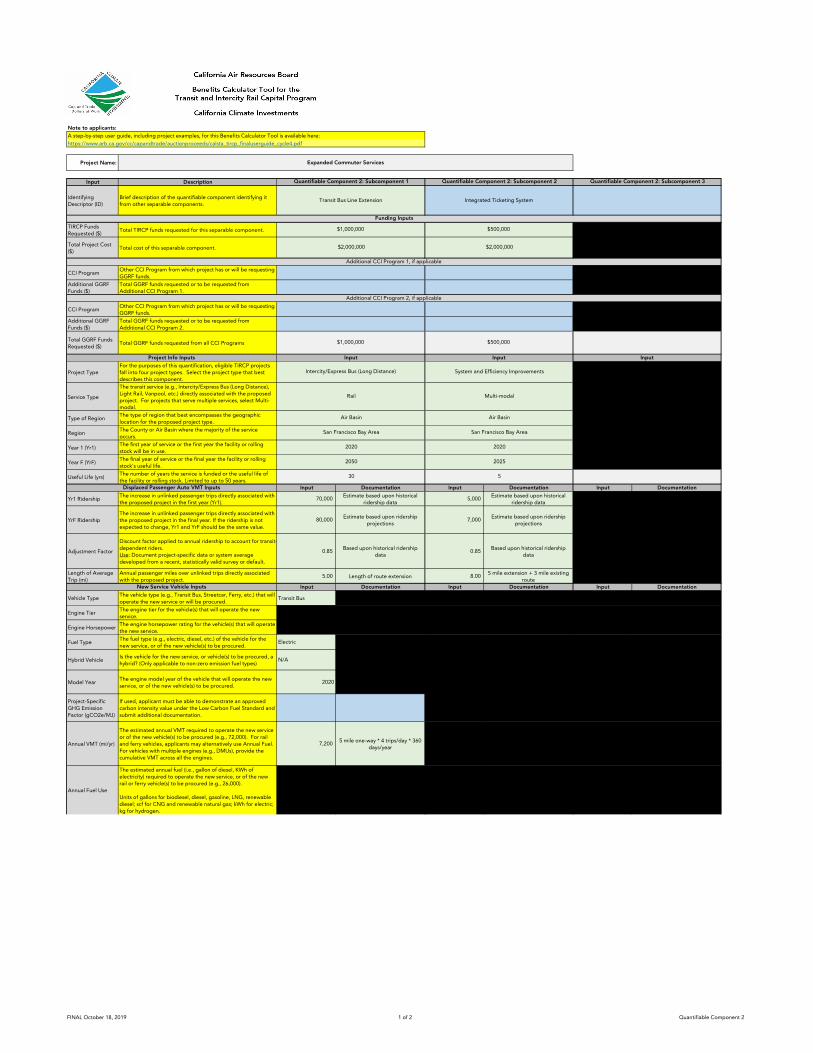
Example Project Description (cont.)• Component 2 – Subcomponent 1
o The project will extend an existing transit bus route using an electric bus. A300 kW solar PV array will be installed to provide renewable electricity forthe bus.
• Component 2 – Subcomponent 2
oAn integrated ticketing system will be installed to improve the ease ofpassenger travel across multiple transit modes.
23
Note to applicants:
Project Name: Expanded Commuter Services
A step-by-step user guide, including project examples, for this Benefits Calculator Tool is available here: https://www.arb.ca.gov/cc/capandtrade/auctionproceeds/calsta_tircp_finaluserguide_cycle4.pdf
Input Description Quantifiable Component 2: Subcomponent 1
Transit Bus Line Extension
Funding Inputs
$1,000,000
Quantifiable Component 2: Subcomponent 2 Quantifiable Component 2: Subcomponent 3
Identifying Descriptor (ID)
Brief description of the quantifiable component identifying it from other separable components.
Integrated Ticketing System
$500,000 TIRCP Funds Requested ($)
Total TIRCP funds requested for this separable component.
Total Project Cost ($)
Total cost of this separable component. $2,000,000 $2,000,000
Additional CCI Program 1, if applicable
CCI Program Other CCI Program from which project has or will be requesting GGRF funds.
Additional GGRF Funds ($)
Total GGRF funds requested or to be requested from Additional CCI Program 1.
Additional CCI Program 2, if applicable
CCI Program Other CCI Program from which project has or will be requesting GGRF funds.
Additional GGRF Funds ($)
Total GGRF funds requested or to be requested from Additional CCI Program 2.
Total GGRF Funds Requested ($)
Total GGRF funds requested from all CCI Programs $1,000,000 $500,000
Project Info Inputs Input Input Input
Project Type For the purposes of this quantification, eligible TIRCP projects fall into four project types. Select the project type that best describes this component.
Intercity/Express Bus (Long Distance) System and Efficiency Improvements
Service Type
The transit service (e.g., Intercity/Express Bus (Long Distance), Light Rail, Vanpool, etc.) directly associated with the proposed project. For projects that serve multiple services, select Multi-modal.
Rail Multi-modal
Type of Region The type of region that best encompasses the geographic location for the proposed project type.
Air Basin Air Basin
Region The County or Air Basin where the majority of the service occurs.
San Francisco Bay Area San Francisco Bay Area
Year 1 (Yr1) The first year of service or the first year the facility or rolling stock will be in use.
2020 2020
Year F (YrF) The final year of service or the final year the facility or rolling stock's useful life.
2050 2025
Useful Life (yrs) The number of years the service is funded or the useful life of the facility or rolling stock. Limited to up to 50 years.
30 5
Displaced Passenger Auto VMT Inputs Input Documentation Input Documentation Input Documentation
Yr1 Ridership The increase in unlinked passenger trips directly associated with the proposed project in the first year (Yr1).
70,000 Estimate based upon historical ridership data
5,000 Estimate based upon historical ridership data
YrF Ridership The increase in unlinked passenger trips directly associated with the proposed project in the final year. If the ridership is not expected to change, Yr1 and YrF should be the same value.
80,000 Estimate based upon ridership projections
7,000 Estimate based upon ridership projections
Adjustment Factor
Discount factor applied to annual ridership to account for transit-dependent riders. Use: Document project-specific data or system average developed from a recent, statistically valid survey or default.
0.85 Based upon historical ridership data
0.85 Based upon historical ridership data
Length of Average Trip (mi)
Annual passenger miles over unlinked trips directly associated with the proposed project.
5.00 Length of route extension 8.00 5 mile extension + 3 mile existing route
New Service Vehicle Inputs Input Documentation Input Documentation Input Documentation
Vehicle Type The vehicle type (e.g., Transit Bus, Streetcar, Ferry, etc.) that will operate the new service or will be procured.
Transit Bus
Engine Tier The engine tier for the vehicle(s) that will operate the new service.
Engine Horsepower The engine horsepower rating for the vehicle(s) that will operate the new service.
Fuel Type The fuel type (e.g., electric, diesel, etc.) of the vehicle for the new service, or of the new vehicle(s) to be procured.
Electric
Hybrid Vehicle Is the vehicle for the new service, or vehicle(s) to be procured, a hybrid? (Only applicable to non-zero emission fuel types)
N/A
Model Year The engine model year of the vehicle that will operate the new service, or of the new vehicle(s) to be procured.
2020
Project-Specific GHG Emission Factor (gCO2e/MJ)
If used, applicant must be able to demonstrate an approved carbon intensity value under the Low Carbon Fuel Standard and submit additional documentation.
Annual VMT (mi/yr)
The estimated annual VMT required to operate the new service or of the new vehicle(s) to be procured (e.g., 72,000). For rail and ferry vehicles, applicants may alternatively use Annual Fuel. For vehicles with multiple engines (e.g., DMUs), provide the cumulative VMT across all the engines.
7,200 5 mile one-way * 4 trips/day * 360 days/year
Annual Fuel Use
The estimated annual fuel (i.e., gallon of diesel, KWh of electricity) required to operate the new service, or of the new rail or ferry vehicle(s) to be procured (e.g., 26,000).
Units of gallons for biodiesel, diesel, gasoline, LNG, renewable diesel; scf for CNG and renewable natural gas; kWh for electric; kg for hydrogen.
FINAL October 18, 2019 1 of 2 Quantifiable Component 2
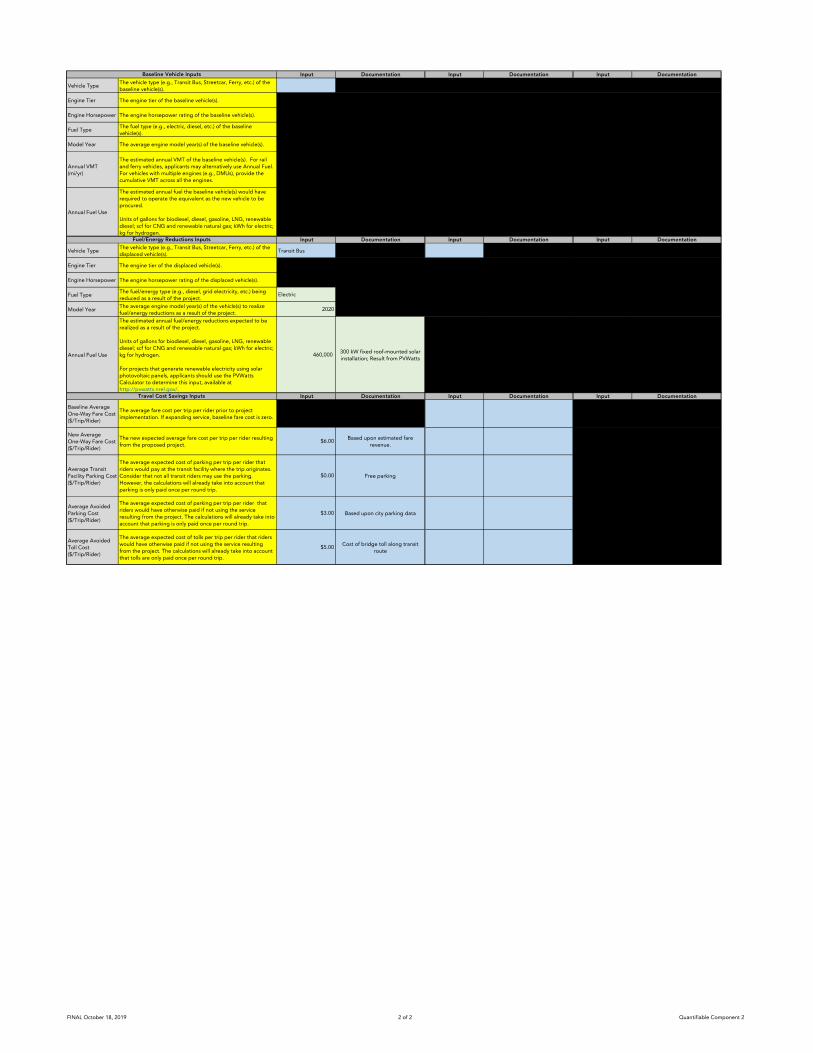
Vehicle Type
Baseline Vehicle Inputs Input Documentation Input Documentation Input Documentation The vehicle type (e.g., Transit Bus, Streetcar, Ferry, etc.) of the baseline vehicle(s).
Engine Tier The engine tier of the baseline vehicle(s).
Engine Horsepower The engine horsepower rating of the baseline vehicle(s).
Fuel Type The fuel type (e.g., electric, diesel, etc.) of the baseline vehicle(s).
Model Year The average engine model year(s) of the baseline vehicle(s).
Annual VMT (mi/yr)
The estimated annual VMT of the baseline vehicle(s). For rail and ferry vehicles, applicants may alternatively use Annual Fuel. For vehicles with multiple engines (e.g., DMUs), provide the cumulative VMT across all the engines.
Annual Fuel Use
Vehicle Type
The estimated annual fuel the baseline vehicle(s) would have required to operate the equivalent as the new vehicle to be procured.
Units of gallons for biodiesel, diesel, gasoline, LNG, renewable diesel; scf for CNG and renewable natural gas; kWh for electric; kg for hydrogen.
Fuel/Energy Reductions Inputs The vehicle type (e.g., Transit Bus, Streetcar, Ferry, etc.) of the displaced vehicle(s).
Input
Transit Bus
Documentation Input Documentation Input Documentation
Engine Tier The engine tier of the displaced vehicle(s).
Engine Horsepower The engine horsepower rating of the displaced vehicle(s).
Fuel Type The fuel/energy type (e.g., diesel, grid electricity, etc.) being reduced as a result of the project.
Electric
Model Year The average engine model year(s) of the vehicle(s) to realize fuel/energy reductions as a result of the project.
2020
Annual Fuel Use
The estimated annual fuel/energy reductions expected to be realized as a result of the project.
Units of gallons for biodiesel, diesel, gasoline, LNG, renewable diesel; scf for CNG and renewable natural gas; kWh for electric; kg for hydrogen.
For projects that generate renewable electricity using solar photovoltaic panels, applicants should use the PVWatts Calculator to determine this input, available at http://pvwatts.nrel.gov/.
460,000 300 kW fixed roof-mounted solar installation; Result from PVWatts
Travel Cost Savings Inputs Input Documentation Input Documentation Input Documentation
Baseline Average One-Way Fare Cost ($/Trip/Rider)
The average fare cost per trip per rider prior to project implementation. If expanding service, baseline fare cost is zero.
New Average One-Way Fare Cost ($/Trip/Rider)
The new expected average fare cost per trip per rider resulting from the proposed project.
$6.00 Based upon estimated fare revenue.
Average Transit Facility Parking Cost ($/Trip/Rider)
The average expected cost of parking per trip per rider that riders would pay at the transit facility where the trip originates. Consider that not all transit riders may use the parking. However, the calculations will already take into account that parking is only paid once per round trip.
$0.00 Free parking
Average Avoided Parking Cost ($/Trip/Rider)
The average expected cost of parking per trip per rider that riders would have otherwise paid if not using the service resulting from the project. The calculations will already take into account that parking is only paid once per round trip.
$3.00 Based upon city parking data
Average Avoided Toll Cost ($/Trip/Rider)
The average expected cost of tolls per trip per rider that riders would have otherwise paid if not using the service resulting from the project. The calculations will already take into account that tolls are only paid once per round trip.
$5.00 Cost of bridge toll along transit route
FINAL October 18, 2019 2 of 2 Quantifiable Component 2
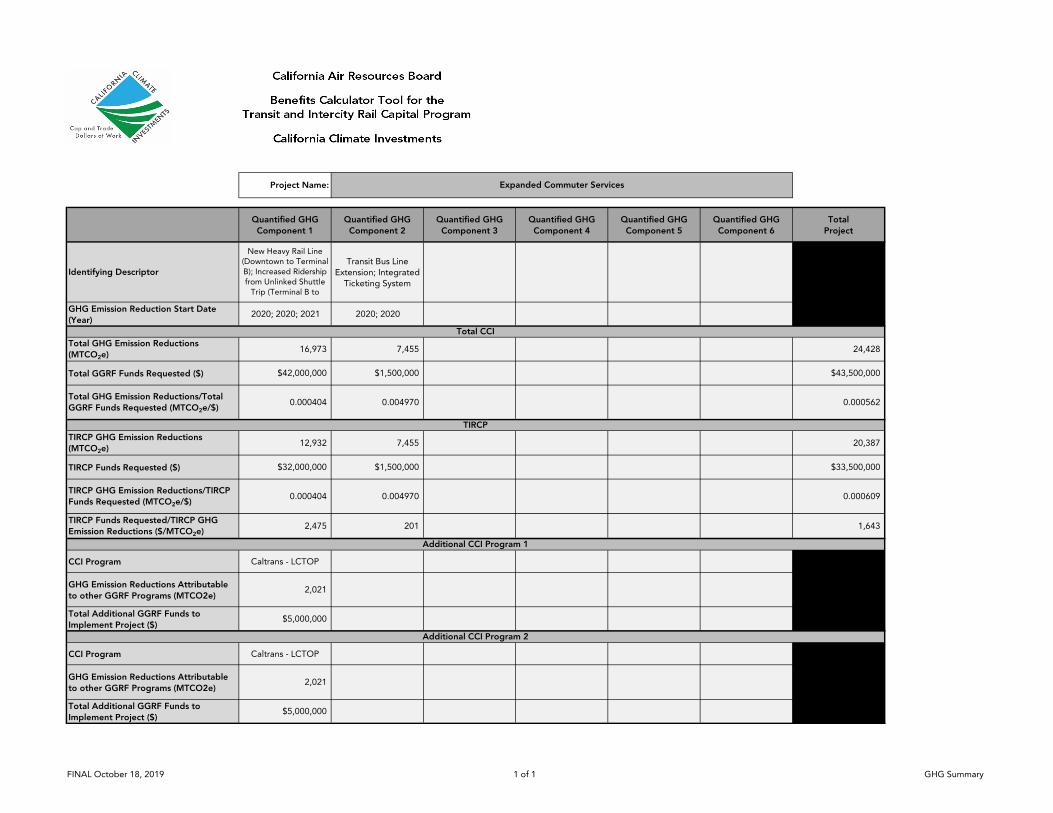
Project Name: Expanded Commuter Services
Quantified GHG Component 1
Quantified GHG Component 2
Quantified GHG Component 3
Quantified GHG Component 4
Quantified GHG Component 5
Quantified GHG Component 6
Total Project
Identifying Descriptor
New Heavy Rail Line (Downtown to Terminal B); Increased Ridership from Unlinked Shuttle
Trip (Terminal B to
Transit Bus Line Extension; Integrated
Ticketing System
GHG Emission Reduction Start Date (Year)
2020; 2020; 2021 2020; 2020
Total CCI Total GHG Emission Reductions (MTCO2e)
16,973 7,455 24,428
Total GGRF Funds Requested ($) $42,000,000 $1,500,000 $43,500,000
Total GHG Emission Reductions/Total GGRF Funds Requested (MTCO2e/$)
0.000404 0.004970 0.000562
TIRCP TIRCP GHG Emission Reductions (MTCO2e)
12,932 7,455 20,387
TIRCP Funds Requested ($) $32,000,000 $1,500,000 $33,500,000
TIRCP GHG Emission Reductions/TIRCP Funds Requested (MTCO2e/$)
0.000404 0.004970 0.000609
TIRCP Funds Requested/TIRCP GHG Emission Reductions ($/MTCO2e)
2,475 201 1,643
Additional CCI Program 1
CCI Program Caltrans - LCTOP
GHG Emission Reductions Attributable to other GGRF Programs (MTCO2e)
2,021
Total Additional GGRF Funds to Implement Project ($)
$5,000,000
Additional CCI Program 2
CCI Program Caltrans - LCTOP
GHG Emission Reductions Attributable to other GGRF Programs (MTCO2e)
2,021
Total Additional GGRF Funds to Implement Project ($)
$5,000,000
FINAL October 18, 2019 1 of 1 GHG Summary
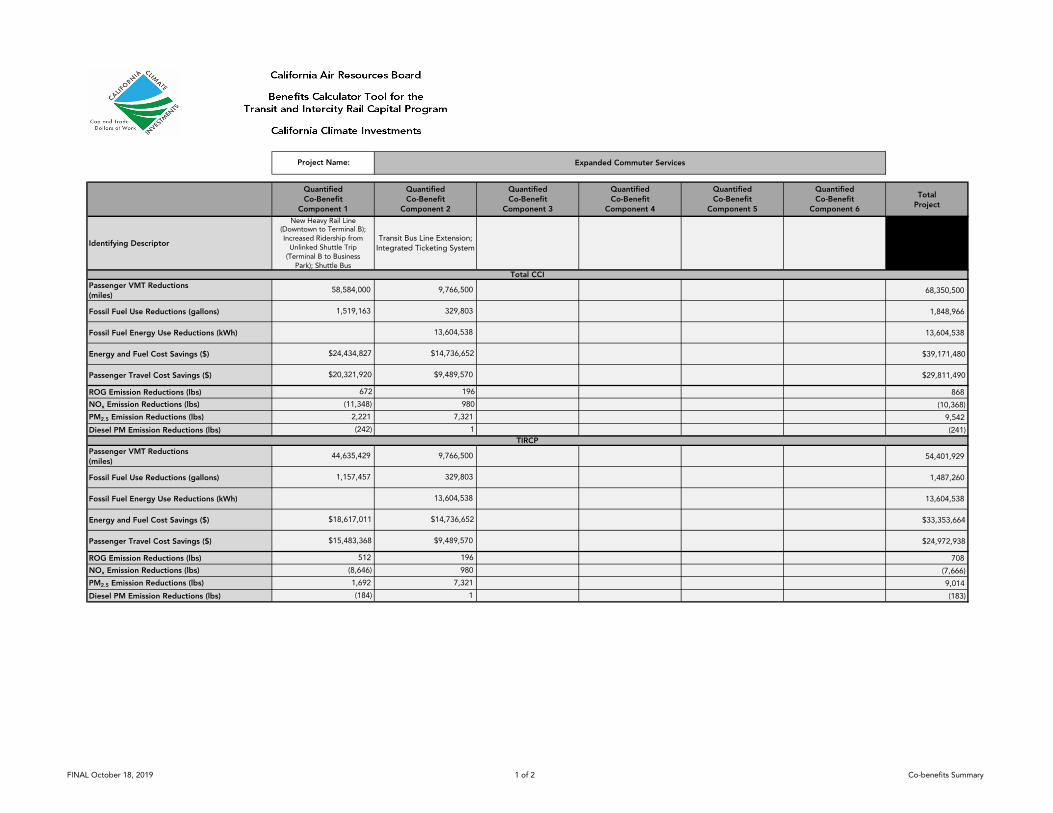
Project Name: Expanded Commuter Services
Quantified Co-Benefit
Component 1
Quantified Co-Benefit
Component 2
Quantified Co-Benefit
Component 3
Quantified Co-Benefit
Component 4
Quantified Co-Benefit
Component 5
Quantified Co-Benefit
Component 6
Total Project
Identifying Descriptor
New Heavy Rail Line (Downtown to Terminal B); Increased Ridership from
Unlinked Shuttle Trip (Terminal B to Business
Park); Shuttle Bus
Transit Bus Line Extension; Integrated Ticketing System
Total CCI Passenger VMT Reductions (miles)
58,584,000 9,766,500 68,350,500
Fossil Fuel Use Reductions (gallons) 1,519,163 329,803 1,848,966
Fossil Fuel Energy Use Reductions (kWh) 13,604,538 13,604,538
Energy and Fuel Cost Savings ($) $24,434,827 $14,736,652 $39,171,480
Passenger Travel Cost Savings ($) $20,321,920 $9,489,570 $29,811,490
ROG Emission Reductions (lbs) 672 196 868
NOx Emission Reductions (lbs) (11,348) 980 (10,368)
PM2.5 Emission Reductions (lbs) 2,221 7,321 9,542
Diesel PM Emission Reductions (lbs) (242) 1 (241) TIRCP
Passenger VMT Reductions (miles)
44,635,429 9,766,500 54,401,929
Fossil Fuel Use Reductions (gallons) 1,157,457 329,803 1,487,260
Fossil Fuel Energy Use Reductions (kWh) 13,604,538 13,604,538
Energy and Fuel Cost Savings ($) $18,617,011 $14,736,652 $33,353,664
Passenger Travel Cost Savings ($) $15,483,368 $9,489,570 $24,972,938
ROG Emission Reductions (lbs) 512 196 708
NOx Emission Reductions (lbs) (8,646) 980 (7,666)
PM2.5 Emission Reductions (lbs) 1,692 7,321 9,014
Diesel PM Emission Reductions (lbs) (184) 1 (183)
FINAL October 18, 2019 1 of 2 Co-benefits Summary
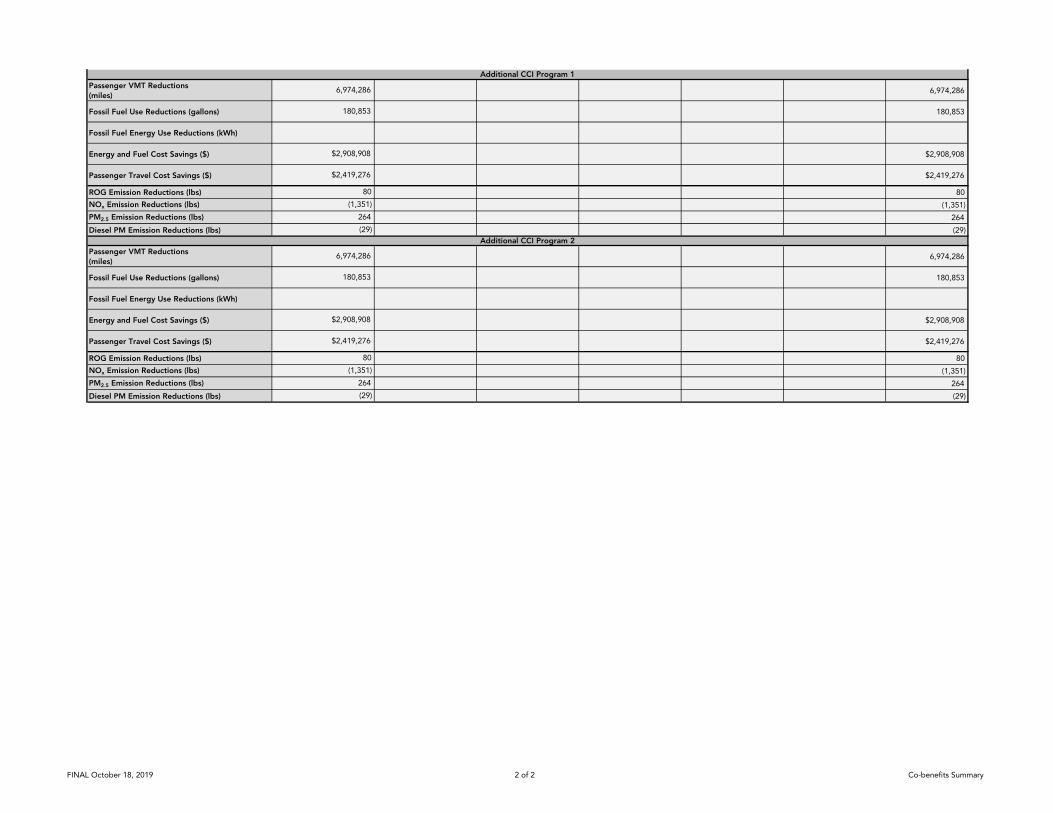
Additional CCI Program 1 Passenger VMT Reductions (miles)
6,974,286 6,974,286
Fossil Fuel Use Reductions (gallons) 180,853 180,853
Fossil Fuel Energy Use Reductions (kWh)
Energy and Fuel Cost Savings ($) $2,908,908 $2,908,908
Passenger Travel Cost Savings ($) $2,419,276 $2,419,276
ROG Emission Reductions (lbs) 80 80
NOx Emission Reductions (lbs) (1,351) (1,351)
PM2.5 Emission Reductions (lbs) 264 264
Diesel PM Emission Reductions (lbs) (29) (29) Additional CCI Program 2
Passenger VMT Reductions (miles)
6,974,286 6,974,286
Fossil Fuel Use Reductions (gallons) 180,853 180,853
Fossil Fuel Energy Use Reductions (kWh)
Energy and Fuel Cost Savings ($) $2,908,908 $2,908,908
Passenger Travel Cost Savings ($) $2,419,276 $2,419,276
ROG Emission Reductions (lbs) 80 80
NOx Emission Reductions (lbs) (1,351) (1,351)
PM2.5 Emission Reductions (lbs) 264 264
Diesel PM Emission Reductions (lbs) (29) (29)
FINAL October 18, 2019 2 of 2 Co-benefits Summary
24
5. Q&A
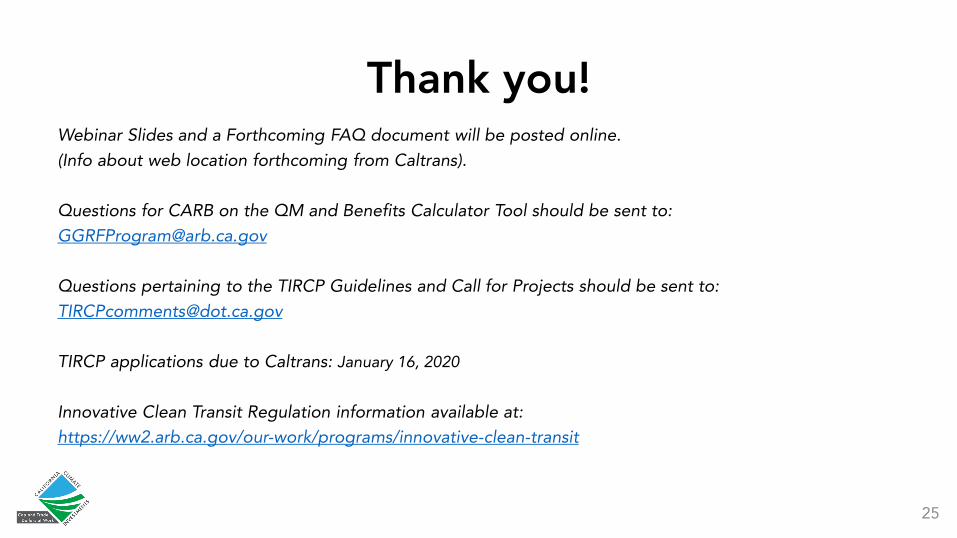
Thank you!Webinar Slides and a Forthcoming FAQ document will be posted online.(Info about web location forthcoming from Caltrans).
Questions for CARB on the QM and Benefits Calculator Tool should be sent to: [email protected]
Questions pertaining to the TIRCP Guidelines and Call for Projects should be sent to:[email protected]
TIRCP applications due to Caltrans: January 16, 2020
Innovative Clean Transit Regulation information available at: https://ww2.arb.ca.gov/our-work/programs/innovative-clean-transit
25