Tips on visualising data
22
-
Upload
wired-lizard -
Category
Data & Analytics
-
view
162 -
download
2
Transcript of Tips on visualising data

Explore Explain

what influences our design choices?

audience?

purpose?

it’s not enough…

what is the question?

we need to adjust our mindset


Which products declined in price since the launch of Product C in 2010?

Which products declined in price since the launch of Product C in 2010?

Which products declined in price since the launch of Product C in 2010?

Which products declined in price since the launch of Product C in 2010?
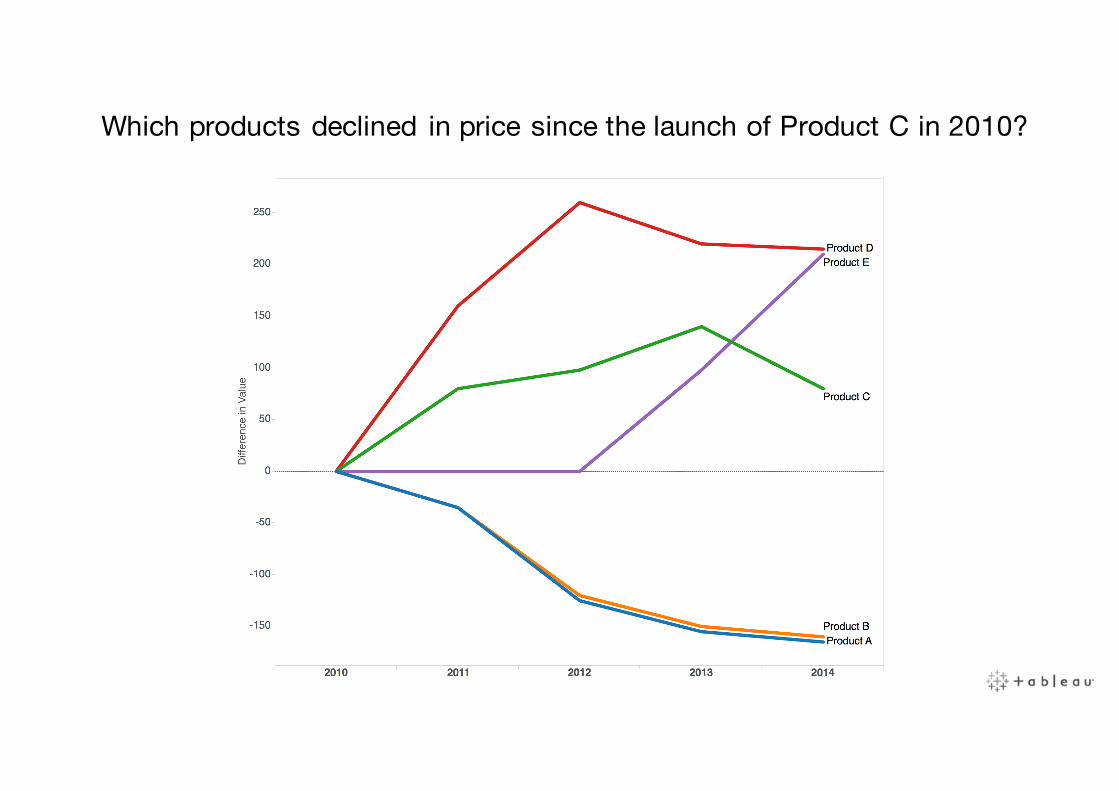
Which products declined in price since the launch of Product C in 2010?
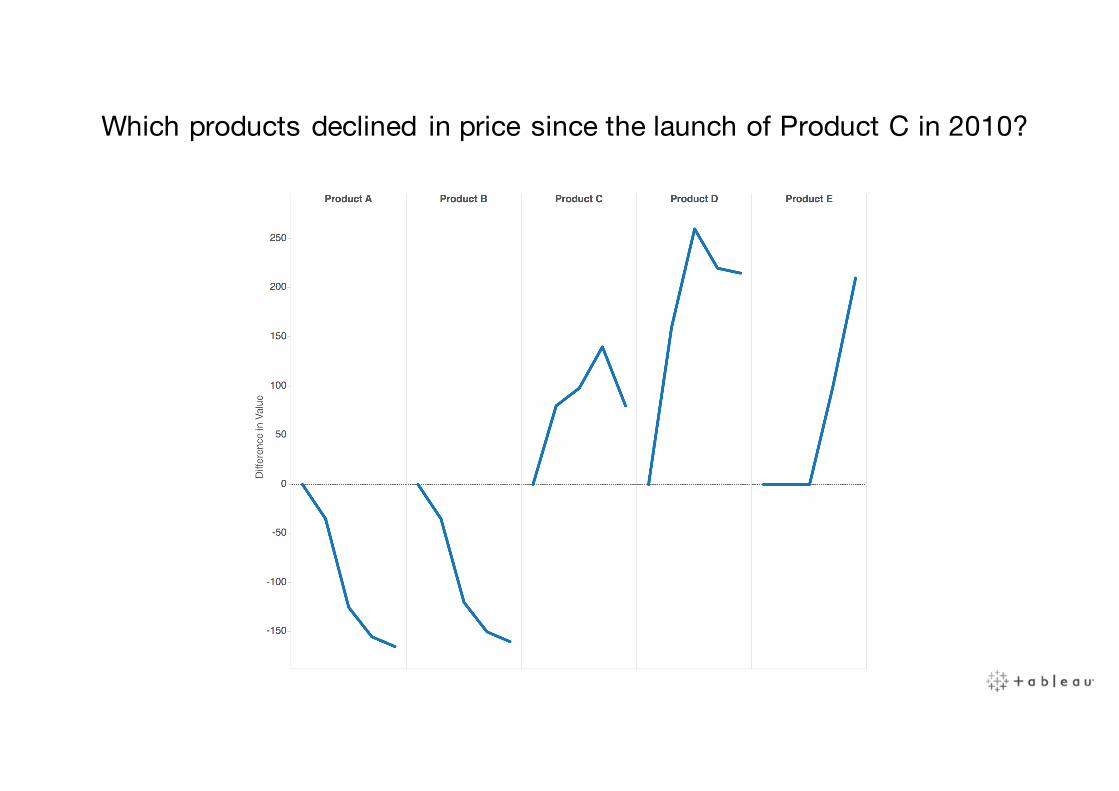
Which products declined in price since the launch of Product C in 2010?

Which products declined in price since the launch of Product C in 2010?
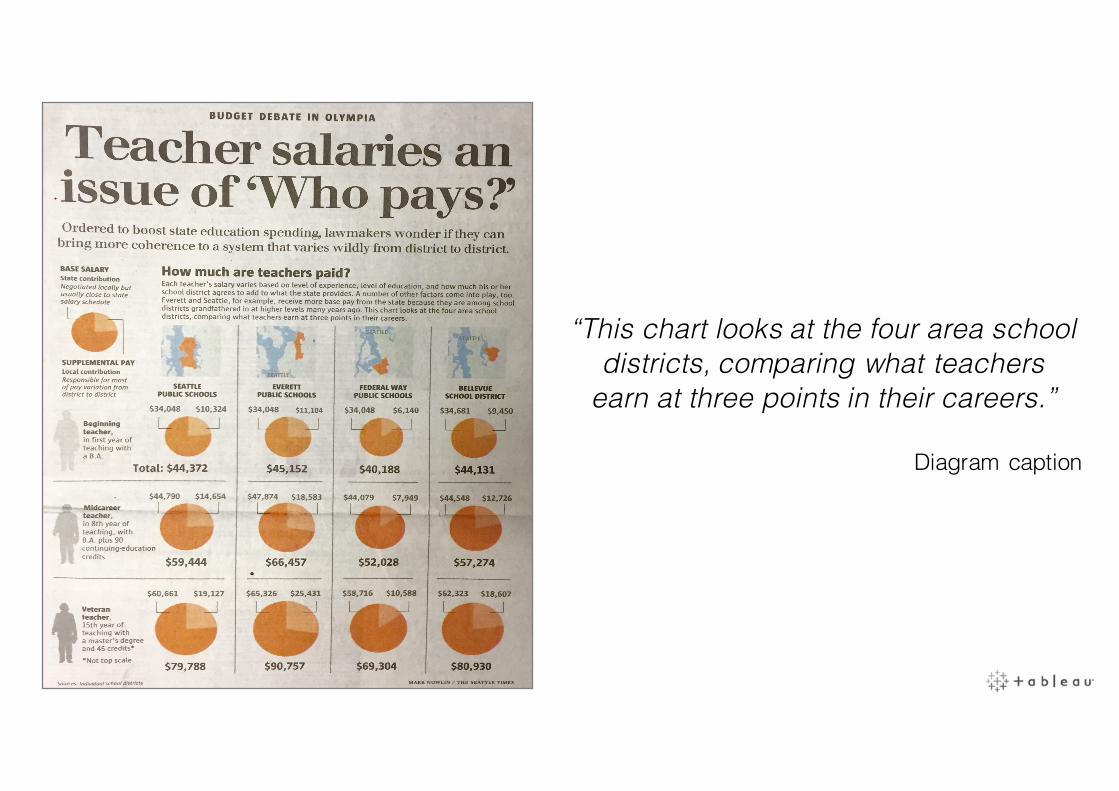
“This chart looks at the four area school districts, comparing what teachers
earn at three points in their careers.”
Diagram caption

Compare what teachers earn at three points in their careers.
Viz Review