TiO2 Nanoparticles for Removal of Malachite Green Dye from ... · 2 Nanoparticles for Removal of...
16
Advances in Chemical Engineering and Science, 2015, 5, 373-388 Published Online July 2015 in SciRes. http://www.scirp.org/journal/aces http://dx.doi.org/10.4236/aces.2015.53039 How to cite this paper: Abou-Gamra, Z.M. and Ahmed, M.A. (2015) TiO 2 Nanoparticles for Removal of Malachite Green Dye from Waste Water. Advances in Chemical Engineering and Science, 5, 373-388. http://dx.doi.org/10.4236/aces.2015.53039 TiO 2 Nanoparticles for Removal of Malachite Green Dye from Waste Water Zeinab M. Abou-Gamra * , Mohamed A. Ahmed Chemistry Department, Faculty of Science, Ain Shams University, Cairo, Egypt Email: * [email protected] Received 17 June 2015; accepted 24 July 2015; published 28 July 2015 Copyright © 2015 by authors and Scientific Research Publishing Inc. This work is licensed under the Creative Commons Attribution International License (CC BY). http://creativecommons.org/licenses/by/4.0/ Abstract In this research, we present a simple and successful route for synthesis titania nanoparticles by controlled sol-gel progress. Chitosan as bio-template is involved in the progress of preparation to increase the surface area and manipulate defined particle and pore structure. The crystalline be- havior and the nanostructure of the prepared nanoparticles were investigated using X-ray diffrac- tion [XRD] and transmission electron microscope [TEM]. The crystalline results have pointed out the predominant existence of anatase phase that reveals the successful role of chitosan in stabi- lizing titania nanoparticles and preventing the growth of these particles into rutile phase. It is ob- vious to notice that a change in sample crystallography from anatase to completely amorphous nanoparticles upon adsorption of malachite green dye indicates a strong adsorption of this dye that destroys the crystalline feature of titania sample. TEM analysis reveals the existence of spherical nanoparticles with size about 25 nm. The adsorption isotherm indicates the adsorption capacity 6.3 mg∙g −1 TiO2. The value of enthalpy change (∆H˚) for malachite green dye adsorption is 19 kJ/mol, which indicates that the removal process is endothermic. The adsorption process fol- lows pseudo-second order rate equation and the negative values of standard free energy (∆G˚) suggest that the adsorption process is spontaneous. Keywords TiO2 Nanoparticles, Chitosan, Malachite Green, Adsorption 1. Introduction The extensive uses of industrial dyes in the fields of paints, cosmetics and food industry are accompanied by various risks on human health due to the stability and toxicity of these organic materials [1]-[3]. The effective * Corresponding author.
Transcript of TiO2 Nanoparticles for Removal of Malachite Green Dye from ... · 2 Nanoparticles for Removal of...
Advances in Chemical Engineering and Science, 2015, 5, 373-388 Published Online July 2015 in SciRes. http://www.scirp.org/journal/aces http://dx.doi.org/10.4236/aces.2015.53039
How to cite this paper: Abou-Gamra, Z.M. and Ahmed, M.A. (2015) TiO2 Nanoparticles for Removal of Malachite Green Dye from Waste Water. Advances in Chemical Engineering and Science, 5, 373-388. http://dx.doi.org/10.4236/aces.2015.53039
TiO2 Nanoparticles for Removal of Malachite Green Dye from Waste Water Zeinab M. Abou-Gamra*, Mohamed A. Ahmed Chemistry Department, Faculty of Science, Ain Shams University, Cairo, Egypt Email: *[email protected] Received 17 June 2015; accepted 24 July 2015; published 28 July 2015
Copyright © 2015 by authors and Scientific Research Publishing Inc. This work is licensed under the Creative Commons Attribution International License (CC BY). http://creativecommons.org/licenses/by/4.0/
Abstract In this research, we present a simple and successful route for synthesis titania nanoparticles by controlled sol-gel progress. Chitosan as bio-template is involved in the progress of preparation to increase the surface area and manipulate defined particle and pore structure. The crystalline be-havior and the nanostructure of the prepared nanoparticles were investigated using X-ray diffrac-tion [XRD] and transmission electron microscope [TEM]. The crystalline results have pointed out the predominant existence of anatase phase that reveals the successful role of chitosan in stabi-lizing titania nanoparticles and preventing the growth of these particles into rutile phase. It is ob-vious to notice that a change in sample crystallography from anatase to completely amorphous nanoparticles upon adsorption of malachite green dye indicates a strong adsorption of this dye that destroys the crystalline feature of titania sample. TEM analysis reveals the existence of spherical nanoparticles with size about 25 nm. The adsorption isotherm indicates the adsorption capacity 6.3 mg∙g−1 TiO2. The value of enthalpy change (∆H˚) for malachite green dye adsorption is 19 kJ/mol, which indicates that the removal process is endothermic. The adsorption process fol-lows pseudo-second order rate equation and the negative values of standard free energy (∆G˚) suggest that the adsorption process is spontaneous.
Keywords TiO2 Nanoparticles, Chitosan, Malachite Green, Adsorption
1. Introduction The extensive uses of industrial dyes in the fields of paints, cosmetics and food industry are accompanied by various risks on human health due to the stability and toxicity of these organic materials [1]-[3]. The effective
*Corresponding author.

Z. M. Abou-Gamra, M. A. Ahmed
374
removal of dyes from effluent is considered one of the environmental challenges in the recent years. Malachite green (MG) (Color Index No: 42,000) is one of triphenylmethane dyes, a green crystal powder with a metallic luster, highly soluble in water and ethanol with blue-green solutions [4]. Malachite green (MG) has numerous industrial applications (dyeing of silk, leather, plastics and paper). Their appearance is harmful for humans and animals following inhalation and/or ingestion [5], produces toxicity to respiratory system and reduces fertility in humans [6]. The triphenylmethane dyes biodegradation due to presence of nitrogen in their back bone (generate carcinogenic, genotoxic, mutagenic and teratogenic problems) is a difficult task [7]. MG has high resistance to light and oxidizing agents, while its removal based on biological treatment and chemical precipitation has low efficiency [8]. It is now established that TiO2 is considered a promising semiconductor that is extensively in-volved in removal of several toxic organic containments through both adsorption and photocatalytic process due to the stability of its chemical structure, biocompatibility, strong oxidizing power, non-toxicity and low cost of the metal precursors [9]-[14]. TiO2 can be only triggered by UV radiation that encompasses only about 4% - 5% of natural solar radiation due to its wide band gap energy (3.2 eV). This defect limits the industrialization of this powder. Moreover, the mineralization processes through various redox reactions are encountered by the rapid recombination of the charge carriers. Another major defect in the preparation of nano titanium oxide through sol-gel route is the rapid hydrolysis of titanium alkoxide salts that lead to irregular condensation of hydroxide particles into amorphous solid [15]. This random condensation of particles is the primary cause for obtaining ir-regular particle and pore structure.
It is generally accepted that the existence of active template can manipulate the particle and pore structure to facilitate the diffusion of organic containments inside the pore as well as on the oxide surface. Most of the sur-factants that are involved in the preparation of nanoparticles exhibit high degree of toxicity that affects human health and cause several environmental risks. Recently, chitosan which is available in large quantity in nature, non-toxic and biocompatible can be considered as excellent natural cationic polysaccharide biopolymer that is involved in synthesis of nanoparticles of ZnO andTiO2. It is interesting to mention that chitosan molecules pos-sess large number of reactive hydroxyl (-OH) and amino (-NH2) groups which can effectively co-ordinate with various metal ions. It is a best issue to manipulate various oxide structures. Moreover, these natural molecules can prevent nanoparticles from agglomeration during growth, improving the adsorption capacity of the sample and can overcome the difficulty in separation and recovery of nanosized powder materials [16] [17]. Chitosan is reported as excellent adsorbent in removal of various organic dyes [18] [19].
The research work is concerned with investigation of the reactivity of TiO2 nanoparticles in removal of mala-chite green as model pollutant dye. The crystalline feature of the synthesized sample was performed by XRD techniques. However, the nanostructure was investigated by TEM. The removal of the malachite green dye was studied over wide range of dye concentrations and different dosage of catalyst sample. Adsorption isotherms are studied using Freundlich, Langmuir, Temkin and Dubinin models to indicate the mechanism of adsorption and estimate the maximum adsorption capacity and correlation coefficients. The kinetics of adsorption process is well investigated using different models as pseudo first order, pseudo second order, Elovich, Morris and Weber.
2. Materials and Methods 2.1. Materials All chemicals including chitosan, titanium isopropoxide and malachite green dye were purchased from Sigma- Aldrich without further purification. Properties of investigated dye are listed in Table 1. Stock solution was prepared by dissolving accurately weighed sample of dye in distilled water to give a concentration of mmol∙L−1. Desirable concentrations of dye were obtained by serial dilution.
2.2. Instrumentation X-ray diffraction patterns were carried out by XRD-6100 X-ray diffractometer, with CuKα (λ = 1.5406 Å) radia-tion in the 2θ range from 5˚ to 90˚. The scanning mode is continuous with scan speed 2 deg /min, the sampling pitch 0.02 deg and the preset time 0.6 s.
The nanostructure of TiO2 rods before and after adsorption was investigated by Transmission electron micro-scope (JEOL, JEM-1200X II).
The reaction was followed spectrophotometrically at λmax = 617 nm for malachite green dye using thermos-tated Evolution 300 UV-VIS spectrophotometer.
Z. M. Abou-Gamra, M. A. Ahmed
375
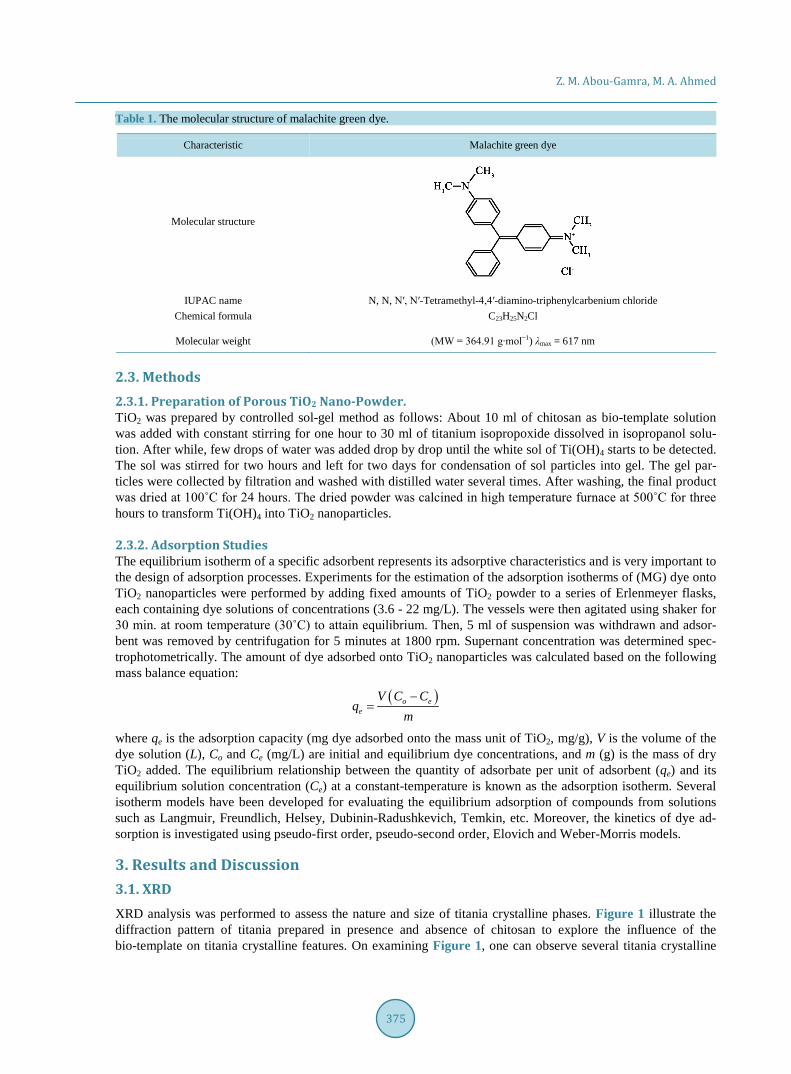
Table 1. The molecular structure of malachite green dye.
Characteristic Malachite green dye
Molecular structure
IUPAC name Chemical formula
N, N, N′, N′-Tetramethyl-4,4′-diamino-triphenylcarbenium chloride C23H25N2Cl
Molecular weight (MW = 364.91 g∙mol−1) λmax = 617 nm
2.3. Methods 2.3.1. Preparation of Porous TiO2 Nano-Powder. TiO2 was prepared by controlled sol-gel method as follows: About 10 ml of chitosan as bio-template solution was added with constant stirring for one hour to 30 ml of titanium isopropoxide dissolved in isopropanol solu-tion. After while, few drops of water was added drop by drop until the white sol of Ti(OH)4 starts to be detected. The sol was stirred for two hours and left for two days for condensation of sol particles into gel. The gel par-ticles were collected by filtration and washed with distilled water several times. After washing, the final product was dried at 100˚C for 24 hours. The dried powder was calcined in high temperature furnace at 500˚C for three hours to transform Ti(OH)4 into TiO2 nanoparticles.
2.3.2. Adsorption Studies The equilibrium isotherm of a specific adsorbent represents its adsorptive characteristics and is very important to the design of adsorption processes. Experiments for the estimation of the adsorption isotherms of (MG) dye onto TiO2 nanoparticles were performed by adding fixed amounts of TiO2 powder to a series of Erlenmeyer flasks, each containing dye solutions of concentrations (3.6 - 22 mg/L). The vessels were then agitated using shaker for 30 min. at room temperature (30˚C) to attain equilibrium. Then, 5 ml of suspension was withdrawn and adsor-bent was removed by centrifugation for 5 minutes at 1800 rpm. Supernant concentration was determined spec-trophotometrically. The amount of dye adsorbed onto TiO2 nanoparticles was calculated based on the following mass balance equation:
( )o ee
V C Cq
m−
=
where qe is the adsorption capacity (mg dye adsorbed onto the mass unit of TiO2, mg/g), V is the volume of the dye solution (L), Co and Ce (mg/L) are initial and equilibrium dye concentrations, and m (g) is the mass of dry TiO2 added. The equilibrium relationship between the quantity of adsorbate per unit of adsorbent (qe) and its equilibrium solution concentration (Ce) at a constant-temperature is known as the adsorption isotherm. Several isotherm models have been developed for evaluating the equilibrium adsorption of compounds from solutions such as Langmuir, Freundlich, Helsey, Dubinin-Radushkevich, Temkin, etc. Moreover, the kinetics of dye ad-sorption is investigated using pseudo-first order, pseudo-second order, Elovich and Weber-Morris models.
3. Results and Discussion 3.1. XRD XRD analysis was performed to assess the nature and size of titania crystalline phases. Figure 1 illustrate the diffraction pattern of titania prepared in presence and absence of chitosan to explore the influence of the bio-template on titania crystalline features. On examining Figure 1, one can observe several titania crystalline

Z. M. Abou-Gamra, M. A. Ahmed
376
Figure 1. XDR pattern of TiO2 in presence and absent chitosan.
10 20 30 40 50 60
10 20 30 40 50 60
Inte
nsi
ty(a
.u.)
2θ
TiO2 without chitosan
A
R
A AA
R R
TiO2 with chitosan
A
AA AA

Z. M. Abou-Gamra, M. A. Ahmed
377
peaks for sample prepared in absence of chitosan at 2θ = 25.3, 36.9, 37.7, 38.5, 48, 51.9, 53.8, 55.1, 62.6, 68.7 and 75 [JCPDS No. 71-1167 were a = 3.786Å and c = 9.507Å] revealing the existence of anatase phase and oth-er peaks at 2θ = 27.4˚, 39˚, 41˚, and 44˚ [JCPDS No. 88-1175, a = 0.4.5 Å and c = 2.940 Å] referred to rutile phase. It is obvious to notice several diffraction peaks referred only to anatase phase in the sample prepared in presence of chitosan revealing the successful role of chitosan in preventing the particles agglomeration and inhi-biting the rutile phase transformation. Also Figure 1 shows a change in sample crystallography from anatase to completely amorphous nanoparticles upon adsorption of malachite dye indicates a strong adsorption of this dye that destroys the crystalline feature of titania sample.
3.2. TEM TEM is considered a powerful tool in determining the nanostructure of the prepared sample. It is clear that tita-nia nanoparticles exist in spherical structure with size about 25 nm, Figure 2(a). It is interesting to notice from Figure 2(b) that the malachite dye is strongly attached to titania nanoparticles as various rods linked to titania nanoparticles.
3.3. Dye Adsorption Analysis Malachite green dye was taken as pollutants models to investigate the adsorption capacity of TiO2 nanoparticles.
3.3.1. Effect Contact Time Equilibrium time is one of the important parameters to design a low cost adsorbent for removal of organic wastes. The adsorption of malachite green dye onto TiO2 was studied as a function of contact time to determine the necessary adsorption equilibrium time. The results reveal that about 85% of malachite green dye was ad-sorbed in 30 minutes, Figure 3.
3.3.2. Effect of TiO2 Dose The amount of solid catalyst is important parameter for detection of adsorption capacity of solid in removing organic wastes. A rapid uptake of pollutants and establishment of equilibrium in a short period signify the effi-ciency of the solid in removal of various organic pollutants. The effect of TiO2 dose on adsorption of malachite green dye was investigated in range of 0.1 - 0.4 g/100 ml at fixed amount of dye and contact time = 30 min. The removal of dye increases with increase catalyst amount, Figure 4.
(a) (b)
Figure 2. TEM micrographs of TiO2 nanoparticles.

Z. M. Abou-Gamra, M. A. Ahmed
378
Figure 3. Effect of contact time on adsorption of malachite green onto TiO2 surface. [MG] = 2.5 × 10⁻⁵ mol∙dm−3, 0.1 g of TiO2/100 ml, Temp. = 30˚C.
Figure 4. Effect of TiO2 dose on adsorption of malachite green onto TiO2 surface. [MG] = 5 × 10⁻⁵ mol∙dm−3, Temp. = 30˚C.
3.3.3. Effect of Dye Concentration The initial concentration of adsorbate also plays an important role as a given mass of the adsorbent can adsorb only a fixed amount of the solute. Batch adsorption experiments were carried out by shaking the adsorbent with an aqueous solution of the dye of desired concentration in corning glass bottles at 30˚C. The adsorption capacity of malachite green dye increased from 1.01 to 17.5 mg∙g−1 upon increase in dye concentration as indicated in Figure 5. Several authors reported that dye removal by TiO2 increased with increases dye concentration up to optimum value.
0
10
20
30
40
50
60
70
80
90
0 10 20 30 40 50 60 70 80 90 100 110 120 130
time / min
rem
oval
%

Z. M. Abou-Gamra, M. A. Ahmed
379
Figure 5. Effect of initial dye concentrations on adsorption of malachite green onto TiO2 surface. TiO2 dose = 0.1 g/100 ml, Temp. = 30˚C.
3.4. Adsorption Isotherm Models The equilibrium data of malachite analyzed by fitting them into Langmuir, Freundlich and Temkin equation to find out the suitable model that may be used for design consideration. Table 2 summarizes the constants and coefficients of different models.
3.4.1. Langmuir Isotherm The Langmuir isotherm assumes the absence of any interactions between adsorbate molecules and the adsorp-tion process is account for monolayer formation. The linear form of the Langmuir isotherm, assuming monolay-er adsorption on a homogeneous adsorbent surface, is expressed as follows [20]:
max max
1e e
e
C Cq bq q
= +
where the qmax (mg∙g−1) is the maximum adsorption capacity of the adsorbent corresponding to monolayer for-mation and illustrates the maximum value of qe that can be attained as Ce is increased. The b parameter is a coefficient related to the energy of adsorption and increases with increasing strength of the adsorption bond. Values of qmax and b are determined from the linear regression plot of (Ce/qe) versus Ce, Figure 6(a). Linear plot in negative direction indicates that Langmuir model fails to explain the process of adsorption and absence of formation of monolayer.
3.4.2. Freundlich Isotherm It is well established that the Freundlich isotherm is often applied to heterogeneous solid catalyst. The Freun-dlich equilibrium isotherm equation is an empirical relation involved for the description of multilayer adsorption with interaction between adsorbed molecules. The Freundlich equation [21] is expressed as follows in its linear form:
1log log loge f eq K Cn
= +
where, Kf represents the capacity of the adsorbent for the adsorbate, and 1/n shows adsorption intensity of dye on solid which is a function of the strength of adsorption. A linear regression plot of log qe versus log Ce, Figure 6(b) gives the Kf and n values. The model is applicable to the adsorption on heterogeneous surfaces by a uniform energy distribution and reversible adsorption. Linear plot with high regression factor indicating the suc-
0
2
4
6
8
10
12
14
16
18
20
0 1 2 3 4 5 6 7
[M.G] × 105/ mol∙dm−3
q e/ m
g∙g−1
Z. M. Abou-Gamra, M. A. Ahmed
380
(a) (b)
(c) (d)
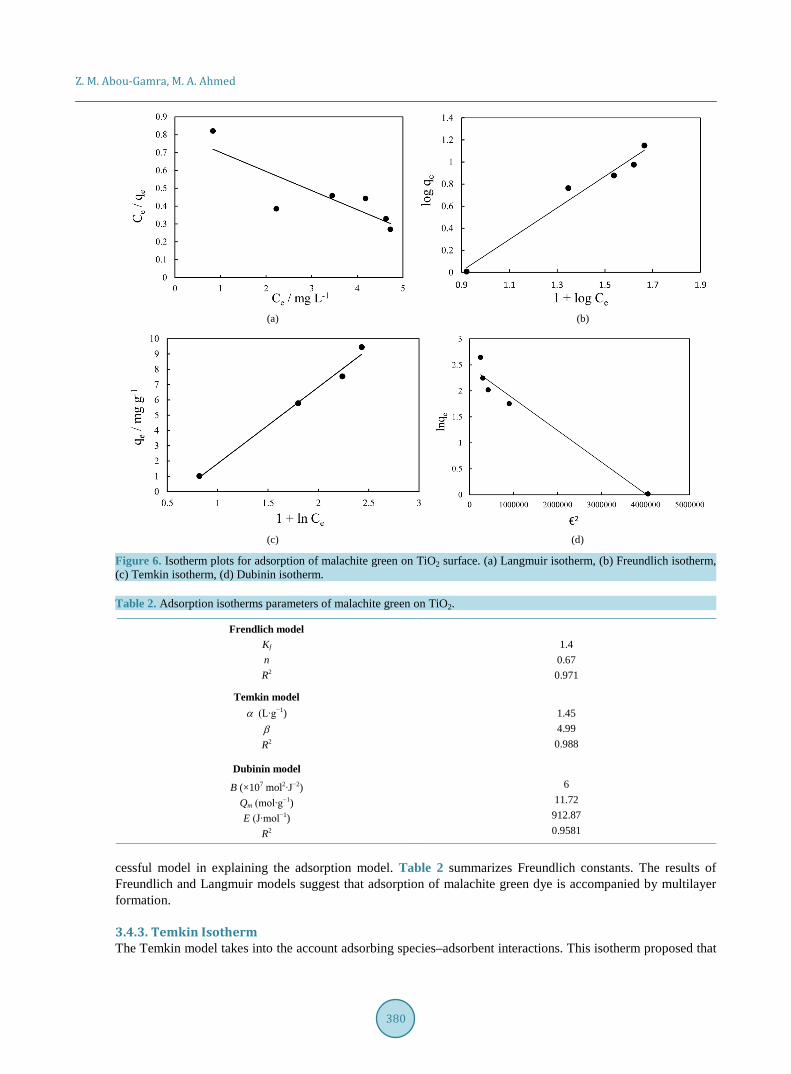
Figure 6. Isotherm plots for adsorption of malachite green on TiO2 surface. (a) Langmuir isotherm, (b) Freundlich isotherm, (c) Temkin isotherm, (d) Dubinin isotherm.
Table 2. Adsorption isotherms parameters of malachite green on TiO2.
Frendlich model Kf
n R2
1.4
0.67 0.971
Temkin model α (L∙g−1)
β R2
1.45 4.99 0.988
Dubinin model
B (×107 mol2∙J−2) Qm (mol∙g−1) E (J∙mol−1)
R2
6
11.72 912.87 0.9581
cessful model in explaining the adsorption model. Table 2 summarizes Freundlich constants. The results of Freundlich and Langmuir models suggest that adsorption of malachite green dye is accompanied by multilayer formation.
3.4.3. Temkin Isotherm The Temkin model takes into the account adsorbing species–adsorbent interactions. This isotherm proposed that
Z. M. Abou-Gamra, M. A. Ahmed
381
the heat of adsorption of all the molecules in the layer decreases linearly with coverage due to adsorbent–ad- sorbate interactions and the adsorption is characterized by a uniform distribution of binding energies, up to some maximum binding energy. The linear Temkin [22] equation is
ln lne eq Cαβ β= + α is the equilibrium constant corresponding to the maximum binding energy/L⋅g−1.
RT bβ = T is the absolute temperature in Kelvin. R is the universal gas constant 8.314 J∙mol−1∙K−1.
b is the Temkin constant related to heat sorption/J∙mg−1.
α and β are calculated from the slope and intercept of qe versus lnCe, Figure 6(c). The Temkin equation better holds for the prediction of gas phase equilibria rather than liquid phase. The liquid phase is a more complex phenomenon since the adsorbed molecules do not necessarily organized in a tightly packed structure with iden-tical orientation. Linear plot and high regression value suggest the successful model in explaining the adsorption mechanism. Table 2 summarizes Temkin constants. The adsorption energy obtained from Temkin plot 503.988 J∙mg−1 which indicates that the adsorption process is endothermic and a strong interaction between TiO2 and malachite green dye.
3.4.4. The Dubinin Radushkevich Isotherm This model is involved to estimate the porosity, free energy and the characteristics of adsorbents [23]. The iso-therm assumes the surface heterogeneity and the variation of adsorption potential during sorption process. The model has commonly been applied in the following linear Equation:
2ln ln €e mq Q B= − Polanyi potential, €, can be calculated according the following equation
( )€ ln 1 1 eRT C= +
where B is a constant related to the adsorption energy, Qm the theoretical saturation capacity. The slope of the plot of lnqe versus €2 gives B (mol2∙J−2) and the intercept yields the adsorption capacity, Qm (mg∙g−1) as shown in Figure 6(d). Table 2 summarizes Dubinin constants. The mean free energy of adsorption (E) which is energy require to transfer one mole of the dye from infinity in solution to the surface of the solid can be calculated from the B value using the following relation
1 2E B=
The value of energy is about 912.87 J/mole revealing physisorption of malachite on titania nanoparticles.
3.5. Adsorption Kinetics Adsorption of organic dyes on metal oxide surface are influenced by three mass transfer process which are ex-ternal diffusion of dye molecules from liquid phase to the solid surface, actual adsorption and intraparticle diffu-sion of dye molecules in the interior of pores. The adsorption process is usually very fast rather than internal and external diffusion. It is well known that the adsorption equilibrium is reached within several minutes. However, the long adsorption equilibrium time suggests that the internal diffusion controls the reaction rate.
Kinetics is key factor for adsorption investigation because it can predict the rate at which a pollutant is re-moved from aqueous solution and provides valuable data for understanding the mechanism of adsorption process. Several models are available to investigate the adsorption mechanism and description based on experi-mental data such as pseudo-first order, pseudo-second order, intramolecular diffusion and Elovich models. The pseudo-first order adsorption rate [24] and pseudo-second order adsorption rate [25] have the following linear forms
( ) 1ln lne t eq q q k t− = −
where k1 (min−1) is pseudo first order rate constant, qe (mg∙g−1) is the amount of dye adsorbed on surface at equi-librium, qt (mg∙g−1) is the amount of dye adsorbed on surface at time t (min). The adsorption rate constant, k1 and qe were calculated from the plot of log(qe − qt) vs t, Figure 7(a), and are listed in Table 3.

Z. M. Abou-Gamra, M. A. Ahmed
382
(a)
(b)
(c)

Z. M. Abou-Gamra, M. A. Ahmed
383
(d)
(e)
Figure 7. Kinetic plots for adsorption of malachite green on TiO2 surface. (a) Pseudo first order plot, (b) pseudo second order plot, (c) intraparticle plot, (d) Elovich plot, (e) Reichenberg plot.
22
1
t ee
t tq qk q
= +
where, k2 (g∙mg−1∙min−1) is pseudo second order rate constant. The plot of t/qt vs t is shown in Figure 7(b). The values of qe and k2 are listed in Table 3. Although correlation coefficient of pseudo first order kinetics (0.988) is not lower than that of second order kinetics (0.999) but qe calculated from plot (6.369) is more consistent with qexp (6.25). Consequently pseudo second order kinetics is fitted.
Intraparticle diffusion The limiting step in dye adsorption may be either the boundary film formation or intraparticle (pore) diffusion
of the dye on the solid surface from bulk of solution. Weber and Morris explain the diffusion mechanism through the following equation [26]
1 2t idq k t C= +
C (mg∙g−1) is the intercept that its value provides information about the thickness of boundary layer. kid is intraparticle diffusion rate constant (mg∙g−1∙min−0.5) which are evaluated from the intercept and slope of plot qt
Z. M. Abou-Gamra, M. A. Ahmed
384
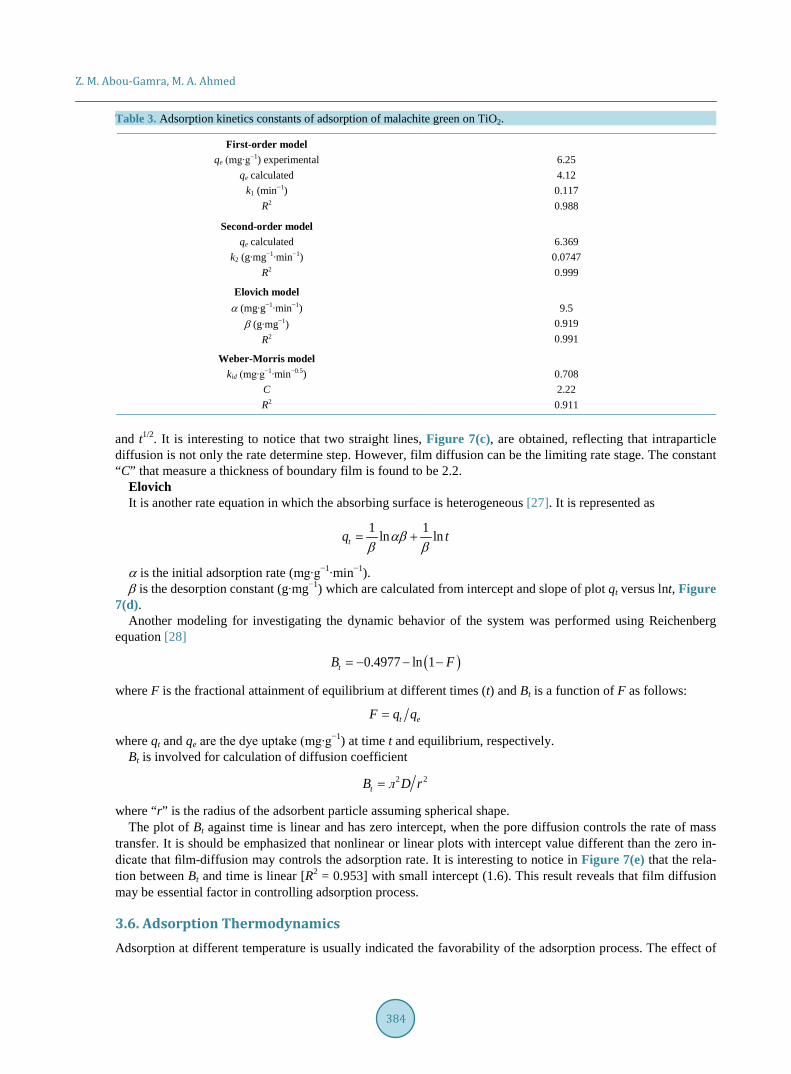
Table 3. Adsorption kinetics constants of adsorption of malachite green on TiO2.
First-order model qe (mg∙g−1) experimental
qe calculated k1 (min−1)
R2
6.25 4.12 0.117 0.988
Second-order model qe calculated
k2 (g∙mg−1∙min−1) R2
6.369
0.0747
0.999
Elovich model α (mg∙g−1∙min−1)
β (g∙mg−1) R2
9.5
0.919 0.991
Weber-Morris model kid (mg∙g−1∙min−0.5)
C R2
0.708 2.22 0.911
and t1/2. It is interesting to notice that two straight lines, Figure 7(c), are obtained, reflecting that intraparticle diffusion is not only the rate determine step. However, film diffusion can be the limiting rate stage. The constant “C” that measure a thickness of boundary film is found to be 2.2.
Elovich It is another rate equation in which the absorbing surface is heterogeneous [27]. It is represented as
1 1ln lntq tαββ β
= +
α is the initial adsorption rate (mg∙g−1∙min−1). β is the desorption constant (g∙mg−1) which are calculated from intercept and slope of plot qt versus lnt, Figure
7(d). Another modeling for investigating the dynamic behavior of the system was performed using Reichenberg
equation [28]
( )0.4977 ln 1tB F= − − −
where F is the fractional attainment of equilibrium at different times (t) and Bt is a function of F as follows:
t eF q q=
where qt and qe are the dye uptake (mg∙g−1) at time t and equilibrium, respectively. Bt is involved for calculation of diffusion coefficient
2 2tB л D r=
where “r” is the radius of the adsorbent particle assuming spherical shape. The plot of Bt against time is linear and has zero intercept, when the pore diffusion controls the rate of mass
transfer. It is should be emphasized that nonlinear or linear plots with intercept value different than the zero in-dicate that film-diffusion may controls the adsorption rate. It is interesting to notice in Figure 7(e) that the rela-tion between Bt and time is linear [R2 = 0.953] with small intercept (1.6). This result reveals that film diffusion may be essential factor in controlling adsorption process.
3.6. Adsorption Thermodynamics Adsorption at different temperature is usually indicated the favorability of the adsorption process. The effect of

Z. M. Abou-Gamra, M. A. Ahmed
385
temperature on the dye adsorption onto TiO2 nanoparticles was studied. The obtained data showed that the ad-sorption capacity increased with increasing the temperature from 308 K to 318 K, Figure 8, indicating the en-dothermic nature of dye adsorption [29] [30]. Thermodynamic parameters such as, free energy change (∆G˚), enthalpy (∆H˚) and entropy (∆S˚) were evaluated to confirm the nature of adsorption of malachite green on TiO2 nanoparticles. Thermodynamic parameters were calculated by the Van’t Hoff equation
lno o
eH SK
RT R∆ ∆
= − +
From the slope and intercept of Van’t Hoff plot, the value of ∆H˚ and ∆S˚ was calculated. The Gibbs free energy change ∆G˚ was calculated using the following equation and are listed in Table 4.
lnoeG RT K∆ = −
The positive values of ∆H˚ and ∆S˚ show that the adsorption process is endothermic with increasing the ran-domness of the system [31]. The negative value of free energy indicates that the adsorption process is spontaneous. Moreover, the value of free energy became more negative with raise in temperature suggesting that the adsorption became more favorable at higher temperatures. This is similar to results reported earlier [30].
4. Photodegradation of Malachite Green Dye TiO2 nanoparticles showed high efficiency of removing malachite green dye, about 65% of dye removed through 30 minute in dark. Mercury lamp 254 nm used to remove the remaining dye. Irradiation of 16.77 mg∙L−1 of dye in presence of 0.1 g TiO2/100 ml, removal % increased from 65% to 80%, Figure 9.
Figure 8. Effect of temperature on adsorption capacity of malachite green onto TiO2 surface.
Table 4. Thermodynamic parameters for the adsorption of malachite green on TiO2.
Temperature (K) Ke Thermodynamic parameters
∆G˚ (kJ∙mol−1) ∆H˚ (kJ∙mol−1) ∆S˚ (J∙mol−1∙K−1)
308
313
318
2.31
2.64
2.91
−2.14
−2.52
−2.82
19 68
11.711.811.9
1212.112.212.312.412.512.612.7
306 308 310 312 314 316 318 320T / K
q e/ m
g∙g-1

Z. M. Abou-Gamra, M. A. Ahmed
386
Figure 9. Effect of light on the removal of malachite green onto TiO2 surface.
5. Conclusion The results obtained in this research reflect the potentiality of TiO2 nanosphere as an excellent adsorbent for re-moval of malachite green dye. The structure, crystalline and morphology feature of TiO2 nanoparticles were in-vestigated using XRD and TEM techniques. The influence of reaction parameters as initial dye concentration, temperature, catalyst dosage and shaking time on dye adsorption was investigated. The strong adsorption ability of the TiO2 nanoparticles is ascribed to the electrostatic attractions between negative surface of the metal oxide and the cationic dyes. TEM results reflect the existence of spherical nanoparticles of high surface area that can involve in removal of large number of dye molecules. Spherical TiO2 nanoparticles can be considered a good candidate for adsorption and removal of various organic pollutants.
References [1] Rafatullah, M., Sulaiman, O., Hashim, R. and Ahmad, A. (2010) Adsorption of Methylene Blue on Low-Cost Adsor-
bents: A Review. Journal of Hazardous Materials, 177, 70-80. http://dx.doi.org/10.1016/j.jhazmat.2009.12.047 [2] Li, J., Feng, J. and Yan, W. (2013) Excellent Adsorption and Desorption Characteristics of Polypyrrole/TiO2 Compo-
site for Methylene Blue. Applied Surface Science, 279, 400-408. http://dx.doi.org/10.1016/j.apsusc.2013.04.127 [3] Gong, R., Ding, Y., Li, M., Yang, C., Liu, C. and Sun, Y. (2005) Utilization of Powdered Peanut Hull as Biosorbent
for Removal of Anionic Dyes from Aqueous Solution. Dyes and Pigments, 64, 187-192. http://dx.doi.org/10.1016/j.dyepig.2004.05.005
[4] Sarmah, S. and Kumar, A. (2011) Photocatalytic Activity of Polyaniline-TiO2 Nanocomposites. Indian Journal of Physics, 85, 713-726. http://dx.doi.org/10.1007/s12648-011-0071-1
[5] Culp, S.J. and Beland, F.A. (1996) Malachite Green: A Toxicological Review. International Journal of Toxicology, 15, 219-238. http://dx.doi.org/10.3109/10915819609008715
[6] Srivastava, S., Rangana, S. and Roy, D. (2004) Toxicological Effects of Malachite Green. Aquatic Toxicology, 66, 319- 329. http://dx.doi.org/10.1016/j.aquatox.2003.09.008
[7] Papinutti, L., Mouso, N. and Forchiassin, F. (2006) Removal and Degradation of the Fungicide Dye Malachite Green from Aqueous Solution Using the System Wheat Bran-Fomes Sclerodermeus. Enzyme and Microbial Technology, 39, 848-853. http://dx.doi.org/10.1016/j.enzmictec.2006.01.013
[8] Dogan Uluozlu, O., Sari, A., Tuzen, M. and Soylak, M. (2008) Biosorption of Pb(II) and Cr(III) from Aqueous Solu-tion Bylichen (Parmelina tiliaceae) Biomass. Bioresource Technology, 99, 2972-2880.

Z. M. Abou-Gamra, M. A. Ahmed
387
http://dx.doi.org/10.1016/j.biortech.2007.06.052 [9] Gupta, V.K., Jain, R., Mittal, A., Saleh, T.A., Nayak, A., Agarwal, S. and Sikarwar, S. (2012) Photo-Catalytic Degra-
dation of Toxic Dye Amaranth on TiO2/UV in Aqueous Suspensions. Materials Science and Engineering: C, 32, 12-17. http://dx.doi.org/10.1016/j.msec.2011.08.018
[10] Hu, A., Liang, R. Zhang, X., Kurdi, S., Luong, D., Huang, H., Peng, P., Marzbanrad, E., Oakes, K.D., Zhou, Y. and Servos, M.R. (2013) Enhanced Photocatalytic Degradation of Dyes by TiO2 Nanobelts with Hierarchical Structures. Journal of Photochemistry and Photobiology A: Chemistry, 256, 7-15. http://dx.doi.org/10.1016/j.jphotochem.2013.01.015
[11] Chen, X. and Mao, S.S. (2007) Titanium Dioxide Nanomaterials: Synthesis, Properties, Modifications and Applica-tions. Chemical Reviews, 107, 2891-2959. http://dx.doi.org/10.1021/cr0500535
[12] Ahmed, M.A. (2012) Synthesis and Structural Feature of Mesoporous NiO/TiO2 Nanocomposites Prepared by Sol-Gel Method for Photodegradation of Methylene Blue Dye. Journal of Photochemistry and Photobiology A: Chemistry, 238, 63-70. http://dx.doi.org/10.1016/j.jphotochem.2012.04.010
[13] Ahmed, M.A., El-Katori, E.E. and Gharni, Z.H. (2013) Photocatalytic Degradation of Methylene Blue Dye Using Fe2O3/TiO2 Nanoparticles Prepared by Sol-Gel Method. Journal of Alloys and Compounds, 553, 19-29. http://dx.doi.org/10.1016/j.jallcom.2012.10.038
[14] Ahmed, M.A., Abdel-Messih, M.F. and El-Sayed, A.S. (2013) Photocatalytic Decolorization of Rhodamine B Dye Using Novel Mesoporous SnO2-TiO2 Nano Mixed Oxides Prepared by Sol-Gel Method. Journal of Photochemistry and Photobiology A: Chemistry, 260, 1-8. http://dx.doi.org/10.1016/j.jphotochem.2013.03.011
[15] Ismail, A.A. (2012) Facile Synthesis of Mesoporous Ag-Loaded TiO2 Thin Film and Its Photocatalytic Properties. Mi-croporous and Mesoporous Materials, 149, 69-75. http://dx.doi.org/10.1016/j.micromeso.2011.08.030
[16] Habibi, M.H., Hassanzadeh, A. and Mahdavi, S. (2005) The Effect of Operational Parameters on the Photocatalytic Degradation of Three Textile Azo Dyes in Aqueous TiO2 Suspensions. Journal of Photochemistry and Photobiology A: Chemistry, 172, 89-96. http://dx.doi.org/10.1016/j.jphotochem.2004.11.009
[17] Gautam, S., Kamble, S.P., Sawant, S.B. and Pangarkar, V.G. (2005) Photocatalytic Degradation of 4-Nitroaniline Us-ing Solar and Artificial UV Radiation. Chemical Engineering Journal, 110, 129-137. http://dx.doi.org/10.1016/j.cej.2005.03.021
[18] Fan, L., Zhang, Y., Li, X., Luo, C., Lu, F. and Qiu, H. (2012) Removal of Alizarin Red from Water Environment Using Magnetic Chitosan with Alizarin Red as Imprinted Molecules. Colloids and Surfaces B: Biointerfaces, 91, 250-257. http://dx.doi.org/10.1016/j.colsurfb.2011.11.014
[19] Deniz, A., Arzu, Y. and Ufuk, G. (2015) Synthesis of Magnetic Fe3O4-Chitosan Nanoparticles by Ionic Gelation and Their Dye Removal Ability. Water Environment Research, 87, 425-436. http://dx.doi.org/10.2175/106143014X14062131178673
[20] Langmuir, I. (1918) The Adsorption of Gases on Plane Surfaces of Glass, Mica and Platinum. Journal of the American Chemical Society, 40, 1361-1403. http://dx.doi.org/10.1021/ja02242a004
[21] Freundlich, H.M.F. (1906) Over the Adsorption in Solution. The Journal of Physical Chemistry, 57, 385-471. [22] Temkin, M.J. and Pyzhev, V. (1940) Recent Modifications to Langmuir Isotherms. Acta Physiochim URSS, 12, 217-
225. [23] Dubinin, M.M. (1965) Modern State of the Theory of Volume Filling of Micropore Adsorbents during Adsorption of
Gases and Steams on Carbon Adsorbents. Zhurnal Fizicheskoi Khimii, 39, 1305-1317. [24] Lagergren, S. (1898) Zur theorie der sogenannten adsorption gelöster stoffe, Kungliga Svenska Vetenskapsakademiens.
Handlingar, 24, 1-39. [25] Ho, Y.S. and McKay, G. (1999) Pseudo-Second-Order Model for Sorption Processes. Process Biochemistry, 34, 451-
465. http://dx.doi.org/10.1016/S0032-9592(98)00112-5 [26] Weber, W.J. and Morris, J.C. (1963) Kinetics of Adsorption of Carbon from Solution. Journal of the Sanitary Engi-
neering Division, American Society of Civil Engineering, 89, 31-60. [27] Chien, S.H. and Clayton, W.R. (1980) Application of Elovich Equation to the Kinetics of Phosphate Release and Sorp-
tion in Soils. Soil Science Society of America Journal, 44, 265-268. http://dx.doi.org/10.2136/sssaj1980.03615995004400020013x
[28] Reichenberg, D. (1953) Properties of Ion-Exchange Resins in Relation to Their Structure. III. Kinetics of Exchange. Journal of the American Chemical Society, 75, 589-597. http://dx.doi.org/10.1021/ja01099a022
[29] Ghaedi, M. (2012) Comparison of Cadmium Hydroxide Nanowires and Silver Nanoparticles Loaded on Activated Carbon As New Adsorbents for Efficient Removal of Sunset Yellow: Kinetics and Equilibrium Study. Spectrochimica Acta Part A: Molecular and Biomolecular Spectroscopy, 94, 346-351. http://dx.doi.org/10.1016/j.saa.2012.02.097

Z. M. Abou-Gamra, M. A. Ahmed
388
[30] Venkatesha, T.G., Nayaka, Y.A. and Chethana, B.K. (2013) Adsorption of Ponceau S from Aqueous Solution by MgO Nanoparticles. Applied Surface Science, 276, 620-627. http://dx.doi.org/10.1016/j.apsusc.2013.03.143
[31] Ahmed, I.M. and Gasser, M.S. (2012) Adsorption Study of Anionic Reactive Dye from Aqueous Solution to Mg-Fe- CO3 Layered Double Hydroxide (LDH). Applied Surface Science, 259, 650-656. http://dx.doi.org/10.1016/j.apsusc.2012.07.092