Tinton Falls Boro - New Jersey · that are within Tinton Falls Boro. The individual noncommunity...
105
Noncommunity Source Water Assessment Report For Tinton Falls Boro Monmouth, County Richard J. Codey Acting Governor State of New Jersey Bradley M. Campbell, Commissioner Department of Environmental Protection Lisa Jackson, Assistant Commissioner Land Use Management Michele Mateo Putnam, Director Division of Water Supply Barker Hamill, Acting Assistant Director Water Supply Operations 401 E. State Street PO Box 426 Trenton, New Jersey 08625-0426 (609) 292-5550 April 2005
Transcript of Tinton Falls Boro - New Jersey · that are within Tinton Falls Boro. The individual noncommunity...
Noncommunity Source Water Assessment ReportFor
Tinton Falls Boro
Monmouth, County
Richard J. CodeyActing Governor
State of New Jersey
Bradley M. Campbell, CommissionerDepartment of Environmental Protection
Lisa Jackson, Assistant CommissionerLand Use Management
Michele Mateo Putnam, DirectorDivision of Water Supply
Barker Hamill, Acting Assistant DirectorWater Supply Operations
401 E. State StreetPO Box 426
Trenton, New Jersey 08625-0426(609) 292-5550
April 2005

I
HOW TO USE THIS SOURCE WATER ASSESSMENT REPORT
The following outlines the source water assessment report and directs you to general and/ornoncommunity water system specific information.
Source Water Assessment Executive SummaryA summary of the Source Water Assessment Program and the susceptibility results statewidefor noncommunity water systems. This summary also provides the susceptibility ratings forthe noncommunity water systems’ source(s) within the municipality.
The first three sections of the report contain general information; the last section is specificfor the individual noncommunity water system(s) within the municipality.
Section I: Background Information on Drinking Water Systems page 1General information on types of public drinking water systems (community andnoncommunity) and sources of drinking water. The number of public water systems, wells,and surface water intakes in New Jersey is provided.
Section II: Source Water Assessment Program Overview page 7An introduction to the Source Water Assessment Program and its goals.
Section III: Source Water Assessment Program Steps page 10A description of the steps the Department of Environmental Protection (DEP) conducted toassess drinking water source(s) susceptibility to potential contamination. The contaminantcategories of concern and the potential contaminant sources found to be significant indetermining susceptibility (reffered to as explanatory variables) for the Source WaterAssessment Program are included in this section. Table 5 provides the percentage of publicnoncommunity water system sources in New Jersey that rated high, medium, and low foreach of the contaminant categories.
Section IV: Noncommunity Public Water System Individual Source Water AssessmentReports (arranged by PWID) page 25The DEP developed a separate report for each noncommunity water system. This section ofthe report contains all of the noncommunity water system source water assessment reportsthat are within Tinton Falls Boro. The individual noncommunity source water assessmentreports contain general information regarding the program (similar to the information inSection I through III), susceptibility ratings for the system’s source(s), an inventory of thepotential contaminant sources used to determine the sources’ susceptibility, and a mapillustrating the source water assessment areas. The map is municipality based; therefore themap is not specific to the system. If a noncommunity water system is interested in obtaininga map specific to its source water assessment area, contact the Bureau of Safe DrinkingWater at 609-292-5550.
Appendix A contains additional specific information for the noncommunity water systems.Appendix A consists of tables and information relating to the susceptibility ratingdetermination for the system’s sources. These items include:

II
Contaminant Category Scoring System - Attachment 1A series of tables illustrating how the rating score is determined for a source. This documentis divided into surface water and ground water sections and provides a table(s) for each ofthe contaminant categories. Using these rating score tables and the Individual ExplanatoryVariable Inventory, the numerical susceptibility rating score can be determined. This ratingscore was then converted into a high, medium, or low susceptibility rating. (The susceptibilityrating score conversions are also provided.)
Source Water Assessment Area Map - Attachment 2A map illustrating the source water assessment areas for the Noncommunity water system’ssources (wells and surface water intakes) within the municipality. If a noncommunity watersystem is interested in obtaining a map specific to its source water assessment area, it maycontact the Bureau of Safe Drinking Water at 609-292-5550
Appendix B contains documents that further explain the procedures taken to determinesusceptibility of public drinking water sources. These documents contain informationaddressing the three steps of a source water assessment: develop a source waterassessment area, inventory the potential contaminant sources, and determine susceptibilityto potential contaminant sources.
Appendix C contains materials to assist in understanding the source water assessment reportand contact information for further questions.

SOURCE WATER ASSESSMENT
Executive Summary
As a requirement of the 1996 Amendments to the Safe Drinking Water Act, New JerseyDepartment of Environmental Protection (DEP) performed a source water assessment ofeach source of public drinking water and determined each source’s susceptibility tocontamination. Susceptibility is a measure of the potential exposure of a drinking watersource to contamination.
Approximately 85 to 90 percent of New Jersey’s population receive their drinking water frompublic water systems. These public water systems are highly regulated and perform routinemonitoring for the presence of contaminants. In 2003, 606 public community water systemsconsisting of 2237 wells and 64 surface water sources served approximately 7.5 million NewJersey residents. In addition, the public was served by 3685 public noncommunity watersystems through establishments such as: schools, hospitals, restaurants, office buildings,and rest stops that have their own drinking water source.
DEP, in conjunction with the United States Geological Survey (USGS), performed thefollowing steps to determine the drinking water sources’ susceptibility.
• Identified the area that supplies water to a public drinking water system well or surfacewater intake (known as the source water assessment area). For ground water sources,this area is also known as the well head protection area.
• Inventoried the significant potential sources of contamination within the source waterassessment area.
• Determined how susceptible each drinking water source is to contamination.
Susceptibility to the following categories of contamination was determined:
• Pathogens• Nutrients (nitrates)• Pesticides• Volatile Organic Compounds (VOCs)• Inorganics• Radionuclides• Radon• Disinfection Byproduct Precursors (DBPs)
To determine susceptibility to these contaminants, the USGS, with DEP assistance,developed statistical models based on extensive analysis of existing well sample data andsurface water intake data. The statistical models determined the relationship betweenenvironmental factors and the probability for contamination to occur. These models identifiedfactors, such as land use or geology, found to be significantly “linked” to a public watersystem source’s potential to become contaminated by one or more categories ofcontaminants. DEP and USGS looked at factors that might affect the quality of drinking watersources and separated them into two categories.
2
The first category consists of sensitivity factors, which includes items related to theconstruction of a well (such as whether the well is in a confined or unconfined aquifer) andnaturally occurring factors (such as the geology of the unit in which a well is drawing waterfrom or over which water flows to the surface water intake).
Significant Sensitivity Factors• Confinement status: For ground water, the confinement status of the well was by far the
most frequently occurring sensitivity factor in predicting susceptibility to contamination andin fact was a factor in all the models. Confined wells are protected from activities at theland surface by relatively thick, laterally extensive units of low permeability (clay layers)and are a sufficient distance from the outcrop area of the geologic unit so that the sourcewater is less likely to be affected by contamination at the land surface. Confined wellswere determined to be of low susceptibility to contamination occurring at the land surface.Some confined wells, however, are susceptible to contaminants of natural subsurfaceorigin. In 2003, there were no confined noncommunity water system wells.
• Depth to the top of the open interval: For unconfined wells, depth to the top of the openinterval of the well was the most common sensitivity factor to affect the potential forcontamination of a well. Depth to top of open interval was found to be a factor in thefollowing five models: pathogens, nutrients, pesticides, inorganics, and radon. Theshorter the distance to the land surface, the more likely for the well to be affected bycontamination originating at the surface from point sources and certain land uses.
• Percent soil organic matter: For surface water and ground water, percent soil organicmatter was found to be a frequently occurring sensitivity factor. Percent soil organicmatter was a factor in the VOC, inorganic, and disinfectant byproduct precursor modelsfor both the surface water and ground water susceptibility models.
The second category of factors affecting a source’s potential to become contaminatedconsists of intensity of use factors. This category addresses the susceptibility tocontamination resulting from human activities at the land surface. Intensity of use factorsinclude those coming from a specific point source, such as a landfill or leaking undergroundstorage tank, and nonpoint sources of contamination grouped by land-use characteristics,such as agriculture or urban land use.
Significant Intensity of Use Factors
Nonpoint SourcesOverall, the results of the modeling performed by USGS show that of the nonpoint sources,factors related to urban land use and agricultural land use, were most often linked tosusceptibility of drinking water sources to contamination.• Surface water: factors related to urban land use from the 1995 coverage (including
percentage of commercial/industrial land use, percentage of developed land, percentageof residential land) were important in predicting a source’s susceptibility for fourcontaminant groups, specifically nutrients, pesticides, VOCs, and inorganics. Agriculturalland use was found to be a significant factor in three of the surface water models -nutrients, pesticides, and inorganics.
• Ground water: factors related to urban land use from both 1970 and 1995 were importantin predicting the susceptibility of source water for five of the models - nutrients, pesticides,VOCs, inorganics and radionuclides. Agricultural land use in 1970 and 1995 coverages

3
were factors in six of the ground water models: pathogens, nutrients, pesticides,radionuclides, radon, and inorganics.
Point Sources• Surface water: factors related to New Jersey Pollutant Discharge Elimination System
/Discharge to Surface Water (NJPDES/DSW) permits and sewage treatment plant densitywere found most often to be important factors, specifically for the nutrients, VOCs, andinorganics susceptibility models. NJPDES stormwater permitted locations, compostfacilities, sites on DEP’s Known Contaminated Site List (KCSL) and solid waste landfillswere found to be factors in two of the models: VOCs and inorganics.
• Ground water: point sources were found to be significant only in the models for VOC,inorganics, and disinfection byproduct precursors. No point sources were found to beimportant in the models for pathogens, nutrients, pesticides, radionuclides, and radon.
The specific sensitivity and intensity of use factors for each drinking water source areprovided in this Source Water Assessment Report in Tables 2, 3, and 4.
Using the susceptibility factors, the statistical models provided numerical ratings for eachsource of drinking water for each contaminant category, which were then converted into high(H), medium (M), or low (L) susceptibility ratings.
The Safe Drinking Water Standards or Maximum Contaminant Levels (MCLs) were used todefine the three susceptibility ratings (H, M, and L). These standards are developed basedhealth effects, analytical and treatment factors on either acute or long-term impacts related todrinking water exposure. A low susceptibility rating means a potential contaminant level waspredicted to be less than 10 percent of the MCL for that contaminant category. A mediumrating was given to drinking water sources where the potential contaminant level waspredicted to be equal to or greater than 10 percent and less than 50 percent of the MCL. Ahigh rating was assigned to those sources that were predicted to have potential contaminantlevels equal to or greater than 50 percent of the MCL. Sources with high susceptibility ratingsare still likely to have contaminant concentrations below the MCL. For the list of New Jerseyprimary and secondary drinking water standards, containing the MCLs, please refer tohttp://www.state.nj.us/dep/watersupply/standard.htm.
In some cases, insufficient data for particular supplies were available for all variables used insusceptibility models. In such cases, a default value for missing data was assumed. Use ofdefault values could result in a different susceptibility rating than that which would result if thesource-specific data were available.
Statewide SummaryTable E1 illustrates the percentage of noncommunity water system sources in New Jerseythat rated high, medium, and low for each of the contaminant categories. The table isseparated by source type: ground water and surface water.

4
Table E1: Summary of Statewide Susceptibility Ratings for Noncommunity WaterSystem Sources (Percent %)
Path
ogen
s
Nut
rient
s
Pest
icid
es
VOC
s
Inor
gani
cs
Rad
ionu
clid
es
Rad
on
DB
Ps
GroundWater
3480 WellsHigh 2 0 0 32 19 69 17 3
Medium 18 66 66 0 42 28 72 97Low 80 34 34 68 39 3 11 0
SurfaceWater
3 IntakesHigh 1001 33 0 0 100 0 0 100
Medium 0 67 67 33 0 0 0 0Low 0 0 33 67 0 1001 1001 0
1All surface water intakes received high susceptibility ratings for pathogens and lowsusceptibility rating for radionuclides and radon
For the purpose of the source water assessments, the drinking water derived from all surfacewater intakes was assumed to be highly susceptible to contamination by pathogens.Therefore, all surface water intakes received a high rating for pathogens (100 percent).Surface water sources are subject to various sources of microbial contamination runoffcontaining fecal matter. Secondly, radionuclide and radon models for surface water were notdeveloped. Radionuclides are primarily a concern of ground water, therefore, all surfacewater intakes received a low susceptibility rating for radionuclides and radon (0 percent).
Statewide, 85 percent of the noncommunity water system sources (ground water and surfacewater) rated high for at least one of the contaminant categories.
For surface water, the three contaminant categories in which all of the noncommunity watersystem surface water intakes (three total) received a high susceptibility rating wereinorganics, disinfection byproduct precursors, and pathogens (all assumed to be highlysusceptible to pathogens). In fact, a high percentage of community water system surfacewater intakes were found to be highly susceptible to the same contaminant categories.Eighty-one percent of community water system surface water intakes were found to be highlysusceptible to inorganics and 98% were found to be highly susceptible to disinfectionbyproduct precursors.
For ground water, the three contaminant categories in which the highest percentage ofsources received a high susceptibility rating are radionuclides (69%), volatile organiccompounds (32%), and inorganics (19%). When reviewing the results of the mediumsusceptibility ratings for noncommunity water system wells, the three contaminant categories

5
in which a high percentage of the wells rated medium are disinfection byproduct precursors(97%), radon (72%), pesticides and nutrients (both 66%).
Summary of Noncommunity Water Systems’ Sources within Tinton Falls BoroTinton Falls Boro consists of 9 noncommunity water systems, consisting of 10 wells, and 0surface water intake(s). (The water system data used for the development of theoriginal drinking water source inventory was compiled in the summer of 2003.)
Table E2 provides a summary of the susceptibility ratings for the noncommunity watersystems within Tinton Falls Boro. The first column provides the public water system’sidentification number (PWID) and the second column provides the name of the system and itssource(s) (when available). The remaining columns provide the susceptibility ratings to eachcontaminant category for the source(s). A total of each of these ratings (overall susceptibilityratings) is provided at the bottom of the table.

Table E2: Summary of Susceptibility Ratings forNoncommunity Drinking Water Source(s) within Tinton Falls Boro
PWID System Name / SourceName
Path
ogen
s
Nut
rient
s
Pest
icid
es
VOC
s
Inor
gani
cs
Rad
ionu
clid
es
Rad
on
DB
Ps
H M L H M L H M L H M L H M L H M L H M L H M L
1336300 The Royal Inn 0 0 1 0 1 0 0 1 0 0 0 1 0 1 0 1 0 0 0 0 1 0 1 01336302 Luigi's Tavern 0 0 1 0 1 0 0 1 0 0 0 1 0 1 0 0 1 0 0 0 1 0 1 01336303 Tally Ho Inn 0 0 1 0 0 1 0 0 1 0 0 1 0 1 0 1 0 0 0 1 0 0 1 01336305 7-11 STORE 0 0 1 0 1 0 0 1 0 0 0 1 1 0 0 1 0 0 0 1 0 0 1 0
1336308 Tinton Falls ConvalescentCenter 0 0 2 0 0 2 0 0 2 2 0 0 0 2 0 2 0 0 0 0 2 0 2 0
1336309 World Volkswagon 0 0 1 0 0 1 0 0 1 1 0 0 0 1 0 1 0 0 0 1 0 0 1 01336312 Executive Inn 0 0 1 0 1 0 0 1 0 0 0 1 0 1 0 1 0 0 0 0 1 0 1 01336315 Martin Motel 0 0 1 0 1 0 0 1 0 0 0 1 0 1 0 1 0 0 0 0 1 0 1 01336316 Carton Et Als Legal Offices 0 0 1 0 1 0 0 1 0 1 0 0 0 0 1 1 0 0 0 1 0 0 1 0
Total for Tinton Falls Boro 0 0 10 0 6 4 0 6 4 4 0 6 1 8 1 9 1 0 0 4 6 0 10 0

If a drinking water source’s susceptibility is high, it does not necessarily mean the drinkingwater is contaminated. The rating reflects the potential for contamination of source water, notthe existence of contamination.
Under the State’s Safe Drinking Water Regulations, all public noncommunity water systemsmust routinely monitor for contamination. If MCLs (drinking water standards) are exceeded,the noncommunity water system must immediately post a notice of failure in a placeconspicuous to consumers until the system is compliant.
The Source Water Assessment Program was designed to encourage protection of drinkingwater sources by providing information to state and local regulatory agencies and the publicto assist in watershed assessment and planning and to enhance the public’s role as “waterstewards.” The results provide information to allow state and local agencies to determine ifincreased regulatory controls, including local land use ordinances, are warranted. In addition,the basic data gathered through the Source Water Assessment Program, including thelocations of the public water system wells and surface water sources, will be available forDEP program use in efforts to improve environment regulatory actions, such as cleanupdecisions in the hazardous and solid waste programs. For more information on DEP’sSource Water Protection efforts please see the Statewide Summary Document available atwww.state.nj/us/dep/swap.
For further information please refer to the detailed information in this Source WaterAssessment Report or go to www.state.nj/us/dep/swap.

Acknowledgements
The New Jersey Department of Environmental Protection would like to take this opportunity toacknowledge and thank the individuals who contributed to the Source Water Assessment Program.
The Department of Environmental Protection’s Division of Water Supply, New Jersey GeologicalSurvey, and Division of Science, Research and Technology prepared the source water assessmentsin cooperation with the United States Geological Survey.
Division of Water SupplyEdward ApalinskiPatricia BonoKaren FellBarker Hamill
Sandra KrietzmanMyongsun KongMike MatthewsDiane Pupa
Michele PutnamLinda WalshKristin Zams
New Jersey Geological SurveySteve JohnsonBill Mennel
Ted PallisSteve Spayd
Division of Science, Research and TechnologyGail CarterBranden JohnsonJudy Louis
Watershed ManagementRobert KecskesTom McKee
Policy and PlanningElizabeth Semple
United States Geological SurveyDebra BuxtonJessica Hopple
Robert NicholsonSteven Nieswand
Donald StorckEric Vowinkel
Source Water Assessment Advisory CommitteeTom Atherholt, NJDEP, DSRTJim Blando, NJ Department of Health and SeniorServicesPaul Britt, NJ Water AssociationDave Brogle, Middlesex Water CompanyPerry Cohn, NJ Department of Health and SeniorServicesRay Cywinski, United WaterJoe Deckelmick, NJ Environmental FederationKevin Dixon, NJ American Water CompanyRon Farr, North Jersey District Water SupplyCommissionAmy Goldsmith, NJ Environmental FederationRobert Hordon, Rutgers UniversityRick Howlett, NJ Water AssociationWilliam Hutchinson, Southeast Morris County MUAMark Impomeni, Bergen County HealthLendel Jones, NJ American Water CompanyRobert Karl, Brick Township MUA
Haig Kasabach, Hamilton TownshipGeoff Knapp, Morris CountyAnne Kruger, Passaic River CoalitionLeo Kruger, Passaic River CoalitionLouisa Lubiak, Passaic River CoalitionFrank Marascia, Elizabethtown Water CompanyPeder Nesse, NJ Water AssociationJohn Paschal, Morris County Board of AgricultureDave Pringle, NJ Environmental FederationDavid Sayers, Delaware River Basin CommissionPaul Scelsi, NJ Department of TransportationCarol Storms, NJ American Water CompanyLouise Usechak, League of Women Voters of NJDan Van Abs, NJ Water Supply AuthorityPeter Weppler, North Jersey District Water SupplyCommissionRick Westergard, Gloucester County PlanningDepartmentRonald Williams, Middlesex Water Company

i
CONTENTS
SECTION I – BACKGROUND INFORMATION ON DRINKING WATER SYSTEMS 1
SOURCES OF DRINKING WATER 2TYPES OF PUBLIC WATER SYSTEMS 3DRINKING WATER TREATMENT 5
SECTION II – SOURCE WATER ASSESSMENT PROGRAM OVERVIEW 7
INTRODUCTION 8SOURCE WATER ASSESSMENT PROGRAM GOALS 8SOURCE WATER ASSESSMENT REPORTS 9
SECTION III – SOURCE WATER ASSESSMENT PROGRAM STEPS 10
STEP 1: DELINEATION 12STEP 2: POTENTIAL CONTAMINANT SOURCE INVENTORY 14STEP 3: SUSCEPTIBILITY DETERMINATION 15STEP 4: PUBLIC PARTICIPATION AND OUTREACH 24
SECTION IV - NONCOMMUNITY PUBLIC WATER SYSTEM INDIVIDUAL SOURCE WATERASSESSMENT REPORTS (ARRANGED BY PWID) 25

ii
APPENDICES
APPENDIX A – SOURCE WATER ASSESSMENT SUSCEPTIBILITY RATING INFORMATION FORTHE NONCOMMUNITY WATER SYSTEM(S)
Attachment 1: Contaminant Category Scoring SystemAttachment 2: Source Water Assessment Map
APPENDIX B – RESOURCE MATERIALS FOR COMPLETEING SOURCE WATER ASSESSMENTSFOR PUBLIC DRINKING WATER SOURCES
Attachment 1: Guidelines for Delineation of Well Head Protection Areas in New JerseyAttachment 2: Surface Water Delineation MethodologyAttachment 3: New Jersey Source Water Assessment Program Potential Contaminant
Source Inventory MethodologyAttachment 4: Methods to Determine the Susceptibility of Source Water to Community and
Noncommunity Water Supplies in New Jersey to ContaminationAttachment 5: Contaminant Group Reports for Ground WaterAttachment 6: Contaminant Group Reports for Surface Water
APPENDIX C – SOURCE WATER ASSESSMENT REPORT MATERIALS
Attachment 1: Source Water Assessment Contact ListAttachment 2: List of AcronymsAttachment 3: Glossary

iii
FIGURES
FIGURE 1: HYDROLOGIC CYCLE AND SOURCES OF DRINKING WATER 3
FIGURE 2: TYPES OF PUBLIC WATER SYSTEMS 4
FIGURE 3: EXAMPLE OF DRINKING WATER TREATMENT 6
FIGURE 4: FLOWCHART OF SOURCE WATER ASSESSMENT PROGRAM PROCESS 11

iv
TABLES
TABLE 1: PUBLIC WATER SYSTEMS IN NEW JERSEY IN 2003 5
TABLE 2: SURFACE WATER EXPLANATORY VARIABLES 19
TABLE 3: GROUND WATER UNCONFINED EXPLANATORY VARIABLES 20
TABLE 4: GROUND WATER CONFINED EXPLANATORY VARIABLES 22
TABLE 5: SUMMARY OF STATEWIDE SUSCEPTIBILITY RATINGS FOR NONCOMMUNITYWATER SYSTEM SOURCES (PERCENT %) 23
1
SECTION I – BACKGROUND INFORMATION ON DRINKING WATER SYSTEMS

2
SECTION I – BACKGROUND INFORMATION ON DRINKING WATER SYSTEMS
This background information is provided to describe how public drinking water systems areregulated and the relationship of these water systems with the Source Water AssessmentProgram. The following section describes sources of drinking water (groundwater and surfacewater), types of drinking water systems according to the Department of EnvironmentalProtection (DEP) and Environmental Protection Agency (EPA) definitions, and drinking watertreatment.
Sources of Drinking Water
1. Ground WaterGround water infiltrates the ground and is stored in aquifers, soil and rock below the surface.Aquifers typically consist of gravel, sandstone, sand, or fractured rock. An aquifer can beconfined or unconfined. A confined aquifer is ground water bounded between impermeablelayers, such as clay. An unconfined aquifer is not bounded by impermeable layers and ismore directly linked to surface activities and resources.
Ground water is obtained from a spring or by pumping water from an aquifer through a well.A well is a hole or excavation that is drilled, bored, core driven, jetted, dug, driven orotherwise constructed for the purpose of removal of water from the subsurface for potablewater supply. Public wells in New Jersey range from 15 to 1,984 feet deep (in 2002).
2. Surface WaterSurface water, is the water at or above the land’s surface, which is neither ground water norcontained within the unsaturated zone, including, but not limited to, the ocean and itstributaries, all springs, streams, rivers, lakes, ponds, wetlands, and artificial waterbodies.
An important link exists between ground water and surface water. Surface water can infiltratethe ground and recharge aquifers. Conversely, ground water slowly moves to the surfaceand discharges into lakes, rivers, or streams and is known as baseflow. New Jersey’s naturalstream flow, especially during periods of low precipitation, is largely baseflow from groundwater.
3
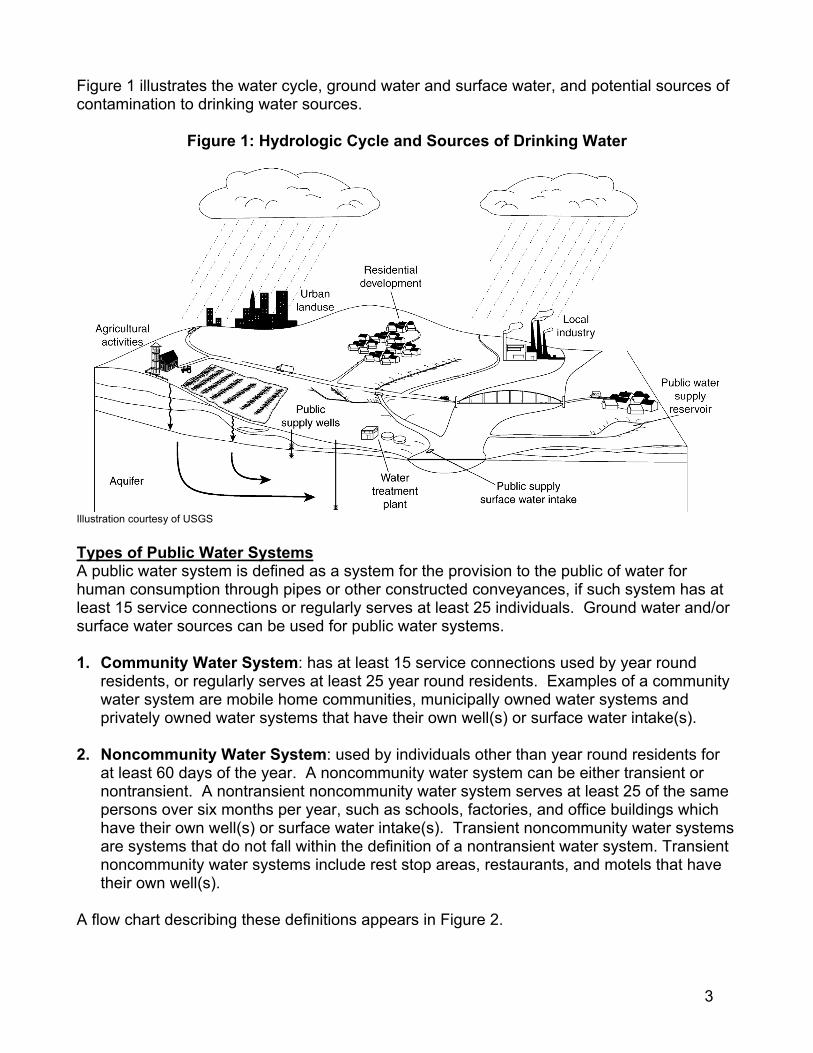
Figure 1 illustrates the water cycle, ground water and surface water, and potential sources ofcontamination to drinking water sources.
Figure 1: Hydrologic Cycle and Sources of Drinking Water
Illustration courtesy of USGS
Types of Public Water SystemsA public water system is defined as a system for the provision to the public of water forhuman consumption through pipes or other constructed conveyances, if such system has atleast 15 service connections or regularly serves at least 25 individuals. Ground water and/orsurface water sources can be used for public water systems.
1. Community Water System: has at least 15 service connections used by year roundresidents, or regularly serves at least 25 year round residents. Examples of a communitywater system are mobile home communities, municipally owned water systems andprivately owned water systems that have their own well(s) or surface water intake(s).
2. Noncommunity Water System: used by individuals other than year round residents forat least 60 days of the year. A noncommunity water system can be either transient ornontransient. A nontransient noncommunity water system serves at least 25 of the samepersons over six months per year, such as schools, factories, and office buildings whichhave their own well(s) or surface water intake(s). Transient noncommunity water systemsare systems that do not fall within the definition of a nontransient water system. Transientnoncommunity water systems include rest stop areas, restaurants, and motels that havetheir own well(s).
A flow chart describing these definitions appears in Figure 2.

4
Figure 2: Types of Public Water Systems
5
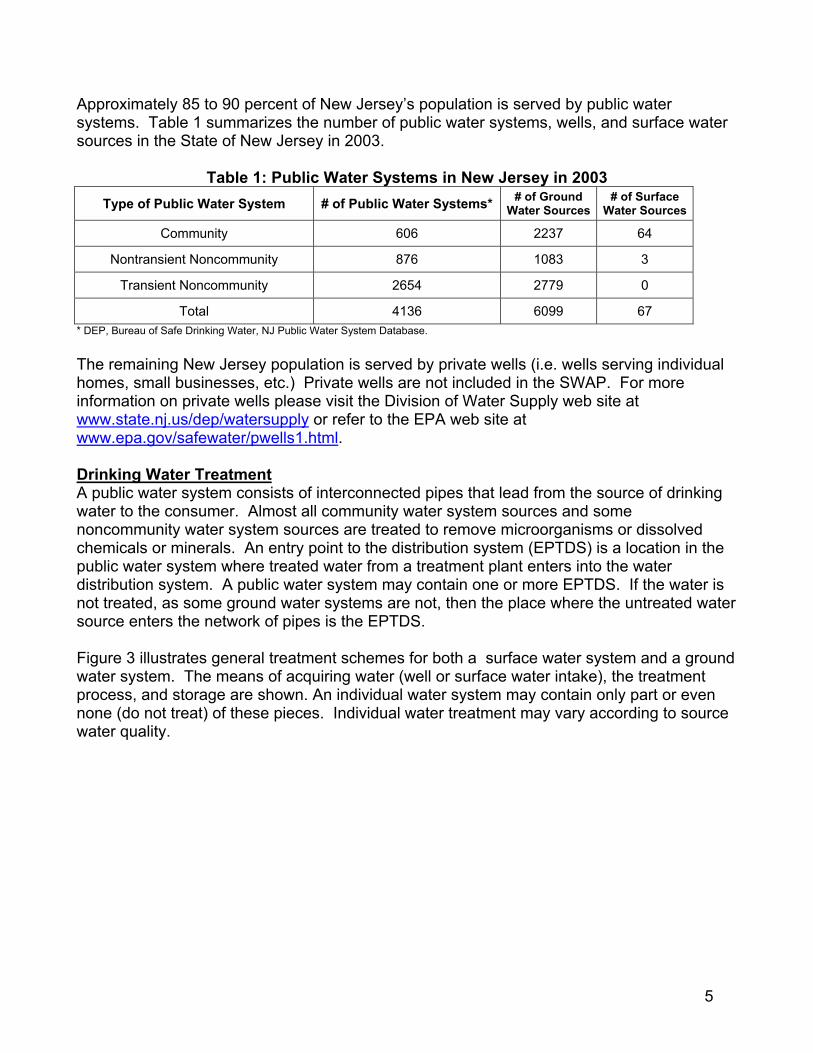
Approximately 85 to 90 percent of New Jersey’s population is served by public watersystems. Table 1 summarizes the number of public water systems, wells, and surface watersources in the State of New Jersey in 2003.
Table 1: Public Water Systems in New Jersey in 2003Type of Public Water System # of Public Water Systems* # of Ground
Water Sources# of Surface
Water Sources
Community 606 2237 64
Nontransient Noncommunity 876 1083 3
Transient Noncommunity 2654 2779 0
Total 4136 6099 67* DEP, Bureau of Safe Drinking Water, NJ Public Water System Database.
The remaining New Jersey population is served by private wells (i.e. wells serving individualhomes, small businesses, etc.) Private wells are not included in the SWAP. For moreinformation on private wells please visit the Division of Water Supply web site atwww.state.nj.us/dep/watersupply or refer to the EPA web site atwww.epa.gov/safewater/pwells1.html.
Drinking Water TreatmentA public water system consists of interconnected pipes that lead from the source of drinkingwater to the consumer. Almost all community water system sources and somenoncommunity water system sources are treated to remove microorganisms or dissolvedchemicals or minerals. An entry point to the distribution system (EPTDS) is a location in thepublic water system where treated water from a treatment plant enters into the waterdistribution system. A public water system may contain one or more EPTDS. If the water isnot treated, as some ground water systems are not, then the place where the untreated watersource enters the network of pipes is the EPTDS.
Figure 3 illustrates general treatment schemes for both a surface water system and a groundwater system. The means of acquiring water (well or surface water intake), the treatmentprocess, and storage are shown. An individual water system may contain only part or evennone (do not treat) of these pieces. Individual water treatment may vary according to sourcewater quality.

6
Figure 3: Example of Drinking Water Treatment
Illustration from “Safeguarding the Quality of Your Drinking Water”, prepared by the Public Information Committee of the NewJersey Section of the American Water Works Association.
7
SECTION II – SOURCE WATER ASSESSMENT PROGRAM OVERVIEW

8
SECTION II – SOURCE WATER ASSESSMENT PROGRAM OVERVIEW
IntroductionThe 1996 Amendments to the Federal Safe Drinking Water Act place a strong emphasis onpublic awareness and the information provided to the public concerning the quality of drinkingwater. As part of the 1996 Amendments, all states were required to establish a Source WaterAssessment Program (SWAP).
Through the SWAP, the DEP evaluated the susceptibility of public water systems to severalcategories of contamination. If a system rates highly susceptible for a contaminantcategory, it does not mean a customer is or will be consuming contaminated drinkingwater. The rating reflects the potential for contamination of source water, not the existenceof contamination. Susceptibility to contamination is a function of several factors, includingcontaminant use near the water source and the characteristics of the water source.
New Jersey’s SWAP Plan, which provides the framework for how DEP performed theassessments, can be found at www.state.nj.us/dep/watersupply/swap1.pdf.
The New Jersey SWAP incorporates four steps:
1. Delineate the source water assessment area of each public drinking water source.2. Inventory the potential contaminant sources within the source water assessment
area.3. Determine the water system’s susceptibility to contaminants.4. Incorporate public participation and education.
Source Water Assessment Program GoalsThe information obtained from the completed source water assessments may be used toachieve the goals listed below.
1. Protect sources of drinking water.The source water assessments provide a susceptibility rating for each source of drinkingwater, which supplies information on how vulnerable the source is to contamination.
Source water protection focuses on preserving and protecting the public drinking watersource. The source water assessment results can be used by DEP, purveyors, and localplanning officials to lay the groundwork for advancing the State’s drinking water protectionefforts. Based on the potential of a drinking water source to become contaminated, DEP caninitiate a variety of activities to protect the drinking water source through existing DEPprograms. For more information regarding DEP’s Source Water Protection Strategy pleaserefer to the Source Water Assessment Program Statewide Summary available on the Divisionof Water Supply’s web site at http://www.state.nj.us/dep/watersupply//.
2. Public education of SWAP information.DEP incorporated public education throughout the development and implementation of theSource Water Assessment Program. During the source water assessment process, DEPspoke to interested parties, beginning with the development of the SWAP Plan, publishedarticles, wrote two newsletters, and developed a SWAP web site. Upon completion of the

9
source water assessments, DEP generated a source water assessment report and/orsummary for each public water system to report the susceptibility ratings.
The goal of the public education efforts is to make the public more aware of the source oftheir drinking water and the potential contaminants that could impair the water's quality. Tocontinue fulfilling the education requirement, DEP will conduct training sessions following therelease of the Source Water Assessment Reports.
3. Establish a customized monitoring schedule for each public water system.The source water assessments will assist DEP in improving current monitoring requirementsfor individual public water systems. Currently, the EPA and the DEP have mandatorymonitoring schedules that depend on a variety of factors that can include the source of thewater (ground water or surface water) and the surrounding land use. These schedules canbe customized based on the susceptibility of the sources of drinking water. The SWAP willprovide better information for making these determinations.
Source Water Assessment ReportsDEP will issue the following reports to public water systems.
1. Community Water System Source Water Assessment Report: primarily intended forthe public water system’s reference and use, although the report is also available to thepublic. Individuals, environmental organizations, and municipalities interested in sourcewater protection may also utilize the Community Water System Source WaterAssessment Report for protection activities.
2. Community Water System Source Water Assessment Summary: a short (4-6 page)informative document created for distribution by the water system to the general public. Inaddition, DEP will post the summary document on the SWAP web site athttp://www.state.nj.us/dep/swap/. The Community Water System Source WaterAssessment Summary is a synopsis of the Source Water Assessment Report andprovides the source susceptibility ratings for the community water system’s sources.
3. Noncommunity Water System Source Water Assessment Report: developed for therespective noncommunity water system. The report provides the susceptibility ratings ofthe system’s sources. The general public may request the report from the noncommunitywater system or the DEP. In addition, the DEP decided to develop a noncommunity watersystem report for each municipality. The report contains the noncommunity water systemreports for the systems found in the same municipality. DEP hopes this report will assistlocal planning agencies and the public in source water protection efforts.

10
SECTION III – SOURCE WATER ASSESSMENT PROGRAM STEPS

11
SECTION III – SOURCE WATER ASSESSMENT PROGRAM STEPS
The SWAP consists of four fundamental steps that are illustrated in Figure 4.
Figure 4: Flowchart of Source Water Assessment Program Process
Step 1
Delineate Source WaterAssessment Areas
GPS LocatePublic Wellsand Surface
Water Intakes
CollectAvailable
Source Data
Step 2
Inventory PotentialContaminant Sources
Step 3
Determine Susceptibility
Develop, Testand Verify
SusceptibilityModels
ApplySusceptibility
Models
Step 4
Public Outreach andDistribution of Source Water

12
Step 1: DelineationThe first step of the SWAP process is to delineate the source water assessment area foreach public water system well and surface water intake. For ground water sources, a sourcewater assessment area in New Jersey is the area from which water is reasonably likely toflow to a well within a 12 year period. This area is also known as a wellhead protection area,or WHPA. For surface water sources, the source water assessment area is the areaupstream of a surface water intake, including land that drains to the upstream areas.
Before the source water assessment area was delineated for a public well, attribute data wasgathered. Since 1947, a property owner or well driller has been required to obtain a wellpermit from New Jersey’s well permitting program to drill a well in New Jersey. After alicensed well driller drills the well, a well record must be submitted to the Division of WaterSupply, DEP. The well record is an “as-built” description of the well construction, and usuallycontains important attribute data such as well depth, screened interval or length of open hole,and pumping rate/capacity. This information is needed to delineate the source waterassessment area around the well. DEP used the well record to determine attribute data. Insituations where DEP was unable to obtain attribute data, such as for a well drilled prior to1947 or when a well record was not available, default values were generated using NewJersey Geological Survey’s (NJGS) “Guidelines for Delineation of Well Head ProtectionAreas in New Jersey,” Appendix B- Attachment 1. The guidance document is available onthe internet at www.state.nj.us/dep/njgs/whpaguide.pdf, by contacting the DEP, New JerseyGeological Survey at (609) 292-1185, or from the DEP Maps and Publications Sales Office at(609) 777-1038.
For surface water intakes, source water assessment areas were developed based on thelocation of the intake and the entire drainage area upstream of the intake includingheadwaters and tributaries. These factors influence the shape and size of the delineations.
Next, the well or intake was located using Global Positioning System (GPS). All wells andintakes were GPS-located according to the "DEP GPS Data Collection Standards for GISData Development” available at www.state.nj.us/dep/gis/gpstrim.html. The DEP GPS-locatedthe community water system wells and surface water intakes. The noncommunity watersystem wells were GPS-located by DEP, County Environmental Health Act (CEHA)Agencies, and the New Jersey Water Association.
After collecting the attribute data and GPS location, the source water assessment areas forwells and intakes were delineated. DEP performed the ground water source waterassessment area delineations using the Combined Model/Calculated Fixed Radius Methodfor all public community water system wells and the Calculated Fixed Radius method for thenoncommunity water system wells. For a detailed description of the delineation methodsplease refer to New Jersey’s “Guidelines for Delineation of Well Head Protection Areas inNew Jersey,” Appendix B- Attachment 1.
For each ground water source, three tiers were calculated and labeled as Tier 1 (two yeartime of travel), Tier 2 (five year time of travel), and Tier 3 (12 year time of travel). Time oftravel was established for determining the risk of contamination to a well. The two year timeof travel was developed based on the potential for microbiological contamination. Studiesshow on average, bacteria can survive in ground water for approximately 170 days and

13
viruses can survive in ground water for approximately 270 days. The two year time of travelindicates the limits of concern for potential viable microbiological contamination of the watersystem through the source water.
The five year time of travel was established to address contamination from accidentaldischarges. This time of travel provides a reasonable amount of time to investigate, monitor,and/or remediate a spill within the source water assessment area. The third time of travelportion of the source water assessment area, 12 year, was designed in consideration of theknown contaminant sources. Studies show that 10 to 15 years of time of travel generallycovers the full length of a contaminant plume. The 12 year time of travel will permit enoughtime for responses to be made.
The DEP delineated the source water assessment areas for surface water intakes using theUnited States Geological Survey’s (USGS) hydrologic unit code 14 (HUC14) as the basedata-set for the delineations. Hydrologic unit codes identify drainage basins in a nestedgroup from large to small. The larger the HUC number the smaller the drainage basin. Forexample a HUC4 will be made up of several smaller HUC8s, and the HUC8s will be made upof several smaller HUC14s. The source water assessment areas for the surface waterintakes include the entire drainage area that flows past the intake, including headwaters andtributaries. For more information on the methodology used for surface water delineations,refer to Appendix B- Attachment 2, Surface Water Delineation Methodology.
The DEP has classified approximately 50 wells as “ground water under the direct influence ofsurface water” (GUDI). GUDI wells are classified according to site specific water qualitymeasurements and provide additional treatment of the source water. For GUDI wells, theDEP performed a conjunctive delineation, an integrated delineation combining the groundwater contribution and the surface water contribution to the well. The groundwater andsurface water contribution were delineated using the same procedure described above,except the 2 year time of travel for the ground water delineation demarcated the downstreamboundary.
A few GUDI wells do not have an obvious surface water body influencing the well. In theseinstances only the ground water delineated source water assessment area was available.Therefore, the 12 year time of travel boundary for the ground water delineation was used todefine the surface water contribution area. An example of this scenario would be the NewtonWater and Sewer Utility, Facility number 03, SFID number 010.
The ground water susceptibility models were applied to the GUDI wells ground watercontribution area and the surface water susceptibility models were applied to the surfacewater contribution area. The final susceptibility rating for the GUDI well was determined bytaking the higher susceptibility rating of the two (ground water and surface water). Using thepathogen contaminant category as an example, all surface water automatically received ahigh susceptibility rating for pathogens. Therefore, all GUDI wells received a highsusceptibility rating for pathogens. Even if the GUDI well rated low to pathogens for theground water contribution area, the high rating for the surface water contribution area wasused as the final susceptibility rating (the highest rating of the two).

14
Step 2: Potential Contaminant Source InventoryThe second step of the SWAP is to identify the potential contaminant sources within thesource water assessment area. These potential sources of contamination include point andnonpoint sources. Point source contaminants may be traced to a single source, such asknown contaminated sites, industrial and commercial surface and ground water discharges,and sewage treatment discharges. Nonpoint source contaminants may not be traced to onesingle source because they come from several individual sources within a large area. Landuse activities such as salting and runoff from roads and the application of pesticides andherbicides are examples of nonpoint sources. Nonpoint and point sources can have asignificant impact on both surface water and ground water quality.
Potential contaminant source inventory information was primarily collected from existing DEPGIS databases. For nonpoint sources, digital GIS land use and land cover data for the years1970, 1986, and 1995 were used. Several datasets of land coverage were used to accountfor the changes in land use over the years. The New Jersey Source Water AssessmentProgram Potential Contaminant Source Inventory (PCSI) Methodology, Appendix B-Attachment 3, describes how the potential contaminant source inventory was developed, thedatasets used, the sites and activities included in the inventory, and the preliminary list ofexplanatory variables used in the susceptibility models.
For the purpose of the SWAP, the DEP, in conjunction with a Source Water AssessmentAdvisory Committee that met regularly during the development of the SWAP Plan, developedeight conceptual contaminant categories that represent microbiological and chemicalcontaminants of concern. These categories include pathogens, nutrients, volatile organiccompounds, synthetic organic compounds, pesticides, inorganics, radionuclides anddisinfection byproduct precursors. This list was further refined during the susceptibility modeldevelopment process. Tables 2, 3, and 4 contain the final list of contaminant categories andexplanatory variables. Each drinking water source was evaluated for susceptibility to each ofthe following contaminant categories.
Conceptual Contaminant Categories
PathogensDisease-causing organisms such as bacteria, protozoa, and viruses. Sources of pathogensinclude both point and nonpoint activities. An example of a point source of pathogens is asewer system overflow. An example of a nonpoint source is runoff from areas wherelivestock are kept.
NutrientsCommon types of nutrients include nitrogen and phosphorous. Nutrients can harmenvironmental quality, human health, and the efficiency of the drinking water treatment plantby encouraging growth of photosynthetic microorganisms in surface water sources, whichalter water characteristics (eutrophic conditions). Sources of nutrients are point and nonpointsources. Effluents from a sewage treatment plant are a point source of nutrients. Nonpointsources of nutrients include discharge from septic fields, areas where animal waste is stored,and runoff from agricultural and residential land where fertilizers were used.

15
PesticidesCommon sources of pesticides include land applications (nonpoint source) andmanufacturing/distribution centers of pesticides (point source). Pesticides are manmadechemicals used to control bacteria, fungi, weeds, rodents, and insects. Examples includeherbicides such as atrazine and insecticides such as chlordane.
Synthetic Organic Compounds (SOCs)Sources of SOCs can be point and nonpoint. Common sources include chemicalmanufacturing plants, pharmaceutical plants, sewage treatment plants, and discharges fromcontaminated sites. Synthetic organic compounds are manmade.
Volatile Organic Compounds (VOCs)Common types of VOCs include chemicals that are used as solvents, degreasers, andgasoline components. VOCs are manmade compounds and are the most common organiccontaminants in ground water in New Jersey. Sources of VOCs can be point and nonpoint.Examples of VOCs are methyl tertiary butyl ether (MTBE), benzene and vinyl chloride.
InorganicsMineral-based compounds that are both naturally occurring and manmade. Sources ofinorganics can be point and nonpoint; common sources include discharges frommanufacturing plants, releases from contaminated sites, past land uses, and naturallyoccurring sources. Inorganics include arsenic, cadmium, copper, lead, mercury, andasbestos.
RadionuclidesSources of radionuclides can be point and nonpoint; common sources include the decay ofnaturally occurring minerals, leaching of subsurface material (for example rocks andsedimentary materials) into ground water, and improper disposal of radioactive waste.Radionuclides are a category of contaminant that is both naturally occurring and manmade.Radionuclides are radioactive substances such as radium and radon.
Disinfection Byproduct (DBP) PrecursorsDisinfection byproducts are formed when the disinfectants used to kill pathogens duringtreatment react with dissolved organic material present in the water. A common source ofDBP precursors is naturally occurring organic material such as leaves in surface water. Theamount of organic matter, the type of disinfectant, the concentration of disinfectant, time ofcontact, pH, and temperature all have an effect on the concentration of disinfectionbyproducts produced. Chlorine is the most common disinfectant used in New Jersey.
Step 3: Susceptibility DeterminationThe third step of the SWAP is to determine the public water system’s susceptibility tocontamination. Susceptibility is a function of source sensitivity (for example soil type and wellconstruction characteristics) and the intensity of surrounding use factors (for example thedensity of contamination sites or the type of land use).
SUSCEPTIBILITY = Sensitivity + Intensity
DEP contracted with the USGS to develop susceptibility assessment models, with DEPguidance, to determine susceptibility ratings for public supply wells and surface water intakes

16
for the contaminant categories of concern described in Step 2. Some states have determinedsusceptibility using relatively simple approaches that account for factors such as distance tocontaminant sources, but the more thorough modeling approach employed for New Jerseyprovides a more accurate estimate of susceptibility. The models were based on results froman extensive analysis of ground water and surface water quality data from the DEP-USGSstatewide cooperative monitoring networks for a select set of sites in New Jersey. Pleaserefer to the documentation Methods to Determine the Susceptibility of Source Water toCommunity and Noncommunity Water Supplies in New Jersey to Contamination, AppendixB- Attachment 4 for more information.
USGS developed susceptibility models for seven contaminant categories and radon for bothground water and surface water. DEP had originally intended to develop a susceptibilitymodel for “synthetic organic compounds” (SOCs), but did not do so for two reasons. First,SOCs under the Federal and State Safe Drinking Water Acts consist primarily of pesticidesand as part of SWAP, USGS developed a pesticide susceptibility model. Secondly, as USGSinvestigated whether it could construct a SOCs model, USGS and DEP jointly determinedthat there was insufficient SOC data that was neither pesticide nor volatile organic compound(VOC) related. (USGS also developed a separate VOC model.) However, it is DEP’sexperience that the presence of non-pesticide, non-volatile SOCs will typically co-occur withVOCs. Specifically, recent work by DEP and others at community water systems usingground water as a source and known to be contaminated by volatile organic contaminationfrom hazardous waste sites determined that “tentatively identified compounds” (TICs) werepresent. In this study, although DEP and others were primarily looking for non-volatileorganic compounds, TICs were found at some frequency at these sites. As part of the study,a “control” water system with no hazardous waste site nearby and with no volatilecontamination was tested and contained no TICs. Qualitative evaluation of the data showsystems with the higher levels of volatile organic chemicals and with more than one VOCpresent contained the highest number of TICs. For these reasons, DEP has determined theSOC rating for a water system would be the same as the public water system’s VOC rating,and that a separate SOC susceptibility model was unnecessary.
Separate susceptibility models were developed for radon and other radionuclides for tworeasons. First, radon, a gas, is chemically and physically different from other radionuclideconstituents. Second, radon most often occurs in areas where other radionuclides are notpresent. The remedy for radon is different from the remedy for other radionuclides. DEP wasconcerned that if both radon and other radionuclides were combined, the susceptibility ratingwould not show the difference in susceptibility of water systems’ sources to the differentradionuclides.
For the purpose of the source water assessments, all surface water was assumed to behighly susceptible to pathogens, therefore a pathogen model was not developed for surfacewater. Surface water sources are subject to various sources of microbial contaminationrunoff containing fecal matter. All surface water intakes received a high rating for pathogens.Secondly, a radionuclide model was not developed for surface water. Radionuclides areprimarily a concern of ground water, therefore, all surface water intakes received a lowsusceptibility rating for radionuclides.
The susceptibility models determined source water susceptibility based on the well or intake’slocation and explanatory variables. An explanatory variable is a variable that can be used to
17
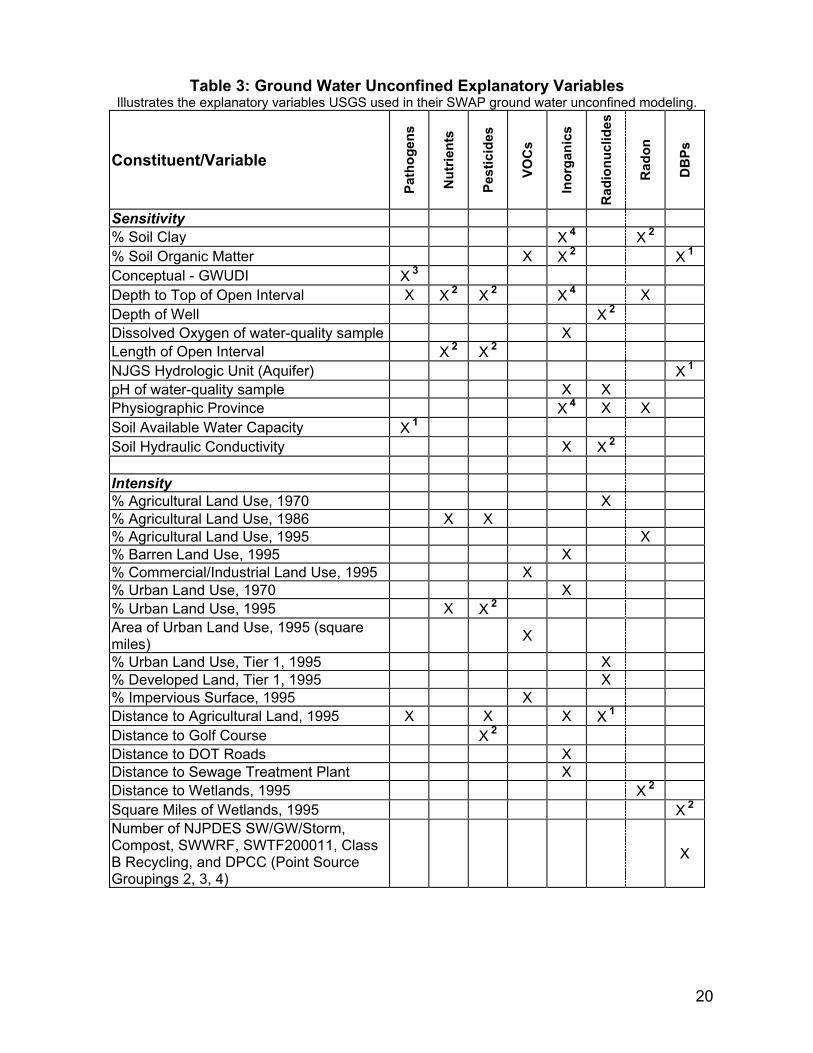
predict the presence of a contaminant or the potential presence of a contaminant in groundwater or surface water. Tables 2, 3, and 4 illustrate the final explanatory variables used indetermining sensitivity and intensity ratings for surface water intakes, unconfined wells, andconfined wells. These tables also contain the conceptual variables used in the susceptibilityrating determinations. A conceptual variable is one that has been shown in a previousscientific investigation to be related to, or is expected to have an effect on, the concentrationsof a constituent. Conceptual variables that did not produce significant univariate statisticalrelations may however, produce a significant relation when used with other variables inmultivariate statistical tests.
A list of all contaminant variables reviewed can be found in the documentation Methods toDetermine the Susceptibility of Source Water to Community and Noncommunity WaterSupplies in New Jersey to Contamination, Appendix B- Attachment 4. For furtherinformation, Appendix B- Attachment 5 and 6, Contaminant Group Reports, provide detaileddescriptions of the models used for SWAP.
In addition to evaluating the contaminant variables separately, groupings of several pointsource variables together as a single explanatory variable were investigated to determine if acertain subset of point sources produced meaningful results. USGS determined thatalthough several types of point sources are not statistically significant individually, groupingthem as a unit could produce meaningful results. These combinations are known as “PointSource Groupings.”
Point Source Grouping 1: consists of sites on the Known Contaminated Site List and on theSolid Waste Landfill Site list. In general, these point sources are existing contaminationsources.
Point Source Grouping 2: consists of New Jersey Pollutant Discharge Elimination System forpermitted discharges to surface water, New Jersey Pollutant Discharge Elimination Systemstorm water discharges, and Compost Facilities. These point sources are potential surfacewater contamination problems.
Point Source Grouping 3: consists of New Jersey Pollutant Discharge Elimination Systemdischarges for ground water (NJPDES/DGW), Solid Waste Resource Recovery Facilities(RRF), Solid Waste Transfer Facilities (SWTF), and Class B Recycling Facilities. These pointsources are potential ground water contamination problems. The last three activities (RRF,SWTF, and Class B) are designed not to discharge contamination and degrade ground water.They do handle pollutants, and there is a potential to cause contamination. Thus, they areincluded in the inventory. Facilities that discharge via a NJPDES/DGW permit are given strictpermit limits. The discharge standards are typically at or below the ground water qualitystandards. While these activities are grouped for modeling purposes, the RRF, SWTF, andClass B Recycling Facilities do not appreciably affect the model, based on analysis by USGS.
Point Source Grouping 4: consists of sites regulated by the DEP Discharge Prevention andCountermeasures Plan regulations and Discharge Cleanup and Removal Plan regulations.These facilities store, transfer, process, or use hazardous substances and must specify andsubmit information regarding prevention, containment and countermeasure plans anddischarge cleanup and removal plans.
18
Point Source Grouping 5: consists of regulated Underground Storage Tanks (USTs). USTswere treated as a separate point source grouping due to the large number of USTs in NewJersey, relative to the number of other types of potential point sources. There areapproximately 19,454 underground storage tank registrations in New Jersey, consisting ofactive and inactive tanks. USTs were treated separately so that the number of USTs wouldnot obscure possible statistical relations between susceptibility and other potentialcontaminant sources.
Point Source Grouping 6: consists of the entire Potential Contaminant Source Inventory ofpoint sources.
Several point source groupings were combined to determine whether or not these pointsource groupings had an effect on a source’s susceptibility. If a point source groupingcombination was found to be significant it was used as an explanatory variable in thesusceptibility models. The explanatory variables can be found in Tables 2, 3, and 4dependent on the type of drinking water source.

19
Table 2: Surface Water Explanatory VariablesIllustrates the explanatory variables USGS used in their SWAP surface water modeling.
Constituent/Variable
Path
ogen
s 1
Nut
rient
s
Pest
icid
es
VOC
s
Inor
gani
cs
Rad
ionu
clid
es 1
Rad
on 1
DB
Ps -
conc
eptu
al 2
Sensitivity% Soil Clay X% Soil Organic Matter X 2 X 2 X 2
PH of water-quality sample XPhysiographic Province X 2
Water Region X
Intensity% Agricultural Land Use, 1995 X% Commercial/Industrial Land Use,1995 X 2
% Developed Land, 1995 X 2
% Residential Land Use, 1995 X% Urban Land Use, 1995 X X XDistance to Agricultural Land, 1995 X X 2
Distance to Wetlands, 1995 X 2
Density of NJPDES SW/Storm,Compost Facilities (Point SourceGrouping 2)
X
Density of KCSL, SWL, NJPDESSW/Storm, Compost Facilities (PointSource Groupings 1,2)
X
Density of KCSL, SWL, NJPDESGW, SWRRF, SWTF200011, ClassB Recycling, DPCC, UST (PointSource Groupings 1, 3, 4, 5)
X
Sewage Treatment Plant Density XTotal Pesticide Application X
1 For the purpose of developing susceptibility models, a pathogen model was not developedbecause all surface water sources are considered highly susceptible to pathogens; aradionuclide model was not developed because radionuclides are not a concern in surfacewater.2 This conceptual variable shows a graphical relation to water-quality, improves the model,and is supported by scientific investigations.
20
Table 3: Ground Water Unconfined Explanatory VariablesIllustrates the explanatory variables USGS used in their SWAP ground water unconfined modeling.
Constituent/Variable
Path
ogen
s
Nut
rient
s
Pest
icid
es
VOC
s
Inor
gani
cs
Rad
ionu
clid
es
Rad
on
DB
Ps
Sensitivity% Soil Clay X 4 X 2
% Soil Organic Matter X X 2 X 1
Conceptual - GWUDI X 3
Depth to Top of Open Interval X X 2 X 2 X 4 XDepth of Well X 2
Dissolved Oxygen of water-quality sample XLength of Open Interval X 2 X 2
NJGS Hydrologic Unit (Aquifer) X 1
pH of water-quality sample X XPhysiographic Province X 4 X XSoil Available Water Capacity X 1
Soil Hydraulic Conductivity X X 2
Intensity% Agricultural Land Use, 1970 X% Agricultural Land Use, 1986 X X% Agricultural Land Use, 1995 X% Barren Land Use, 1995 X% Commercial/Industrial Land Use, 1995 X% Urban Land Use, 1970 X% Urban Land Use, 1995 X X 2
Area of Urban Land Use, 1995 (squaremiles) X
% Urban Land Use, Tier 1, 1995 X% Developed Land, Tier 1, 1995 X% Impervious Surface, 1995 XDistance to Agricultural Land, 1995 X X X X 1
Distance to Golf Course X 2
Distance to DOT Roads XDistance to Sewage Treatment Plant XDistance to Wetlands, 1995 X 2
Square Miles of Wetlands, 1995 X 2
Number of NJPDES SW/GW/Storm,Compost, SWWRF, SWTF200011, ClassB Recycling, and DPCC (Point SourceGroupings 2, 3, 4)
X

21
Table 3 continued
Constituent/Variable
Path
ogen
s
Nut
rient
s
Pest
icid
es -
conc
eptu
al 3
SOC
s 1
VOC
s
Inor
gani
cs
Rad
ionu
clid
es
Rad
on
DB
Ps
Density of KCSL, SWL, NJPDESGW/SW/Storm, Compost Facility,SWRRF, SWTF200011, Class BRecycling, DPCC, UST (Point SourceGroupings 1, 2, 3, 4, 5)
X
Density of SWL, UST, KCSL (Point SourceGroupings 1, 5) X
Population Density XPopulation Density, Tier 1 XSeptic Tank Density X 1
Septic Tank Density in Piedmont XSewage Treatment Plant Density XConceptual - Presence of Streams, Tier 1 X 3
Length of Railroads X
1 This conceptual variable shows a graphical relation, improves the model, and is supportedby scientific investigations.2 This conceptual variable shows a graphical relation to water quality and improves themodel.3 Statistical tests could not be used because the variable was unavailable for the data setused to develop the model.4 This factor is a conceptual variable and an explanatory variable for the contaminantcategory. As a result of the contaminant category consisting of several inorganics (arsenic,barium, beryllium, fluoride, lead, and mercury), the factor is used as a conceptual andstatistically significant variable. Percent soil clay is a conceptual variable (X 2) for lead andmercury, but a statistically significant explanatory variable for beryllium. For depth to top ofopen interval, the factor is conceptual (X 2) for fluoride and lead, and a statistically significantexplanatory variable for beryllium. Thirdly, physiographic province is a conceptual variable (X3) for mercury and a statistically significant explanatory variable for the arsenic, barium,beryllium, and fluoride models.
22
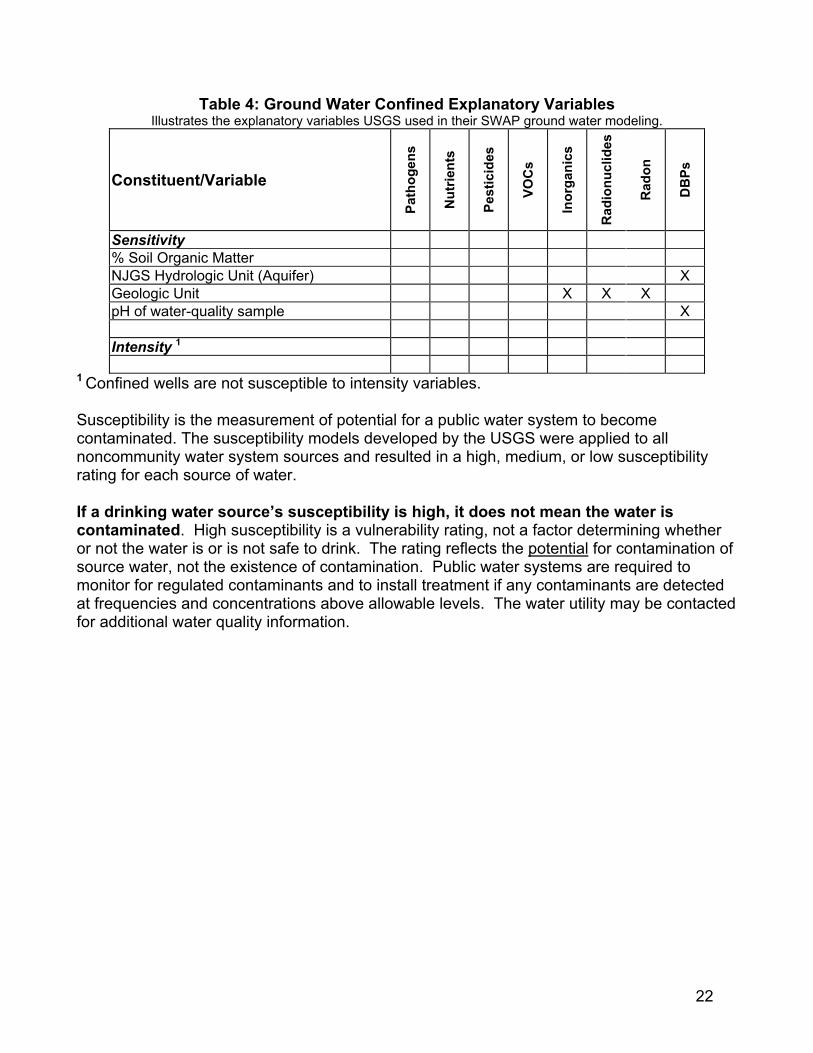
Table 4: Ground Water Confined Explanatory VariablesIllustrates the explanatory variables USGS used in their SWAP ground water modeling.
Constituent/Variable
Path
ogen
s
Nut
rient
s
Pest
icid
es
VOC
s
Inor
gani
cs
Rad
ionu
clid
es
Rad
on
DB
Ps
Sensitivity% Soil Organic MatterNJGS Hydrologic Unit (Aquifer) XGeologic Unit X X XpH of water-quality sample X
Intensity 1
1 Confined wells are not susceptible to intensity variables.
Susceptibility is the measurement of potential for a public water system to becomecontaminated. The susceptibility models developed by the USGS were applied to allnoncommunity water system sources and resulted in a high, medium, or low susceptibilityrating for each source of water.
If a drinking water source’s susceptibility is high, it does not mean the water iscontaminated. High susceptibility is a vulnerability rating, not a factor determining whetheror not the water is or is not safe to drink. The rating reflects the potential for contamination ofsource water, not the existence of contamination. Public water systems are required tomonitor for regulated contaminants and to install treatment if any contaminants are detectedat frequencies and concentrations above allowable levels. The water utility may be contactedfor additional water quality information.

23
DEP calculated the percentage of noncommunity water system sources in New Jersey thatrated high, medium, and low for each of the contaminant categories. Table 5 summarizes thesusceptibility rating information.
Table 5: Summary of Statewide Susceptibility Ratings for Noncommunity WaterSystem Sources (Percent %)
Path
ogen
s
Nut
rient
s
Pest
icid
es
VOC
s
Inor
gani
cs
Rad
ionu
clid
es
Rad
on
DB
Ps
GroundWater1
High 2 0 0 32 19 69 17 3Medium 18 66 66 0 42 28 72 97
Low 80 34 34 68 39 3 11 0SurfaceWater2
High 100 33 0 0 100 0 0 100Medium 0 67 67 33 0 0 0 0
Low 0 0 33 67 0 100 100 0 1 Noncommunity water systems wells in New Jersey in 2003 = 3480 2 Noncommunity water system surface water sources in New Jersey in 2003 = 3
USGS developed a rating scoring system for each susceptibility model. When each modelwas applied to a well or intake, a rating score was generated. This score was then convertedinto a susceptibility rating of high, medium, or low. For further information on thesusceptibility rating score scheme please refer to Appendix A- Attachment 2. The SafeDrinking Water Maximum Contaminant Levels (MCLs) were used to guide the divisionbetween the three susceptibility ratings. A low susceptibility rating means a potentialcontaminant level was predicted to be less than 10 percent of the MCL for that contaminant.A medium susceptibility rating was assigned where the potential contaminant level waspredicted to be equal to or greater than 10 percent and less than 50 percent of the MCL. Ahigh susceptibility rating was assigned where the potential contaminant level was equal to orgreater than 50 percent of the MCL. For the list of New Jersey primary and secondarydrinking water standards, containing the MCLs, please refer tohttp://www.state.nj.us/dep/watersupply/standard.htm.
Statewide, 85 percent of the noncommunity water system sources (ground water and surfacewater) rated high for at least one of the contaminant categories.
For surface water, the three contaminant categories in which all of the noncommunity watersystem surface water intakes (three total) received a high susceptibility rating wereinorganics, disinfection byproduct precursors, and pathogens (all assumed to be highlysusceptible to pathogens). In fact, a high percentage of community water system surfacewater intakes were found to be highly susceptible to the same contaminant categories.Eighty-one percent of community water system surface water intakes were found to be highly

24
susceptible to inorganics and 98% were found to be highly susceptible to disinfectionbyproduct precursors.
For ground water, the three contaminant categories in which the highest percentage ofsources received a high susceptibility rating are radionuclides (69%), volatile organiccompounds (32%), and inorganics (19%). When reviewing the results of the mediumsusceptibility ratings for noncommunity water system wells, the three contaminant categoriesin which a high percentage of the wells rated medium are disinfection byproduct precursors(97%), radon (72%), pesticides and nutrients (both 66%).
Step 4: Public Participation and OutreachThe fourth step, public participation and outreach, is an essential component of the SWAP.The 1996 Amendments to the Federal Safe Drinking Water Act place a strong emphasis onpublic participation. To ensure the source water assessments are used for source waterprotection efforts, the public was involved from the beginning of the program.
The DEP used a variety of techniques to include the public in the program.
1. Created a Source Water Assessment Advisory Committee to provide input on thedraft and final SWAP Plan. The Source Water Assessment Advisory Committeecontinued to meet with the DEP regularly to discuss the status of the assessments andprovide suggestions during the development of the program. In addition, the SourceWater Assessment Advisory Committee provided advice concerning the source waterassessment summaries and reports.
2. Developed a SWAP newsletter, the “New Jersey Source Water Assessment News.”Issues of the “New Jersey Source Water Assessment News” may be found atwww.state.nj.us/dep/swap. The newsletter was sent to committee members, public watersystems, county health agencies, environmental organizations, municipalities, drinkingwater laboratories, and other interested parties. The New Jersey Source WaterAssessment News informed readers of the status of the SWAP, contact information,source water protection issues, and other related topics.
3. Published SWAP articles in several organizations’ newsletters. For example, articleswere published in the New Jersey Section of American Water Works Associationnewsletter “Pipeline” and the DEP Division of Watershed Management newsletter“Focus.”
4. Provided speakers for numerous SWAP presentations throughout the State. Thepresentations were regularly presented to water purveyors at New Jersey WaterAssociation training courses and other interested organizations such as the watershedmanagement area committees.
The DEP will continue its public outreach following the release of the source waterassessments. Public outreach activities will include training sessions for water purveyors,published SWAP articles, and correspondence with interested parties such as purveyors,municipalities, planning boards, and environmental commissions.

25
SECTION IV - NONCOMMUNITY PUBLIC WATER SYSTEM INDIVIDUAL SOURCEWATER ASSESSMENT REPORTS (ARRANGED BY PWID)
1
The Royal Inn1336300
Source Water Assessment ReportA State Assessment of Your Drinking Water Source’sVulnerability
As a requirement of the 1996 Amendments to the Federal Safe DrinkingWater Act, New Jersey Department of Environmental Protection (DEP)performed a source water assessment of each source of public drinkingwater and determined each source’s susceptibility to contamination.Susceptibility is a measure of the potential exposure of a drinking water source to contamination; actual(if any) contamination is not measured.
DEP, in conjunction with the United States Geological Survey (USGS), performed the following steps todetermine the drinking water source’s susceptibility. Identifying the area (known as the source water assessment area) that supplies water to your public
drinking water system; Inventorying any significant potential sources of contamination in the area; and Analyzing how susceptible the drinking water source is to the potential sources of contamination.
DEP evaluated the susceptibility of all public water system sources to eight categories of contaminants. Pathogens: Disease-causing organisms such as bacteria and viruses. Common sources are animal and human
fecal wastes. Nutrients: Compounds, minerals and elements that aid growth, that are both naturally occurring and man-
made. Examples include nitrogen and phosphorus. Volatile Organic Compounds: Man-made chemicals used as solvents, degreasers, and gasoline components.
Examples include benzene, methyl tertiary butyl ether (MTBE), and vinyl chloride. Pesticides: Man-made chemicals used to control pests, weeds and fungus. Common sources include land
application and manufacturing centers of pesticides. Examples include herbicides such as atrazine, andinsecticides such as chlordane.
Inorganics: Mineral-based compounds that are both naturally occurring and man-made. Examples includearsenic, asbestos, copper, lead, and nitrate.
Radionuclides: Radioactive substances that are both naturally occurring and man-made. Examples includeradium and uranium.
Radon: Colorless, odorless, cancer-causing gas that occurs naturally in the environment. For more informationgo to http://www.nj.gov/dep/rpp/radon/index.htm or call (800) 648-0394.
Disinfection Byproduct Precursors: A common source is naturally occurring organic matter in surface water.Disinfection byproducts are formed when the disinfectants (usually chlorine) used to kill pathogens react withdissolved organic material (for example leaves) present in surface water.
To determine a source’s susceptibility to these contaminants, the USGS, with DEP assistance, developedstatistical models based on extensive analysis of existing well sample data and surface water intake data.The statistical models determined the relationship between environmental factors and the probability forcontamination to occur. These models identified factors, such as land use or geology, found to besignificantly “linked” to a public water system source’s potential to become contaminated by one or morecategories of contaminants. DEP and USGS looked at factors that might affect the quality of drinkingwater sources and separated them into two categories.

2
How “sensitive” the water supply is to contamination. For example, a shallow well or surface watersource, like a reservoir, would be more exposed to contamination from the surface or above groundthan a confined well.
How frequently a contaminant is used or exists near the source. This is known as “intensity of use.”For example, the number and/or types of activities (such as industry or agriculture) surrounding thesource.
The specific sensitivity and intensity of use factors and their values within each source water assessmentarea for your source(s) are provided on page 7 of this report.
Using the susceptibility factors, the statistical models provided a numerical score for each source ofdrinking water for each contaminant category. These were then converted into high (H), medium (M), orlow (L) susceptibility ratings.
The Safe Drinking Water Standards or Maximum Contaminant Levels (MCLs) were used to define thethree susceptibility ratings (H, M, and L). These standards are developed based health effects, analyticaland treatment factors on either acute or long-term impacts related to drinking water exposure. A lowsusceptibility rating means a potential contaminant level was predicted to be less than 10 percent of theMCL for that contaminant category. A medium rating means the potential contaminant level waspredicted to be equal to or greater than 10 percent and less than 50 percent of the MCL. A high ratingwas assigned to those sources that were predicted to have potential contaminant levels equal to or greaterthan 50 percent of the MCL. Sources with high susceptibility ratings are still likely to have contaminantconcentrations below the MCL.
The susceptibility ratings of your sources to each of the contaminant categories are provided on page 6 ofthis report.
Source Water Assessment Program GoalsThe information obtained from the source water assessments may be used to achieve the following goals:
1. Protect sources of drinking water. Source water protection focuses on preserving and protecting the public drinking water source. Thesource water assessment results may be used by DEP, purveyors, and local planning officials to lay thegroundwork for advancing drinking water protection efforts. State and local agencies, as well as theregulated community, have made significant strides to protect the quality of our water resources. Majorwater quality improvements have been made as a result of water quality and drinking water standards andprograms (both regulatory and nonregulatory) designed to ensure standards are met. Waste managementand clean up programs have had success in controlling releases and ensuring actions are taken to achievestandards if releases occur. Recent measures to control non-point sources have expanded the DEP’s waterquality protection programs by recognizing the link between land use change and water resource impacts.The Safe Drinking Water Program is designed to ensure that water delivered for human consumptionmeets drinking water standards. In addition to these programs, major initiatives such as the HighlandsWater Protection and Planning Act, Surface Water Quality Standards and Category One Designation, andStormwater Management Rules have recently been accomplished. Despite this success, the DEPrecognizes the ongoing importance of using new information such as that from the source waterassessments to evaluate the need for additional protection measures of drinking water sources. The DEP iscurrently reviewing the source water assessments to identify any necessary additional source waterprotection measures.

3
2. Public education of SWAP information. DEP incorporated public education throughout the development and implementation of the Source WaterAssessment Program. During the source water assessment process, DEP met with interested parties,beginning with the development of the SWAP Plan, published articles, wrote two newsletters, anddeveloped a SWAP web site. The SWAP web site contains information on the program, technicalresources, frequently asked questions, source water assessment results, and links to additional sites ofinterest. Upon completion of the source water assessments, DEP generated a source water assessmentreport for each public water system to report the susceptibility ratings of public drinking water sources topotential contamination.
The goal of the public education efforts is to raise public awareness of the source of their drinking waterand the potential contaminants that could impair the water's quality. To continue fulfilling the educationgoal, DEP will conduct training sessions following the release of the Source Water Assessment Reports.
3. Establish a customized monitoring schedule for each public water system. The source water assessments will assist DEP in improving current monitoring requirements forindividual public water systems. Currently, the Environmental Protection Agency (EPA) and the DEPhave mandatory monitoring schedules that depend on a variety of factors that can include the source ofthe water (ground water or surface water) and the surrounding land use. These schedules may becustomized based on the susceptibility of the sources of drinking water.
Where does drinking water come from?There are two basic sources of drinking water: ground water and surface water.
Ground water is water found beneath the Earth’s surface. Ground water comes from rain and snowseeping into rock and soil. Ground water is stored in underground areas called aquifers. Aquifers supplywells and springs. Wells in New Jersey range from about 15 feet to 2,000 feet deep.
Surface water is the water naturally open to the atmosphere, such as rivers, lakes, streams and reservoirs.Precipitation that does not infiltrate the ground or evaporate into the sky runs off into surface waterbodies.
Ground water can seep into a stream, river or other surface water body, recharging surface water bodies.Likewise, under some circumstances, surface water can seep into an adjacent aquifer.
A water system obtains its water from 1) wells drilled into the ground that pump out ground water; 2)devices called surface water intakes placed on a river, stream, or reservoir; or 3) both.
What factors may affect the quality of your drinking water source?A variety of conditions and activities may affect the quality of drinking water source. These includegeology (rock and soil types); depth of a well or location of a surface water intake; how the landsurrounding the source is used (for industry, agriculture or development); the use of pesticides andfertilizers; and the presence of contaminated sites, leaking underground storage tanks, and landfills.Please refer to pages 6 and 7 of this report for specific potential contaminant source information.

4
What steps are being taken now to ensure my drinking water quality?The DEP has numerous programs in place to maintain and protect the quality of our State's waterresources. For example, the Safe Drinking Water Program is designed to ensure that water delivered forhuman consumption meets DEP's stringent health-based drinking water standards. Additionally, DEP haspermitting, waste management, and clean up programs in place to avoid and control potentialcontamination. Key DEP drinking water protection initiatives will be phased-in over time in source waterassessment areas to advance existing program protections.
What can you and others do to help?While government at the state and local levels can do their part, there are actions you and your neighborscan take now to help protect our precious and shared natural resource.
Here’s just a few ways you and others can help ensure clean and plentiful water for New Jersey – now andin the future. Join us today for a clean water future. Dispose of waste properly. Some materials such as motor oil, paint, flea collars, and household
cleaners have the potential to contaminate source water. Contact your local Department of PublicWorks for proper household hazardous waste disposal.
Limit your use of fertilizer, pesticides, and herbicides.
Here are some actions that municipal and county officials/local and county planners can take and you canhelp encourage and support. Manage and work with owners of existing potential contaminant sources to minimize potential
contamination. Establish regulations prohibiting or restricting certain activities or land uses within the source water
assessment area. Take appropriate enforcement action when necessary. Update municipal master plans to ensure greater protection. Purchase lands or create conservation easements within the source water assessment area.
Illustration courtesy of USGS
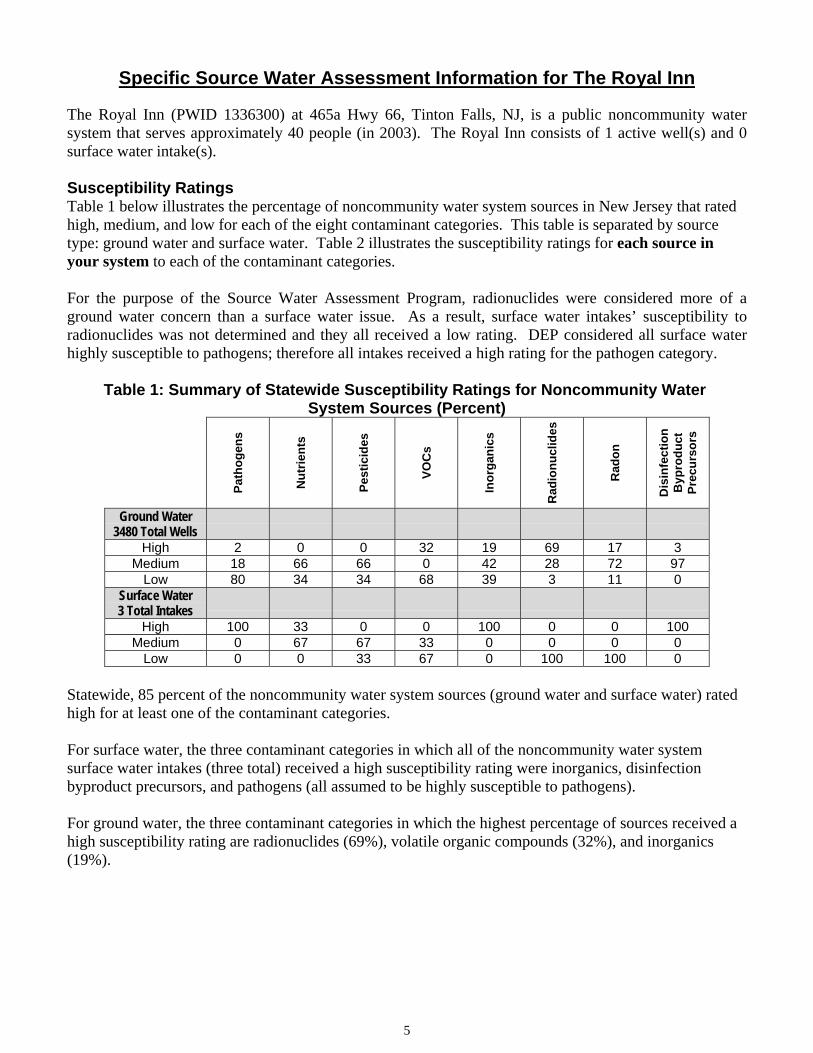
5
Specific Source Water Assessment Information for The Royal Inn
The Royal Inn (PWID 1336300) at 465a Hwy 66, Tinton Falls, NJ, is a public noncommunity watersystem that serves approximately 40 people (in 2003). The Royal Inn consists of 1 active well(s) and 0surface water intake(s).
Susceptibility RatingsTable 1 below illustrates the percentage of noncommunity water system sources in New Jersey that ratedhigh, medium, and low for each of the eight contaminant categories. This table is separated by sourcetype: ground water and surface water. Table 2 illustrates the susceptibility ratings for each source inyour system to each of the contaminant categories.
For the purpose of the Source Water Assessment Program, radionuclides were considered more of aground water concern than a surface water issue. As a result, surface water intakes’ susceptibility toradionuclides was not determined and they all received a low rating. DEP considered all surface waterhighly susceptible to pathogens; therefore all intakes received a high rating for the pathogen category.
Table 1: Summary of Statewide Susceptibility Ratings for Noncommunity Water System Sources (Percent)
Path
ogen
s
Nut
rient
s
Pest
icid
es
VOC
s
Inor
gani
cs
Rad
ionu
clid
es
Rad
on
Dis
infe
ctio
nB
ypro
duct
Prec
urso
rs
Ground Water3480 Total Wells
High 2 0 0 32 19 69 17 3Medium 18 66 66 0 42 28 72 97
Low 80 34 34 68 39 3 11 0Surface Water3 Total Intakes
High 100 33 0 0 100 0 0 100Medium 0 67 67 33 0 0 0 0
Low 0 0 33 67 0 100 100 0
Statewide, 85 percent of the noncommunity water system sources (ground water and surface water) ratedhigh for at least one of the contaminant categories.
For surface water, the three contaminant categories in which all of the noncommunity water systemsurface water intakes (three total) received a high susceptibility rating were inorganics, disinfectionbyproduct precursors, and pathogens (all assumed to be highly susceptible to pathogens).
For ground water, the three contaminant categories in which the highest percentage of sources received ahigh susceptibility rating are radionuclides (69%), volatile organic compounds (32%), and inorganics(19%).

6
Table 2: Susceptibility Ratings for The Royal Inn’s Sources
Path
ogen
s
Nut
rient
s
Pest
icid
es
Vola
tile
Org
anic
Com
poun
ds
Inor
gani
cs
Rad
ionu
clid
es
Rad
on
Dis
infe
ctio
nB
ypro
duct
Prec
urso
rs
Sou
rces
Rating Rating Rating Rating Rating Rating Rating Rating
Well L M M L M H L M
If a system is rated highly susceptible for a contaminant category, it does not mean a customer is orwill be consuming contaminated drinking water. The rating reflects the potential for contamination ofsource water, not the existence of contamination. Public water systems are required to monitor forregulated contaminants and to install treatment if any contaminants are detected at frequencies andconcentrations above allowable levels.
Which Sensitivity and Intensity Factors Determine a Source’s Susceptibility?The susceptibility models determined source water susceptibility is based on the well or intake’s locationand sensitivity and intensity factors (also known as explanatory variables). An explanatory variable canbe used to predict the presence of or the potential presence of a contaminant in ground water or surfacewater.
Some explanatory variables are considered conceptual. A conceptual variable is one that has been shownin a previous scientific investigation to be related to, or is expected to have an effect on, theconcentrations of a constituent. Conceptual variables that did not produce significant univariate statisticalrelations may however, produce a significant relation when used with other variables in multivariatestatistical tests.
The following page contains an Individual Explanatory Variable Inventory, which provides the values ofeach explanatory variable within your source water assessment area. This is not the entire potentialcontaminant source inventory for this system’s source(s).
If the variable value is shown as zero, then attributes or land activities are not present in the source waterassessment area. If a value is not shown, this represents either unavailable data, or in the case of “Distanceto” variables land activities of that type are not present in the source water assessment area.
This information, used in conjunction with USGS’s susceptibility rating scheme, calculates thesusceptibility rating for each source to each contaminant category. If you are interested in USGS’s ratingschemes please refer to the “Contaminant Category Scoring System for Noncommunity Water SystemsAppendix A – Attachment 2” available in the Noncommunity Source Water Assessment Report forTinton Falls Boro, Monmouth County or on the Source Water Assessment Program website athttp://www.state.nj.us/dep/swap/.
Following the Individual Explanatory Variable Inventory for your system is a source water assessmentmap illustrating the source water assessment areas for systems with in Tinton Falls Boro.
For more information please refer to the Noncommunity Source Water Assessment Report for TintonFalls Boro, Monmouth County, available on the Source Water Assessment Program website. You mayalso contact the Bureau of Safe Drinking Water at 609-292-5550.
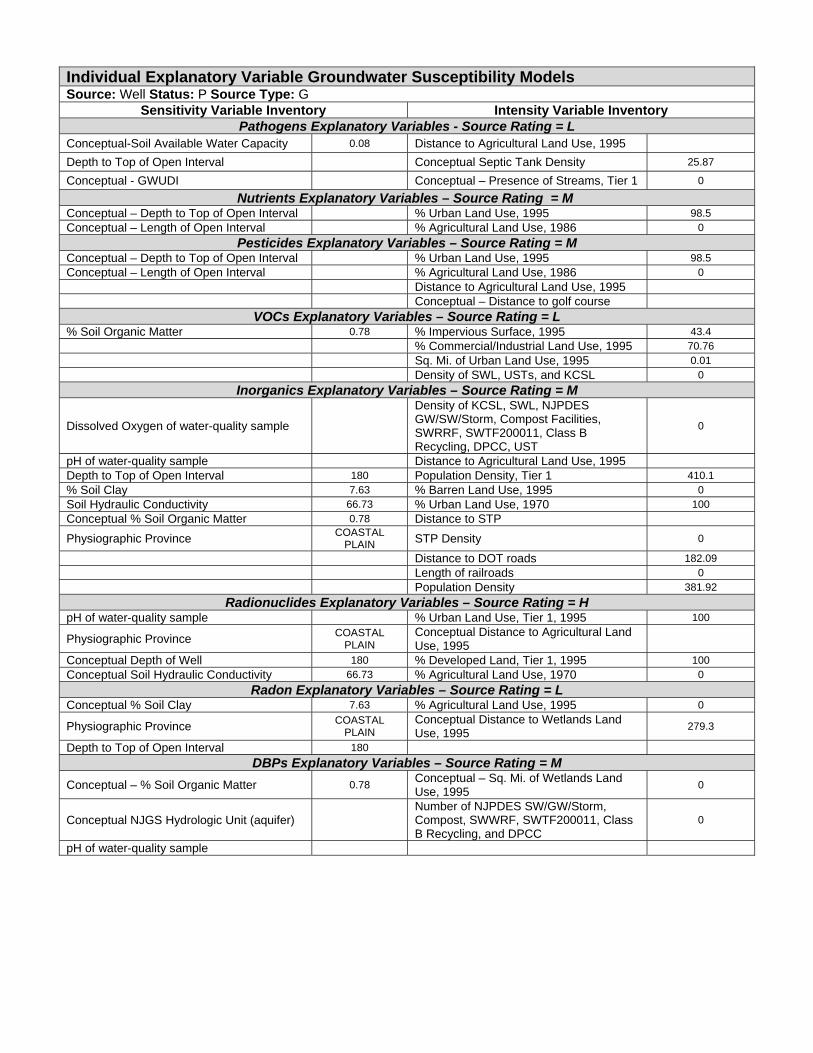
Individual Explanatory Variable Groundwater Susceptibility ModelsSource: Well Status: P Source Type: G
Sensitivity Variable Inventory Intensity Variable InventoryPathogens Explanatory Variables - Source Rating = L
Conceptual-Soil Available Water Capacity 0.08 Distance to Agricultural Land Use, 1995Depth to Top of Open Interval Conceptual Septic Tank Density 25.87
Conceptual - GWUDI Conceptual – Presence of Streams, Tier 1 0
Nutrients Explanatory Variables – Source Rating = M Conceptual – Depth to Top of Open Interval % Urban Land Use, 1995 98.5Conceptual – Length of Open Interval % Agricultural Land Use, 1986 0
Pesticides Explanatory Variables – Source Rating = MConceptual – Depth to Top of Open Interval % Urban Land Use, 1995 98.5Conceptual – Length of Open Interval % Agricultural Land Use, 1986 0
Distance to Agricultural Land Use, 1995Conceptual – Distance to golf course
VOCs Explanatory Variables – Source Rating = L% Soil Organic Matter 0.78 % Impervious Surface, 1995 43.4
% Commercial/Industrial Land Use, 1995 70.76Sq. Mi. of Urban Land Use, 1995 0.01Density of SWL, USTs, and KCSL 0
Inorganics Explanatory Variables – Source Rating = M
Dissolved Oxygen of water-quality sample
Density of KCSL, SWL, NJPDESGW/SW/Storm, Compost Facilities,SWRRF, SWTF200011, Class BRecycling, DPCC, UST
0
pH of water-quality sample Distance to Agricultural Land Use, 1995Depth to Top of Open Interval 180 Population Density, Tier 1 410.1% Soil Clay 7.63 % Barren Land Use, 1995 0Soil Hydraulic Conductivity 66.73 % Urban Land Use, 1970 100Conceptual % Soil Organic Matter 0.78 Distance to STPPhysiographic Province COASTAL
PLAIN STP Density 0
Distance to DOT roads 182.09Length of railroads 0Population Density 381.92
Radionuclides Explanatory Variables – Source Rating = HpH of water-quality sample % Urban Land Use, Tier 1, 1995 100
Physiographic Province COASTALPLAIN
Conceptual Distance to Agricultural LandUse, 1995
Conceptual Depth of Well 180 % Developed Land, Tier 1, 1995 100Conceptual Soil Hydraulic Conductivity 66.73 % Agricultural Land Use, 1970 0
Radon Explanatory Variables – Source Rating = LConceptual % Soil Clay 7.63 % Agricultural Land Use, 1995 0
Physiographic Province COASTALPLAIN
Conceptual Distance to Wetlands LandUse, 1995 279.3
Depth to Top of Open Interval 180DBPs Explanatory Variables – Source Rating = M
Conceptual – % Soil Organic Matter 0.78 Conceptual – Sq. Mi. of Wetlands LandUse, 1995 0
Conceptual NJGS Hydrologic Unit (aquifer)Number of NJPDES SW/GW/Storm,Compost, SWWRF, SWTF200011, ClassB Recycling, and DPCC
0
pH of water-quality sample

1
Luigi's Tavern1336302
Source Water Assessment ReportA State Assessment of Your Drinking Water Source’sVulnerability
As a requirement of the 1996 Amendments to the Federal Safe DrinkingWater Act, New Jersey Department of Environmental Protection (DEP)performed a source water assessment of each source of public drinkingwater and determined each source’s susceptibility to contamination.Susceptibility is a measure of the potential exposure of a drinking water source to contamination; actual(if any) contamination is not measured.
DEP, in conjunction with the United States Geological Survey (USGS), performed the following steps todetermine the drinking water source’s susceptibility. Identifying the area (known as the source water assessment area) that supplies water to your public
drinking water system; Inventorying any significant potential sources of contamination in the area; and Analyzing how susceptible the drinking water source is to the potential sources of contamination.
DEP evaluated the susceptibility of all public water system sources to eight categories of contaminants. Pathogens: Disease-causing organisms such as bacteria and viruses. Common sources are animal and human
fecal wastes. Nutrients: Compounds, minerals and elements that aid growth, that are both naturally occurring and man-
made. Examples include nitrogen and phosphorus. Volatile Organic Compounds: Man-made chemicals used as solvents, degreasers, and gasoline components.
Examples include benzene, methyl tertiary butyl ether (MTBE), and vinyl chloride. Pesticides: Man-made chemicals used to control pests, weeds and fungus. Common sources include land
application and manufacturing centers of pesticides. Examples include herbicides such as atrazine, andinsecticides such as chlordane.
Inorganics: Mineral-based compounds that are both naturally occurring and man-made. Examples includearsenic, asbestos, copper, lead, and nitrate.
Radionuclides: Radioactive substances that are both naturally occurring and man-made. Examples includeradium and uranium.
Radon: Colorless, odorless, cancer-causing gas that occurs naturally in the environment. For more informationgo to http://www.nj.gov/dep/rpp/radon/index.htm or call (800) 648-0394.
Disinfection Byproduct Precursors: A common source is naturally occurring organic matter in surface water.Disinfection byproducts are formed when the disinfectants (usually chlorine) used to kill pathogens react withdissolved organic material (for example leaves) present in surface water.
To determine a source’s susceptibility to these contaminants, the USGS, with DEP assistance, developedstatistical models based on extensive analysis of existing well sample data and surface water intake data.The statistical models determined the relationship between environmental factors and the probability forcontamination to occur. These models identified factors, such as land use or geology, found to besignificantly “linked” to a public water system source’s potential to become contaminated by one or morecategories of contaminants. DEP and USGS looked at factors that might affect the quality of drinkingwater sources and separated them into two categories.

2
How “sensitive” the water supply is to contamination. For example, a shallow well or surface watersource, like a reservoir, would be more exposed to contamination from the surface or above groundthan a confined well.
How frequently a contaminant is used or exists near the source. This is known as “intensity of use.”For example, the number and/or types of activities (such as industry or agriculture) surrounding thesource.
The specific sensitivity and intensity of use factors and their values within each source water assessmentarea for your source(s) are provided on page 7 of this report.
Using the susceptibility factors, the statistical models provided a numerical score for each source ofdrinking water for each contaminant category. These were then converted into high (H), medium (M), orlow (L) susceptibility ratings.
The Safe Drinking Water Standards or Maximum Contaminant Levels (MCLs) were used to define thethree susceptibility ratings (H, M, and L). These standards are developed based health effects, analyticaland treatment factors on either acute or long-term impacts related to drinking water exposure. A lowsusceptibility rating means a potential contaminant level was predicted to be less than 10 percent of theMCL for that contaminant category. A medium rating means the potential contaminant level waspredicted to be equal to or greater than 10 percent and less than 50 percent of the MCL. A high ratingwas assigned to those sources that were predicted to have potential contaminant levels equal to or greaterthan 50 percent of the MCL. Sources with high susceptibility ratings are still likely to have contaminantconcentrations below the MCL.
The susceptibility ratings of your sources to each of the contaminant categories are provided on page 6 ofthis report.
Source Water Assessment Program GoalsThe information obtained from the source water assessments may be used to achieve the following goals:
1. Protect sources of drinking water. Source water protection focuses on preserving and protecting the public drinking water source. Thesource water assessment results may be used by DEP, purveyors, and local planning officials to lay thegroundwork for advancing drinking water protection efforts. State and local agencies, as well as theregulated community, have made significant strides to protect the quality of our water resources. Majorwater quality improvements have been made as a result of water quality and drinking water standards andprograms (both regulatory and nonregulatory) designed to ensure standards are met. Waste managementand clean up programs have had success in controlling releases and ensuring actions are taken to achievestandards if releases occur. Recent measures to control non-point sources have expanded the DEP’s waterquality protection programs by recognizing the link between land use change and water resource impacts.The Safe Drinking Water Program is designed to ensure that water delivered for human consumptionmeets drinking water standards. In addition to these programs, major initiatives such as the HighlandsWater Protection and Planning Act, Surface Water Quality Standards and Category One Designation, andStormwater Management Rules have recently been accomplished. Despite this success, the DEPrecognizes the ongoing importance of using new information such as that from the source waterassessments to evaluate the need for additional protection measures of drinking water sources. The DEP iscurrently reviewing the source water assessments to identify any necessary additional source waterprotection measures.

3
2. Public education of SWAP information. DEP incorporated public education throughout the development and implementation of the Source WaterAssessment Program. During the source water assessment process, DEP met with interested parties,beginning with the development of the SWAP Plan, published articles, wrote two newsletters, anddeveloped a SWAP web site. The SWAP web site contains information on the program, technicalresources, frequently asked questions, source water assessment results, and links to additional sites ofinterest. Upon completion of the source water assessments, DEP generated a source water assessmentreport for each public water system to report the susceptibility ratings of public drinking water sources topotential contamination.
The goal of the public education efforts is to raise public awareness of the source of their drinking waterand the potential contaminants that could impair the water's quality. To continue fulfilling the educationgoal, DEP will conduct training sessions following the release of the Source Water Assessment Reports.
3. Establish a customized monitoring schedule for each public water system. The source water assessments will assist DEP in improving current monitoring requirements forindividual public water systems. Currently, the Environmental Protection Agency (EPA) and the DEPhave mandatory monitoring schedules that depend on a variety of factors that can include the source ofthe water (ground water or surface water) and the surrounding land use. These schedules may becustomized based on the susceptibility of the sources of drinking water.
Where does drinking water come from?There are two basic sources of drinking water: ground water and surface water.
Ground water is water found beneath the Earth’s surface. Ground water comes from rain and snowseeping into rock and soil. Ground water is stored in underground areas called aquifers. Aquifers supplywells and springs. Wells in New Jersey range from about 15 feet to 2,000 feet deep.
Surface water is the water naturally open to the atmosphere, such as rivers, lakes, streams and reservoirs.Precipitation that does not infiltrate the ground or evaporate into the sky runs off into surface waterbodies.
Ground water can seep into a stream, river or other surface water body, recharging surface water bodies.Likewise, under some circumstances, surface water can seep into an adjacent aquifer.
A water system obtains its water from 1) wells drilled into the ground that pump out ground water; 2)devices called surface water intakes placed on a river, stream, or reservoir; or 3) both.
What factors may affect the quality of your drinking water source?A variety of conditions and activities may affect the quality of drinking water source. These includegeology (rock and soil types); depth of a well or location of a surface water intake; how the landsurrounding the source is used (for industry, agriculture or development); the use of pesticides andfertilizers; and the presence of contaminated sites, leaking underground storage tanks, and landfills.Please refer to pages 6 and 7 of this report for specific potential contaminant source information.

4
What steps are being taken now to ensure my drinking water quality?The DEP has numerous programs in place to maintain and protect the quality of our State's waterresources. For example, the Safe Drinking Water Program is designed to ensure that water delivered forhuman consumption meets DEP's stringent health-based drinking water standards. Additionally, DEP haspermitting, waste management, and clean up programs in place to avoid and control potentialcontamination. Key DEP drinking water protection initiatives will be phased-in over time in source waterassessment areas to advance existing program protections.
What can you and others do to help?While government at the state and local levels can do their part, there are actions you and your neighborscan take now to help protect our precious and shared natural resource.
Here’s just a few ways you and others can help ensure clean and plentiful water for New Jersey – now andin the future. Join us today for a clean water future. Dispose of waste properly. Some materials such as motor oil, paint, flea collars, and household
cleaners have the potential to contaminate source water. Contact your local Department of PublicWorks for proper household hazardous waste disposal.
Limit your use of fertilizer, pesticides, and herbicides.
Here are some actions that municipal and county officials/local and county planners can take and you canhelp encourage and support. Manage and work with owners of existing potential contaminant sources to minimize potential
contamination. Establish regulations prohibiting or restricting certain activities or land uses within the source water
assessment area. Take appropriate enforcement action when necessary. Update municipal master plans to ensure greater protection. Purchase lands or create conservation easements within the source water assessment area.
Illustration courtesy of USGS

5
Specific Source Water Assessment Information for Luigi's Tavern
Luigi's Tavern (PWID 1336302) at 5119 Asbury Ave, Tinton Falls, NJ, is a public noncommunity watersystem that serves approximately 100 people (in 2003). Luigi's Tavern consists of 1 active well(s) and 0surface water intake(s).
Susceptibility RatingsTable 1 below illustrates the percentage of noncommunity water system sources in New Jersey that ratedhigh, medium, and low for each of the eight contaminant categories. This table is separated by sourcetype: ground water and surface water. Table 2 illustrates the susceptibility ratings for each source inyour system to each of the contaminant categories.
For the purpose of the Source Water Assessment Program, radionuclides were considered more of aground water concern than a surface water issue. As a result, surface water intakes’ susceptibility toradionuclides was not determined and they all received a low rating. DEP considered all surface waterhighly susceptible to pathogens; therefore all intakes received a high rating for the pathogen category.
Table 1: Summary of Statewide Susceptibility Ratings for Noncommunity Water System Sources (Percent)
Path
ogen
s
Nut
rient
s
Pest
icid
es
VOC
s
Inor
gani
cs
Rad
ionu
clid
es
Rad
on
Dis
infe
ctio
nB
ypro
duct
Prec
urso
rs
Ground Water3480 Total Wells
High 2 0 0 32 19 69 17 3Medium 18 66 66 0 42 28 72 97
Low 80 34 34 68 39 3 11 0Surface Water3 Total Intakes
High 100 33 0 0 100 0 0 100Medium 0 67 67 33 0 0 0 0
Low 0 0 33 67 0 100 100 0
Statewide, 85 percent of the noncommunity water system sources (ground water and surface water) ratedhigh for at least one of the contaminant categories.
For surface water, the three contaminant categories in which all of the noncommunity water systemsurface water intakes (three total) received a high susceptibility rating were inorganics, disinfectionbyproduct precursors, and pathogens (all assumed to be highly susceptible to pathogens).
For ground water, the three contaminant categories in which the highest percentage of sources received ahigh susceptibility rating are radionuclides (69%), volatile organic compounds (32%), and inorganics(19%).

6
Table 2: Susceptibility Ratings for Luigi's Tavern’s Sources
Path
ogen
s
Nut
rient
s
Pest
icid
es
Vola
tile
Org
anic
Com
poun
ds
Inor
gani
cs
Rad
ionu
clid
es
Rad
on
Dis
infe
ctio
nB
ypro
duct
Prec
urso
rs
Sou
rces
Rating Rating Rating Rating Rating Rating Rating Rating
Well L M M L M M L M
If a system is rated highly susceptible for a contaminant category, it does not mean a customer is orwill be consuming contaminated drinking water. The rating reflects the potential for contamination ofsource water, not the existence of contamination. Public water systems are required to monitor forregulated contaminants and to install treatment if any contaminants are detected at frequencies andconcentrations above allowable levels.
Which Sensitivity and Intensity Factors Determine a Source’s Susceptibility?The susceptibility models determined source water susceptibility is based on the well or intake’s locationand sensitivity and intensity factors (also known as explanatory variables). An explanatory variable canbe used to predict the presence of or the potential presence of a contaminant in ground water or surfacewater.
Some explanatory variables are considered conceptual. A conceptual variable is one that has been shownin a previous scientific investigation to be related to, or is expected to have an effect on, theconcentrations of a constituent. Conceptual variables that did not produce significant univariate statisticalrelations may however, produce a significant relation when used with other variables in multivariatestatistical tests.
The following page contains an Individual Explanatory Variable Inventory, which provides the values ofeach explanatory variable within your source water assessment area. This is not the entire potentialcontaminant source inventory for this system’s source(s).
If the variable value is shown as zero, then attributes or land activities are not present in the source waterassessment area. If a value is not shown, this represents either unavailable data, or in the case of “Distanceto” variables land activities of that type are not present in the source water assessment area.
This information, used in conjunction with USGS’s susceptibility rating scheme, calculates thesusceptibility rating for each source to each contaminant category. If you are interested in USGS’s ratingschemes please refer to the “Contaminant Category Scoring System for Noncommunity Water SystemsAppendix A – Attachment 2” available in the Noncommunity Source Water Assessment Report forTinton Falls Boro, Monmouth County or on the Source Water Assessment Program website athttp://www.state.nj.us/dep/swap/.
Following the Individual Explanatory Variable Inventory for your system is a source water assessmentmap illustrating the source water assessment areas for systems with in Tinton Falls Boro.
For more information please refer to the Noncommunity Source Water Assessment Report for TintonFalls Boro, Monmouth County, available on the Source Water Assessment Program website. You mayalso contact the Bureau of Safe Drinking Water at 609-292-5550.

Individual Explanatory Variable Groundwater Susceptibility ModelsSource: Well Status: P Source Type: G
Sensitivity Variable Inventory Intensity Variable InventoryPathogens Explanatory Variables - Source Rating = L
Conceptual-Soil Available Water Capacity 0.08 Distance to Agricultural Land Use, 1995Depth to Top of Open Interval Conceptual Septic Tank Density 20.98
Conceptual - GWUDI Conceptual – Presence of Streams, Tier 1 0
Nutrients Explanatory Variables – Source Rating = M Conceptual – Depth to Top of Open Interval % Urban Land Use, 1995 50.3Conceptual – Length of Open Interval % Agricultural Land Use, 1986 0
Pesticides Explanatory Variables – Source Rating = MConceptual – Depth to Top of Open Interval % Urban Land Use, 1995 50.3Conceptual – Length of Open Interval % Agricultural Land Use, 1986 0
Distance to Agricultural Land Use, 1995Conceptual – Distance to golf course
VOCs Explanatory Variables – Source Rating = L% Soil Organic Matter 0.76 % Impervious Surface, 1995 29.7
% Commercial/Industrial Land Use, 1995 48.7Sq. Mi. of Urban Land Use, 1995 0.01Density of SWL, USTs, and KCSL 0
Inorganics Explanatory Variables – Source Rating = M
Dissolved Oxygen of water-quality sample
Density of KCSL, SWL, NJPDESGW/SW/Storm, Compost Facilities,SWRRF, SWTF200011, Class BRecycling, DPCC, UST
0
pH of water-quality sample Distance to Agricultural Land Use, 1995Depth to Top of Open Interval 180 Population Density, Tier 1 416.73% Soil Clay 3.73 % Barren Land Use, 1995 0Soil Hydraulic Conductivity 81.28 % Urban Land Use, 1970 0Conceptual % Soil Organic Matter 0.76 Distance to STPPhysiographic Province COASTAL
PLAIN STP Density 0
Distance to DOT roads 147.08Length of railroads 0Population Density 416.73
Radionuclides Explanatory Variables – Source Rating = MpH of water-quality sample % Urban Land Use, Tier 1, 1995 42.2
Physiographic Province COASTALPLAIN
Conceptual Distance to Agricultural LandUse, 1995
Conceptual Depth of Well 180 % Developed Land, Tier 1, 1995 42.2Conceptual Soil Hydraulic Conductivity 81.28 % Agricultural Land Use, 1970 0
Radon Explanatory Variables – Source Rating = LConceptual % Soil Clay 3.73 % Agricultural Land Use, 1995 0
Physiographic Province COASTALPLAIN
Conceptual Distance to Wetlands LandUse, 1995 43.22
Depth to Top of Open Interval 180DBPs Explanatory Variables – Source Rating = M
Conceptual – % Soil Organic Matter 0.76 Conceptual – Sq. Mi. of Wetlands LandUse, 1995 0
Conceptual NJGS Hydrologic Unit (aquifer)Number of NJPDES SW/GW/Storm,Compost, SWWRF, SWTF200011, ClassB Recycling, and DPCC
0
pH of water-quality sample

1
Tally Ho Inn1336303
Source Water Assessment ReportA State Assessment of Your Drinking Water Source’sVulnerability
As a requirement of the 1996 Amendments to the Federal Safe DrinkingWater Act, New Jersey Department of Environmental Protection (DEP)performed a source water assessment of each source of public drinkingwater and determined each source’s susceptibility to contamination.Susceptibility is a measure of the potential exposure of a drinking water source to contamination; actual(if any) contamination is not measured.
DEP, in conjunction with the United States Geological Survey (USGS), performed the following steps todetermine the drinking water source’s susceptibility. Identifying the area (known as the source water assessment area) that supplies water to your public
drinking water system; Inventorying any significant potential sources of contamination in the area; and Analyzing how susceptible the drinking water source is to the potential sources of contamination.
DEP evaluated the susceptibility of all public water system sources to eight categories of contaminants. Pathogens: Disease-causing organisms such as bacteria and viruses. Common sources are animal and human
fecal wastes. Nutrients: Compounds, minerals and elements that aid growth, that are both naturally occurring and man-
made. Examples include nitrogen and phosphorus. Volatile Organic Compounds: Man-made chemicals used as solvents, degreasers, and gasoline components.
Examples include benzene, methyl tertiary butyl ether (MTBE), and vinyl chloride. Pesticides: Man-made chemicals used to control pests, weeds and fungus. Common sources include land
application and manufacturing centers of pesticides. Examples include herbicides such as atrazine, andinsecticides such as chlordane.
Inorganics: Mineral-based compounds that are both naturally occurring and man-made. Examples includearsenic, asbestos, copper, lead, and nitrate.
Radionuclides: Radioactive substances that are both naturally occurring and man-made. Examples includeradium and uranium.
Radon: Colorless, odorless, cancer-causing gas that occurs naturally in the environment. For more informationgo to http://www.nj.gov/dep/rpp/radon/index.htm or call (800) 648-0394.
Disinfection Byproduct Precursors: A common source is naturally occurring organic matter in surface water.Disinfection byproducts are formed when the disinfectants (usually chlorine) used to kill pathogens react withdissolved organic material (for example leaves) present in surface water.
To determine a source’s susceptibility to these contaminants, the USGS, with DEP assistance, developedstatistical models based on extensive analysis of existing well sample data and surface water intake data.The statistical models determined the relationship between environmental factors and the probability forcontamination to occur. These models identified factors, such as land use or geology, found to besignificantly “linked” to a public water system source’s potential to become contaminated by one or morecategories of contaminants. DEP and USGS looked at factors that might affect the quality of drinkingwater sources and separated them into two categories.

2
How “sensitive” the water supply is to contamination. For example, a shallow well or surface watersource, like a reservoir, would be more exposed to contamination from the surface or above groundthan a confined well.
How frequently a contaminant is used or exists near the source. This is known as “intensity of use.”For example, the number and/or types of activities (such as industry or agriculture) surrounding thesource.
The specific sensitivity and intensity of use factors and their values within each source water assessmentarea for your source(s) are provided on page 7 of this report.
Using the susceptibility factors, the statistical models provided a numerical score for each source ofdrinking water for each contaminant category. These were then converted into high (H), medium (M), orlow (L) susceptibility ratings.
The Safe Drinking Water Standards or Maximum Contaminant Levels (MCLs) were used to define thethree susceptibility ratings (H, M, and L). These standards are developed based health effects, analyticaland treatment factors on either acute or long-term impacts related to drinking water exposure. A lowsusceptibility rating means a potential contaminant level was predicted to be less than 10 percent of theMCL for that contaminant category. A medium rating means the potential contaminant level waspredicted to be equal to or greater than 10 percent and less than 50 percent of the MCL. A high ratingwas assigned to those sources that were predicted to have potential contaminant levels equal to or greaterthan 50 percent of the MCL. Sources with high susceptibility ratings are still likely to have contaminantconcentrations below the MCL.
The susceptibility ratings of your sources to each of the contaminant categories are provided on page 6 ofthis report.
Source Water Assessment Program GoalsThe information obtained from the source water assessments may be used to achieve the following goals:
1. Protect sources of drinking water. Source water protection focuses on preserving and protecting the public drinking water source. Thesource water assessment results may be used by DEP, purveyors, and local planning officials to lay thegroundwork for advancing drinking water protection efforts. State and local agencies, as well as theregulated community, have made significant strides to protect the quality of our water resources. Majorwater quality improvements have been made as a result of water quality and drinking water standards andprograms (both regulatory and nonregulatory) designed to ensure standards are met. Waste managementand clean up programs have had success in controlling releases and ensuring actions are taken to achievestandards if releases occur. Recent measures to control non-point sources have expanded the DEP’s waterquality protection programs by recognizing the link between land use change and water resource impacts.The Safe Drinking Water Program is designed to ensure that water delivered for human consumptionmeets drinking water standards. In addition to these programs, major initiatives such as the HighlandsWater Protection and Planning Act, Surface Water Quality Standards and Category One Designation, andStormwater Management Rules have recently been accomplished. Despite this success, the DEPrecognizes the ongoing importance of using new information such as that from the source waterassessments to evaluate the need for additional protection measures of drinking water sources. The DEP iscurrently reviewing the source water assessments to identify any necessary additional source waterprotection measures.

3
2. Public education of SWAP information. DEP incorporated public education throughout the development and implementation of the Source WaterAssessment Program. During the source water assessment process, DEP met with interested parties,beginning with the development of the SWAP Plan, published articles, wrote two newsletters, anddeveloped a SWAP web site. The SWAP web site contains information on the program, technicalresources, frequently asked questions, source water assessment results, and links to additional sites ofinterest. Upon completion of the source water assessments, DEP generated a source water assessmentreport for each public water system to report the susceptibility ratings of public drinking water sources topotential contamination.
The goal of the public education efforts is to raise public awareness of the source of their drinking waterand the potential contaminants that could impair the water's quality. To continue fulfilling the educationgoal, DEP will conduct training sessions following the release of the Source Water Assessment Reports.
3. Establish a customized monitoring schedule for each public water system. The source water assessments will assist DEP in improving current monitoring requirements forindividual public water systems. Currently, the Environmental Protection Agency (EPA) and the DEPhave mandatory monitoring schedules that depend on a variety of factors that can include the source ofthe water (ground water or surface water) and the surrounding land use. These schedules may becustomized based on the susceptibility of the sources of drinking water.
Where does drinking water come from?There are two basic sources of drinking water: ground water and surface water.
Ground water is water found beneath the Earth’s surface. Ground water comes from rain and snowseeping into rock and soil. Ground water is stored in underground areas called aquifers. Aquifers supplywells and springs. Wells in New Jersey range from about 15 feet to 2,000 feet deep.
Surface water is the water naturally open to the atmosphere, such as rivers, lakes, streams and reservoirs.Precipitation that does not infiltrate the ground or evaporate into the sky runs off into surface waterbodies.
Ground water can seep into a stream, river or other surface water body, recharging surface water bodies.Likewise, under some circumstances, surface water can seep into an adjacent aquifer.
A water system obtains its water from 1) wells drilled into the ground that pump out ground water; 2)devices called surface water intakes placed on a river, stream, or reservoir; or 3) both.
What factors may affect the quality of your drinking water source?A variety of conditions and activities may affect the quality of drinking water source. These includegeology (rock and soil types); depth of a well or location of a surface water intake; how the landsurrounding the source is used (for industry, agriculture or development); the use of pesticides andfertilizers; and the presence of contaminated sites, leaking underground storage tanks, and landfills.Please refer to pages 6 and 7 of this report for specific potential contaminant source information.

4
What steps are being taken now to ensure my drinking water quality?The DEP has numerous programs in place to maintain and protect the quality of our State's waterresources. For example, the Safe Drinking Water Program is designed to ensure that water delivered forhuman consumption meets DEP's stringent health-based drinking water standards. Additionally, DEP haspermitting, waste management, and clean up programs in place to avoid and control potentialcontamination. Key DEP drinking water protection initiatives will be phased-in over time in source waterassessment areas to advance existing program protections.
What can you and others do to help?While government at the state and local levels can do their part, there are actions you and your neighborscan take now to help protect our precious and shared natural resource.
Here’s just a few ways you and others can help ensure clean and plentiful water for New Jersey – now andin the future. Join us today for a clean water future. Dispose of waste properly. Some materials such as motor oil, paint, flea collars, and household
cleaners have the potential to contaminate source water. Contact your local Department of PublicWorks for proper household hazardous waste disposal.
Limit your use of fertilizer, pesticides, and herbicides.
Here are some actions that municipal and county officials/local and county planners can take and you canhelp encourage and support. Manage and work with owners of existing potential contaminant sources to minimize potential
contamination. Establish regulations prohibiting or restricting certain activities or land uses within the source water
assessment area. Take appropriate enforcement action when necessary. Update municipal master plans to ensure greater protection. Purchase lands or create conservation easements within the source water assessment area.
Illustration courtesy of USGS

5
Specific Source Water Assessment Information for Tally Ho Inn
Tally Ho Inn (PWID 1336303) at 4118 Rte 33, Tinton Falls, NJ, is a public noncommunity water systemthat serves approximately 90 people (in 2003). Tally Ho Inn consists of 1 active well(s) and 0 surfacewater intake(s).
Susceptibility RatingsTable 1 below illustrates the percentage of noncommunity water system sources in New Jersey that ratedhigh, medium, and low for each of the eight contaminant categories. This table is separated by sourcetype: ground water and surface water. Table 2 illustrates the susceptibility ratings for each source inyour system to each of the contaminant categories.
For the purpose of the Source Water Assessment Program, radionuclides were considered more of aground water concern than a surface water issue. As a result, surface water intakes’ susceptibility toradionuclides was not determined and they all received a low rating. DEP considered all surface waterhighly susceptible to pathogens; therefore all intakes received a high rating for the pathogen category.
Table 1: Summary of Statewide Susceptibility Ratings for Noncommunity Water System Sources (Percent)
Path
ogen
s
Nut
rient
s
Pest
icid
es
VOC
s
Inor
gani
cs
Rad
ionu
clid
es
Rad
on
Dis
infe
ctio
nB
ypro
duct
Prec
urso
rs
Ground Water3480 Total Wells
High 2 0 0 32 19 69 17 3Medium 18 66 66 0 42 28 72 97
Low 80 34 34 68 39 3 11 0Surface Water3 Total Intakes
High 100 33 0 0 100 0 0 100Medium 0 67 67 33 0 0 0 0
Low 0 0 33 67 0 100 100 0
Statewide, 85 percent of the noncommunity water system sources (ground water and surface water) ratedhigh for at least one of the contaminant categories.
For surface water, the three contaminant categories in which all of the noncommunity water systemsurface water intakes (three total) received a high susceptibility rating were inorganics, disinfectionbyproduct precursors, and pathogens (all assumed to be highly susceptible to pathogens).
For ground water, the three contaminant categories in which the highest percentage of sources received ahigh susceptibility rating are radionuclides (69%), volatile organic compounds (32%), and inorganics(19%).

6
Table 2: Susceptibility Ratings for Tally Ho Inn’s Sources
Path
ogen
s
Nut
rient
s
Pest
icid
es
Vola
tile
Org
anic
Com
poun
ds
Inor
gani
cs
Rad
ionu
clid
es
Rad
on
Dis
infe
ctio
nB
ypro
duct
Prec
urso
rs
Sou
rces
Rating Rating Rating Rating Rating Rating Rating Rating
Well L L L L M H M M
If a system is rated highly susceptible for a contaminant category, it does not mean a customer is orwill be consuming contaminated drinking water. The rating reflects the potential for contamination ofsource water, not the existence of contamination. Public water systems are required to monitor forregulated contaminants and to install treatment if any contaminants are detected at frequencies andconcentrations above allowable levels.
Which Sensitivity and Intensity Factors Determine a Source’s Susceptibility?The susceptibility models determined source water susceptibility is based on the well or intake’s locationand sensitivity and intensity factors (also known as explanatory variables). An explanatory variable canbe used to predict the presence of or the potential presence of a contaminant in ground water or surfacewater.
Some explanatory variables are considered conceptual. A conceptual variable is one that has been shownin a previous scientific investigation to be related to, or is expected to have an effect on, theconcentrations of a constituent. Conceptual variables that did not produce significant univariate statisticalrelations may however, produce a significant relation when used with other variables in multivariatestatistical tests.
The following page contains an Individual Explanatory Variable Inventory, which provides the values ofeach explanatory variable within your source water assessment area. This is not the entire potentialcontaminant source inventory for this system’s source(s).
If the variable value is shown as zero, then attributes or land activities are not present in the source waterassessment area. If a value is not shown, this represents either unavailable data, or in the case of “Distanceto” variables land activities of that type are not present in the source water assessment area.
This information, used in conjunction with USGS’s susceptibility rating scheme, calculates thesusceptibility rating for each source to each contaminant category. If you are interested in USGS’s ratingschemes please refer to the “Contaminant Category Scoring System for Noncommunity Water SystemsAppendix A – Attachment 2” available in the Noncommunity Source Water Assessment Report forTinton Falls Boro, Monmouth County or on the Source Water Assessment Program website athttp://www.state.nj.us/dep/swap/.
Following the Individual Explanatory Variable Inventory for your system is a source water assessmentmap illustrating the source water assessment areas for systems with in Tinton Falls Boro.
For more information please refer to the Noncommunity Source Water Assessment Report for TintonFalls Boro, Monmouth County, available on the Source Water Assessment Program website. You mayalso contact the Bureau of Safe Drinking Water at 609-292-5550.

Individual Explanatory Variable Groundwater Susceptibility ModelsSource: Well Status: P Source Type: G
Sensitivity Variable Inventory Intensity Variable InventoryPathogens Explanatory Variables - Source Rating = L
Conceptual-Soil Available Water Capacity 0.08 Distance to Agricultural Land Use, 1995Depth to Top of Open Interval Conceptual Septic Tank Density 20.98
Conceptual - GWUDI Conceptual – Presence of Streams, Tier 1 0
Nutrients Explanatory Variables – Source Rating = L Conceptual – Depth to Top of Open Interval % Urban Land Use, 1995 12.3Conceptual – Length of Open Interval % Agricultural Land Use, 1986 0
Pesticides Explanatory Variables – Source Rating = LConceptual – Depth to Top of Open Interval % Urban Land Use, 1995 12.3Conceptual – Length of Open Interval % Agricultural Land Use, 1986 0
Distance to Agricultural Land Use, 1995Conceptual – Distance to golf course
VOCs Explanatory Variables – Source Rating = L% Soil Organic Matter 0.48 % Impervious Surface, 1995 7.3
% Commercial/Industrial Land Use, 1995 11.8Sq. Mi. of Urban Land Use, 1995 0Density of SWL, USTs, and KCSL 0
Inorganics Explanatory Variables – Source Rating = M
Dissolved Oxygen of water-quality sample
Density of KCSL, SWL, NJPDESGW/SW/Storm, Compost Facilities,SWRRF, SWTF200011, Class BRecycling, DPCC, UST
0
pH of water-quality sample Distance to Agricultural Land Use, 1995Depth to Top of Open Interval 89 Population Density, Tier 1 416.73% Soil Clay 5.54 % Barren Land Use, 1995 0Soil Hydraulic Conductivity 85.91 % Urban Land Use, 1970 4.21Conceptual % Soil Organic Matter 0.48 Distance to STPPhysiographic Province COASTAL
PLAIN STP Density 0
Distance to DOT roads 63.89Length of railroads 0Population Density 416.73
Radionuclides Explanatory Variables – Source Rating = HpH of water-quality sample % Urban Land Use, Tier 1, 1995 37.76
Physiographic Province COASTALPLAIN
Conceptual Distance to Agricultural LandUse, 1995
Conceptual Depth of Well 89 % Developed Land, Tier 1, 1995 66.4Conceptual Soil Hydraulic Conductivity 85.91 % Agricultural Land Use, 1970 94.99
Radon Explanatory Variables – Source Rating = MConceptual % Soil Clay 5.54 % Agricultural Land Use, 1995 28.5
Physiographic Province COASTALPLAIN
Conceptual Distance to Wetlands LandUse, 1995 27.32
Depth to Top of Open Interval 89DBPs Explanatory Variables – Source Rating = M
Conceptual – % Soil Organic Matter 0.48 Conceptual – Sq. Mi. of Wetlands LandUse, 1995 0.02
Conceptual NJGS Hydrologic Unit (aquifer)Number of NJPDES SW/GW/Storm,Compost, SWWRF, SWTF200011, ClassB Recycling, and DPCC
0
pH of water-quality sample

1
7-11 STORE1336305
Source Water Assessment ReportA State Assessment of Your Drinking Water Source’sVulnerability
As a requirement of the 1996 Amendments to the Federal Safe DrinkingWater Act, New Jersey Department of Environmental Protection (DEP)performed a source water assessment of each source of public drinkingwater and determined each source’s susceptibility to contamination.Susceptibility is a measure of the potential exposure of a drinking water source to contamination; actual(if any) contamination is not measured.
DEP, in conjunction with the United States Geological Survey (USGS), performed the following steps todetermine the drinking water source’s susceptibility. Identifying the area (known as the source water assessment area) that supplies water to your public
drinking water system; Inventorying any significant potential sources of contamination in the area; and Analyzing how susceptible the drinking water source is to the potential sources of contamination.
DEP evaluated the susceptibility of all public water system sources to eight categories of contaminants. Pathogens: Disease-causing organisms such as bacteria and viruses. Common sources are animal and human
fecal wastes. Nutrients: Compounds, minerals and elements that aid growth, that are both naturally occurring and man-
made. Examples include nitrogen and phosphorus. Volatile Organic Compounds: Man-made chemicals used as solvents, degreasers, and gasoline components.
Examples include benzene, methyl tertiary butyl ether (MTBE), and vinyl chloride. Pesticides: Man-made chemicals used to control pests, weeds and fungus. Common sources include land
application and manufacturing centers of pesticides. Examples include herbicides such as atrazine, andinsecticides such as chlordane.
Inorganics: Mineral-based compounds that are both naturally occurring and man-made. Examples includearsenic, asbestos, copper, lead, and nitrate.
Radionuclides: Radioactive substances that are both naturally occurring and man-made. Examples includeradium and uranium.
Radon: Colorless, odorless, cancer-causing gas that occurs naturally in the environment. For more informationgo to http://www.nj.gov/dep/rpp/radon/index.htm or call (800) 648-0394.
Disinfection Byproduct Precursors: A common source is naturally occurring organic matter in surface water.Disinfection byproducts are formed when the disinfectants (usually chlorine) used to kill pathogens react withdissolved organic material (for example leaves) present in surface water.
To determine a source’s susceptibility to these contaminants, the USGS, with DEP assistance, developedstatistical models based on extensive analysis of existing well sample data and surface water intake data.The statistical models determined the relationship between environmental factors and the probability forcontamination to occur. These models identified factors, such as land use or geology, found to besignificantly “linked” to a public water system source’s potential to become contaminated by one or morecategories of contaminants. DEP and USGS looked at factors that might affect the quality of drinkingwater sources and separated them into two categories.

2
How “sensitive” the water supply is to contamination. For example, a shallow well or surface watersource, like a reservoir, would be more exposed to contamination from the surface or above groundthan a confined well.
How frequently a contaminant is used or exists near the source. This is known as “intensity of use.”For example, the number and/or types of activities (such as industry or agriculture) surrounding thesource.
The specific sensitivity and intensity of use factors and their values within each source water assessmentarea for your source(s) are provided on page 7 of this report.
Using the susceptibility factors, the statistical models provided a numerical score for each source ofdrinking water for each contaminant category. These were then converted into high (H), medium (M), orlow (L) susceptibility ratings.
The Safe Drinking Water Standards or Maximum Contaminant Levels (MCLs) were used to define thethree susceptibility ratings (H, M, and L). These standards are developed based health effects, analyticaland treatment factors on either acute or long-term impacts related to drinking water exposure. A lowsusceptibility rating means a potential contaminant level was predicted to be less than 10 percent of theMCL for that contaminant category. A medium rating means the potential contaminant level waspredicted to be equal to or greater than 10 percent and less than 50 percent of the MCL. A high ratingwas assigned to those sources that were predicted to have potential contaminant levels equal to or greaterthan 50 percent of the MCL. Sources with high susceptibility ratings are still likely to have contaminantconcentrations below the MCL.
The susceptibility ratings of your sources to each of the contaminant categories are provided on page 6 ofthis report.
Source Water Assessment Program GoalsThe information obtained from the source water assessments may be used to achieve the following goals:
1. Protect sources of drinking water. Source water protection focuses on preserving and protecting the public drinking water source. Thesource water assessment results may be used by DEP, purveyors, and local planning officials to lay thegroundwork for advancing drinking water protection efforts. State and local agencies, as well as theregulated community, have made significant strides to protect the quality of our water resources. Majorwater quality improvements have been made as a result of water quality and drinking water standards andprograms (both regulatory and nonregulatory) designed to ensure standards are met. Waste managementand clean up programs have had success in controlling releases and ensuring actions are taken to achievestandards if releases occur. Recent measures to control non-point sources have expanded the DEP’s waterquality protection programs by recognizing the link between land use change and water resource impacts.The Safe Drinking Water Program is designed to ensure that water delivered for human consumptionmeets drinking water standards. In addition to these programs, major initiatives such as the HighlandsWater Protection and Planning Act, Surface Water Quality Standards and Category One Designation, andStormwater Management Rules have recently been accomplished. Despite this success, the DEPrecognizes the ongoing importance of using new information such as that from the source waterassessments to evaluate the need for additional protection measures of drinking water sources. The DEP iscurrently reviewing the source water assessments to identify any necessary additional source waterprotection measures.

3
2. Public education of SWAP information. DEP incorporated public education throughout the development and implementation of the Source WaterAssessment Program. During the source water assessment process, DEP met with interested parties,beginning with the development of the SWAP Plan, published articles, wrote two newsletters, anddeveloped a SWAP web site. The SWAP web site contains information on the program, technicalresources, frequently asked questions, source water assessment results, and links to additional sites ofinterest. Upon completion of the source water assessments, DEP generated a source water assessmentreport for each public water system to report the susceptibility ratings of public drinking water sources topotential contamination.
The goal of the public education efforts is to raise public awareness of the source of their drinking waterand the potential contaminants that could impair the water's quality. To continue fulfilling the educationgoal, DEP will conduct training sessions following the release of the Source Water Assessment Reports.
3. Establish a customized monitoring schedule for each public water system. The source water assessments will assist DEP in improving current monitoring requirements forindividual public water systems. Currently, the Environmental Protection Agency (EPA) and the DEPhave mandatory monitoring schedules that depend on a variety of factors that can include the source ofthe water (ground water or surface water) and the surrounding land use. These schedules may becustomized based on the susceptibility of the sources of drinking water.
Where does drinking water come from?There are two basic sources of drinking water: ground water and surface water.
Ground water is water found beneath the Earth’s surface. Ground water comes from rain and snowseeping into rock and soil. Ground water is stored in underground areas called aquifers. Aquifers supplywells and springs. Wells in New Jersey range from about 15 feet to 2,000 feet deep.
Surface water is the water naturally open to the atmosphere, such as rivers, lakes, streams and reservoirs.Precipitation that does not infiltrate the ground or evaporate into the sky runs off into surface waterbodies.
Ground water can seep into a stream, river or other surface water body, recharging surface water bodies.Likewise, under some circumstances, surface water can seep into an adjacent aquifer.
A water system obtains its water from 1) wells drilled into the ground that pump out ground water; 2)devices called surface water intakes placed on a river, stream, or reservoir; or 3) both.
What factors may affect the quality of your drinking water source?A variety of conditions and activities may affect the quality of drinking water source. These includegeology (rock and soil types); depth of a well or location of a surface water intake; how the landsurrounding the source is used (for industry, agriculture or development); the use of pesticides andfertilizers; and the presence of contaminated sites, leaking underground storage tanks, and landfills.Please refer to pages 6 and 7 of this report for specific potential contaminant source information.
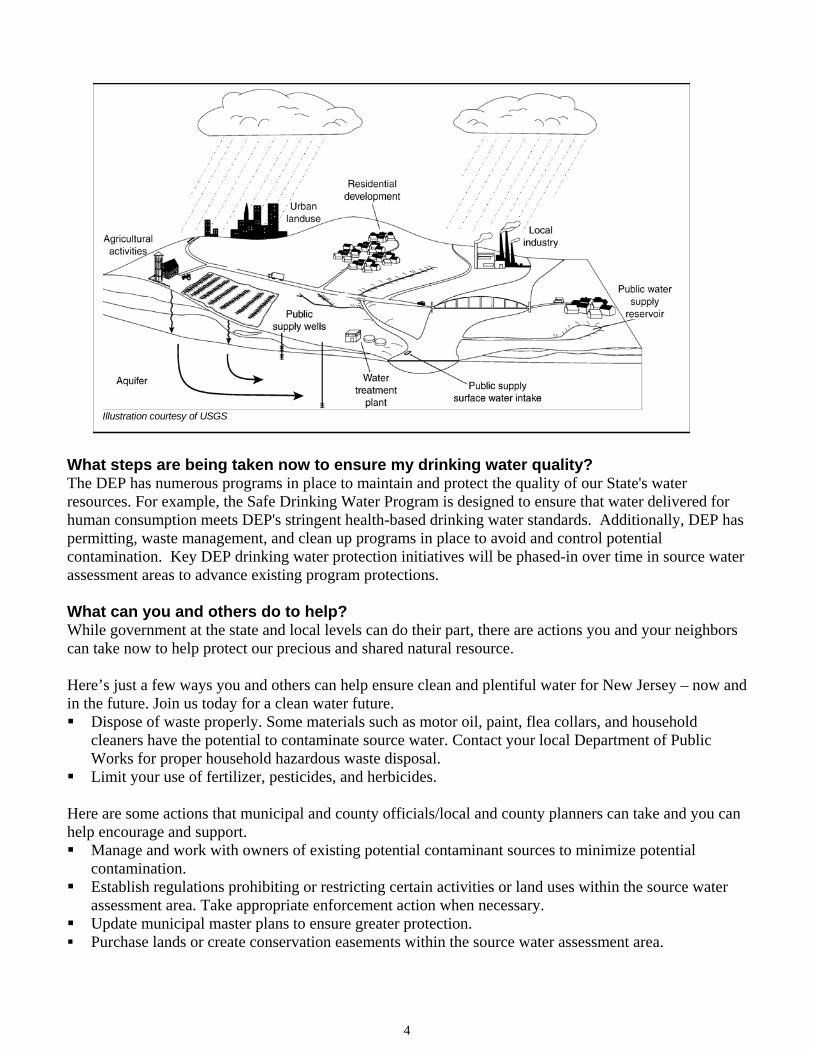
4
What steps are being taken now to ensure my drinking water quality?The DEP has numerous programs in place to maintain and protect the quality of our State's waterresources. For example, the Safe Drinking Water Program is designed to ensure that water delivered forhuman consumption meets DEP's stringent health-based drinking water standards. Additionally, DEP haspermitting, waste management, and clean up programs in place to avoid and control potentialcontamination. Key DEP drinking water protection initiatives will be phased-in over time in source waterassessment areas to advance existing program protections.
What can you and others do to help?While government at the state and local levels can do their part, there are actions you and your neighborscan take now to help protect our precious and shared natural resource.
Here’s just a few ways you and others can help ensure clean and plentiful water for New Jersey – now andin the future. Join us today for a clean water future. Dispose of waste properly. Some materials such as motor oil, paint, flea collars, and household
cleaners have the potential to contaminate source water. Contact your local Department of PublicWorks for proper household hazardous waste disposal.
Limit your use of fertilizer, pesticides, and herbicides.
Here are some actions that municipal and county officials/local and county planners can take and you canhelp encourage and support. Manage and work with owners of existing potential contaminant sources to minimize potential
contamination. Establish regulations prohibiting or restricting certain activities or land uses within the source water
assessment area. Take appropriate enforcement action when necessary. Update municipal master plans to ensure greater protection. Purchase lands or create conservation easements within the source water assessment area.
Illustration courtesy of USGS

5
Specific Source Water Assessment Information for 7-11 STORE
7-11 STORE (PWID 1336305) at 1128 Pine Brook Rd, Tinton Falls, NJ, is a public noncommunity watersystem that serves approximately 999 people (in 2003). 7-11 STORE consists of 1 active well(s) and 0surface water intake(s).
Susceptibility RatingsTable 1 below illustrates the percentage of noncommunity water system sources in New Jersey that ratedhigh, medium, and low for each of the eight contaminant categories. This table is separated by sourcetype: ground water and surface water. Table 2 illustrates the susceptibility ratings for each source inyour system to each of the contaminant categories.
For the purpose of the Source Water Assessment Program, radionuclides were considered more of aground water concern than a surface water issue. As a result, surface water intakes’ susceptibility toradionuclides was not determined and they all received a low rating. DEP considered all surface waterhighly susceptible to pathogens; therefore all intakes received a high rating for the pathogen category.
Table 1: Summary of Statewide Susceptibility Ratings for Noncommunity Water System Sources (Percent)
Path
ogen
s
Nut
rient
s
Pest
icid
es
VOC
s
Inor
gani
cs
Rad
ionu
clid
es
Rad
on
Dis
infe
ctio
nB
ypro
duct
Prec
urso
rs
Ground Water3480 Total Wells
High 2 0 0 32 19 69 17 3Medium 18 66 66 0 42 28 72 97
Low 80 34 34 68 39 3 11 0Surface Water3 Total Intakes
High 100 33 0 0 100 0 0 100Medium 0 67 67 33 0 0 0 0
Low 0 0 33 67 0 100 100 0
Statewide, 85 percent of the noncommunity water system sources (ground water and surface water) ratedhigh for at least one of the contaminant categories.
For surface water, the three contaminant categories in which all of the noncommunity water systemsurface water intakes (three total) received a high susceptibility rating were inorganics, disinfectionbyproduct precursors, and pathogens (all assumed to be highly susceptible to pathogens).
For ground water, the three contaminant categories in which the highest percentage of sources received ahigh susceptibility rating are radionuclides (69%), volatile organic compounds (32%), and inorganics(19%).

6
Table 2: Susceptibility Ratings for 7-11 STORE’s Sources
Path
ogen
s
Nut
rient
s
Pest
icid
es
Vola
tile
Org
anic
Com
poun
ds
Inor
gani
cs
Rad
ionu
clid
es
Rad
on
Dis
infe
ctio
nB
ypro
duct
Prec
urso
rs
Sou
rces
Rating Rating Rating Rating Rating Rating Rating Rating
Well L M M L H H M M
If a system is rated highly susceptible for a contaminant category, it does not mean a customer is orwill be consuming contaminated drinking water. The rating reflects the potential for contamination ofsource water, not the existence of contamination. Public water systems are required to monitor forregulated contaminants and to install treatment if any contaminants are detected at frequencies andconcentrations above allowable levels.
Which Sensitivity and Intensity Factors Determine a Source’s Susceptibility?The susceptibility models determined source water susceptibility is based on the well or intake’s locationand sensitivity and intensity factors (also known as explanatory variables). An explanatory variable canbe used to predict the presence of or the potential presence of a contaminant in ground water or surfacewater.
Some explanatory variables are considered conceptual. A conceptual variable is one that has been shownin a previous scientific investigation to be related to, or is expected to have an effect on, theconcentrations of a constituent. Conceptual variables that did not produce significant univariate statisticalrelations may however, produce a significant relation when used with other variables in multivariatestatistical tests.
The following page contains an Individual Explanatory Variable Inventory, which provides the values ofeach explanatory variable within your source water assessment area. This is not the entire potentialcontaminant source inventory for this system’s source(s).
If the variable value is shown as zero, then attributes or land activities are not present in the source waterassessment area. If a value is not shown, this represents either unavailable data, or in the case of “Distanceto” variables land activities of that type are not present in the source water assessment area.
This information, used in conjunction with USGS’s susceptibility rating scheme, calculates thesusceptibility rating for each source to each contaminant category. If you are interested in USGS’s ratingschemes please refer to the “Contaminant Category Scoring System for Noncommunity Water SystemsAppendix A – Attachment 2” available in the Noncommunity Source Water Assessment Report forTinton Falls Boro, Monmouth County or on the Source Water Assessment Program website athttp://www.state.nj.us/dep/swap/.
Following the Individual Explanatory Variable Inventory for your system is a source water assessmentmap illustrating the source water assessment areas for systems with in Tinton Falls Boro.
For more information please refer to the Noncommunity Source Water Assessment Report for TintonFalls Boro, Monmouth County, available on the Source Water Assessment Program website. You mayalso contact the Bureau of Safe Drinking Water at 609-292-5550.

Individual Explanatory Variable Groundwater Susceptibility ModelsSource: Well Status: P Source Type: G
Sensitivity Variable Inventory Intensity Variable InventoryPathogens Explanatory Variables - Source Rating = L
Conceptual-Soil Available Water Capacity 0.1 Distance to Agricultural Land Use, 1995Depth to Top of Open Interval Conceptual Septic Tank Density 47.89
Conceptual - GWUDI Conceptual – Presence of Streams, Tier 1 0
Nutrients Explanatory Variables – Source Rating = M Conceptual – Depth to Top of Open Interval % Urban Land Use, 1995 57.24Conceptual – Length of Open Interval % Agricultural Land Use, 1986 0
Pesticides Explanatory Variables – Source Rating = MConceptual – Depth to Top of Open Interval % Urban Land Use, 1995 57.24Conceptual – Length of Open Interval % Agricultural Land Use, 1986 0
Distance to Agricultural Land Use, 1995Conceptual – Distance to golf course
VOCs Explanatory Variables – Source Rating = L% Soil Organic Matter 0.45 % Impervious Surface, 1995 28
% Commercial/Industrial Land Use, 1995 57.24Sq. Mi. of Urban Land Use, 1995 0.01Density of SWL, USTs, and KCSL 0
Inorganics Explanatory Variables – Source Rating = H
Dissolved Oxygen of water-quality sample
Density of KCSL, SWL, NJPDESGW/SW/Storm, Compost Facilities,SWRRF, SWTF200011, Class BRecycling, DPCC, UST
0
pH of water-quality sample Distance to Agricultural Land Use, 1995Depth to Top of Open Interval 180 Population Density, Tier 1 330.74% Soil Clay 8.59 % Barren Land Use, 1995 0Soil Hydraulic Conductivity 37.09 % Urban Land Use, 1970 5.1Conceptual % Soil Organic Matter 0.45 Distance to STPPhysiographic Province COASTAL
PLAIN STP Density 0
Distance to DOT roads 107.07Length of railroads 0Population Density 663.97
Radionuclides Explanatory Variables – Source Rating = HpH of water-quality sample % Urban Land Use, Tier 1, 1995 72.4
Physiographic Province COASTALPLAIN
Conceptual Distance to Agricultural LandUse, 1995
Conceptual Depth of Well 180 % Developed Land, Tier 1, 1995 72.4Conceptual Soil Hydraulic Conductivity 37.09 % Agricultural Land Use, 1970 0
Radon Explanatory Variables – Source Rating = MConceptual % Soil Clay 8.59 % Agricultural Land Use, 1995 0
Physiographic Province COASTALPLAIN
Conceptual Distance to Wetlands LandUse, 1995 35.02
Depth to Top of Open Interval 180DBPs Explanatory Variables – Source Rating = M
Conceptual – % Soil Organic Matter 0.45 Conceptual – Sq. Mi. of Wetlands LandUse, 1995 0.01
Conceptual NJGS Hydrologic Unit (aquifer)Number of NJPDES SW/GW/Storm,Compost, SWWRF, SWTF200011, ClassB Recycling, and DPCC
0
pH of water-quality sample
1
Tinton Falls Convalescent Center1336308
Source Water Assessment ReportA State Assessment of Your Drinking Water Source’sVulnerability
As a requirement of the 1996 Amendments to the Federal Safe DrinkingWater Act, New Jersey Department of Environmental Protection (DEP)performed a source water assessment of each source of public drinkingwater and determined each source’s susceptibility to contamination.Susceptibility is a measure of the potential exposure of a drinking water source to contamination; actual(if any) contamination is not measured.
DEP, in conjunction with the United States Geological Survey (USGS), performed the following steps todetermine the drinking water source’s susceptibility. Identifying the area (known as the source water assessment area) that supplies water to your public
drinking water system; Inventorying any significant potential sources of contamination in the area; and Analyzing how susceptible the drinking water source is to the potential sources of contamination.
DEP evaluated the susceptibility of all public water system sources to eight categories of contaminants. Pathogens: Disease-causing organisms such as bacteria and viruses. Common sources are animal and human
fecal wastes. Nutrients: Compounds, minerals and elements that aid growth, that are both naturally occurring and man-
made. Examples include nitrogen and phosphorus. Volatile Organic Compounds: Man-made chemicals used as solvents, degreasers, and gasoline components.
Examples include benzene, methyl tertiary butyl ether (MTBE), and vinyl chloride. Pesticides: Man-made chemicals used to control pests, weeds and fungus. Common sources include land
application and manufacturing centers of pesticides. Examples include herbicides such as atrazine, andinsecticides such as chlordane.
Inorganics: Mineral-based compounds that are both naturally occurring and man-made. Examples includearsenic, asbestos, copper, lead, and nitrate.
Radionuclides: Radioactive substances that are both naturally occurring and man-made. Examples includeradium and uranium.
Radon: Colorless, odorless, cancer-causing gas that occurs naturally in the environment. For more informationgo to http://www.nj.gov/dep/rpp/radon/index.htm or call (800) 648-0394.
Disinfection Byproduct Precursors: A common source is naturally occurring organic matter in surface water.Disinfection byproducts are formed when the disinfectants (usually chlorine) used to kill pathogens react withdissolved organic material (for example leaves) present in surface water.
To determine a source’s susceptibility to these contaminants, the USGS, with DEP assistance, developedstatistical models based on extensive analysis of existing well sample data and surface water intake data.The statistical models determined the relationship between environmental factors and the probability forcontamination to occur. These models identified factors, such as land use or geology, found to besignificantly “linked” to a public water system source’s potential to become contaminated by one or morecategories of contaminants. DEP and USGS looked at factors that might affect the quality of drinkingwater sources and separated them into two categories.

2
How “sensitive” the water supply is to contamination. For example, a shallow well or surface watersource, like a reservoir, would be more exposed to contamination from the surface or above groundthan a confined well.
How frequently a contaminant is used or exists near the source. This is known as “intensity of use.”For example, the number and/or types of activities (such as industry or agriculture) surrounding thesource.
The specific sensitivity and intensity of use factors and their values within each source water assessmentarea for your source(s) are provided on page 7 of this report.
Using the susceptibility factors, the statistical models provided a numerical score for each source ofdrinking water for each contaminant category. These were then converted into high (H), medium (M), orlow (L) susceptibility ratings.
The Safe Drinking Water Standards or Maximum Contaminant Levels (MCLs) were used to define thethree susceptibility ratings (H, M, and L). These standards are developed based health effects, analyticaland treatment factors on either acute or long-term impacts related to drinking water exposure. A lowsusceptibility rating means a potential contaminant level was predicted to be less than 10 percent of theMCL for that contaminant category. A medium rating means the potential contaminant level waspredicted to be equal to or greater than 10 percent and less than 50 percent of the MCL. A high ratingwas assigned to those sources that were predicted to have potential contaminant levels equal to or greaterthan 50 percent of the MCL. Sources with high susceptibility ratings are still likely to have contaminantconcentrations below the MCL.
The susceptibility ratings of your sources to each of the contaminant categories are provided on page 6 ofthis report.
Source Water Assessment Program GoalsThe information obtained from the source water assessments may be used to achieve the following goals:
1. Protect sources of drinking water. Source water protection focuses on preserving and protecting the public drinking water source. Thesource water assessment results may be used by DEP, purveyors, and local planning officials to lay thegroundwork for advancing drinking water protection efforts. State and local agencies, as well as theregulated community, have made significant strides to protect the quality of our water resources. Majorwater quality improvements have been made as a result of water quality and drinking water standards andprograms (both regulatory and nonregulatory) designed to ensure standards are met. Waste managementand clean up programs have had success in controlling releases and ensuring actions are taken to achievestandards if releases occur. Recent measures to control non-point sources have expanded the DEP’s waterquality protection programs by recognizing the link between land use change and water resource impacts.The Safe Drinking Water Program is designed to ensure that water delivered for human consumptionmeets drinking water standards. In addition to these programs, major initiatives such as the HighlandsWater Protection and Planning Act, Surface Water Quality Standards and Category One Designation, andStormwater Management Rules have recently been accomplished. Despite this success, the DEPrecognizes the ongoing importance of using new information such as that from the source waterassessments to evaluate the need for additional protection measures of drinking water sources. The DEP iscurrently reviewing the source water assessments to identify any necessary additional source waterprotection measures.

3
2. Public education of SWAP information. DEP incorporated public education throughout the development and implementation of the Source WaterAssessment Program. During the source water assessment process, DEP met with interested parties,beginning with the development of the SWAP Plan, published articles, wrote two newsletters, anddeveloped a SWAP web site. The SWAP web site contains information on the program, technicalresources, frequently asked questions, source water assessment results, and links to additional sites ofinterest. Upon completion of the source water assessments, DEP generated a source water assessmentreport for each public water system to report the susceptibility ratings of public drinking water sources topotential contamination.
The goal of the public education efforts is to raise public awareness of the source of their drinking waterand the potential contaminants that could impair the water's quality. To continue fulfilling the educationgoal, DEP will conduct training sessions following the release of the Source Water Assessment Reports.
3. Establish a customized monitoring schedule for each public water system. The source water assessments will assist DEP in improving current monitoring requirements forindividual public water systems. Currently, the Environmental Protection Agency (EPA) and the DEPhave mandatory monitoring schedules that depend on a variety of factors that can include the source ofthe water (ground water or surface water) and the surrounding land use. These schedules may becustomized based on the susceptibility of the sources of drinking water.
Where does drinking water come from?There are two basic sources of drinking water: ground water and surface water.
Ground water is water found beneath the Earth’s surface. Ground water comes from rain and snowseeping into rock and soil. Ground water is stored in underground areas called aquifers. Aquifers supplywells and springs. Wells in New Jersey range from about 15 feet to 2,000 feet deep.
Surface water is the water naturally open to the atmosphere, such as rivers, lakes, streams and reservoirs.Precipitation that does not infiltrate the ground or evaporate into the sky runs off into surface waterbodies.
Ground water can seep into a stream, river or other surface water body, recharging surface water bodies.Likewise, under some circumstances, surface water can seep into an adjacent aquifer.
A water system obtains its water from 1) wells drilled into the ground that pump out ground water; 2)devices called surface water intakes placed on a river, stream, or reservoir; or 3) both.
What factors may affect the quality of your drinking water source?A variety of conditions and activities may affect the quality of drinking water source. These includegeology (rock and soil types); depth of a well or location of a surface water intake; how the landsurrounding the source is used (for industry, agriculture or development); the use of pesticides andfertilizers; and the presence of contaminated sites, leaking underground storage tanks, and landfills.Please refer to pages 6 and 7 of this report for specific potential contaminant source information.

4
What steps are being taken now to ensure my drinking water quality?The DEP has numerous programs in place to maintain and protect the quality of our State's waterresources. For example, the Safe Drinking Water Program is designed to ensure that water delivered forhuman consumption meets DEP's stringent health-based drinking water standards. Additionally, DEP haspermitting, waste management, and clean up programs in place to avoid and control potentialcontamination. Key DEP drinking water protection initiatives will be phased-in over time in source waterassessment areas to advance existing program protections.
What can you and others do to help?While government at the state and local levels can do their part, there are actions you and your neighborscan take now to help protect our precious and shared natural resource.
Here’s just a few ways you and others can help ensure clean and plentiful water for New Jersey – now andin the future. Join us today for a clean water future. Dispose of waste properly. Some materials such as motor oil, paint, flea collars, and household
cleaners have the potential to contaminate source water. Contact your local Department of PublicWorks for proper household hazardous waste disposal.
Limit your use of fertilizer, pesticides, and herbicides.
Here are some actions that municipal and county officials/local and county planners can take and you canhelp encourage and support. Manage and work with owners of existing potential contaminant sources to minimize potential
contamination. Establish regulations prohibiting or restricting certain activities or land uses within the source water
assessment area. Take appropriate enforcement action when necessary. Update municipal master plans to ensure greater protection. Purchase lands or create conservation easements within the source water assessment area.
Illustration courtesy of USGS

5
Specific Source Water Assessment Information for Tinton FallsConvalescent Center
Tinton Falls Convalescent Center (PWID 1336308) at 524 Wardell Rd, Tinton Falls, NJ, is a publicnoncommunity water system that serves approximately 260 people (in 2003). Tinton Falls ConvalescentCenter consists of 2 active well(s) and 0 surface water intake(s).
Susceptibility RatingsTable 1 below illustrates the percentage of noncommunity water system sources in New Jersey that ratedhigh, medium, and low for each of the eight contaminant categories. This table is separated by sourcetype: ground water and surface water. Table 2 illustrates the susceptibility ratings for each source inyour system to each of the contaminant categories.
For the purpose of the Source Water Assessment Program, radionuclides were considered more of aground water concern than a surface water issue. As a result, surface water intakes’ susceptibility toradionuclides was not determined and they all received a low rating. DEP considered all surface waterhighly susceptible to pathogens; therefore all intakes received a high rating for the pathogen category.
Table 1: Summary of Statewide Susceptibility Ratings for Noncommunity Water System Sources (Percent)
Path
ogen
s
Nut
rient
s
Pest
icid
es
VOC
s
Inor
gani
cs
Rad
ionu
clid
es
Rad
on
Dis
infe
ctio
nB
ypro
duct
Prec
urso
rs
Ground Water3480 Total Wells
High 2 0 0 32 19 69 17 3Medium 18 66 66 0 42 28 72 97
Low 80 34 34 68 39 3 11 0Surface Water3 Total Intakes
High 100 33 0 0 100 0 0 100Medium 0 67 67 33 0 0 0 0
Low 0 0 33 67 0 100 100 0
Statewide, 85 percent of the noncommunity water system sources (ground water and surface water) ratedhigh for at least one of the contaminant categories.
For surface water, the three contaminant categories in which all of the noncommunity water systemsurface water intakes (three total) received a high susceptibility rating were inorganics, disinfectionbyproduct precursors, and pathogens (all assumed to be highly susceptible to pathogens).
For ground water, the three contaminant categories in which the highest percentage of sources received ahigh susceptibility rating are radionuclides (69%), volatile organic compounds (32%), and inorganics(19%).

6
Table 2: Susceptibility Ratings for Tinton Falls Convalescent Center’s Sources
Path
ogen
s
Nut
rient
s
Pest
icid
es
Vola
tile
Org
anic
Com
poun
ds
Inor
gani
cs
Rad
ionu
clid
es
Rad
on
Dis
infe
ctio
nB
ypro
duct
Prec
urso
rs
Sou
rces
Rating Rating Rating Rating Rating Rating Rating Rating
Well 1 (BoilerRoom) L L L H M H L M
Well 2 L L L H M H L M
If a system is rated highly susceptible for a contaminant category, it does not mean a customer is orwill be consuming contaminated drinking water. The rating reflects the potential for contamination ofsource water, not the existence of contamination. Public water systems are required to monitor forregulated contaminants and to install treatment if any contaminants are detected at frequencies andconcentrations above allowable levels.
Which Sensitivity and Intensity Factors Determine a Source’s Susceptibility?The susceptibility models determined source water susceptibility is based on the well or intake’s locationand sensitivity and intensity factors (also known as explanatory variables). An explanatory variable canbe used to predict the presence of or the potential presence of a contaminant in ground water or surfacewater.
Some explanatory variables are considered conceptual. A conceptual variable is one that has been shownin a previous scientific investigation to be related to, or is expected to have an effect on, theconcentrations of a constituent. Conceptual variables that did not produce significant univariate statisticalrelations may however, produce a significant relation when used with other variables in multivariatestatistical tests.
The following page contains an Individual Explanatory Variable Inventory, which provides the values ofeach explanatory variable within your source water assessment area. This is not the entire potentialcontaminant source inventory for this system’s source(s).
If the variable value is shown as zero, then attributes or land activities are not present in the source waterassessment area. If a value is not shown, this represents either unavailable data, or in the case of “Distanceto” variables land activities of that type are not present in the source water assessment area.
This information, used in conjunction with USGS’s susceptibility rating scheme, calculates thesusceptibility rating for each source to each contaminant category. If you are interested in USGS’s ratingschemes please refer to the “Contaminant Category Scoring System for Noncommunity Water SystemsAppendix A – Attachment 2” available in the Noncommunity Source Water Assessment Report forTinton Falls Boro, Monmouth County or on the Source Water Assessment Program website athttp://www.state.nj.us/dep/swap/.
Following the Individual Explanatory Variable Inventory for your system is a source water assessmentmap illustrating the source water assessment areas for systems with in Tinton Falls Boro.

7
For more information please refer to the Noncommunity Source Water Assessment Report for TintonFalls Boro, Monmouth County, available on the Source Water Assessment Program website. You mayalso contact the Bureau of Safe Drinking Water at 609-292-5550.

Individual Explanatory Variable Groundwater Susceptibility ModelsSource: Well 1 (Boiler Room) Status: P Source Type: G
Sensitivity Variable Inventory Intensity Variable InventoryPathogens Explanatory Variables - Source Rating = L
Conceptual-Soil Available Water Capacity 0.07 Distance to Agricultural Land Use, 1995Depth to Top of Open Interval Conceptual Septic Tank Density 20.98
Conceptual - GWUDI Conceptual – Presence of Streams, Tier 1 0
Nutrients Explanatory Variables – Source Rating = L Conceptual – Depth to Top of Open Interval % Urban Land Use, 1995 47.25Conceptual – Length of Open Interval % Agricultural Land Use, 1986 0
Pesticides Explanatory Variables – Source Rating = LConceptual – Depth to Top of Open Interval % Urban Land Use, 1995 47.25Conceptual – Length of Open Interval % Agricultural Land Use, 1986 0
Distance to Agricultural Land Use, 1995Conceptual – Distance to golf course
VOCs Explanatory Variables – Source Rating = H% Soil Organic Matter 0.5 % Impervious Surface, 1995 18.6
% Commercial/Industrial Land Use, 1995 47.25Sq. Mi. of Urban Land Use, 1995 0.01Density of SWL, USTs, and KCSL 82.5
Inorganics Explanatory Variables – Source Rating = M
Dissolved Oxygen of water-quality sample
Density of KCSL, SWL, NJPDESGW/SW/Storm, Compost Facilities,SWRRF, SWTF200011, Class BRecycling, DPCC, UST
82.5
pH of water-quality sample Distance to Agricultural Land Use, 1995Depth to Top of Open Interval 180 Population Density, Tier 1 416.73% Soil Clay 5.74 % Barren Land Use, 1995 0Soil Hydraulic Conductivity 87.48 % Urban Land Use, 1970 18.3Conceptual % Soil Organic Matter 0.5 Distance to STPPhysiographic Province COASTAL
PLAIN STP Density 0
Distance to DOT roads 175.28Length of railroads 0Population Density 416.73
Radionuclides Explanatory Variables – Source Rating = HpH of water-quality sample % Urban Land Use, Tier 1, 1995 97.6
Physiographic Province COASTALPLAIN
Conceptual Distance to Agricultural LandUse, 1995
Conceptual Depth of Well 180 % Developed Land, Tier 1, 1995 97.6Conceptual Soil Hydraulic Conductivity 87.48 % Agricultural Land Use, 1970 0
Radon Explanatory Variables – Source Rating = LConceptual % Soil Clay 5.74 % Agricultural Land Use, 1995 0
Physiographic Province COASTALPLAIN
Conceptual Distance to Wetlands LandUse, 1995 109.03
Depth to Top of Open Interval 180DBPs Explanatory Variables – Source Rating = M
Conceptual – % Soil Organic Matter 0.5 Conceptual – Sq. Mi. of Wetlands LandUse, 1995 0
Conceptual NJGS Hydrologic Unit (aquifer)Number of NJPDES SW/GW/Storm,Compost, SWWRF, SWTF200011, ClassB Recycling, and DPCC
0
pH of water-quality sample

Individual Explanatory Variable Groundwater Susceptibility ModelsSource: Well 2 Status: P Source Type: G
Sensitivity Variable Inventory Intensity Variable InventoryPathogens Explanatory Variables - Source Rating = L
Conceptual-Soil Available Water Capacity 0.07 Distance to Agricultural Land Use, 1995Depth to Top of Open Interval Conceptual Septic Tank Density 20.98
Conceptual - GWUDI Conceptual – Presence of Streams, Tier 1 0
Nutrients Explanatory Variables – Source Rating = L Conceptual – Depth to Top of Open Interval % Urban Land Use, 1995 47.01Conceptual – Length of Open Interval % Agricultural Land Use, 1986 0
Pesticides Explanatory Variables – Source Rating = LConceptual – Depth to Top of Open Interval % Urban Land Use, 1995 47.01Conceptual – Length of Open Interval % Agricultural Land Use, 1986 0
Distance to Agricultural Land Use, 1995Conceptual – Distance to golf course
VOCs Explanatory Variables – Source Rating = H% Soil Organic Matter 0.49 % Impervious Surface, 1995 18.5
% Commercial/Industrial Land Use, 1995 47.01Sq. Mi. of Urban Land Use, 1995 0.01Density of SWL, USTs, and KCSL 82.5
Inorganics Explanatory Variables – Source Rating = M
Dissolved Oxygen of water-quality sample
Density of KCSL, SWL, NJPDESGW/SW/Storm, Compost Facilities,SWRRF, SWTF200011, Class BRecycling, DPCC, UST
82.5
pH of water-quality sample Distance to Agricultural Land Use, 1995Depth to Top of Open Interval 180 Population Density, Tier 1 416.73% Soil Clay 5.69 % Barren Land Use, 1995 0Soil Hydraulic Conductivity 87.68 % Urban Land Use, 1970 18.58Conceptual % Soil Organic Matter 0.49 Distance to STPPhysiographic Province COASTAL
PLAIN STP Density 0
Distance to DOT roads 173.65Length of railroads 0Population Density 416.73
Radionuclides Explanatory Variables – Source Rating = HpH of water-quality sample % Urban Land Use, Tier 1, 1995 97.2
Physiographic Province COASTALPLAIN
Conceptual Distance to Agricultural LandUse, 1995
Conceptual Depth of Well 180 % Developed Land, Tier 1, 1995 97.2Conceptual Soil Hydraulic Conductivity 87.68 % Agricultural Land Use, 1970 0
Radon Explanatory Variables – Source Rating = LConceptual % Soil Clay 5.69 % Agricultural Land Use, 1995 0
Physiographic Province COASTALPLAIN
Conceptual Distance to Wetlands LandUse, 1995 105.68
Depth to Top of Open Interval 180DBPs Explanatory Variables – Source Rating = M
Conceptual – % Soil Organic Matter 0.49 Conceptual – Sq. Mi. of Wetlands LandUse, 1995 0
Conceptual NJGS Hydrologic Unit (aquifer)Number of NJPDES SW/GW/Storm,Compost, SWWRF, SWTF200011, ClassB Recycling, and DPCC
0
pH of water-quality sample

1
World Volkswagon1336309
Source Water Assessment ReportA State Assessment of Your Drinking Water Source’sVulnerability
As a requirement of the 1996 Amendments to the Federal Safe DrinkingWater Act, New Jersey Department of Environmental Protection (DEP)performed a source water assessment of each source of public drinkingwater and determined each source’s susceptibility to contamination.Susceptibility is a measure of the potential exposure of a drinking water source to contamination; actual(if any) contamination is not measured.
DEP, in conjunction with the United States Geological Survey (USGS), performed the following steps todetermine the drinking water source’s susceptibility. Identifying the area (known as the source water assessment area) that supplies water to your public
drinking water system; Inventorying any significant potential sources of contamination in the area; and Analyzing how susceptible the drinking water source is to the potential sources of contamination.
DEP evaluated the susceptibility of all public water system sources to eight categories of contaminants. Pathogens: Disease-causing organisms such as bacteria and viruses. Common sources are animal and human
fecal wastes. Nutrients: Compounds, minerals and elements that aid growth, that are both naturally occurring and man-
made. Examples include nitrogen and phosphorus. Volatile Organic Compounds: Man-made chemicals used as solvents, degreasers, and gasoline components.
Examples include benzene, methyl tertiary butyl ether (MTBE), and vinyl chloride. Pesticides: Man-made chemicals used to control pests, weeds and fungus. Common sources include land
application and manufacturing centers of pesticides. Examples include herbicides such as atrazine, andinsecticides such as chlordane.
Inorganics: Mineral-based compounds that are both naturally occurring and man-made. Examples includearsenic, asbestos, copper, lead, and nitrate.
Radionuclides: Radioactive substances that are both naturally occurring and man-made. Examples includeradium and uranium.
Radon: Colorless, odorless, cancer-causing gas that occurs naturally in the environment. For more informationgo to http://www.nj.gov/dep/rpp/radon/index.htm or call (800) 648-0394.
Disinfection Byproduct Precursors: A common source is naturally occurring organic matter in surface water.Disinfection byproducts are formed when the disinfectants (usually chlorine) used to kill pathogens react withdissolved organic material (for example leaves) present in surface water.
To determine a source’s susceptibility to these contaminants, the USGS, with DEP assistance, developedstatistical models based on extensive analysis of existing well sample data and surface water intake data.The statistical models determined the relationship between environmental factors and the probability forcontamination to occur. These models identified factors, such as land use or geology, found to besignificantly “linked” to a public water system source’s potential to become contaminated by one or morecategories of contaminants. DEP and USGS looked at factors that might affect the quality of drinkingwater sources and separated them into two categories.

2
How “sensitive” the water supply is to contamination. For example, a shallow well or surface watersource, like a reservoir, would be more exposed to contamination from the surface or above groundthan a confined well.
How frequently a contaminant is used or exists near the source. This is known as “intensity of use.”For example, the number and/or types of activities (such as industry or agriculture) surrounding thesource.
The specific sensitivity and intensity of use factors and their values within each source water assessmentarea for your source(s) are provided on page 7 of this report.
Using the susceptibility factors, the statistical models provided a numerical score for each source ofdrinking water for each contaminant category. These were then converted into high (H), medium (M), orlow (L) susceptibility ratings.
The Safe Drinking Water Standards or Maximum Contaminant Levels (MCLs) were used to define thethree susceptibility ratings (H, M, and L). These standards are developed based health effects, analyticaland treatment factors on either acute or long-term impacts related to drinking water exposure. A lowsusceptibility rating means a potential contaminant level was predicted to be less than 10 percent of theMCL for that contaminant category. A medium rating means the potential contaminant level waspredicted to be equal to or greater than 10 percent and less than 50 percent of the MCL. A high ratingwas assigned to those sources that were predicted to have potential contaminant levels equal to or greaterthan 50 percent of the MCL. Sources with high susceptibility ratings are still likely to have contaminantconcentrations below the MCL.
The susceptibility ratings of your sources to each of the contaminant categories are provided on page 6 ofthis report.
Source Water Assessment Program GoalsThe information obtained from the source water assessments may be used to achieve the following goals:
1. Protect sources of drinking water. Source water protection focuses on preserving and protecting the public drinking water source. Thesource water assessment results may be used by DEP, purveyors, and local planning officials to lay thegroundwork for advancing drinking water protection efforts. State and local agencies, as well as theregulated community, have made significant strides to protect the quality of our water resources. Majorwater quality improvements have been made as a result of water quality and drinking water standards andprograms (both regulatory and nonregulatory) designed to ensure standards are met. Waste managementand clean up programs have had success in controlling releases and ensuring actions are taken to achievestandards if releases occur. Recent measures to control non-point sources have expanded the DEP’s waterquality protection programs by recognizing the link between land use change and water resource impacts.The Safe Drinking Water Program is designed to ensure that water delivered for human consumptionmeets drinking water standards. In addition to these programs, major initiatives such as the HighlandsWater Protection and Planning Act, Surface Water Quality Standards and Category One Designation, andStormwater Management Rules have recently been accomplished. Despite this success, the DEPrecognizes the ongoing importance of using new information such as that from the source waterassessments to evaluate the need for additional protection measures of drinking water sources. The DEP iscurrently reviewing the source water assessments to identify any necessary additional source waterprotection measures.

3
2. Public education of SWAP information. DEP incorporated public education throughout the development and implementation of the Source WaterAssessment Program. During the source water assessment process, DEP met with interested parties,beginning with the development of the SWAP Plan, published articles, wrote two newsletters, anddeveloped a SWAP web site. The SWAP web site contains information on the program, technicalresources, frequently asked questions, source water assessment results, and links to additional sites ofinterest. Upon completion of the source water assessments, DEP generated a source water assessmentreport for each public water system to report the susceptibility ratings of public drinking water sources topotential contamination.
The goal of the public education efforts is to raise public awareness of the source of their drinking waterand the potential contaminants that could impair the water's quality. To continue fulfilling the educationgoal, DEP will conduct training sessions following the release of the Source Water Assessment Reports.
3. Establish a customized monitoring schedule for each public water system. The source water assessments will assist DEP in improving current monitoring requirements forindividual public water systems. Currently, the Environmental Protection Agency (EPA) and the DEPhave mandatory monitoring schedules that depend on a variety of factors that can include the source ofthe water (ground water or surface water) and the surrounding land use. These schedules may becustomized based on the susceptibility of the sources of drinking water.
Where does drinking water come from?There are two basic sources of drinking water: ground water and surface water.
Ground water is water found beneath the Earth’s surface. Ground water comes from rain and snowseeping into rock and soil. Ground water is stored in underground areas called aquifers. Aquifers supplywells and springs. Wells in New Jersey range from about 15 feet to 2,000 feet deep.
Surface water is the water naturally open to the atmosphere, such as rivers, lakes, streams and reservoirs.Precipitation that does not infiltrate the ground or evaporate into the sky runs off into surface waterbodies.
Ground water can seep into a stream, river or other surface water body, recharging surface water bodies.Likewise, under some circumstances, surface water can seep into an adjacent aquifer.
A water system obtains its water from 1) wells drilled into the ground that pump out ground water; 2)devices called surface water intakes placed on a river, stream, or reservoir; or 3) both.
What factors may affect the quality of your drinking water source?A variety of conditions and activities may affect the quality of drinking water source. These includegeology (rock and soil types); depth of a well or location of a surface water intake; how the landsurrounding the source is used (for industry, agriculture or development); the use of pesticides andfertilizers; and the presence of contaminated sites, leaking underground storage tanks, and landfills.Please refer to pages 6 and 7 of this report for specific potential contaminant source information.

4
What steps are being taken now to ensure my drinking water quality?The DEP has numerous programs in place to maintain and protect the quality of our State's waterresources. For example, the Safe Drinking Water Program is designed to ensure that water delivered forhuman consumption meets DEP's stringent health-based drinking water standards. Additionally, DEP haspermitting, waste management, and clean up programs in place to avoid and control potentialcontamination. Key DEP drinking water protection initiatives will be phased-in over time in source waterassessment areas to advance existing program protections.
What can you and others do to help?While government at the state and local levels can do their part, there are actions you and your neighborscan take now to help protect our precious and shared natural resource.
Here’s just a few ways you and others can help ensure clean and plentiful water for New Jersey – now andin the future. Join us today for a clean water future. Dispose of waste properly. Some materials such as motor oil, paint, flea collars, and household
cleaners have the potential to contaminate source water. Contact your local Department of PublicWorks for proper household hazardous waste disposal.
Limit your use of fertilizer, pesticides, and herbicides.
Here are some actions that municipal and county officials/local and county planners can take and you canhelp encourage and support. Manage and work with owners of existing potential contaminant sources to minimize potential
contamination. Establish regulations prohibiting or restricting certain activities or land uses within the source water
assessment area. Take appropriate enforcement action when necessary. Update municipal master plans to ensure greater protection. Purchase lands or create conservation easements within the source water assessment area.
Illustration courtesy of USGS

5
Specific Source Water Assessment Information for World Volkswagon
World Volkswagon (PWID 1336309) at 4075 Hwy 33, Neptune, NJ, is a public noncommunity watersystem that serves approximately 30 people (in 2003). World Volkswagon consists of 1 active well(s)and 0 surface water intake(s).
Susceptibility RatingsTable 1 below illustrates the percentage of noncommunity water system sources in New Jersey that ratedhigh, medium, and low for each of the eight contaminant categories. This table is separated by sourcetype: ground water and surface water. Table 2 illustrates the susceptibility ratings for each source inyour system to each of the contaminant categories.
For the purpose of the Source Water Assessment Program, radionuclides were considered more of aground water concern than a surface water issue. As a result, surface water intakes’ susceptibility toradionuclides was not determined and they all received a low rating. DEP considered all surface waterhighly susceptible to pathogens; therefore all intakes received a high rating for the pathogen category.
Table 1: Summary of Statewide Susceptibility Ratings for Noncommunity Water System Sources (Percent)
Path
ogen
s
Nut
rient
s
Pest
icid
es
VOC
s
Inor
gani
cs
Rad
ionu
clid
es
Rad
on
Dis
infe
ctio
nB
ypro
duct
Prec
urso
rs
Ground Water3480 Total Wells
High 2 0 0 32 19 69 17 3Medium 18 66 66 0 42 28 72 97
Low 80 34 34 68 39 3 11 0Surface Water3 Total Intakes
High 100 33 0 0 100 0 0 100Medium 0 67 67 33 0 0 0 0
Low 0 0 33 67 0 100 100 0
Statewide, 85 percent of the noncommunity water system sources (ground water and surface water) ratedhigh for at least one of the contaminant categories.
For surface water, the three contaminant categories in which all of the noncommunity water systemsurface water intakes (three total) received a high susceptibility rating were inorganics, disinfectionbyproduct precursors, and pathogens (all assumed to be highly susceptible to pathogens).
For ground water, the three contaminant categories in which the highest percentage of sources received ahigh susceptibility rating are radionuclides (69%), volatile organic compounds (32%), and inorganics(19%).

6
Table 2: Susceptibility Ratings for World Volkswagon’s Sources
Path
ogen
s
Nut
rient
s
Pest
icid
es
Vola
tile
Org
anic
Com
poun
ds
Inor
gani
cs
Rad
ionu
clid
es
Rad
on
Dis
infe
ctio
nB
ypro
duct
Prec
urso
rs
Sou
rces
Rating Rating Rating Rating Rating Rating Rating Rating
Well L L L H M H M M
If a system is rated highly susceptible for a contaminant category, it does not mean a customer is orwill be consuming contaminated drinking water. The rating reflects the potential for contamination ofsource water, not the existence of contamination. Public water systems are required to monitor forregulated contaminants and to install treatment if any contaminants are detected at frequencies andconcentrations above allowable levels.
Which Sensitivity and Intensity Factors Determine a Source’s Susceptibility?The susceptibility models determined source water susceptibility is based on the well or intake’s locationand sensitivity and intensity factors (also known as explanatory variables). An explanatory variable canbe used to predict the presence of or the potential presence of a contaminant in ground water or surfacewater.
Some explanatory variables are considered conceptual. A conceptual variable is one that has been shownin a previous scientific investigation to be related to, or is expected to have an effect on, theconcentrations of a constituent. Conceptual variables that did not produce significant univariate statisticalrelations may however, produce a significant relation when used with other variables in multivariatestatistical tests.
The following page contains an Individual Explanatory Variable Inventory, which provides the values ofeach explanatory variable within your source water assessment area. This is not the entire potentialcontaminant source inventory for this system’s source(s).
If the variable value is shown as zero, then attributes or land activities are not present in the source waterassessment area. If a value is not shown, this represents either unavailable data, or in the case of “Distanceto” variables land activities of that type are not present in the source water assessment area.
This information, used in conjunction with USGS’s susceptibility rating scheme, calculates thesusceptibility rating for each source to each contaminant category. If you are interested in USGS’s ratingschemes please refer to the “Contaminant Category Scoring System for Noncommunity Water SystemsAppendix A – Attachment 2” available in the Noncommunity Source Water Assessment Report forTinton Falls Boro, Monmouth County or on the Source Water Assessment Program website athttp://www.state.nj.us/dep/swap/.
Following the Individual Explanatory Variable Inventory for your system is a source water assessmentmap illustrating the source water assessment areas for systems with in Tinton Falls Boro.
For more information please refer to the Noncommunity Source Water Assessment Report for TintonFalls Boro, Monmouth County, available on the Source Water Assessment Program website. You mayalso contact the Bureau of Safe Drinking Water at 609-292-5550.

Individual Explanatory Variable Groundwater Susceptibility ModelsSource: Well Status: P Source Type: G
Sensitivity Variable Inventory Intensity Variable InventoryPathogens Explanatory Variables - Source Rating = L
Conceptual-Soil Available Water Capacity 0.09 Distance to Agricultural Land Use, 1995Depth to Top of Open Interval Conceptual Septic Tank Density 20.98
Conceptual - GWUDI Conceptual – Presence of Streams, Tier 1 0
Nutrients Explanatory Variables – Source Rating = L Conceptual – Depth to Top of Open Interval % Urban Land Use, 1995 46.1Conceptual – Length of Open Interval % Agricultural Land Use, 1986 0
Pesticides Explanatory Variables – Source Rating = LConceptual – Depth to Top of Open Interval % Urban Land Use, 1995 46.1Conceptual – Length of Open Interval % Agricultural Land Use, 1986 0
Distance to Agricultural Land Use, 1995Conceptual – Distance to golf course
VOCs Explanatory Variables – Source Rating = H% Soil Organic Matter 0.54 % Impervious Surface, 1995 24.4
% Commercial/Industrial Land Use, 1995 34.7Sq. Mi. of Urban Land Use, 1995 0.01Density of SWL, USTs, and KCSL 82.5
Inorganics Explanatory Variables – Source Rating = M
Dissolved Oxygen of water-quality sample
Density of KCSL, SWL, NJPDESGW/SW/Storm, Compost Facilities,SWRRF, SWTF200011, Class BRecycling, DPCC, UST
82.5
pH of water-quality sample Distance to Agricultural Land Use, 1995Depth to Top of Open Interval 180 Population Density, Tier 1 416.73% Soil Clay 7.59 % Barren Land Use, 1995 0Soil Hydraulic Conductivity 65.44 % Urban Land Use, 1970 41.66Conceptual % Soil Organic Matter 0.54 Distance to STPPhysiographic Province COASTAL
PLAIN STP Density 0
Distance to DOT roads 243.88Length of railroads 0Population Density 416.73
Radionuclides Explanatory Variables – Source Rating = HpH of water-quality sample % Urban Land Use, Tier 1, 1995 64.6
Physiographic Province COASTALPLAIN
Conceptual Distance to Agricultural LandUse, 1995
Conceptual Depth of Well 180 % Developed Land, Tier 1, 1995 64.6Conceptual Soil Hydraulic Conductivity 65.44 % Agricultural Land Use, 1970 58.34
Radon Explanatory Variables – Source Rating = MConceptual % Soil Clay 7.59 % Agricultural Land Use, 1995 0
Physiographic Province COASTALPLAIN
Conceptual Distance to Wetlands LandUse, 1995 37
Depth to Top of Open Interval 180DBPs Explanatory Variables – Source Rating = M
Conceptual – % Soil Organic Matter 0.54 Conceptual – Sq. Mi. of Wetlands LandUse, 1995 0.01
Conceptual NJGS Hydrologic Unit (aquifer)Number of NJPDES SW/GW/Storm,Compost, SWWRF, SWTF200011, ClassB Recycling, and DPCC
0
pH of water-quality sample

1
Executive Inn1336312
Source Water Assessment ReportA State Assessment of Your Drinking Water Source’sVulnerability
As a requirement of the 1996 Amendments to the Federal Safe DrinkingWater Act, New Jersey Department of Environmental Protection (DEP)performed a source water assessment of each source of public drinkingwater and determined each source’s susceptibility to contamination.Susceptibility is a measure of the potential exposure of a drinking water source to contamination; actual(if any) contamination is not measured.
DEP, in conjunction with the United States Geological Survey (USGS), performed the following steps todetermine the drinking water source’s susceptibility. Identifying the area (known as the source water assessment area) that supplies water to your public
drinking water system; Inventorying any significant potential sources of contamination in the area; and Analyzing how susceptible the drinking water source is to the potential sources of contamination.
DEP evaluated the susceptibility of all public water system sources to eight categories of contaminants. Pathogens: Disease-causing organisms such as bacteria and viruses. Common sources are animal and human
fecal wastes. Nutrients: Compounds, minerals and elements that aid growth, that are both naturally occurring and man-
made. Examples include nitrogen and phosphorus. Volatile Organic Compounds: Man-made chemicals used as solvents, degreasers, and gasoline components.
Examples include benzene, methyl tertiary butyl ether (MTBE), and vinyl chloride. Pesticides: Man-made chemicals used to control pests, weeds and fungus. Common sources include land
application and manufacturing centers of pesticides. Examples include herbicides such as atrazine, andinsecticides such as chlordane.
Inorganics: Mineral-based compounds that are both naturally occurring and man-made. Examples includearsenic, asbestos, copper, lead, and nitrate.
Radionuclides: Radioactive substances that are both naturally occurring and man-made. Examples includeradium and uranium.
Radon: Colorless, odorless, cancer-causing gas that occurs naturally in the environment. For more informationgo to http://www.nj.gov/dep/rpp/radon/index.htm or call (800) 648-0394.
Disinfection Byproduct Precursors: A common source is naturally occurring organic matter in surface water.Disinfection byproducts are formed when the disinfectants (usually chlorine) used to kill pathogens react withdissolved organic material (for example leaves) present in surface water.
To determine a source’s susceptibility to these contaminants, the USGS, with DEP assistance, developedstatistical models based on extensive analysis of existing well sample data and surface water intake data.The statistical models determined the relationship between environmental factors and the probability forcontamination to occur. These models identified factors, such as land use or geology, found to besignificantly “linked” to a public water system source’s potential to become contaminated by one or morecategories of contaminants. DEP and USGS looked at factors that might affect the quality of drinkingwater sources and separated them into two categories.
2
How “sensitive” the water supply is to contamination. For example, a shallow well or surface watersource, like a reservoir, would be more exposed to contamination from the surface or above groundthan a confined well.
How frequently a contaminant is used or exists near the source. This is known as “intensity of use.”For example, the number and/or types of activities (such as industry or agriculture) surrounding thesource.
The specific sensitivity and intensity of use factors and their values within each source water assessmentarea for your source(s) are provided on page 7 of this report.
Using the susceptibility factors, the statistical models provided a numerical score for each source ofdrinking water for each contaminant category. These were then converted into high (H), medium (M), orlow (L) susceptibility ratings.
The Safe Drinking Water Standards or Maximum Contaminant Levels (MCLs) were used to define thethree susceptibility ratings (H, M, and L). These standards are developed based health effects, analyticaland treatment factors on either acute or long-term impacts related to drinking water exposure. A lowsusceptibility rating means a potential contaminant level was predicted to be less than 10 percent of theMCL for that contaminant category. A medium rating means the potential contaminant level waspredicted to be equal to or greater than 10 percent and less than 50 percent of the MCL. A high ratingwas assigned to those sources that were predicted to have potential contaminant levels equal to or greaterthan 50 percent of the MCL. Sources with high susceptibility ratings are still likely to have contaminantconcentrations below the MCL.
The susceptibility ratings of your sources to each of the contaminant categories are provided on page 6 ofthis report.
Source Water Assessment Program GoalsThe information obtained from the source water assessments may be used to achieve the following goals:
1. Protect sources of drinking water. Source water protection focuses on preserving and protecting the public drinking water source. Thesource water assessment results may be used by DEP, purveyors, and local planning officials to lay thegroundwork for advancing drinking water protection efforts. State and local agencies, as well as theregulated community, have made significant strides to protect the quality of our water resources. Majorwater quality improvements have been made as a result of water quality and drinking water standards andprograms (both regulatory and nonregulatory) designed to ensure standards are met. Waste managementand clean up programs have had success in controlling releases and ensuring actions are taken to achievestandards if releases occur. Recent measures to control non-point sources have expanded the DEP’s waterquality protection programs by recognizing the link between land use change and water resource impacts.The Safe Drinking Water Program is designed to ensure that water delivered for human consumptionmeets drinking water standards. In addition to these programs, major initiatives such as the HighlandsWater Protection and Planning Act, Surface Water Quality Standards and Category One Designation, andStormwater Management Rules have recently been accomplished. Despite this success, the DEPrecognizes the ongoing importance of using new information such as that from the source waterassessments to evaluate the need for additional protection measures of drinking water sources. The DEP iscurrently reviewing the source water assessments to identify any necessary additional source waterprotection measures.
3
2. Public education of SWAP information. DEP incorporated public education throughout the development and implementation of the Source WaterAssessment Program. During the source water assessment process, DEP met with interested parties,beginning with the development of the SWAP Plan, published articles, wrote two newsletters, anddeveloped a SWAP web site. The SWAP web site contains information on the program, technicalresources, frequently asked questions, source water assessment results, and links to additional sites ofinterest. Upon completion of the source water assessments, DEP generated a source water assessmentreport for each public water system to report the susceptibility ratings of public drinking water sources topotential contamination.
The goal of the public education efforts is to raise public awareness of the source of their drinking waterand the potential contaminants that could impair the water's quality. To continue fulfilling the educationgoal, DEP will conduct training sessions following the release of the Source Water Assessment Reports.
3. Establish a customized monitoring schedule for each public water system. The source water assessments will assist DEP in improving current monitoring requirements forindividual public water systems. Currently, the Environmental Protection Agency (EPA) and the DEPhave mandatory monitoring schedules that depend on a variety of factors that can include the source ofthe water (ground water or surface water) and the surrounding land use. These schedules may becustomized based on the susceptibility of the sources of drinking water.
Where does drinking water come from?There are two basic sources of drinking water: ground water and surface water.
Ground water is water found beneath the Earth’s surface. Ground water comes from rain and snowseeping into rock and soil. Ground water is stored in underground areas called aquifers. Aquifers supplywells and springs. Wells in New Jersey range from about 15 feet to 2,000 feet deep.
Surface water is the water naturally open to the atmosphere, such as rivers, lakes, streams and reservoirs.Precipitation that does not infiltrate the ground or evaporate into the sky runs off into surface waterbodies.
Ground water can seep into a stream, river or other surface water body, recharging surface water bodies.Likewise, under some circumstances, surface water can seep into an adjacent aquifer.
A water system obtains its water from 1) wells drilled into the ground that pump out ground water; 2)devices called surface water intakes placed on a river, stream, or reservoir; or 3) both.
What factors may affect the quality of your drinking water source?A variety of conditions and activities may affect the quality of drinking water source. These includegeology (rock and soil types); depth of a well or location of a surface water intake; how the landsurrounding the source is used (for industry, agriculture or development); the use of pesticides andfertilizers; and the presence of contaminated sites, leaking underground storage tanks, and landfills.Please refer to pages 6 and 7 of this report for specific potential contaminant source information.

4
What steps are being taken now to ensure my drinking water quality?The DEP has numerous programs in place to maintain and protect the quality of our State's waterresources. For example, the Safe Drinking Water Program is designed to ensure that water delivered forhuman consumption meets DEP's stringent health-based drinking water standards. Additionally, DEP haspermitting, waste management, and clean up programs in place to avoid and control potentialcontamination. Key DEP drinking water protection initiatives will be phased-in over time in source waterassessment areas to advance existing program protections.
What can you and others do to help?While government at the state and local levels can do their part, there are actions you and your neighborscan take now to help protect our precious and shared natural resource.
Here’s just a few ways you and others can help ensure clean and plentiful water for New Jersey – now andin the future. Join us today for a clean water future. Dispose of waste properly. Some materials such as motor oil, paint, flea collars, and household
cleaners have the potential to contaminate source water. Contact your local Department of PublicWorks for proper household hazardous waste disposal.
Limit your use of fertilizer, pesticides, and herbicides.
Here are some actions that municipal and county officials/local and county planners can take and you canhelp encourage and support. Manage and work with owners of existing potential contaminant sources to minimize potential
contamination. Establish regulations prohibiting or restricting certain activities or land uses within the source water
assessment area. Take appropriate enforcement action when necessary. Update municipal master plans to ensure greater protection. Purchase lands or create conservation easements within the source water assessment area.
Illustration courtesy of USGS
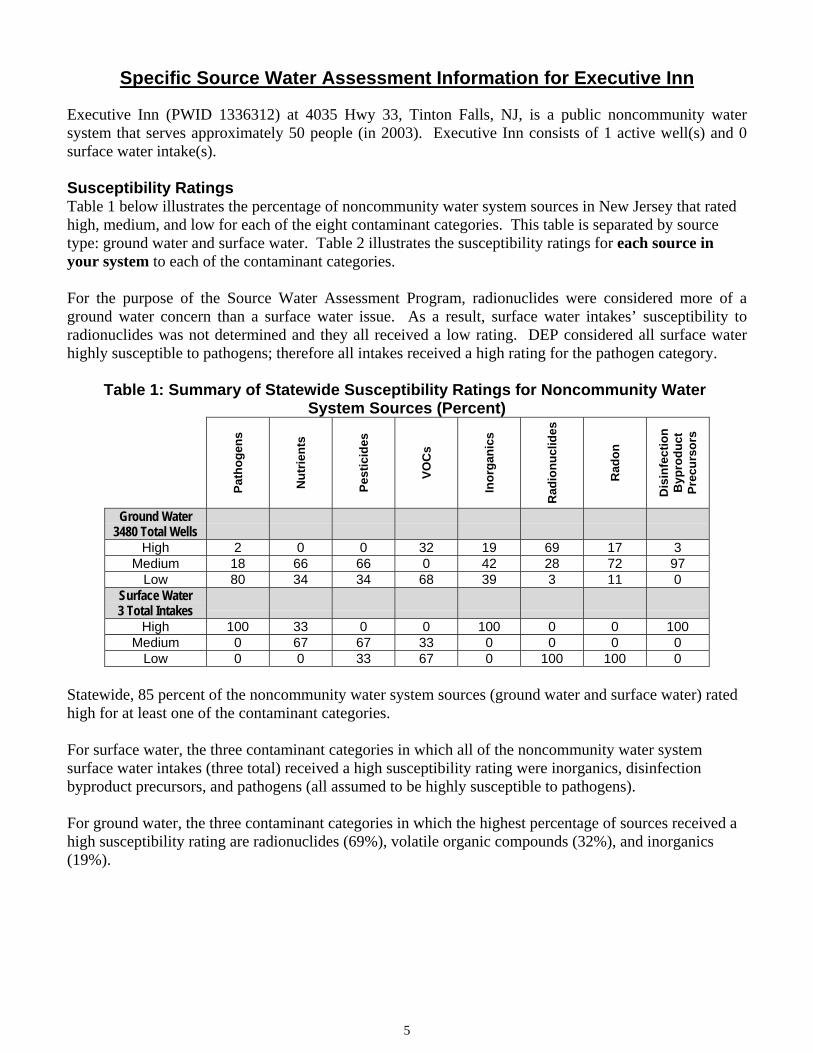
5
Specific Source Water Assessment Information for Executive Inn
Executive Inn (PWID 1336312) at 4035 Hwy 33, Tinton Falls, NJ, is a public noncommunity watersystem that serves approximately 50 people (in 2003). Executive Inn consists of 1 active well(s) and 0surface water intake(s).
Susceptibility RatingsTable 1 below illustrates the percentage of noncommunity water system sources in New Jersey that ratedhigh, medium, and low for each of the eight contaminant categories. This table is separated by sourcetype: ground water and surface water. Table 2 illustrates the susceptibility ratings for each source inyour system to each of the contaminant categories.
For the purpose of the Source Water Assessment Program, radionuclides were considered more of aground water concern than a surface water issue. As a result, surface water intakes’ susceptibility toradionuclides was not determined and they all received a low rating. DEP considered all surface waterhighly susceptible to pathogens; therefore all intakes received a high rating for the pathogen category.
Table 1: Summary of Statewide Susceptibility Ratings for Noncommunity Water System Sources (Percent)
Path
ogen
s
Nut
rient
s
Pest
icid
es
VOC
s
Inor
gani
cs
Rad
ionu
clid
es
Rad
on
Dis
infe
ctio
nB
ypro
duct
Prec
urso
rs
Ground Water3480 Total Wells
High 2 0 0 32 19 69 17 3Medium 18 66 66 0 42 28 72 97
Low 80 34 34 68 39 3 11 0Surface Water3 Total Intakes
High 100 33 0 0 100 0 0 100Medium 0 67 67 33 0 0 0 0
Low 0 0 33 67 0 100 100 0
Statewide, 85 percent of the noncommunity water system sources (ground water and surface water) ratedhigh for at least one of the contaminant categories.
For surface water, the three contaminant categories in which all of the noncommunity water systemsurface water intakes (three total) received a high susceptibility rating were inorganics, disinfectionbyproduct precursors, and pathogens (all assumed to be highly susceptible to pathogens).
For ground water, the three contaminant categories in which the highest percentage of sources received ahigh susceptibility rating are radionuclides (69%), volatile organic compounds (32%), and inorganics(19%).
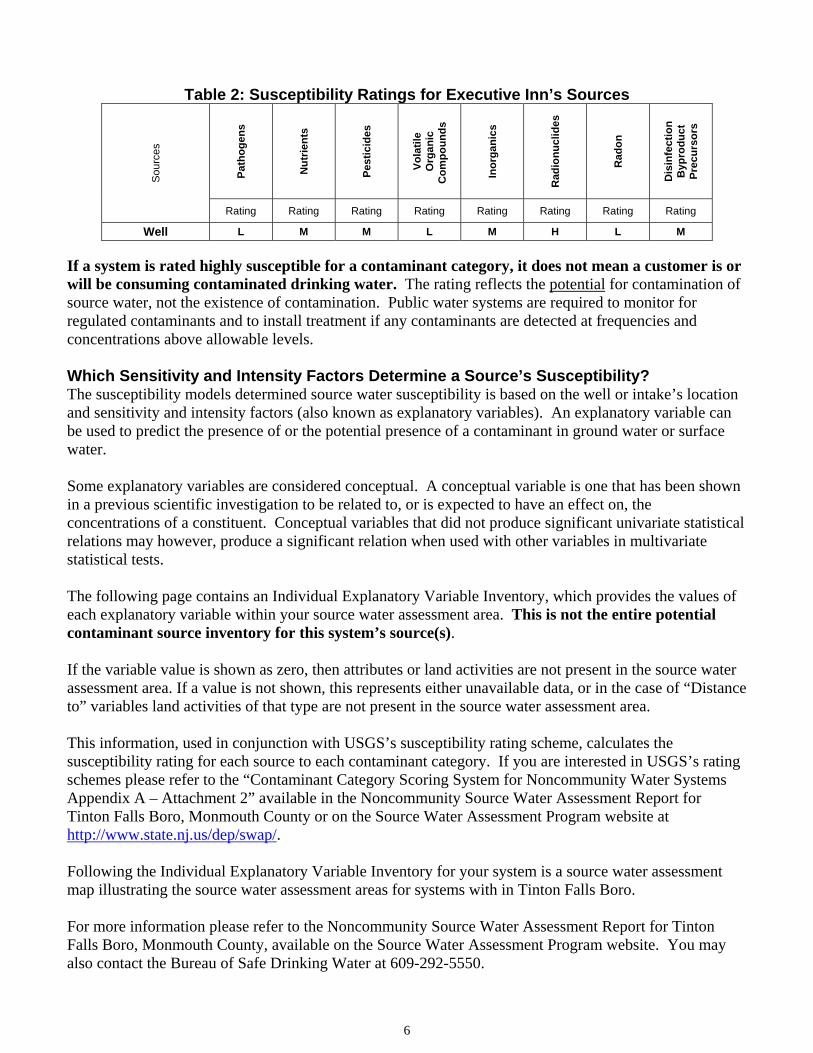
6
Table 2: Susceptibility Ratings for Executive Inn’s Sources
Path
ogen
s
Nut
rient
s
Pest
icid
es
Vola
tile
Org
anic
Com
poun
ds
Inor
gani
cs
Rad
ionu
clid
es
Rad
on
Dis
infe
ctio
nB
ypro
duct
Prec
urso
rs
Sou
rces
Rating Rating Rating Rating Rating Rating Rating Rating
Well L M M L M H L M
If a system is rated highly susceptible for a contaminant category, it does not mean a customer is orwill be consuming contaminated drinking water. The rating reflects the potential for contamination ofsource water, not the existence of contamination. Public water systems are required to monitor forregulated contaminants and to install treatment if any contaminants are detected at frequencies andconcentrations above allowable levels.
Which Sensitivity and Intensity Factors Determine a Source’s Susceptibility?The susceptibility models determined source water susceptibility is based on the well or intake’s locationand sensitivity and intensity factors (also known as explanatory variables). An explanatory variable canbe used to predict the presence of or the potential presence of a contaminant in ground water or surfacewater.
Some explanatory variables are considered conceptual. A conceptual variable is one that has been shownin a previous scientific investigation to be related to, or is expected to have an effect on, theconcentrations of a constituent. Conceptual variables that did not produce significant univariate statisticalrelations may however, produce a significant relation when used with other variables in multivariatestatistical tests.
The following page contains an Individual Explanatory Variable Inventory, which provides the values ofeach explanatory variable within your source water assessment area. This is not the entire potentialcontaminant source inventory for this system’s source(s).
If the variable value is shown as zero, then attributes or land activities are not present in the source waterassessment area. If a value is not shown, this represents either unavailable data, or in the case of “Distanceto” variables land activities of that type are not present in the source water assessment area.
This information, used in conjunction with USGS’s susceptibility rating scheme, calculates thesusceptibility rating for each source to each contaminant category. If you are interested in USGS’s ratingschemes please refer to the “Contaminant Category Scoring System for Noncommunity Water SystemsAppendix A – Attachment 2” available in the Noncommunity Source Water Assessment Report forTinton Falls Boro, Monmouth County or on the Source Water Assessment Program website athttp://www.state.nj.us/dep/swap/.
Following the Individual Explanatory Variable Inventory for your system is a source water assessmentmap illustrating the source water assessment areas for systems with in Tinton Falls Boro.
For more information please refer to the Noncommunity Source Water Assessment Report for TintonFalls Boro, Monmouth County, available on the Source Water Assessment Program website. You mayalso contact the Bureau of Safe Drinking Water at 609-292-5550.

Individual Explanatory Variable Groundwater Susceptibility ModelsSource: Well Status: P Source Type: G
Sensitivity Variable Inventory Intensity Variable InventoryPathogens Explanatory Variables - Source Rating = L
Conceptual-Soil Available Water Capacity 0.08 Distance to Agricultural Land Use, 1995Depth to Top of Open Interval Conceptual Septic Tank Density 20.98
Conceptual - GWUDI Conceptual – Presence of Streams, Tier 1 0
Nutrients Explanatory Variables – Source Rating = M Conceptual – Depth to Top of Open Interval % Urban Land Use, 1995 100Conceptual – Length of Open Interval % Agricultural Land Use, 1986 0
Pesticides Explanatory Variables – Source Rating = MConceptual – Depth to Top of Open Interval % Urban Land Use, 1995 100Conceptual – Length of Open Interval % Agricultural Land Use, 1986 0
Distance to Agricultural Land Use, 1995Conceptual – Distance to golf course
VOCs Explanatory Variables – Source Rating = L% Soil Organic Matter 0.45 % Impervious Surface, 1995 40.2
% Commercial/Industrial Land Use, 1995 70.93Sq. Mi. of Urban Land Use, 1995 0.01Density of SWL, USTs, and KCSL 0
Inorganics Explanatory Variables – Source Rating = M
Dissolved Oxygen of water-quality sample
Density of KCSL, SWL, NJPDESGW/SW/Storm, Compost Facilities,SWRRF, SWTF200011, Class BRecycling, DPCC, UST
0
pH of water-quality sample Distance to Agricultural Land Use, 1995Depth to Top of Open Interval 180 Population Density, Tier 1 416.73% Soil Clay 7.85 % Barren Land Use, 1995 0Soil Hydraulic Conductivity 60.79 % Urban Land Use, 1970 100Conceptual % Soil Organic Matter 0.45 Distance to STPPhysiographic Province COASTAL
PLAIN STP Density 0
Distance to DOT roads 185.02Length of railroads 0Population Density 416.73
Radionuclides Explanatory Variables – Source Rating = HpH of water-quality sample % Urban Land Use, Tier 1, 1995 100
Physiographic Province COASTALPLAIN
Conceptual Distance to Agricultural LandUse, 1995
Conceptual Depth of Well 180 % Developed Land, Tier 1, 1995 100Conceptual Soil Hydraulic Conductivity 60.79 % Agricultural Land Use, 1970 0
Radon Explanatory Variables – Source Rating = LConceptual % Soil Clay 7.85 % Agricultural Land Use, 1995 0
Physiographic Province COASTALPLAIN
Conceptual Distance to Wetlands LandUse, 1995
Depth to Top of Open Interval 180DBPs Explanatory Variables – Source Rating = M
Conceptual – % Soil Organic Matter 0.45 Conceptual – Sq. Mi. of Wetlands LandUse, 1995 0
Conceptual NJGS Hydrologic Unit (aquifer)Number of NJPDES SW/GW/Storm,Compost, SWWRF, SWTF200011, ClassB Recycling, and DPCC
0
pH of water-quality sample

1
Martin Motel1336315
Source Water Assessment ReportA State Assessment of Your Drinking Water Source’sVulnerability
As a requirement of the 1996 Amendments to the Federal Safe DrinkingWater Act, New Jersey Department of Environmental Protection (DEP)performed a source water assessment of each source of public drinkingwater and determined each source’s susceptibility to contamination.Susceptibility is a measure of the potential exposure of a drinking water source to contamination; actual(if any) contamination is not measured.
DEP, in conjunction with the United States Geological Survey (USGS), performed the following steps todetermine the drinking water source’s susceptibility. Identifying the area (known as the source water assessment area) that supplies water to your public
drinking water system; Inventorying any significant potential sources of contamination in the area; and Analyzing how susceptible the drinking water source is to the potential sources of contamination.
DEP evaluated the susceptibility of all public water system sources to eight categories of contaminants. Pathogens: Disease-causing organisms such as bacteria and viruses. Common sources are animal and human
fecal wastes. Nutrients: Compounds, minerals and elements that aid growth, that are both naturally occurring and man-
made. Examples include nitrogen and phosphorus. Volatile Organic Compounds: Man-made chemicals used as solvents, degreasers, and gasoline components.
Examples include benzene, methyl tertiary butyl ether (MTBE), and vinyl chloride. Pesticides: Man-made chemicals used to control pests, weeds and fungus. Common sources include land
application and manufacturing centers of pesticides. Examples include herbicides such as atrazine, andinsecticides such as chlordane.
Inorganics: Mineral-based compounds that are both naturally occurring and man-made. Examples includearsenic, asbestos, copper, lead, and nitrate.
Radionuclides: Radioactive substances that are both naturally occurring and man-made. Examples includeradium and uranium.
Radon: Colorless, odorless, cancer-causing gas that occurs naturally in the environment. For more informationgo to http://www.nj.gov/dep/rpp/radon/index.htm or call (800) 648-0394.
Disinfection Byproduct Precursors: A common source is naturally occurring organic matter in surface water.Disinfection byproducts are formed when the disinfectants (usually chlorine) used to kill pathogens react withdissolved organic material (for example leaves) present in surface water.
To determine a source’s susceptibility to these contaminants, the USGS, with DEP assistance, developedstatistical models based on extensive analysis of existing well sample data and surface water intake data.The statistical models determined the relationship between environmental factors and the probability forcontamination to occur. These models identified factors, such as land use or geology, found to besignificantly “linked” to a public water system source’s potential to become contaminated by one or morecategories of contaminants. DEP and USGS looked at factors that might affect the quality of drinkingwater sources and separated them into two categories.

2
How “sensitive” the water supply is to contamination. For example, a shallow well or surface watersource, like a reservoir, would be more exposed to contamination from the surface or above groundthan a confined well.
How frequently a contaminant is used or exists near the source. This is known as “intensity of use.”For example, the number and/or types of activities (such as industry or agriculture) surrounding thesource.
The specific sensitivity and intensity of use factors and their values within each source water assessmentarea for your source(s) are provided on page 7 of this report.
Using the susceptibility factors, the statistical models provided a numerical score for each source ofdrinking water for each contaminant category. These were then converted into high (H), medium (M), orlow (L) susceptibility ratings.
The Safe Drinking Water Standards or Maximum Contaminant Levels (MCLs) were used to define thethree susceptibility ratings (H, M, and L). These standards are developed based health effects, analyticaland treatment factors on either acute or long-term impacts related to drinking water exposure. A lowsusceptibility rating means a potential contaminant level was predicted to be less than 10 percent of theMCL for that contaminant category. A medium rating means the potential contaminant level waspredicted to be equal to or greater than 10 percent and less than 50 percent of the MCL. A high ratingwas assigned to those sources that were predicted to have potential contaminant levels equal to or greaterthan 50 percent of the MCL. Sources with high susceptibility ratings are still likely to have contaminantconcentrations below the MCL.
The susceptibility ratings of your sources to each of the contaminant categories are provided on page 6 ofthis report.
Source Water Assessment Program GoalsThe information obtained from the source water assessments may be used to achieve the following goals:
1. Protect sources of drinking water. Source water protection focuses on preserving and protecting the public drinking water source. Thesource water assessment results may be used by DEP, purveyors, and local planning officials to lay thegroundwork for advancing drinking water protection efforts. State and local agencies, as well as theregulated community, have made significant strides to protect the quality of our water resources. Majorwater quality improvements have been made as a result of water quality and drinking water standards andprograms (both regulatory and nonregulatory) designed to ensure standards are met. Waste managementand clean up programs have had success in controlling releases and ensuring actions are taken to achievestandards if releases occur. Recent measures to control non-point sources have expanded the DEP’s waterquality protection programs by recognizing the link between land use change and water resource impacts.The Safe Drinking Water Program is designed to ensure that water delivered for human consumptionmeets drinking water standards. In addition to these programs, major initiatives such as the HighlandsWater Protection and Planning Act, Surface Water Quality Standards and Category One Designation, andStormwater Management Rules have recently been accomplished. Despite this success, the DEPrecognizes the ongoing importance of using new information such as that from the source waterassessments to evaluate the need for additional protection measures of drinking water sources. The DEP iscurrently reviewing the source water assessments to identify any necessary additional source waterprotection measures.

3
2. Public education of SWAP information. DEP incorporated public education throughout the development and implementation of the Source WaterAssessment Program. During the source water assessment process, DEP met with interested parties,beginning with the development of the SWAP Plan, published articles, wrote two newsletters, anddeveloped a SWAP web site. The SWAP web site contains information on the program, technicalresources, frequently asked questions, source water assessment results, and links to additional sites ofinterest. Upon completion of the source water assessments, DEP generated a source water assessmentreport for each public water system to report the susceptibility ratings of public drinking water sources topotential contamination.
The goal of the public education efforts is to raise public awareness of the source of their drinking waterand the potential contaminants that could impair the water's quality. To continue fulfilling the educationgoal, DEP will conduct training sessions following the release of the Source Water Assessment Reports.
3. Establish a customized monitoring schedule for each public water system. The source water assessments will assist DEP in improving current monitoring requirements forindividual public water systems. Currently, the Environmental Protection Agency (EPA) and the DEPhave mandatory monitoring schedules that depend on a variety of factors that can include the source ofthe water (ground water or surface water) and the surrounding land use. These schedules may becustomized based on the susceptibility of the sources of drinking water.
Where does drinking water come from?There are two basic sources of drinking water: ground water and surface water.
Ground water is water found beneath the Earth’s surface. Ground water comes from rain and snowseeping into rock and soil. Ground water is stored in underground areas called aquifers. Aquifers supplywells and springs. Wells in New Jersey range from about 15 feet to 2,000 feet deep.
Surface water is the water naturally open to the atmosphere, such as rivers, lakes, streams and reservoirs.Precipitation that does not infiltrate the ground or evaporate into the sky runs off into surface waterbodies.
Ground water can seep into a stream, river or other surface water body, recharging surface water bodies.Likewise, under some circumstances, surface water can seep into an adjacent aquifer.
A water system obtains its water from 1) wells drilled into the ground that pump out ground water; 2)devices called surface water intakes placed on a river, stream, or reservoir; or 3) both.
What factors may affect the quality of your drinking water source?A variety of conditions and activities may affect the quality of drinking water source. These includegeology (rock and soil types); depth of a well or location of a surface water intake; how the landsurrounding the source is used (for industry, agriculture or development); the use of pesticides andfertilizers; and the presence of contaminated sites, leaking underground storage tanks, and landfills.Please refer to pages 6 and 7 of this report for specific potential contaminant source information.

4
What steps are being taken now to ensure my drinking water quality?The DEP has numerous programs in place to maintain and protect the quality of our State's waterresources. For example, the Safe Drinking Water Program is designed to ensure that water delivered forhuman consumption meets DEP's stringent health-based drinking water standards. Additionally, DEP haspermitting, waste management, and clean up programs in place to avoid and control potentialcontamination. Key DEP drinking water protection initiatives will be phased-in over time in source waterassessment areas to advance existing program protections.
What can you and others do to help?While government at the state and local levels can do their part, there are actions you and your neighborscan take now to help protect our precious and shared natural resource.
Here’s just a few ways you and others can help ensure clean and plentiful water for New Jersey – now andin the future. Join us today for a clean water future. Dispose of waste properly. Some materials such as motor oil, paint, flea collars, and household
cleaners have the potential to contaminate source water. Contact your local Department of PublicWorks for proper household hazardous waste disposal.
Limit your use of fertilizer, pesticides, and herbicides.
Here are some actions that municipal and county officials/local and county planners can take and you canhelp encourage and support. Manage and work with owners of existing potential contaminant sources to minimize potential
contamination. Establish regulations prohibiting or restricting certain activities or land uses within the source water
assessment area. Take appropriate enforcement action when necessary. Update municipal master plans to ensure greater protection. Purchase lands or create conservation easements within the source water assessment area.
Illustration courtesy of USGS

5
Specific Source Water Assessment Information for Martin Motel
Martin Motel (PWID 1336315) at 4236 Hwy 33, Tinton Falls, NJ, is a public noncommunity watersystem that serves approximately 34 people (in 2003). Martin Motel consists of 1 active well(s) and 0surface water intake(s).
Susceptibility RatingsTable 1 below illustrates the percentage of noncommunity water system sources in New Jersey that ratedhigh, medium, and low for each of the eight contaminant categories. This table is separated by sourcetype: ground water and surface water. Table 2 illustrates the susceptibility ratings for each source inyour system to each of the contaminant categories.
For the purpose of the Source Water Assessment Program, radionuclides were considered more of aground water concern than a surface water issue. As a result, surface water intakes’ susceptibility toradionuclides was not determined and they all received a low rating. DEP considered all surface waterhighly susceptible to pathogens; therefore all intakes received a high rating for the pathogen category.
Table 1: Summary of Statewide Susceptibility Ratings for Noncommunity Water System Sources (Percent)
Path
ogen
s
Nut
rient
s
Pest
icid
es
VOC
s
Inor
gani
cs
Rad
ionu
clid
es
Rad
on
Dis
infe
ctio
nB
ypro
duct
Prec
urso
rs
Ground Water3480 Total Wells
High 2 0 0 32 19 69 17 3Medium 18 66 66 0 42 28 72 97
Low 80 34 34 68 39 3 11 0Surface Water3 Total Intakes
High 100 33 0 0 100 0 0 100Medium 0 67 67 33 0 0 0 0
Low 0 0 33 67 0 100 100 0
Statewide, 85 percent of the noncommunity water system sources (ground water and surface water) ratedhigh for at least one of the contaminant categories.
For surface water, the three contaminant categories in which all of the noncommunity water systemsurface water intakes (three total) received a high susceptibility rating were inorganics, disinfectionbyproduct precursors, and pathogens (all assumed to be highly susceptible to pathogens).
For ground water, the three contaminant categories in which the highest percentage of sources received ahigh susceptibility rating are radionuclides (69%), volatile organic compounds (32%), and inorganics(19%).

6
Table 2: Susceptibility Ratings for Martin Motel’s Sources
Path
ogen
s
Nut
rient
s
Pest
icid
es
Vola
tile
Org
anic
Com
poun
ds
Inor
gani
cs
Rad
ionu
clid
es
Rad
on
Dis
infe
ctio
nB
ypro
duct
Prec
urso
rs
Sou
rces
Rating Rating Rating Rating Rating Rating Rating Rating
Well L M M L M H L M
If a system is rated highly susceptible for a contaminant category, it does not mean a customer is orwill be consuming contaminated drinking water. The rating reflects the potential for contamination ofsource water, not the existence of contamination. Public water systems are required to monitor forregulated contaminants and to install treatment if any contaminants are detected at frequencies andconcentrations above allowable levels.
Which Sensitivity and Intensity Factors Determine a Source’s Susceptibility?The susceptibility models determined source water susceptibility is based on the well or intake’s locationand sensitivity and intensity factors (also known as explanatory variables). An explanatory variable canbe used to predict the presence of or the potential presence of a contaminant in ground water or surfacewater.
Some explanatory variables are considered conceptual. A conceptual variable is one that has been shownin a previous scientific investigation to be related to, or is expected to have an effect on, theconcentrations of a constituent. Conceptual variables that did not produce significant univariate statisticalrelations may however, produce a significant relation when used with other variables in multivariatestatistical tests.
The following page contains an Individual Explanatory Variable Inventory, which provides the values ofeach explanatory variable within your source water assessment area. This is not the entire potentialcontaminant source inventory for this system’s source(s).
If the variable value is shown as zero, then attributes or land activities are not present in the source waterassessment area. If a value is not shown, this represents either unavailable data, or in the case of “Distanceto” variables land activities of that type are not present in the source water assessment area.
This information, used in conjunction with USGS’s susceptibility rating scheme, calculates thesusceptibility rating for each source to each contaminant category. If you are interested in USGS’s ratingschemes please refer to the “Contaminant Category Scoring System for Noncommunity Water SystemsAppendix A – Attachment 2” available in the Noncommunity Source Water Assessment Report forTinton Falls Boro, Monmouth County or on the Source Water Assessment Program website athttp://www.state.nj.us/dep/swap/.
Following the Individual Explanatory Variable Inventory for your system is a source water assessmentmap illustrating the source water assessment areas for systems with in Tinton Falls Boro.
For more information please refer to the Noncommunity Source Water Assessment Report for TintonFalls Boro, Monmouth County, available on the Source Water Assessment Program website. You mayalso contact the Bureau of Safe Drinking Water at 609-292-5550.

Individual Explanatory Variable Groundwater Susceptibility ModelsSource: Well Status: P Source Type: G
Sensitivity Variable Inventory Intensity Variable InventoryPathogens Explanatory Variables - Source Rating = L
Conceptual-Soil Available Water Capacity 0.07 Distance to Agricultural Land Use, 1995 69.08
Depth to Top of Open Interval Conceptual Septic Tank Density 20.98
Conceptual - GWUDI Conceptual – Presence of Streams, Tier 1 0
Nutrients Explanatory Variables – Source Rating = M Conceptual – Depth to Top of Open Interval % Urban Land Use, 1995 73.03Conceptual – Length of Open Interval % Agricultural Land Use, 1986 3.5
Pesticides Explanatory Variables – Source Rating = MConceptual – Depth to Top of Open Interval % Urban Land Use, 1995 73.03Conceptual – Length of Open Interval % Agricultural Land Use, 1986 3.5
Distance to Agricultural Land Use, 1995 69.08Conceptual – Distance to golf course
VOCs Explanatory Variables – Source Rating = L% Soil Organic Matter 0.32 % Impervious Surface, 1995 20.7
% Commercial/Industrial Land Use, 1995 56.34Sq. Mi. of Urban Land Use, 1995 0Density of SWL, USTs, and KCSL 0
Inorganics Explanatory Variables – Source Rating = M
Dissolved Oxygen of water-quality sample
Density of KCSL, SWL, NJPDESGW/SW/Storm, Compost Facilities,SWRRF, SWTF200011, Class BRecycling, DPCC, UST
0
pH of water-quality sample Distance to Agricultural Land Use, 1995 69.08Depth to Top of Open Interval 200 Population Density, Tier 1 416.73% Soil Clay 3.74 % Barren Land Use, 1995 0Soil Hydraulic Conductivity 85.52 % Urban Land Use, 1970 99Conceptual % Soil Organic Matter 0.32 Distance to STPPhysiographic Province COASTAL
PLAIN STP Density 0
Distance to DOT roads 100.49Length of railroads 0Population Density 416.73
Radionuclides Explanatory Variables – Source Rating = HpH of water-quality sample % Urban Land Use, Tier 1, 1995 88.9
Physiographic Province COASTALPLAIN
Conceptual Distance to Agricultural LandUse, 1995 69.08
Conceptual Depth of Well 200 % Developed Land, Tier 1, 1995 100Conceptual Soil Hydraulic Conductivity 85.52 % Agricultural Land Use, 1970 1
Radon Explanatory Variables – Source Rating = LConceptual % Soil Clay 3.74 % Agricultural Land Use, 1995 24.48
Physiographic Province COASTALPLAIN
Conceptual Distance to Wetlands LandUse, 1995 63.08
Depth to Top of Open Interval 200DBPs Explanatory Variables – Source Rating = M
Conceptual – % Soil Organic Matter 0.32 Conceptual – Sq. Mi. of Wetlands LandUse, 1995 0
Conceptual NJGS Hydrologic Unit (aquifer)Number of NJPDES SW/GW/Storm,Compost, SWWRF, SWTF200011, ClassB Recycling, and DPCC
0
pH of water-quality sample

1
Carton Et Als Legal Offices1336316
Source Water Assessment ReportA State Assessment of Your Drinking Water Source’sVulnerability
As a requirement of the 1996 Amendments to the Federal Safe DrinkingWater Act, New Jersey Department of Environmental Protection (DEP)performed a source water assessment of each source of public drinkingwater and determined each source’s susceptibility to contamination.Susceptibility is a measure of the potential exposure of a drinking water source to contamination; actual(if any) contamination is not measured.
DEP, in conjunction with the United States Geological Survey (USGS), performed the following steps todetermine the drinking water source’s susceptibility. Identifying the area (known as the source water assessment area) that supplies water to your public
drinking water system; Inventorying any significant potential sources of contamination in the area; and Analyzing how susceptible the drinking water source is to the potential sources of contamination.
DEP evaluated the susceptibility of all public water system sources to eight categories of contaminants. Pathogens: Disease-causing organisms such as bacteria and viruses. Common sources are animal and human
fecal wastes. Nutrients: Compounds, minerals and elements that aid growth, that are both naturally occurring and man-
made. Examples include nitrogen and phosphorus. Volatile Organic Compounds: Man-made chemicals used as solvents, degreasers, and gasoline components.
Examples include benzene, methyl tertiary butyl ether (MTBE), and vinyl chloride. Pesticides: Man-made chemicals used to control pests, weeds and fungus. Common sources include land
application and manufacturing centers of pesticides. Examples include herbicides such as atrazine, andinsecticides such as chlordane.
Inorganics: Mineral-based compounds that are both naturally occurring and man-made. Examples includearsenic, asbestos, copper, lead, and nitrate.
Radionuclides: Radioactive substances that are both naturally occurring and man-made. Examples includeradium and uranium.
Radon: Colorless, odorless, cancer-causing gas that occurs naturally in the environment. For more informationgo to http://www.nj.gov/dep/rpp/radon/index.htm or call (800) 648-0394.
Disinfection Byproduct Precursors: A common source is naturally occurring organic matter in surface water.Disinfection byproducts are formed when the disinfectants (usually chlorine) used to kill pathogens react withdissolved organic material (for example leaves) present in surface water.
To determine a source’s susceptibility to these contaminants, the USGS, with DEP assistance, developedstatistical models based on extensive analysis of existing well sample data and surface water intake data.The statistical models determined the relationship between environmental factors and the probability forcontamination to occur. These models identified factors, such as land use or geology, found to besignificantly “linked” to a public water system source’s potential to become contaminated by one or morecategories of contaminants. DEP and USGS looked at factors that might affect the quality of drinkingwater sources and separated them into two categories.

2
How “sensitive” the water supply is to contamination. For example, a shallow well or surface watersource, like a reservoir, would be more exposed to contamination from the surface or above groundthan a confined well.
How frequently a contaminant is used or exists near the source. This is known as “intensity of use.”For example, the number and/or types of activities (such as industry or agriculture) surrounding thesource.
The specific sensitivity and intensity of use factors and their values within each source water assessmentarea for your source(s) are provided on page 7 of this report.
Using the susceptibility factors, the statistical models provided a numerical score for each source ofdrinking water for each contaminant category. These were then converted into high (H), medium (M), orlow (L) susceptibility ratings.
The Safe Drinking Water Standards or Maximum Contaminant Levels (MCLs) were used to define thethree susceptibility ratings (H, M, and L). These standards are developed based health effects, analyticaland treatment factors on either acute or long-term impacts related to drinking water exposure. A lowsusceptibility rating means a potential contaminant level was predicted to be less than 10 percent of theMCL for that contaminant category. A medium rating means the potential contaminant level waspredicted to be equal to or greater than 10 percent and less than 50 percent of the MCL. A high ratingwas assigned to those sources that were predicted to have potential contaminant levels equal to or greaterthan 50 percent of the MCL. Sources with high susceptibility ratings are still likely to have contaminantconcentrations below the MCL.
The susceptibility ratings of your sources to each of the contaminant categories are provided on page 6 ofthis report.
Source Water Assessment Program GoalsThe information obtained from the source water assessments may be used to achieve the following goals:
1. Protect sources of drinking water. Source water protection focuses on preserving and protecting the public drinking water source. Thesource water assessment results may be used by DEP, purveyors, and local planning officials to lay thegroundwork for advancing drinking water protection efforts. State and local agencies, as well as theregulated community, have made significant strides to protect the quality of our water resources. Majorwater quality improvements have been made as a result of water quality and drinking water standards andprograms (both regulatory and nonregulatory) designed to ensure standards are met. Waste managementand clean up programs have had success in controlling releases and ensuring actions are taken to achievestandards if releases occur. Recent measures to control non-point sources have expanded the DEP’s waterquality protection programs by recognizing the link between land use change and water resource impacts.The Safe Drinking Water Program is designed to ensure that water delivered for human consumptionmeets drinking water standards. In addition to these programs, major initiatives such as the HighlandsWater Protection and Planning Act, Surface Water Quality Standards and Category One Designation, andStormwater Management Rules have recently been accomplished. Despite this success, the DEPrecognizes the ongoing importance of using new information such as that from the source waterassessments to evaluate the need for additional protection measures of drinking water sources. The DEP iscurrently reviewing the source water assessments to identify any necessary additional source waterprotection measures.

3
2. Public education of SWAP information. DEP incorporated public education throughout the development and implementation of the Source WaterAssessment Program. During the source water assessment process, DEP met with interested parties,beginning with the development of the SWAP Plan, published articles, wrote two newsletters, anddeveloped a SWAP web site. The SWAP web site contains information on the program, technicalresources, frequently asked questions, source water assessment results, and links to additional sites ofinterest. Upon completion of the source water assessments, DEP generated a source water assessmentreport for each public water system to report the susceptibility ratings of public drinking water sources topotential contamination.
The goal of the public education efforts is to raise public awareness of the source of their drinking waterand the potential contaminants that could impair the water's quality. To continue fulfilling the educationgoal, DEP will conduct training sessions following the release of the Source Water Assessment Reports.
3. Establish a customized monitoring schedule for each public water system. The source water assessments will assist DEP in improving current monitoring requirements forindividual public water systems. Currently, the Environmental Protection Agency (EPA) and the DEPhave mandatory monitoring schedules that depend on a variety of factors that can include the source ofthe water (ground water or surface water) and the surrounding land use. These schedules may becustomized based on the susceptibility of the sources of drinking water.
Where does drinking water come from?There are two basic sources of drinking water: ground water and surface water.
Ground water is water found beneath the Earth’s surface. Ground water comes from rain and snowseeping into rock and soil. Ground water is stored in underground areas called aquifers. Aquifers supplywells and springs. Wells in New Jersey range from about 15 feet to 2,000 feet deep.
Surface water is the water naturally open to the atmosphere, such as rivers, lakes, streams and reservoirs.Precipitation that does not infiltrate the ground or evaporate into the sky runs off into surface waterbodies.
Ground water can seep into a stream, river or other surface water body, recharging surface water bodies.Likewise, under some circumstances, surface water can seep into an adjacent aquifer.
A water system obtains its water from 1) wells drilled into the ground that pump out ground water; 2)devices called surface water intakes placed on a river, stream, or reservoir; or 3) both.
What factors may affect the quality of your drinking water source?A variety of conditions and activities may affect the quality of drinking water source. These includegeology (rock and soil types); depth of a well or location of a surface water intake; how the landsurrounding the source is used (for industry, agriculture or development); the use of pesticides andfertilizers; and the presence of contaminated sites, leaking underground storage tanks, and landfills.Please refer to pages 6 and 7 of this report for specific potential contaminant source information.

4
What steps are being taken now to ensure my drinking water quality?The DEP has numerous programs in place to maintain and protect the quality of our State's waterresources. For example, the Safe Drinking Water Program is designed to ensure that water delivered forhuman consumption meets DEP's stringent health-based drinking water standards. Additionally, DEP haspermitting, waste management, and clean up programs in place to avoid and control potentialcontamination. Key DEP drinking water protection initiatives will be phased-in over time in source waterassessment areas to advance existing program protections.
What can you and others do to help?While government at the state and local levels can do their part, there are actions you and your neighborscan take now to help protect our precious and shared natural resource.
Here’s just a few ways you and others can help ensure clean and plentiful water for New Jersey – now andin the future. Join us today for a clean water future. Dispose of waste properly. Some materials such as motor oil, paint, flea collars, and household
cleaners have the potential to contaminate source water. Contact your local Department of PublicWorks for proper household hazardous waste disposal.
Limit your use of fertilizer, pesticides, and herbicides.
Here are some actions that municipal and county officials/local and county planners can take and you canhelp encourage and support. Manage and work with owners of existing potential contaminant sources to minimize potential
contamination. Establish regulations prohibiting or restricting certain activities or land uses within the source water
assessment area. Take appropriate enforcement action when necessary. Update municipal master plans to ensure greater protection. Purchase lands or create conservation easements within the source water assessment area.
Illustration courtesy of USGS

5
Specific Source Water Assessment Information for Carton Et Als LegalOffices
Carton Et Als Legal Offices (PWID 1336316) at 4001 Rt 66 East Bound, Tinton Falls, NJ, is a publicnoncommunity water system that serves approximately 45 people (in 2003). Carton Et Als Legal Officesconsists of 1 active well(s) and 0 surface water intake(s).
Susceptibility RatingsTable 1 below illustrates the percentage of noncommunity water system sources in New Jersey that ratedhigh, medium, and low for each of the eight contaminant categories. This table is separated by sourcetype: ground water and surface water. Table 2 illustrates the susceptibility ratings for each source inyour system to each of the contaminant categories.
For the purpose of the Source Water Assessment Program, radionuclides were considered more of aground water concern than a surface water issue. As a result, surface water intakes’ susceptibility toradionuclides was not determined and they all received a low rating. DEP considered all surface waterhighly susceptible to pathogens; therefore all intakes received a high rating for the pathogen category.
Table 1: Summary of Statewide Susceptibility Ratings for Noncommunity Water System Sources (Percent)
Path
ogen
s
Nut
rient
s
Pest
icid
es
VOC
s
Inor
gani
cs
Rad
ionu
clid
es
Rad
on
Dis
infe
ctio
nB
ypro
duct
Prec
urso
rs
Ground Water3480 Total Wells
High 2 0 0 32 19 69 17 3Medium 18 66 66 0 42 28 72 97
Low 80 34 34 68 39 3 11 0Surface Water3 Total Intakes
High 100 33 0 0 100 0 0 100Medium 0 67 67 33 0 0 0 0
Low 0 0 33 67 0 100 100 0
Statewide, 85 percent of the noncommunity water system sources (ground water and surface water) ratedhigh for at least one of the contaminant categories.
For surface water, the three contaminant categories in which all of the noncommunity water systemsurface water intakes (three total) received a high susceptibility rating were inorganics, disinfectionbyproduct precursors, and pathogens (all assumed to be highly susceptible to pathogens).
For ground water, the three contaminant categories in which the highest percentage of sources received ahigh susceptibility rating are radionuclides (69%), volatile organic compounds (32%), and inorganics(19%).
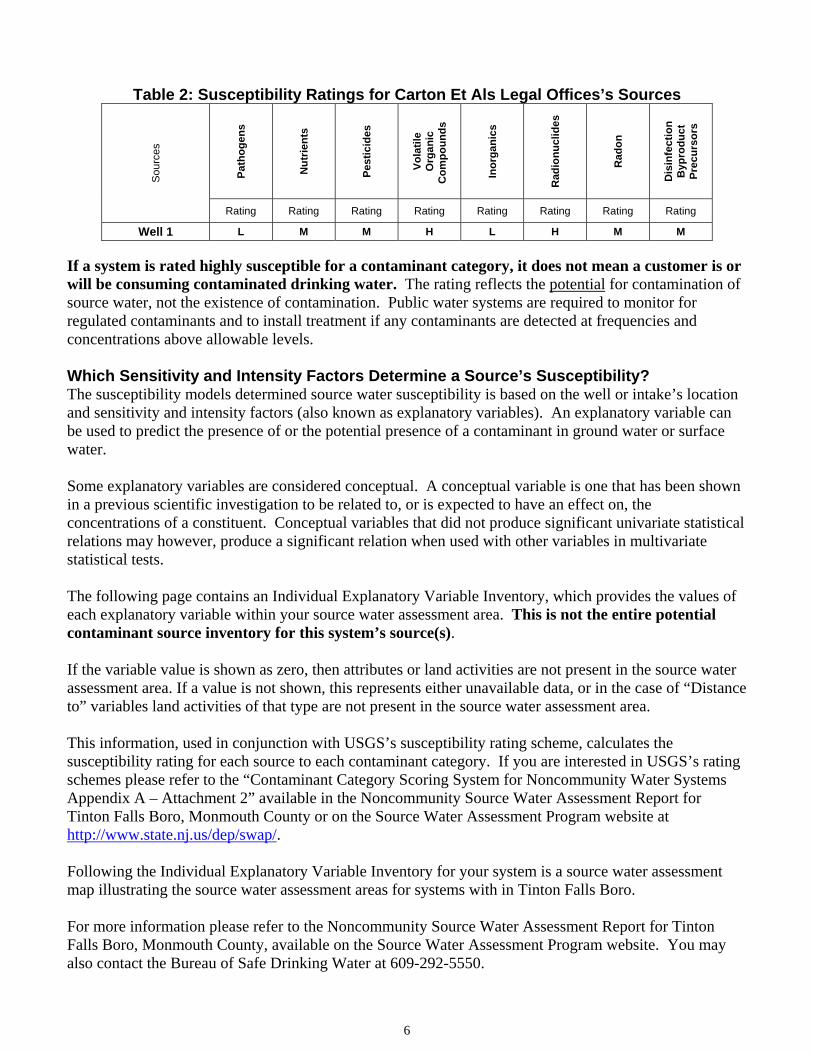
6
Table 2: Susceptibility Ratings for Carton Et Als Legal Offices’s Sources
Path
ogen
s
Nut
rient
s
Pest
icid
es
Vola
tile
Org
anic
Com
poun
ds
Inor
gani
cs
Rad
ionu
clid
es
Rad
on
Dis
infe
ctio
nB
ypro
duct
Prec
urso
rs
Sou
rces
Rating Rating Rating Rating Rating Rating Rating Rating
Well 1 L M M H L H M M
If a system is rated highly susceptible for a contaminant category, it does not mean a customer is orwill be consuming contaminated drinking water. The rating reflects the potential for contamination ofsource water, not the existence of contamination. Public water systems are required to monitor forregulated contaminants and to install treatment if any contaminants are detected at frequencies andconcentrations above allowable levels.
Which Sensitivity and Intensity Factors Determine a Source’s Susceptibility?The susceptibility models determined source water susceptibility is based on the well or intake’s locationand sensitivity and intensity factors (also known as explanatory variables). An explanatory variable canbe used to predict the presence of or the potential presence of a contaminant in ground water or surfacewater.
Some explanatory variables are considered conceptual. A conceptual variable is one that has been shownin a previous scientific investigation to be related to, or is expected to have an effect on, theconcentrations of a constituent. Conceptual variables that did not produce significant univariate statisticalrelations may however, produce a significant relation when used with other variables in multivariatestatistical tests.
The following page contains an Individual Explanatory Variable Inventory, which provides the values ofeach explanatory variable within your source water assessment area. This is not the entire potentialcontaminant source inventory for this system’s source(s).
If the variable value is shown as zero, then attributes or land activities are not present in the source waterassessment area. If a value is not shown, this represents either unavailable data, or in the case of “Distanceto” variables land activities of that type are not present in the source water assessment area.
This information, used in conjunction with USGS’s susceptibility rating scheme, calculates thesusceptibility rating for each source to each contaminant category. If you are interested in USGS’s ratingschemes please refer to the “Contaminant Category Scoring System for Noncommunity Water SystemsAppendix A – Attachment 2” available in the Noncommunity Source Water Assessment Report forTinton Falls Boro, Monmouth County or on the Source Water Assessment Program website athttp://www.state.nj.us/dep/swap/.
Following the Individual Explanatory Variable Inventory for your system is a source water assessmentmap illustrating the source water assessment areas for systems with in Tinton Falls Boro.
For more information please refer to the Noncommunity Source Water Assessment Report for TintonFalls Boro, Monmouth County, available on the Source Water Assessment Program website. You mayalso contact the Bureau of Safe Drinking Water at 609-292-5550.

Individual Explanatory Variable Groundwater Susceptibility ModelsSource: Well 1 Status: P Source Type: G
Sensitivity Variable Inventory Intensity Variable InventoryPathogens Explanatory Variables - Source Rating = L
Conceptual-Soil Available Water Capacity 0.09 Distance to Agricultural Land Use, 1995 60.5
Depth to Top of Open Interval Conceptual Septic Tank Density 37.3
Conceptual - GWUDI Conceptual – Presence of Streams, Tier 1 0
Nutrients Explanatory Variables – Source Rating = M Conceptual – Depth to Top of Open Interval % Urban Land Use, 1995 32.57Conceptual – Length of Open Interval % Agricultural Land Use, 1986 45.75
Pesticides Explanatory Variables – Source Rating = MConceptual – Depth to Top of Open Interval % Urban Land Use, 1995 32.57Conceptual – Length of Open Interval % Agricultural Land Use, 1986 45.75
Distance to Agricultural Land Use, 1995 60.5Conceptual – Distance to golf course
VOCs Explanatory Variables – Source Rating = H% Soil Organic Matter 1.06 % Impervious Surface, 1995 23.7
% Commercial/Industrial Land Use, 1995 32.57Sq. Mi. of Urban Land Use, 1995 0Density of SWL, USTs, and KCSL 82.5
Inorganics Explanatory Variables – Source Rating = L
Dissolved Oxygen of water-quality sample
Density of KCSL, SWL, NJPDESGW/SW/Storm, Compost Facilities,SWRRF, SWTF200011, Class BRecycling, DPCC, UST
82.5
pH of water-quality sample Distance to Agricultural Land Use, 1995 60.5Depth to Top of Open Interval 180 Population Density, Tier 1 300.7% Soil Clay 10.46 % Barren Land Use, 1995 0Soil Hydraulic Conductivity 69.11 % Urban Land Use, 1970 2.5Conceptual % Soil Organic Matter 1.06 Distance to STPPhysiographic Province COASTAL
PLAIN STP Density 0
Distance to DOT roadsLength of railroads 0Population Density 300.7
Radionuclides Explanatory Variables – Source Rating = HpH of water-quality sample % Urban Land Use, Tier 1, 1995 77.7
Physiographic Province COASTALPLAIN
Conceptual Distance to Agricultural LandUse, 1995 60.5
Conceptual Depth of Well 180 % Developed Land, Tier 1, 1995 100Conceptual Soil Hydraulic Conductivity 69.11 % Agricultural Land Use, 1970 97.5
Radon Explanatory Variables – Source Rating = MConceptual % Soil Clay 10.46 % Agricultural Land Use, 1995 45.75
Physiographic Province COASTALPLAIN
Conceptual Distance to Wetlands LandUse, 1995 174.94
Depth to Top of Open Interval 180DBPs Explanatory Variables – Source Rating = M
Conceptual – % Soil Organic Matter 1.06 Conceptual – Sq. Mi. of Wetlands LandUse, 1995 0
Conceptual NJGS Hydrologic Unit (aquifer)Number of NJPDES SW/GW/Storm,Compost, SWWRF, SWTF200011, ClassB Recycling, and DPCC
0
pH of water-quality sample