TIN ETHOXIDE AND RELATED COMPOUNDS
126
INIS-SD--161 SD0100019 TIN ETHOXIDE AND RELATED COMPOUNDS A DISSERTATION TO FULIFIL THE REQUIREMENTS OF MASTER DEGREE OF SCIENCE(M.Sc) Submitted By: AZZA IZZELDIN MOHAMED OMER Supervisor : Prof. AHMED KHIDIR YAGOUB Co-Supervisor: Dr. OMER YO&IF OMER UNIVERSITY OF KHARTOUM FACULTY OF EDUCATION DEPARTMENT OF CHEMISTRY JUNE 2000
Transcript of TIN ETHOXIDE AND RELATED COMPOUNDS

INIS-SD--161
SD0100019
TIN ETHOXIDE AND RELATEDCOMPOUNDS
A DISSERTATION TO FULIFIL THEREQUIREMENTS OF MASTER DEGREE OF
SCIENCE(M.Sc)
Submitted By: AZZA IZZELDIN MOHAMEDOMER
Supervisor : Prof. AHMED KHIDIR YAGOUBCo-Supervisor: Dr. OMER YO&IF OMER
UNIVERSITY OF KHARTOUMFACULTY OF EDUCATION
DEPARTMENT OF CHEMISTRY
JUNE 2000

Content:Section One
Historical
Chapter OneSome Aspects of Tin Chemistry
Introduction :
(1-1) Elemental Tin.(1-2)Bonds Forming.(1-3) The Nature of (Sn-O)Bond .(1-4) Synthesis of Tin Alkoxides.(l-4-l)The Direct Route.(l-4-2)The Reaction between Tetrachlorosilane and Alcohol.(l-4-3)The Reaction between Tintetrachloide and Sodium
Ethoxide.(l-4-4)Other Methods.(1-5) Double Alkoxides of Tin.(1-6) Uses of Metal Alkoxides .
Chapter Two
Some Selected Physical & ChemicalProperties of Tin Alkoxides .
(2-1) Physical Properties of Tin Alkoxides .(2-2) Infra-Red Spectrum of Tin Alkoxides .(2-3)Gas-Liquid Chromatography of Alkoxides .(2-4)Some Selected Chemical Properties of Tin
Alkoxides.(2-4-1) Hydrolysis Reaction.
(2-4-2) Reaction with Halogens, HydrogenHalides & Acyl Halides .
(2-4-3) Reaction with Alcohols .
Section Two
Experimental
Chapter Three
Experimental
(3) Experimental.(3-1) General Techniques & Procedures .(3-1-1) Infra-Red Spectrum.(3-l-2)Gas-Liquid Chromatography.(3-2) Starting Materials.(3-2-l)Ethanol.(3-2-2)Tin Foil.(3-2-3)Tin Tetra Chloride.(3-2-4)Sodium Metal.(3-2-5)Mercury(I) Chloride.(3-3)Reaction Procedure & Apparatus .(3-3-1 )The Reaction between Tin Foil & Dry Ethanol Using
Mercury(I) Chloride Catalyst.(3-3-2)The Reaction between Anhydrous Stannic Chloride with
Dry Ethanol.
(3-3-3)The Reaction between Sodium Ethoxide and StannicChloride in presence of Ethanol.
(3-3-3-1) The Reaction between Sodium Metal & Ethanol.(3-3-3-2) The Reaction between Sodium Ethoxide and Stannic
Chloride in presence of Ethanol.

Chapter Four
Results & Calculations
(4) Results.(4-l)Results of IR & GLC Analysis .(4-2)Results of IR & GLC Analysis .(4-3)Results of IR & GLC Analysis .(4-4) Results of Solubility.(4-5) Results of Melting Points .(4-6) Form of Products .(4-7)Summary & Calculations of Reaction (3.3.1)(4-8)Summary & Calculations of Reaction (3.3.2)(4-9)Summary & Calculations of Reaction (3.3.3)
Section Three
Discussion
Chapter Five
Discussion
(5) Discussion.(5-1) The Reaction between Tin Foil & Dry Ethanol Using
Mercury© Chloride Catalyst.(5-2)The Reaction between Anhydrous Stannic Chloride with
Dry Ethanol.(5-3)The Reaction between Sodium Ethoxide and Stannic
Chloride in presence of Ethanol.(5-4)Comparison between Tin Ethoxides Produced by the Three
Different Methods.
Conclusion.References.

Abstract
This study aimed to prepare Tin Ethoxide by
different metho&and to notice the effect of some
variable parameters on the growth of the product.
These reactions were carried out and the
products were analyzed. Infra-Red (IR) spectrum
showed the existence of (Sn-O) bond .GAS-Liquid
Chromatography results confirmed the IR analysis
and showed that tin (II) ethoxide was formed andi
the main product was a dimer of tin ethoxide .
The variable temperature, time and speed of
stirring affected the amount of the product
SECTION ONE
HISTORICAL

CHAPTER ONE
SOME ASPECTS OF TIN CHEMISTRY

INTRODUCTION
Section One, the Historical , includes twochapters. iChapter one explores some information about tin element,physical and chemical properties, the bonds form by tin, thenature of tin-oxygen bond, methods of preparation of tinalkoxides, the double alkoxides of tin and some uses of metalalkoxides.Chapter two takes the physical properties of tin alkoxidesincluding the methods of analysis, Infra red and Gas LiquidChromatography. Also some selected chemical properties wereconsidered.

l.L Elemental Tin:
Tin , symbol Sn, as a member of group (IV) of the PeriodicTable and a member of sub-group containing germenium and lead,has atomic number 50, atomic weight 118.7, A [Kr] 4d10 5S25P2(9)
electronic configuration and exhibits valence numbers of 2 and 4.Tin exists in three allotropic modifications with the transitiontemperature(33).
S n }32l S n \ 6 l \ S n 3g1 8V Liquid(Gray tin) (White tin) (Rhombic tin)
The relative percentage of tin in the earth's crust (0.004) which isvery small comparing with the list of the commonly used metals.In seawater it is found at concentration of 0.003g/ton(5). Tin showslower melting point (Table 1.1.1) that indicates it does not use allfour outer electrons for metallic bonding(10). Tin can be considereda truly chemical metal while it is mechanically a weak metal forconstructional uses. Its non-toxicity and relative freedom fromcorrosion by weak acids, alkalis and other electrolytes make ituseful in handling foods and in other exacting application(5). Thereare several reports of the occurrence of metallic tin in nature inBohemia, Bolivia, New south Wales and Nigeria. Tinstone orcassiterite is the source of commercial tin, which is knownchemically as stannic oxide, SnC>2. The extraction of tin fromtinstone involves reduction of the ore by heating it with coke orcoal and lime stone in either a reverbetatory furnace or a smallblast furnace. The oxide is reduced(39) : l
(y\ Sn2O + 2C = 2COJ+ Snk
The molten tin collected on the bottom of the furnace(47).Tin is not attacked either by water or air at ordinary temperatures,separately or together so it is used as a protective covering. It takesfire when heated in air to between 1500° and 1600°C burning witha white flame to stannic oxide. It combines directly with chlorineforming stannic chloride.

It reacts slowly with dilute hydrochloric acid and fairly rapidlywith the concentrated acid forming solutions of stannous chloride.
Sn + 2HC1 • SnCl2 + H2 ti .
Tin is slowly attacked by cold sulphuric acid, but the hotconcentrated acid attacks the metal forming stannic sulfate andsulphur dioxide(39). ;
Sn + 4H2SO4 •Sn(SO4)2 + 2SO2t+ 4H2O
Boiling concentrated alkali hydroxide solution slowly attacktin forming solutions of stannates e.g.(39).
Sn + 2K0H + H2O • K2Sn03 + 2H2t
Tin is used in making useful alloys like solder andbronze.(47)
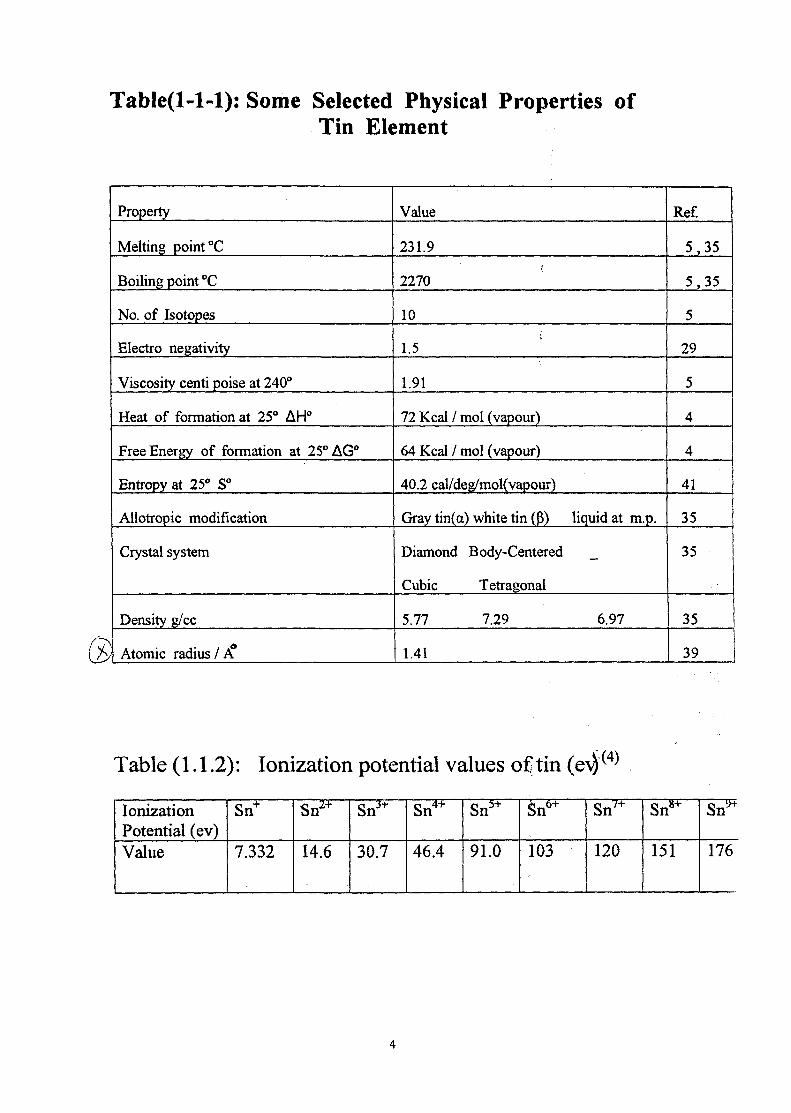
Table(l-l-l): Some Selected Physical Properties ofTin Element
Property
Melting point °C
Boiling point °C
No. of Isotopes
Electro negativity
Viscosity centi poise at 240°
Heat of formation at 25° AH°
Free Energy of formation at 25° AG°
Entropy at 25° S°
Allotropic modification
Crystal system
Density g/cc
Atomic radius / A
Value
231.9
2270
10
1.5
1.91
72 Kcal / mol (vapour)
64 Kcal / mol (vapour)
40.2 cal/deg/mol(vapour)
Gray tin(a) white tin (P) liquid at m.p.
Diamond Body-Centered _
Cubic Tetragonal
5.77 7.29 6.97
1.41
Ref.
5,35
5,35
5
29
5
4
4
41
35
35
35
39
Table (1.1.2): Ionization potential values ofj tin (evj ^
IonizationPotential (ev)Value
Sn+
7.332
Sn2+
14.6
SnJ+
30.7
Sn4+
46.4
Sn i +
91.0
Sn0+
103
Sn ; +
120
SnH+
151
Sny+
176

1.2. Bonds Forming :
Tin has an electronic configuration as [Kr] 4dlo5s25p2. Tin has4d orbital filled with ten electrons because it comes after a seriesof transition element this gives it big size atom (Table 1.1.1.).
5s, 5p orbitals have two electrons each : Because tin atom hasa formally vacant p orbital as well as a lone pair of electrons thereis the possibility that it may accept or donate electrons when reactswith other species.
According to electronegativity value of tin (1.5 on Pauling'sscale) compared with that of silicon (1.8 on Pauling's scale), tinsuggested to be a true metal(29). Tin differ(8) from Si and Ge, it canform ionic bonding by donating the electrons of 5p-orbital and 5S-orbital. In addition to that in rare times it can donate one or twoelectrons from 4d-orbital. Tin ionizes in aqueous solution and
gives cationic species e.g. SnCl+, SnCk, SnCk and SnCU (solublein H2O). Tin can accept electrons to form complex anion such as
SnCl6~(35). 'Like carbon and silicon tin has the ability to form covalent
bonds. Quadrivalent organotin often present the, tetrahedral sp3
hybridization(9). e.g.
Me Me
Me Me
The vacant 5d-orbital, gives tin the ability to form the partialTc-bond with groups that have extra pairs of electrons unshared ina-bonding. The monomeric nature of silicon and germaniumalkoxides in contrast to analogous tin derivatives may be ascribedto stronger Pn - dn bonding in the former whibh diminishes ingermanium and appear to be insignificant in case of tinalkoxides(7)

Tin can form bridged structures, involving five coordinate ofmany compounds (R3SnX)(11).
Where : R = alkyl group X = halide.
Some tin alkoxides are polymeric with bridged alkoxygroups(4), when tin bears more electronegative substituents, itsLewis acidity increasing and coordination with d-electron richsites lead to sp3d or sp2d2 hybridization(9). There exist compoundsin which more than nine tin atoms may be linked together in theform of branches or rings(11).
Table (1.2.): Selected Values of Electronegativity ofElements According to Pauling's Scale
H(2.1)C(2.5)Si(1.8)Ge(1.8)Sn(1.5)
0(3.5) F(4.0)Cl(3.0)Br(2.3)1(2.5)

1.3. The Nature of (Sn-O) bond:
Tin-oxygen bonds could be expected to have around 65%ionic character because of the low electro-negativity of tin(7)
(Table 1.1.1).Like Si, the tetra-covalent (Sn-O) bonds in organo-tin
alkoxides is caused by a-bond and hybridized 5s and 5p orbitals oftin atom with 2p-orbital of oxygen. The interaction of unshared p-electrons of oxygen with 5d-orbital of tin has been termed by (Pn -djr) situation.
Vacant Sn 5dxz filled oxygen 2p% (d* - P*) multipleorbital orbital bond
Fig. (1.3) (dn - PTT) situation in SnO
The length of (Sn - O) is determined by IR srJectrum(4) and isfound to be equal 183.7 Pm(2). The calculated value of bond lengthfor (Sn - O) is equal (207 Pm) by adding atomic radii of Sn (141Pm) and that of oxygen (66 Pm)(34). This difference (23.3 Pm) isdue to the existence of (dn - P*) interaction. -to
The heat(20) of formation of (Sn - O)s is equal7-285.8 KJmol"1,the expected heat of formation of (SnO2)s is equal -571.6 KJmol"1
but it was found equal to -580.7, the difference is due to existenceof(d7t-P^)bond.
Tin also forms coordination covalent bonds with oxygen inorganotin alkoxidecompounds. The strength{1) of tin-oxygencoordinate bond was estimated as 4.5 Kcal/mol at severaltemperatures(l). This bond is reactive and easily broken.

1.4. Synthesis ofTinAlkoxides:
1.4.1. The Direct Route :
Metal alkoxides was prepared by the direct reaction of metaland alcohol as :
M + nROH • M(OR)n + n/2H2
Where : M = metal, n : Number of moles (oxidation No. of M) R =alkyl group.
Group(rv) elements which have more electronegative need acatalyst and high temperature to rea.cfc . i Thereaction of silicon was studied with several alcohols. The reactionof silicon with methanol gives (40 - 45%) yield and with ethanolgives only (10%) yield(40) using the following route
4CH3OH + Si Cu(250 - 300°C) Si(OC2H5)4 + 2H2 tufh&t us i0 the catalyst > CuzCl^solvated in alkyl benzene,
the methoxide . produced was in a high yield (85%)(34) .Thelower primary alcohols give small yields while secondary andtertiary alcohols did not react.
Like silicon, the reaction between tin metal and alcohol wascarried out in the presence of Hg2Cl2 as a catalyst and(250° -300°C temperature. Catalysts like iodine, mercuric chloride,mercuric iodide etc.. can be used in this type of reaction. The roleof the catalyst may be involved cleaning the metal surface or theformation of intermediate derivatives like chloride1 or iodide whichcould react more readily with alcohol(7).
This type of synthesis takes long time to give small yield ofthe product and the final product has very high purity.

1.4,2. The Reaction between Tetrachlorosilane and Alcohol:
The starting materials are metal tetrachloride and alcohol.This reaction can occur directly without using a catalyst. Theinitial step must be the solvation of metal tetrachloride in alcohol.Tin reacts like silicon. The solvolysis of the chloride appear tooccur completely with the replacement of the halogens by alkoxygroups: t
SiCl4 + 4C2H5OH • Si(OC2H5)4 + HCl
The mechanism of the reaction was proposed by Sidgwickfor Si that the reaction might occur through initial coordination ofthe alcohol followed by elimination of hydrogen chloride(7).
R Cl Cl !~H ~~CPt Cl
\ / \ \ /-> Si (-HC1) O — » Si
/ \ * / / \IH Cli Cl R RO Cl
RO Cl RO Q
(-HCD Si and so on . Si
y x / \RO Cl RO OR
Alcohols react readily with hydrogen halides to yield alkylhalides and water. The higji temperature catalyzed the reaction(45).In the above reaction HCl by-product contaminates the mainproduct by reacting with ethanol forming water. The product issensitive to moisture. A base like pyridine was used in this type ofreaction to neutralize HCl and give C5H5N.HCI adduct. Bradleyattempted to prepare tin alkoxides by the ammonia method(28), thisgive impure products contaminated with some chloride and

nitrogen contents. Maire(7) doubtful in view with Bradley andMehrotra in final product to be contaminated with impurities, heprepared Sn(OC2H5)4 pure compound by the ammonia method.The reaction with primary and secondary alcohols yields the tetra-alkoxide directly, the reaction with tertiary alcohols appears toyield a mixture of the hydroxide and tetra-alkyl chloride.
1.4.3. The Reaction between Tin Tetrachloride and SodiumEthoxide
The synthesis of Sn(OEt)4.2EtOH employing the reaction oftin tetrachloride with sodium ethoxide in the presence of excessethanol has been reported(7).The reaction involving the use ofmetal chloride and sodium alkoxide did not yield pure tetra-alkoxides of tin and zirconium(41).The reaction of tin tetrachloridewith sodium ethoxide in 1 : 4.5 ratio was reported(7) to give acomplex [Sn(OEt)6]H2.
Bradley(28) attempted to prepare tin tetra-alkoxides by thereaction of tin chloride with sodium alkoxides but the resultantproduct was a double salt of sodium and tin :
2SnCl4 + 9NaOC2H5 • NaSn2(OC2H5)9 + 8NaCl
This double alkoxide reacts with hydrogen chloride oralcoholate of tin trichloride mono-ethoxide yield tin tetra-ethoxideas follows: i
NaSn2(OC2H5)9 + HC1 •2Sn(OC2H5)4 + NaCl +C2H5OH
Or . . « .
3NaSn2(OC2H5)9 + SnCl3(OC2H5).C2H5OH
• 7Sn(OC2H5)4 + 3NaCl + C2H5OH
The tin tetra-ethoxide obtained was still impure because ofthe nonvolatile nature of the product which could not be made free
10

from the small amount of sodium chloride contaminated with it.Davies reported(7) his unsuccessful attempts to synthesize butyl tintri-alkoxides by the reactions of butyl tin trichloride with sodiumalkoxides. He observed only partial replacement of chlorine inbutyl tin chloride with sodium methoxide which finally yielddichloride mono-methoxide.
BuSnCl3 + NaOMe • BuSnCl2 (OMe) + NaCl
The reaction did not appear to proceed beyond thereplacement of one chlorine from butyl tin trichloride.
Gaur(7) observed the complete replacement of chlorines inethyl tin|butyttin trichlorides with primary, secondary and tertiaryalcohols quite smoothly and a number of tri-alkoxides weresuccessfully obtained:
RSnCl3 + 3NaORf • RSn(OR')3 +3NaCl
The reaction of tin chloride with sodium alkoxide issuccessfully for the synthesis of alkoxides derivatives in thepresence of excess of alcohol.
I1.4.4. Other Methods;
The alkoxides can also be prepared from the metal oxide orhydroxide with alcohol. This method yields water whichhydrolysis the product easily. So this kind of reactionaccomplished using organic solvents (e.g. benzene) which formazeotrops with water to fractionate it from the product. Thismethod gives good yield.Reaction of a dialkyl tin oxide with an alcohol or phenol inbenzene or toluene(41> 43) yielded not the expected dialkoxides, butinstead the tetra alkyl dialkoxy distannoxane was formed :
(R3Sn) 2O + 2ROH > 2R3SnOR + H2O
2R SnO + 2R0H — > R2(RO) SnOSn(OR)Ri + H2O2.
11

The dialkyl distannoxane on being heated in vaccuo yieldedthe volatile diakyl tin dialkoxide and a residue of diakyl tin oxide.
R2(RO)SnOSn(OR)R2 -> R2Sn(OR)2 + R2SnQ
Attempts to prepare monoalkyl tin alkoxides from its oxide,Gaur(7) observed that ethanol and isopropanol did not show anyreactivity towards it but with n-butanol the monobutoxy derivativewas formed and characterized asBu Sn (O)(OC4H9
n):
Bu Sn O3/2 + C4H9OH __* Bu Sn (O)(OC4H9n) + lA H2O
Another method is the reaction of alkoxides with alcohol, termedas alcoholysis or alcohol interchange reactions used foralkoxyderivatives. The facility for interchange of alkoxy group increasesfrom tertiary to secondary to primary groups J Bradley(7) thusprepared a number of primary, secondary and tertiary alkoxides bythe alcoholysis reactions of tin tetra isoproxide isopropanolatewith various alcohols in the presence of benzene.
SnCOPr1^ PrpH + 4R0H —•SnCOR^ + SPi^OH.
The tetra-alkoxides oftin(7) are best produced by an alcoholexchange reaction. The mechanism of this type of reaction ispostulated(7), which indicates that the Sn-0 bond is broken asshown below:
R H8+
8-
O
C2H5O OC2H5
V 7Sn
12

Alkyl tin trialkoxides have been more recently synthesized againby the reaction of alkyl tin trisdiethyl amide with alcohols.Thomas(7) utilized this method for preparation of Sn(OPri)4. Pi OHfrom Sn(NMe2V The alcohol and the dialkyl amine formed in thereaction mixture was fractionated out with a hydrocarbon solventor with alcohol itself.
Loberth and Kula(7) carried out the alcoholysis reactions ofalkyl tin tris (diakyl amide) for the preparation of number of alkyltin trialkoxides.
Gaur(7) prepared mono-alkyl tin chloride alkoxides by thereaction of alkyl tin chloride with the corresponding alkyl tin tri-isopropoxide in different stoichmetric ratios :
2RSnCl3 +
RSnCl3 + 2RSn(OPri)3
Dialkyl tin monochloride monomethoxide have also beenprepared by the reaction of dialkyl tin dichloride and thecorresponding dialkyl tin dimethoxide(7):
R2SnCl2 + R2Sn(OMe)2 • 2R2Sn(OMe)Cl
Alkyl tin alkoxides are prepared from the correspondingalkyl tin hydride and alcohol in the presence of zinc chloridecatalyst.
13

1.5. Double Alkoxides of Tin :
Double metal alkoxides are believed to be prepared by thefollowing(7) :-
(1) Reaction of alkali alkoxides with another metal alkoxides:
U(OEt)5 + NaOEt ^NaU(OEt)6
(2) Reaction of metal halides with potassium, sodium or aluminum
wo-propoxides:
2SnCl4 + 9Na(OPri) • NaSn2(OPri)9 +8NaCl
(3) alcoholysis reactions :
M(OR)n +R3"SiOH ^==±M(OSiR3")n.x(OR)n+xROH
The double alkoxides of alkali metal and tin MSn(OPr1)9(M =Li, Na) are non volatile and appear to disproportionate in thefollowing manner on being heated under reduced pressure(7).
heat SnCOPA + MOPr1
MS^OPr1) heat fc 2Sn(OPri)4 + MOPr1
However, these derivatives have been purified bycrystallization from fro-propanol.
Table 1.5. Physical Properties of Some Ethoxides and
Double Ethoxide of Tin, Sodium(32)
Alkoxide
Sn(OC2H5)2
_Sn(OCH5)4
NaOC2H5
^arS^OC2H5)9]
Colour, form
White solid
White solid
White solid
White solid
m.p, °C
200(dec)
Unmeltable
260(dec)
260(dec)
b.p. °C
:
ad.
ad.
Solubility
ROH
(+)
(+)
(+)
bcryst
Org. sol.
(+)
(+)
(+)
(+)
(+): soluble, a d . : not distillable , b : may be crystallize.
14

1.6. Uses of Metal Alkoxides:
Metal alkoxides have advantages because of their catalyticproperties, ease of hydrolysis, solubility in organic solvents anddistillability.
They are mainly used as catalysts (in ziegler polymerization,trans esterification and condensations) with partial or completehydrolysis, alcoholysis or trans-esterification in coating for plastic,textile, glass and metals, and in additives for adhensives and paintsand for the cross-linking or hardening of natural and syntheticmaterials(32).
Alkoxides are valuable precursors to metal oxides throughhydrolysis, pyrolysis or combustion. High purity of metalalkoxides offer advantage, as starting materials for the preparationof high purity oxides with high surface areas with the volatilealcohol and the absence of ionic impurities(7). The hydrolysis wasvery effective for depositing oxide films on graphite and inproducing powders and fibers of ultra-high purity ceramicmaterials. High purity specialized glass films(32).
Tin alkoxides act as a source of nucleophiles, compoundscontaining (Sn-O-C) bond were usedfortrimerisationofphenylwocyanate phNCO and ethyl /socyanate EtNCO(2). Tin alkoxides
,/also used in manufacture of some insecticides.
15

CHAPTER TWO
SOME SELECTED PHYSICAL & CHEMICALPROPERTIES OF TIN ALKOXIDES
16
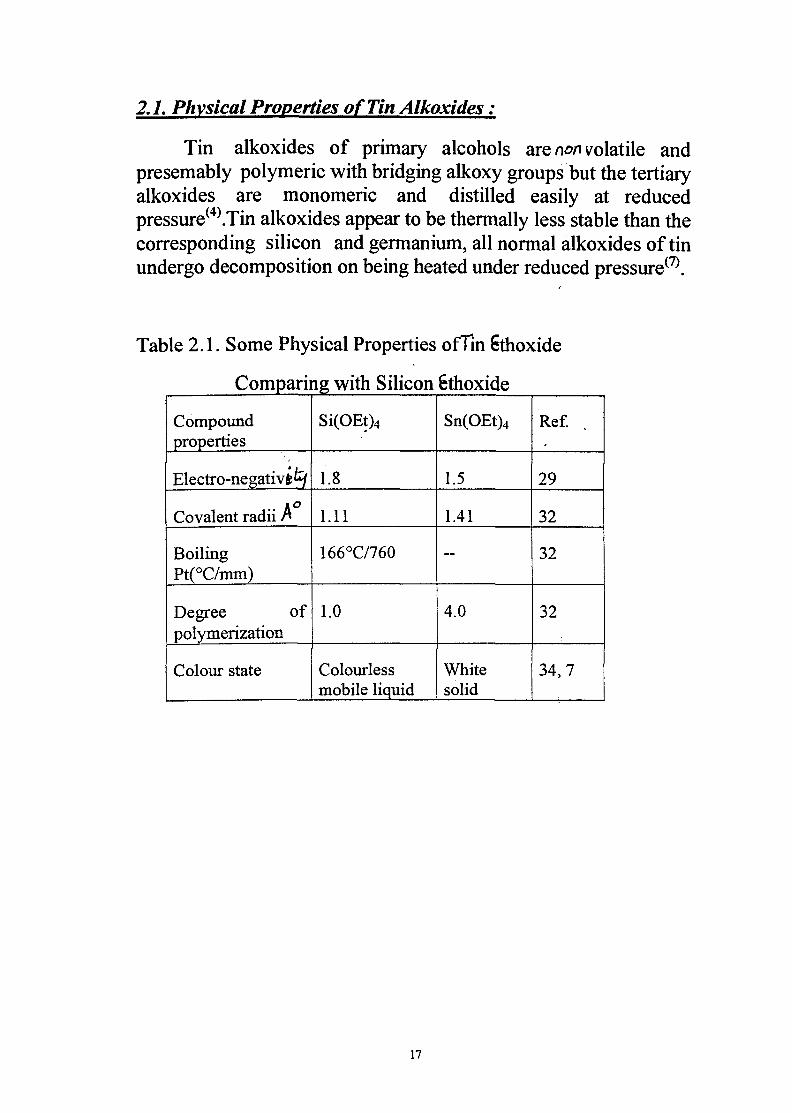
2.1. Physical Properties of Tin Alkoxides:
Tin alkoxides of primary alcohols are non volatile andpresemably polymeric with bridging alkoxy groups but the tertiaryalkoxides are monomeric and distilled easily at reducedpressure(4).Tin alkoxides appear to be thermally less stable than thecorresponding silicon and germanium, all normal alkoxides of tinundergo decomposition on being heated under reduced pressure(7).
Table 2.1. Some Physical Properties of Tin Sthoxide
Comparing with Silicon Sthoxide
Compoundproperties
Electro-negativfcfcf
Covalent radii n
BoilingPt(°C/mm)
Degree ofpolymerization
Colour state
Si(OEt)4
1.8
1.11
166°C/760
1.0
Colourlessmobile liquid
Sn(OEt)4
1.5
1.41
~
4.0
Whitesolid
Ref.
29
32
32
32
34,7
17
2.2. Infra-red Spectrum of Tin Alkoxides :
The IR region of the electromagnetic spectrum extends from0.8um (800nm) to 1000um(lnm)and subdivided into near IR(0.8-2um), middle m (2-15um) and far IR (15-1000 urn). Thefundamental regionjpetween (2 and 15 um).IR spectroscopy canbe used for both qualitative and quantitative analysis, metalalkoxides can identify by qualitative analysis only. Metalalkoxides M(0R) (R : alkyl) exhibit v(CO) at Ca. 1000 cm"1 andv(M0) at 600 - 300 cm"1(37). v(CO) for alkoxides, is in the region1200 - 950cm"1 for (CH3)2 Sn(OCH3)2
(27).Four sets of bands in the region 700 - 500 cm"1 due to
various v(Sn-C) and v(Sn-O) stretching vibrations was observed(7).The bands observed at about 700 and 670 cm"1 have been assignedto (Sn-CH2) rocking vibrations arising due to gauche and transconformations respectively. The other bands observed at about500 and 600cm"1 have been assigned to Vs and Vas (Sn-C)stretching vibrations respectively. The band observed at 500 cm-1
was assumed to be associated with (Sn-O) stretching mode alsobut there is no clear distinction between v(Sn-C) and v(Sn-O)stretching vibrations due to their coupling(7).
Gaur studied(7). alkyl tin trialkoxides supported the aboveview and also assigned the strong bands due to v(C-O)Sn in therange 1030-1070cm"1 in primary alkoxides which shift to (940 -980cm"1) in isopropoxide.
18
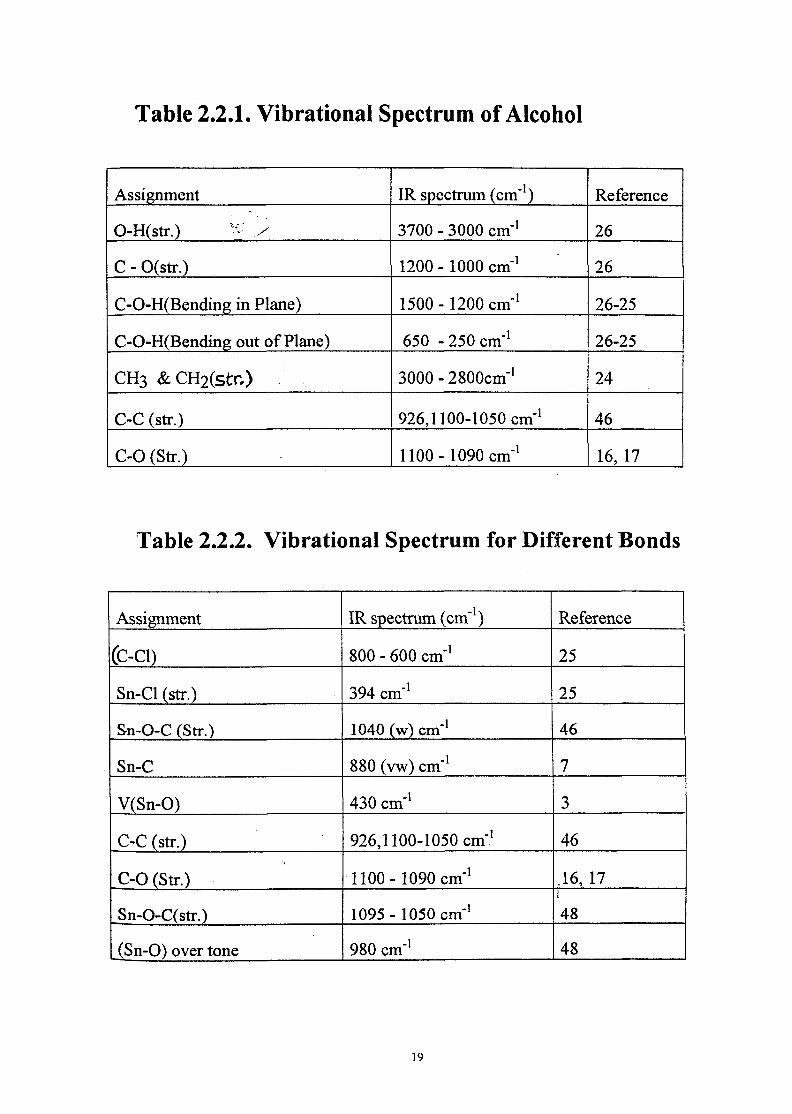
Table 2.2.1. Vibrational Spectrum of Alcohol
Assignment
O-H(str.) - . /
C - O(str.)
C-O-H(Bending in Plane)
C-O-H(Bending out of Plane)
CH3 &CH2(str.)
C-C (str.)
C-0 (Str.)
IR spectrum (cm"1)
3700 - 3000 cm"1
1200 - 1000 cm"1
1500 -1200 cm"1
650 -250 cm"1
3000-2800cm"1
926,1100-1050 cm"1
1100-1090 cm"1
Reference
26
26
26-25
26-25
24
46
16,17
Table 2.2.2. Vibrational Spectrum for Different Bonds
Assignment
(C-Cl)
Sn-Cl (str.)
Sn-O-C (Str.)
Sn-C
V(Sn-O)
C-C (str.)
C-0 (Str.)
Sn-O-C(str.)
(Sn-O) over tone
IR spectrum (cm"1)
800 - 600 cm'1
394 cm"1
1040 (w) cm"1
880 (vw) cm"1
430 cm"1
926,1100-1050 cm"1
1100-1090 cm"1
1095- 1050 cm"1
980 cm"1
Reference
25
25
46
7
3
46
,16,17
48
48
19

2.3. Gas-Liquid Chromatosraphv ofAlkoxides:
Gas liquid chromatography is used for volatile mixture requiresseparation of the components, it shows the number of componentsand the relative quantities of each. Although it is limited tovolatile materials, GLC working at temperatures up to 450°C andthis give the possibility of converting many materials into avolatile derivative extend the applicability of separation.
GLC is the most powerful technique for the rapid andconvenient analysis of the composition of mixture of organiccompounds. It is based on the partition of components between amobile gas phase and stationary liquid phase retained as a surfacelayer on a suitable solid supporting medium. There are manycolumns thatoreused for separation of alkoxides the important oneis OV17 which is 1.5 long, fitted at 140°C. Another one is (OV-101) on chromsorb W, 2 meter column(38) FID the flameionization detector the most used for organo-metal £ompounds(23)
The retention times for the separated peaks can be calculatedby measuring the distance between the starting point and themiddle of each peak. The area under each peak is relative with theconcentration of the component, it can be calculated bydetermining the height of the peak in cm and the base of the peakin cm and applied base data in the relation(39)
A = Peak height X Vz width of peak
20

2.4. Some Selected Chemical Properties of Tin Alkoxides:
1. Hydrolysis Reactions(7):
The hydrolysis of metal alkoxides readily leads to the formationof the hydroxides or hydrated oxides. When restricted amountsof water are added, these metal alkoxides undergo partialhydrolysis reactions yielding in same cases products of definitecomposition as oxide alkoxides MOn(OR)x.
The hydrolysis of tin ethoxide was carried put in acidic,basic and acid-base medium. A white gel was formedand varied in time according to the type of the medium.In acidic medium the formation of the gel was observedfirst then in acid-base medium and thirdly in basicmedium. The mechanism of the hydrolysis as follow :
(1) In presence of hydrochloric acid (H+)
(i)(EtO)n—Sn—OEt + £TO >(EtO)n— Sn—O+—Et +H2O
H
(EtO)n— Sn— O+H2+ EtOH
X (ii) (EtO)n— Sn—O+H2+H2O<->(EtO)n— Sn— OH + H+ O
(iii) (EtO)n— Sn— OH + (EtO)n— Sn— OH — •(EtO)n— Sn— O— Sn— (OEt)n + H2O
(iv)(EtO)n— Sn— OH +(EtO)n— Sn— OEt >
(EtO)n— Sn— O—Sn—(OEt)n+ EtOH
n = integer from 1-5 .
21

(2)In presence of base such as sodium hydroxide :
(i) (EtO)n— Sn— OEt + OH(-} ^ /(EtO)n— Sn—(OEt )V>
I /OH (Complex)
v(EtO)n— Sn— OH + EtO()
(ii)EtOw + H 2 O — • EtOH + OH()
n = integer from 1-5 .
2. Reactions with Halogens, Hydrogen Halides and(7)
Acyl Halides
The reactions of metal alkoxides with halogens were studied.The reaction between titanium tetra-n-butoxide, and chlorine orbromine yielded dihalide dibutoxide coordinated with one moleof alcohol as TiX2(OBu)2-BuOH and n-butyl propionate.
The tetra-alkoxides reacted with hydrogen chloride to form thetetrachloride alcoholates.
2Sn(OR)4 + 7HC1 > SnCl3(OR).ROH + SnCl4.2ROH
, + 4ROH
In contrast to the high stability of silicon tetra-alkoxidestoward hydrogen halides, the germanium and tin alkoxidesobservations are again in accordance with the earlier study inwhich it was shown that tin tetrachloride reacts with alcohols toform the above types of alcoholates. The reactions of tin tetra-alkoxides (primary and secondary) with acetyj halide yieldedmixed halide alkoxide derivatives. However, the reaction becomecomplicated in the case of the tetra-butoxids and dichtorfote
22
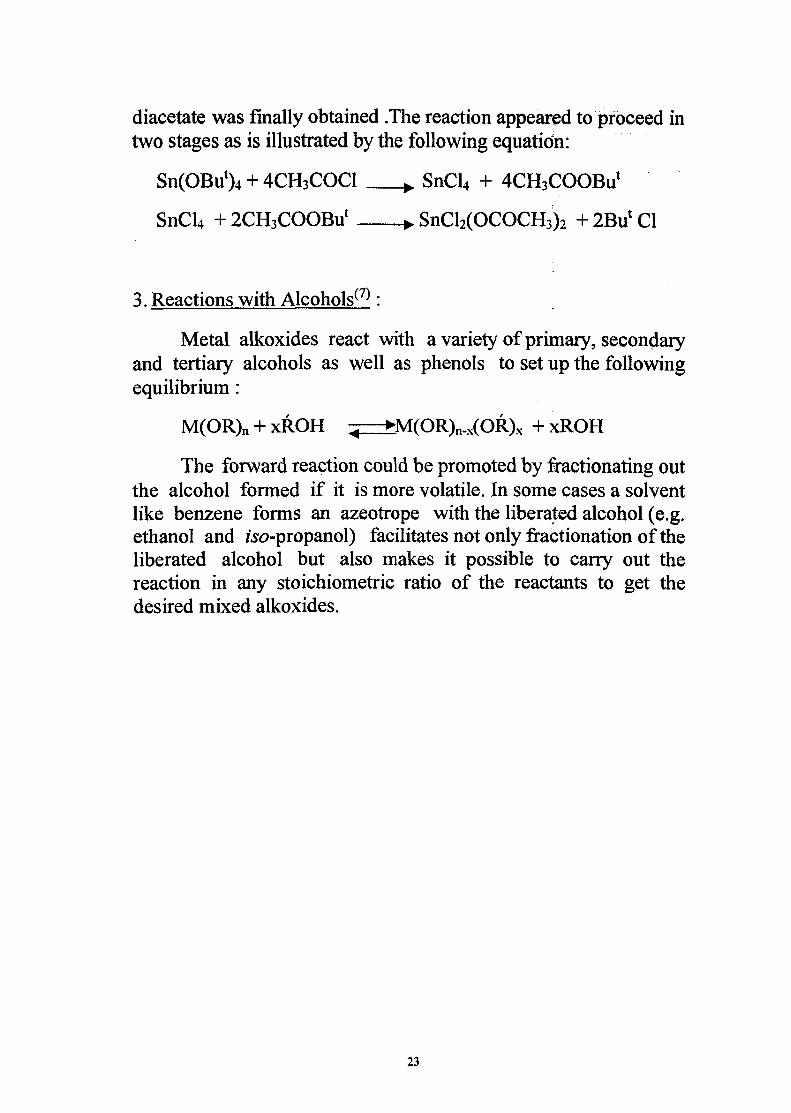
diacetate was finally obtained .The reaction appeared to proceed intwo stages as is illustrated by the following equation:
Sn(OBul)4 + 4CH3COC1 ^ SnCl4 + 4CH3COOBut
SnCl4 + 2CH3COOBul • SnCl2(OCOCH3)2 + 2Bu< Cl
3. Reactions with Alcohols^-*:
Metal alkoxides react with a variety of primary, secondaryand tertiary alcohols as well as phenols to set up the followingequilibrium:
M(OR)n + xROH ^z±M(OR)n.x(OR)x + xROH
The forward reaction could be promoted by fractionating outthe alcohol formed if it is more volatile. In some cases a solventlike benzene forms an azeotrope with the liberated alcohol (e.g.ethanol and wopropanol) facilitates not only fractionation of theliberated alcohol but also makes it possible to carry out thereaction in any stoichiometric ratio of the reactants to get thedesired mixed alkoxides.
23
The alkoxides of silicon are materials which cover a wide
range in applications. The alkoxides of it are well known of their
availability. The early studies discovered that the alkoxides of
other elements of group(iv) have similar importance as that of
silicon. They can be used instead of silicon alkoxides because
they have similar properties and even better than silicon itself.
Tin alkoxides have been widely used in industry as a
suitable precursor for synthesis. They are used for producing
building materials similar to natural stone from sintered glass or
sintered glass ceramic. They are also used in the formation of an
electrically conductive transparent coating or transparent
dielectric materials. They polymerize to form tin-oxygen bonds.
The co-polymer of them like indium-tin oxide is used in
preparing a layer uses as coatings, inks, a substrate e.g. glass,
ceramic, plastics. The introduction of sucrose residues into
organo-tin pesticides substantially increased the biological
activity per unit weight of tin, in addition the compound are veryc
effective against fungi.
Tin alkoxides are important materials in industrial
societies. Every year there are tenths researchers come out with
new utilities of tin alkoxides. The current work is concern of
preparing tin ethoxide by different methods. The study takes tin
alkoxides as independent unit without comparing it with silicon
alkoxides except in few cases. Some characteristic and physical
24

properties are taken on consideration. Therefore, the objectives
of the present work are as follows :
1-To investigate some routes of preparing tin ethoxides and
follow up- the growth of the products.
2-To study the effect of some variables parameters on the
growth of the products.
To accomplish the above objectives a closed system(Fig3.3.) was chosen for preparing tin alkoxides. It was decidedto analyze the products by using IR spectrum and GLC withOV101 column for characterization of final product.
All experimental results have been outlined in detail in thefollowing experimental section.
25

SECTION TWO
EXPERIMENTAL
CHAPTER THREE
EXPERIMENTAL
26

Guard tube (containing CaCL)
Thermometer
Condenser
Dropping funnel
Round-bottomed flask
Hot plate magnetic stirrer
Fig. (3,3.) >..Reactions System

^EXPERIMENTAL:
3.1. General Technique and Procedure :
3.1.1 Infra-Red Spectrum (IR):
A Perkin-Elmer 1310 spectrometer recorded infra-redspectrum over the range 4000 - 600 cm"1 was used for analysis.Solid was dissolved in ethanol and the solution was analyzed bytaking a spot between sodium chloride plates . Polystyrene wasused as standard calibration reference.
3.1. Gas-Liquid Chromatography (GLC):
A Pye Unicam PU4500 chromatography was used foranalysis. The conditions of GLC that used for analysis are in thefollowing Table 3.1.2.
Table 3.1.2. The Conditions of (GLC )
Parameter
Type of detector
Column
Program
Rate °C/min
Injection Temperature
Injected Volume
Detector Temperature
Attenuation
Flow rate of gascarrier Nitrogen
Description
Flame Ionization Detector
OV101 ,
150°-280°C
8°C
150°C
2M
250°C
128X1O3X1
20 ml/min.
28
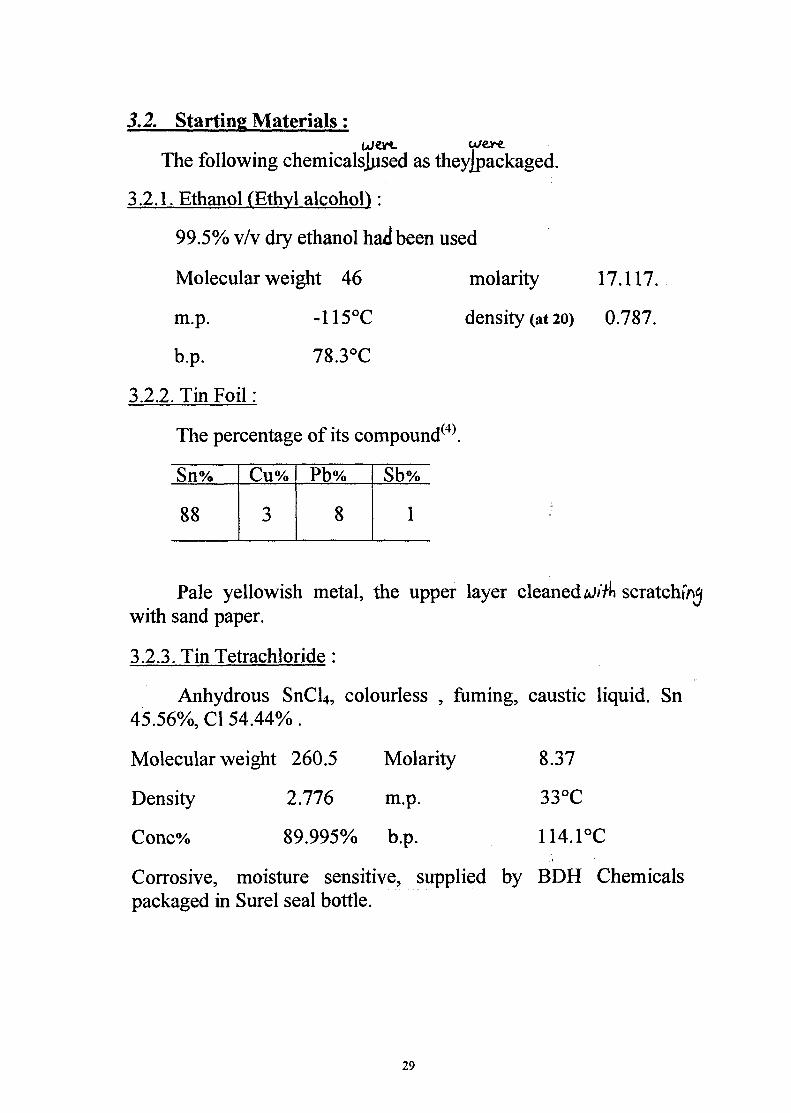
3.2. Starting Materials:
The following chemicalsjjised as theyjpackaged.
3.2.1. Ethanol (Ethyl alcohol):
99.5% v/v dry ethanol had been used
Molecular weight 46 molarity
m.p. -115°C density (at 20)
b.p. 78.3°C
3.2.2. Tin Foil:
The percentage of its compound(4).
17.117.
0.787.
Sn%
88
Cu%
3
Pb%
8
Sb%
1
Pale yellowish metal, the upper layer cleaned uii^ s c r a t ch^with sand paper.
3.2.3. Tin Tetrachloride:
Anhydrous SnCl4, colourless , fuming, caustic liquid. Sn45.56%, Cl 54.44%.
Molecular weight 260.5 Molarity 8.37
Density 2.776 m.p. 33°C
Conc% 89.995% b.p. 114.1°C
Corrosive, moisture sensitive, supplied by BDH Chemicalspackaged in Surel seal bottle.
29

3.2.4. Sodium Metal:
Bright silvery metal, very reactive metal, float on water, keptin paraffin oil, m.p 97.81, b.p. 882.90., atomic weight 2, valency 1
3.2.5. Mercury (l) Chloride :
A white powder, supplied by BDH chemicals
molecular weight 472.,09 density 7.15
m.p. 400 i
insoluble in alcohol, ether, toxic & it was used as received .
3.3. Reaction Procedure and Apparatus:
The starting materials were put in a cleaned 3-necked roundbottom flask. A reflux condenser was vertically connected fromone side to central neck of the round bottom flask and the otherside was connected to a guard tube containing CaCl2 and glasswool to avoid atmospheric moisture. One side neck of the roundbottom flask was fitted with a thermometer, the other side neckwas fitted with stopper and was used for adding the startingmaterials by using dropping funnel. The system was refluxed atcertain temperature and degree of stir for specific time using hotplate magnetic stirrer. (Fig.3.3 ) .
3.3.1 The Reaction between Tin Foil and Anhydrous Ethanol
using Mercury m Chloride as Catalyst:
A. The surface of tin was activated by scratching the abovelayer of tin with sand paper. (2.9927g) of tin was cut into smallpieces and placed into 3-necked round bottom flask. Absoluteethanol (150cm3, 2.5676M) was added one portion .Mercury(i)chloride (0.057lg) was added to the content of the roundbottom flask . The system was refluxed at 80°C and 100 rpmstir. ;
t
B. The reaction was repeated using (l,GQ75g) of tin, ethylalcohol (100 cm3, 1.7117M) and tinny amount of mercury (i)chloride. The system was refluxed for 45 hours The final
30

reaction mixture was filtered to separate the unreacted tuCTheremainder solution was distilled at atmospheric pressure toseparate the ethanol at temperature range 78° - 80°. The residuewas small white precipitate. The distilled ethanol and theprecipitate which dissolved in absolute ethanoj were analyzedby IR spectrum and shown by (Fig. 4.1.1 &Table 4.1.1. ) and(Fig 4.1.2 & Table 4.1.2.) .The solubility and melting point forthe solid product were tested(See 4.4.1 & 4.5).
C. The same reaction was repeated again using (2.9953g) of tin,ethyl alcohol (100 cm3,1.7117M) and tinny amount of Hg2Cl2
at 100°C and 300 rpm stir. The hot plate magnetic stirrer wasstopped at the first night, then it was continued work during thelater nights. Samples of solution (0.2 cm3) were takenperiodically with a pipette during the j"eac;tipj.. The finalreaction mixture was filtered and the remained ethanol wasseparated. The residue was small tiny white precipitate. Thesamples and products were analyzed by IR spectrum. (Fig.4.1.3.1. and Fig. 4.1.3.2) . And also analyzed by GLC spectrum
(Fig. 4.1.4 to Fig. 4.1.8 ; Table 4.1.4.) .The solubility of thesolid product was tested in ethanol and the test of melting pointwas done (See 4.4.1 and 4.5).
31

3.3.2 Reaction between Anhydrous Stannic Chloride with
Absolute Ethanol:
A. Absolute ethyl alcohol (100 cm3, 1.7117M) was placed into3-neck round bottom flask (Fig. 3.3.). Anhydrous stannicchloride (SnCl4) (25 cm3,0.2125M) was added to ethyl alcoholusing dropping runnel. The addition wasdropwise from oneside neck for an hour. White fumes were observed inside theround bottom flask during the addition of SriCU. This whitefumes tested with litmus and it was changed into red. After thatthe reaction mixture was refluxed at 80°C and 100 rpm stir forsix hours. The colour of the solution was pale yellow at the endof the reaction.
The reaction mixture was distilled at atmospheric pressure into :
l)The first portion was collected at the range 78 - 80°C.
2)The second portion was collected at the range 90 - 120°C.
3)The third portion was dark yellow, cooled under roomtemperature turn into dark yellow solid. The solid wasdried and turn into white solid. The product fractionswere analyzed by IR spectrum.
Fraction (i) (Fig. 4.2.1. and Table 4.2.1.).
Fraction (n) (Fig 4.2.2., Table 4.2.2.).k
Fraction (in) (Fig. 4.2.3. Table 4.2.3).
The solubility and melting point were tested for solidfraction (See 4.4.2. & 4.5.).
B. The reaction was.repeated using the same amount of starting
materials. The stannic chloride was added one portion. The systemwas refluxed at 100°C and 300 rpm stir for 12 hours. Samples ofthe reaction mixture were taken periodically.
32

The reaction mixture was distilled at atmospheric pressure intotwo portions.
(1) The first portion was collected at the range 78 - 80°C.
(2) No portion was collected until 130°C, the remainder WPSdark yellow solution which turn into white solid, samples andproducts were analyzed by IR spectrum.(Fig. 4.2.4.1. and I'ig.4.2.4.2.). And also GLC spectrum was used for analysis (See
Fig .4.2 5. to Fig 4.2.9., Table 4.2.5.)
The solubility of the solid products was tested in differentsolvents and the test of melting point was done (See 4.4.2 & 4.5).
33

3.3.3 The Reaction between Sodium Ethoxide and
Stannic Chloride in presence of Ethanol
This experiment contain two parts :
1. Formation of sodium ethoxide by the direct reactionbetween sodium metal and absolute ethanol.
2. Exchange metal reaction between the prepared sodiumethoxide from the above reaction and stannic chloride inthe presence of ethanol.
3.3.3.1.The Reaction between Sodium Metal and Absolute Ethanol
A. Absolute ethanol (100 cm3,1.7117M) was placed in roundbottom flask (Fig. 3.3.) . Sodium metal (1.0048 g) was cut intosmall pieces, dried with fine paper and added to ethanol piece bypiece until all pieces were added. The reaction mixture wasrefluxed at 80°C and 100 rpm stir for VA hour. Samples (0.2 cm3)were taken periodically for analysis. After stopping the system, theunreacted ethanol was distilled at the range 78-80°C. Theremainder was yellow solution dissolved in small amount ofethanol. The system was kept closed for the sebond part of thereaction. The samples were analyzed by IR and <3LC techniques(Fig. 4.3.1. & table 4.3.1& Fig 4.3.3.1) and (Fig.4.3.4 & Table4.3.5.).
3.3.3.2. The Reaction between Sodium Ethoxide and
Stannic Chloride in the Presence of Ethanol
The product of experiment (Fig. 3.3.3.1) was used for thisreaction in the same closed system. Using the dropping funnelfrom one side neck of the round bottom flask, (5 cm3,0.0425M) ofdried stannic chloride was added. A vigorous reaction wasoccurred. An immediate white fumes and white precipitate wereappeared . The reaction mixture was refluxed at 80°C and 100 rpmstir to expel the gas for one hour. Samples (0.2cm3) were takenperiodically.
34

The final reaction mixture was filtered to separate ethanol attemperature range 78 - 80°C. All the solution was distilled, IRspectrum and GLC technique were used to analysis the samplesand products (Fig.4.3.2. & Table 4.3.2 & Fig.4.3.3.2 ) and (Fig4.3.5.to Fig.4.3.6.& Table 4.3.2). The white precipitate was driedand weighed. The solubility and melting point were tested.(See4.4.3 & 4.5.)
B. The above experiment was repeated^in the first part (3.3.3.1).
The absolute ethanol was dried using calcium oxide before usingit, 100 cm3 was taken, sodium metal (1.95235g) was cut intosmall pieces and cleaned in petroleum spirit then add to theethanol piece by piece. The reaction mixture was refluxed for anhour. The mixture was distilled at the range 78 - 80°C. Theremainder was pale yellow solution.
The second part the addition of dried stannic chlorideoccurred in steps first (3cm3) then (7 cm3). White1 precipitate wasformed immediately. The solubility and melting point were tested.(See 4.4.3 & 4.5.)
35
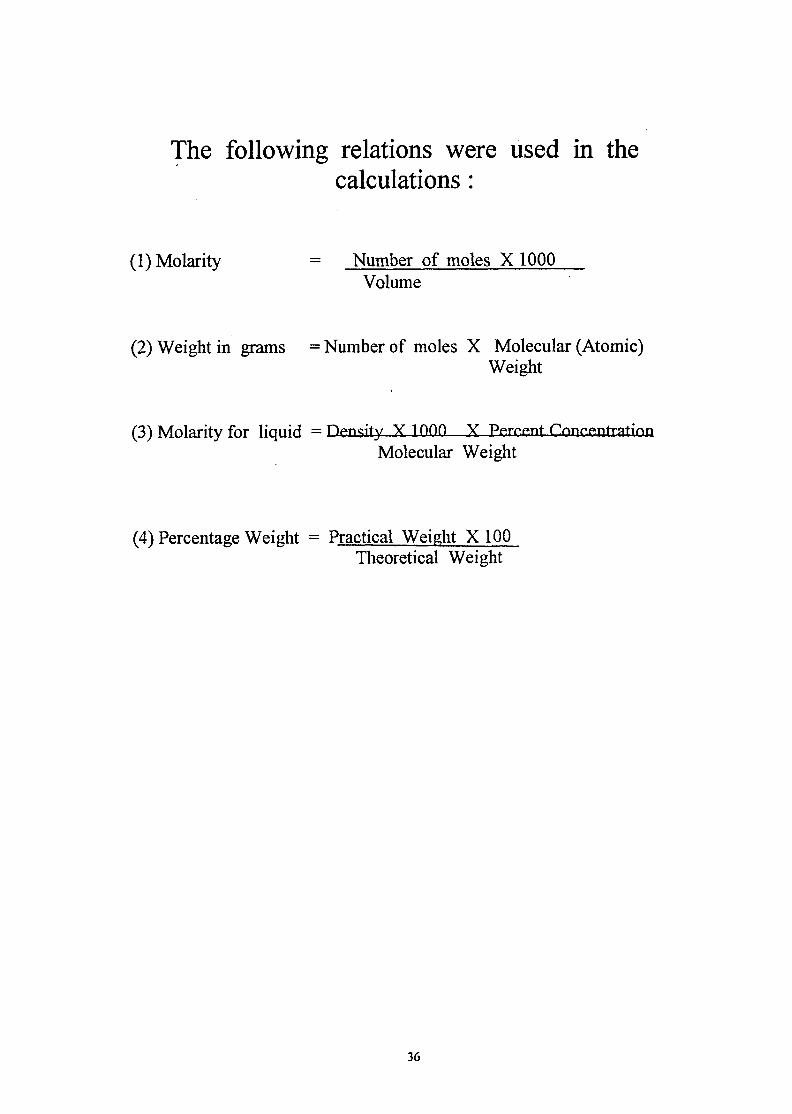
The following relations were used in thecalculations :
(1) Molarity = Number of moles X 1000Volume
(2) Weight in grams = Number of moles X Molecular (Atomic)Weight
(3) Molarity for liquid = T^ppgity X 1QQft XMolecular Weight
(4) Percentage Weight = Practical Weight X 100Theoretical Weight
36
CHAPTER FOUR
RESULTS & CALCULATIONS
37

Fig. (4.1.1.)Infra-red Specfrum of Distilled Ethanol Collected at range78~80°Cof the Reaction (B) between Ethanol and Tin Metal
I00if)

Table 4.1.1. (Fig. 4.1.1) Infra-Red Spectrum of DistilledEthanol Collected at Range 78-80°COf Reaction (B) between Ethanol &Tin Metal.
Frequency (cm"1)
3200* (s)
2777 (s)1428 (b)1063 (s)1030(s)1010 (w))000(w)995(vv)869 (s)
Assignment
O H stretch
CH2 and CH3 stretchO-H bendingC-C stretchC-0 stretch
Sn-0 bending
CH2 and CH3 deformation
s : strongb : broad
w : weak* : hydrogen bonding caused shift in the frequency.
39

fig. (4.1.2.)Tnfra-red Spectrum of Product Dissolved in Ethanolof the Reaction (3) betvteen Ethanol an«l Tin Metel
4000 3000 2000 v/AVENUHBEfc (err 1) woo 9oo Soo 709f t * r > • > • 1 . • 1 1 1 , • . 1 1 . / 1 / 1 1 1 * 1 1 . • 1 1 1 1 1 » 1 1 1 'i 1
2

Table 4.1.2. (Fig. 4.1.2) Infra-Red Spectrum of ProductDissolved in Ethanol of Reaction (B)between Ethanol and Tin Metal.
Frequency (cm"1)3200* (s)2777 (s)1428 (b)1063 (s)1030 (s)1010(w)952 (s)869 (s)
AssignmentO-H stretchCH2 and CH3 stretchO-H bendingC-C stretchC-0 stretchSn-0 bending
CH2 and CH3 deformation
s : strong >b : broadw : weak* : hydrogen bonding caused shift in the frequency.
41

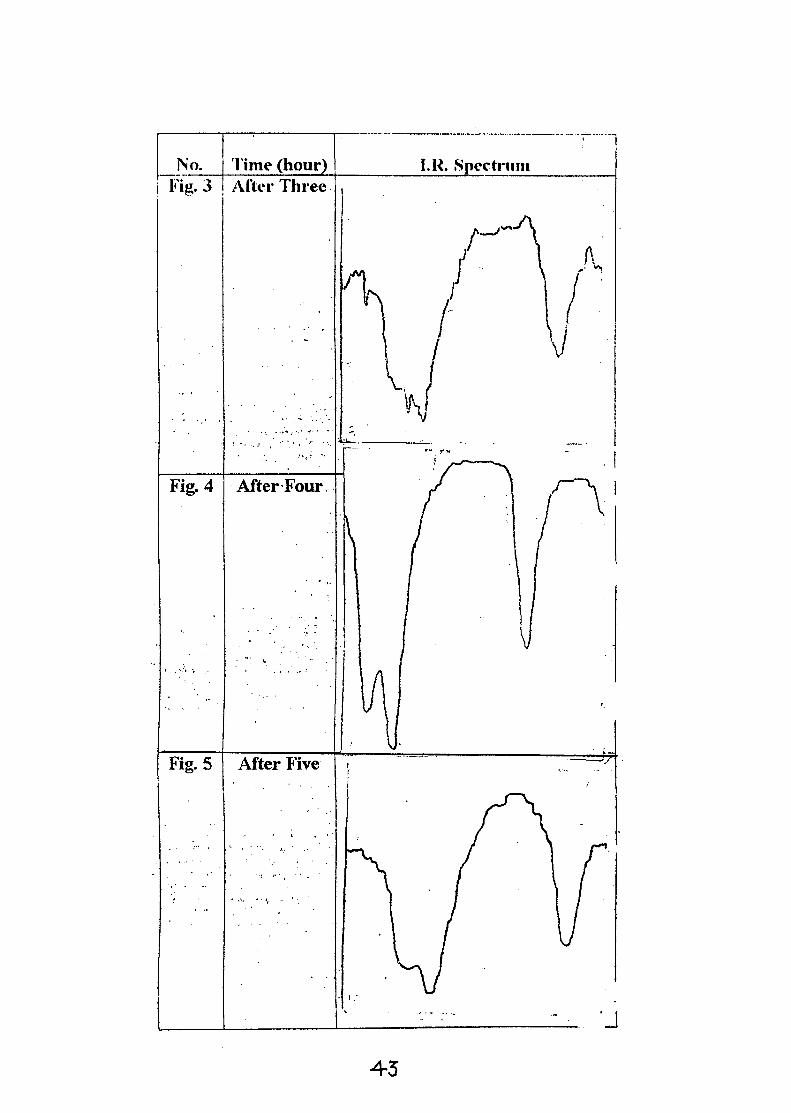
Variations of Sn—p bond measured by I.R. spectroscopy, in thereaction between tin foil and absolute etlutnol in the presence ofmercurous cliloridc as a catalyst at 100°C and 300° stir, with time.The peaks were taken at the range 845 - 1250 cm"1.
No. , , Time (hour) I.R. Spectrum! Fig. 0 After Zero
•J
4-3

44

No. Time (hour) I.K. SpectrumFig. 9 After Nine
Fig. 10stopping thereaction for
fifteen
Fig.ll Five hoursAfter
Restarting

No. Time (hour) I.R. Spectrumiji. 12 Twenty-
hours AfterRestarting
Fig.13 Thirtyhours AfterRestarting
Fig.14 Forty hoursAfter
Restarting

No. Time (hour)Fig.15 Sixty Five
hours AfterRestarting
Fig.16 Ninetyhours AfterRestarting
. .•**' . ' • '•-'.' . ' . . ,\y.
Fig.17 Hundredand Ten
hours. AfterRestarting
• - v • ' ' • • ' • • • ' • • ' • • ' • .

'No*-Fig.18
Fig.19
Time (hour)^Product
Distillation(dissolved •in absolute
ethanol)
• . . • ' . • - , f • . : ' : . • • ' • , • • • " \ • : ? '
-Distiiiated
.'•<ne?Ranges|;?
I.R Spectrum
ri
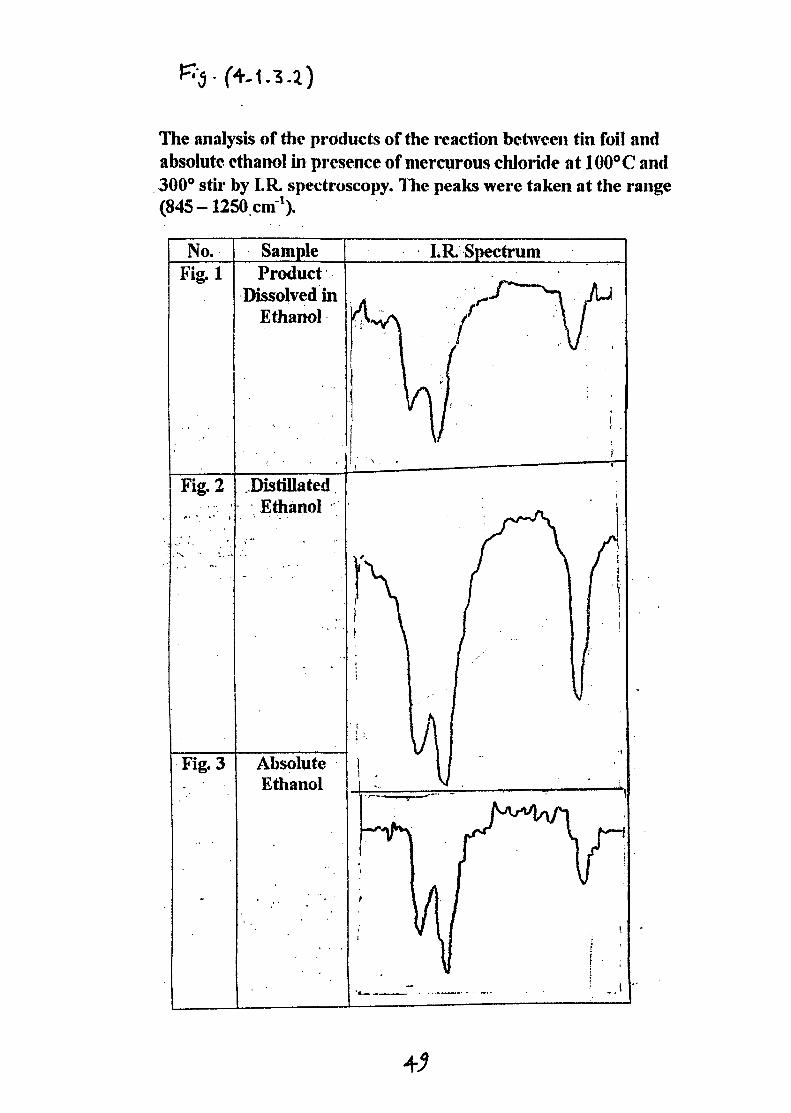
The analysis of the products of the reaction between tin foil andabsolute ethanol in presence of mercurous chloride at 100°C and300° stir by I.R. spectroscopy. The peaks were taken at the range(845 -1250 cm1).
No.Fig. 1
Fig. 2
Fig. 3
SampleProduct
Dissolved inEthanol
DistillatedEthanol
AbsoluteEthanol

Fig. (44.40GLC Chroma tograrn of sample (A) of ike
between Tin Melal and absolute Ef$jan<sl

18 CLC C h r o m a t o g r a m of sample (B) o f the ReactionTin Metal and ah«;nfute ^ t h l
61

Fig. )
GLC Chromatogra/n ofsample ( Q of IKeHeadionbefiVeen Tin Metal rt»^ absolute Ethanol

Pig.GLC Chroma togram of sample (D) of the Reaction
between Tin Metal and absolute Eihanol
S3

Fig. (4.1.8.)GLC CJircmatogratfl of sample (E) of the Re
between Tin Metal and absolute Cthano
54-

Table 4.1.4. Results of GLC of Samples of the Reactionbetween Tin Metal and Absolute Ethanolin presence of Hg2Cl2 as Catalyst
Sample
A
TotalB
TotalC
TotalD
TotalE
Total
Taken attimehours7
37
84
Productdissolvein ethanol
Distilledethanol
Peaks
123
123
123
123
12 .3
Retentiontime (Rt)
1.210.012.1
1.310.212.6
1.511.013.3
1.110.012.3
1.710.812.9
Peaknight incm22.61.64.5
22.51.43.0
22.51.32.6
22.91.63.5
23.50.82.3
Base incm
7.22.32.3
7.22.23.4
7.22.34.0
7.02.13.2
7.02.32.7
Area
81.361.845.18
88.3881.00
1.545.10
87.6481.00
1.505.20
87.7080.15
1.685.60
87.4382.25
0.933.11
86.29
Area%
92.0572.0825.861
92.4241.7575.819
92.3601.7105.930
91.6731.9226.405
95.3291.0663.605
55


Table 4.2.1. (Fig. 4.2.1.) Infra-Red Spectrum for DistilledEthanol at Range 78 - 80°C forReaction (A) between StannicChloride and Ethanol.
Frequency (cm'1)3200* (s)2777 (s)1428 (s)1063 (vs)1030 (vs)1020 (w)1000 (m)990 (m)
' 869 (s)
AssignmentO-H stretchCH2 and CH3 stretchO-H bendingC-C stretchC-0 stretch
Sn-0 bending
CH2 and CH3
deformation
vss
wm*
very strongstrongweak
: moderatehydrogen bonding caused shift in the frequency.
57

Fig. (4.2.1.)Infra-red Spedrum of Stannic Chloride Collected at range 90- 120°Cof the Reaction (A) between Stannfc Chloride and EthanoL

Table 4.2.2. (Fig. 4.2.2.) Infra-Red Spectrum for FractionCollected at 90-120°C forReaction (A) between StannicChloride & Ethanol.
Frequency (cm"1)3200* (b)1063 (w)1030 (w)869 (s)
AssignmentO-H stretchC-C stretchC-0 stretchCH2 and CH3
deformation
b : broadw : weaks : strong* : hydrogen bonding caused shift in the frequency.
59

Infira-red Spectrum of Product Dissolved In Ethanoiof the Reaction (A) between Stannic Chloride and FthanoL
(or1)
II
'too tool f l i l } l * t t t t | I I I I I >V » »
700I I . I I
f f •>•! ' I t I < I > I I

1 able 4.2.3. (Fig. 4.2.3.) Infra-Red Spectrum for ProductDissolved in Ethanol of Reaction (A)between Stannic Chloride andEthanol.
!_ Frequency (cm"1)1 3200*(b)
2777 (s)1428 (s)1265 (vs)
, 1063 (m)1032 (s)1031 (m)1000 "(w)990 (w)869 (m)
AssignmentOH stretchCH2 and CH3 stretchO-H bending ;
C-C stretchC-0 stretch
Sn-0 bending
CH2 and CH3Deformation
vss
wmb
very strongstrongweakmoderate
: broad• hydrogen bonding caused shift in the frequency.
61

"3 (4-2-4--IJ
Variations of Sn - O bond measured by I.R specti'oscopy, in thereaction between anhydrous stannic chloride and absolute ethanol at100°C and 300 stir, with time. The peaks were taken at the range845-1250 cm1.
No. Time (hour) I.R. SpectrumFig. 0 After Zero
Fig. 1 After One
Fig. 2 After Two
£2,

No. Time (hour) , LR. SpectrumFig. 3 After Three !
Fig. 4 After Four
Fig. 5 After Five
Fig. 6 After Six

No. Time (hour) I.R SpectrumFig. 7 After Seven
Fits. 8 After Eight | \
Fig. 9 i After Nine
Fig. 10 j After Ten
(A-

Tlie analysis of the products of the reaction behveen anhydrousstannic chloride and absolute cthanol at 100°(! and 300° stir by I.R.spectroseopy. The peaks were taken at the range S45 - 125(1 cnfJ.
No.Fig.
Sample I.R. Spectrum
Fig. 2
Fig. 3
Fig. 4
SolidProduct
ProductDissolved in
Ethanol
DistillatedEthanol
AbsoluteEthanol
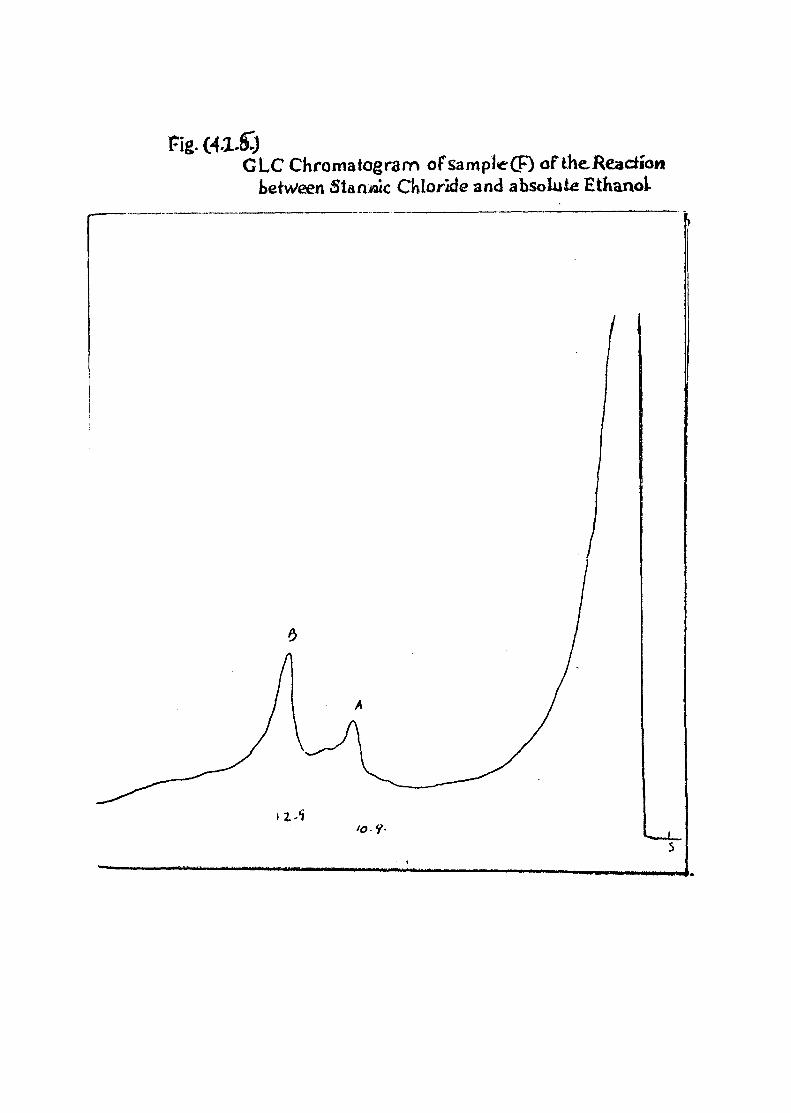
Fig.GLC Chromatogram ofsampteCF) of the. Reaction
between Stamaic CKloride and absolute EtKanot
10 V

Fig. (4.2,6.)GLC Chroma togra m of sample C<3) of the Reactfoh
between Stannic Chloride and absolute Ethanol I

Fig. C4.17JCLC Chroma togrann of sample (H) of the Reaction
b h S f c Chloride and «aL^ula Ei>iai»ol

Fig. &2.S.)GLC Chromatograna of sample (I) ofihe. Reaction
l E l

Fig. (4.2,9.)GLC Chromatogram of sample (J) of the Reaciion
between Siannic Chloride and absolute Ethanol

Table 4.2.5. Results of GLC of Samples of the Reactionbetween Stannic Chloride and Ethanol.
Sample
F
TotalG
TotalH
TotalI
TotalJ
Total
Taken attimehours3
5
7
9
Productdissolvein ethanol
Peaks
123
123
123
12345
1234
Retentiontime (Rt)
1.210.712.9
1.510.813.1
1.510.813.1
1.710.712.218.33.5
1.210.212.617.3
Peakhight incm22.4
2.13.6
22.31.63.2
21.91.33.0
21.80.91.41.53.0
21.30.61.52.8
Base incm
7.01.72.1
7.02.03.4
7.02.24.0
2.01.42.22.43.2
7.22.21.62.5
Area
78.401.793.78
83.9778.05
1.605.44
85.0976.65
1.436.00
84.0821.80
0.631.541.804.80
30.5776.68
0.661.203.50
82.04
Area%
93.3672.1324.501
91.7261.8816.393
91.1631.7017.136
71.3122.0605.0385.888
15.702
93.4670.8051.4624.266

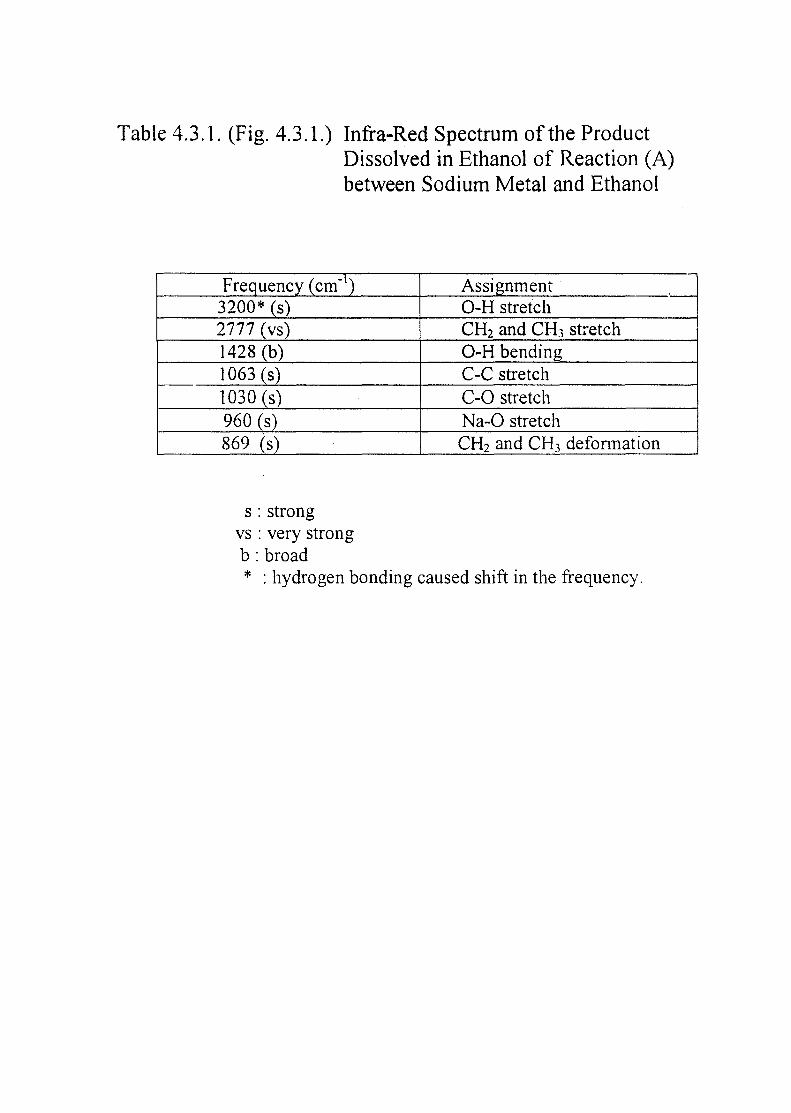
Table 4.3.1. (Fig. 4.3.1.) Infra-Red Spectrum of the ProductDissolved in Ethanol of Reaction (A)between Sodium Metal and Ethanol
Frequency (cm"1)3200* (s)2777 (vs)1428 (b)1063 (s)1030 (s)960 (s)869 (s)
AssignmentO-H stretchCH2 and CH3 stretchO-H bendingC-C stretchC-0 stretchNa-0 stretchCH2 and CH3 deformation
s : strongvs : very strongb : broad* : hydrogen bonding caused shift in the frequency.

32)Infra-red Spectrum of Product Dissolv edReaction (AJ between Stannicckloridei
in Ethanol of theiw the Presence qf EthanaL
± L - J i u, _ : ) • I i i i i i — . _ L_i i
900 %QOI I I i • ' ' • • ' • ' • * i i . I i i _
- > /
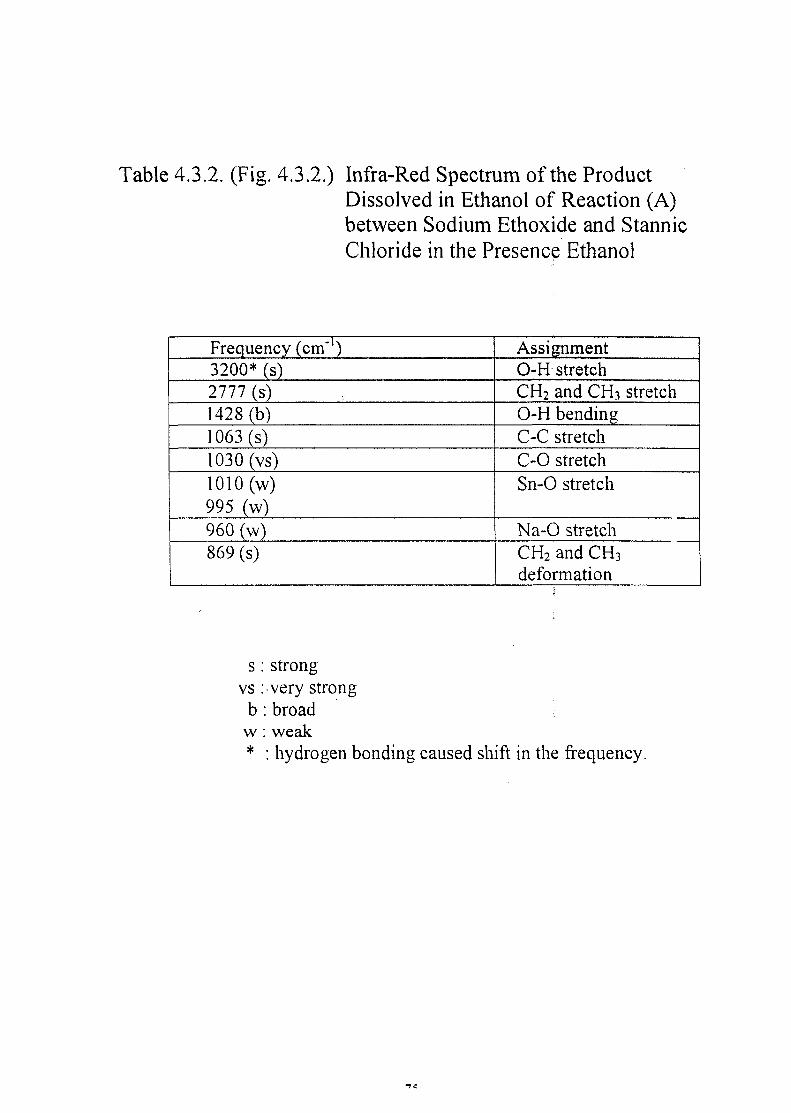
Table 4.3.2. (Fig. 4.3.2.) Infra-Red Spectrum of the ProductDissolved in Ethanol of Reaction (A)between Sodium Ethoxide and StannicChloride in the Presence Ethanol
Frequency (cm*1)3200* (s)2777 (s)1428 (b)1063 (s)1030 (vs)1010 (w)995 (w)960 (w)869 (s)
AssignmentO-H stretchCH2 and CH3 stretchO-H bendingC-C stretchC-0 stretchSn-0 stretch
Na-0 stretchCH2 and CH3
deformation
svs
bw*
strong•very strong: broadweak
: hydrogen bonding caused shift in the frequency.

- (4-3.3-1)
Variations of Na—O bond measured by I.R. spectroscope in thereaction between sodium metal and absolute cfh;rnol a t 10fl°C and100. stir, with time. The peaks were taken at the range845-1250 cm-4.
No.
Fig.2
Time (min)After
Fifteen
AfterThirty
Alter Forty•ive
\rR. Spectrum

No. Time (niin) I.R, SpedrurviFig. 4 After Sixtv
Fig. 5 AfterSeventy
Five
Fig. 6 AfterNinety
' • ' • ' • • ' . - • / . s ' ' ^ , '
Fig. 7 Product inAbsoluteEthanol

Variations of S n - O bond measured by I.R. spectroscopy, in thereaction between anhydrous stannic cliloride and sodium et}ioxideat 100°C and 100 stir, with time. The peaks were taken at the range845-1250 cm1.
No.Fig. 0
Fig. 1
Fig. 2
Fig. 3
Time (min)After Zero
AfterFifteen
AfterThirty
After Forty• F i v e : "•••
I.R. Spectrum
\ 1 ^

~No7 Tiine (min) I.R. SpectrumFig. 4 After Sixty
Fia.5 AlterSeventy
Five
Fig. 6 AfterNinety
-:? Q/ (•••

Kg. (43.4,), GLC Chromalogra/h of sample CK) of the Reactuon
between Sodium Metal amJ absolute Ethanol

Fig. 04.3.5.)QLC diromatogrann of sample (/V) of the Reaction
between Sodium trhoxide ancl Stannic Chloridein the preSeTTce of Eihano

Fig. (4.3.6.)GhC Chromatogram of sample (|v[) of the Reaction
in the presence of Ethanot

Table 4.3.5. Results of GLC of Samples of the Reactionbetween Sodium Metal and Ethanol.
Sample
K
Takenat time/hours
60
Peaks
12
Retentiontime (Rt)
1.13.2
Peakheight in
cm23.84.3
Basein cm
1.85.6
Area
21.4212.0433.46
Area%
64.0135.98
Table 4.3.6. Results of GLC of Samples of the Reactionbetween Sodium Ethoxide and Stannic Chloridein Presence of Ethanol.
Sample
N
M
Taken attime/hours
80
Productdissolved
inethanol
Peaks
1234
12345
Retentiontime (Rt)
1.2_ 3.6
10.312.7
1.2- 6.6
10.112.215.4
Peakheight in
cm242.60.31.4
241.00.30.22.0
Basein cm
7.01.51.52.0
4.33.30.70.74.0
Area
84.001.9500.2201.40087.5751.601.650.110.074.0057.43
Area%
95.912.2270.2571.533
89.8992.8730.1920.1220.965
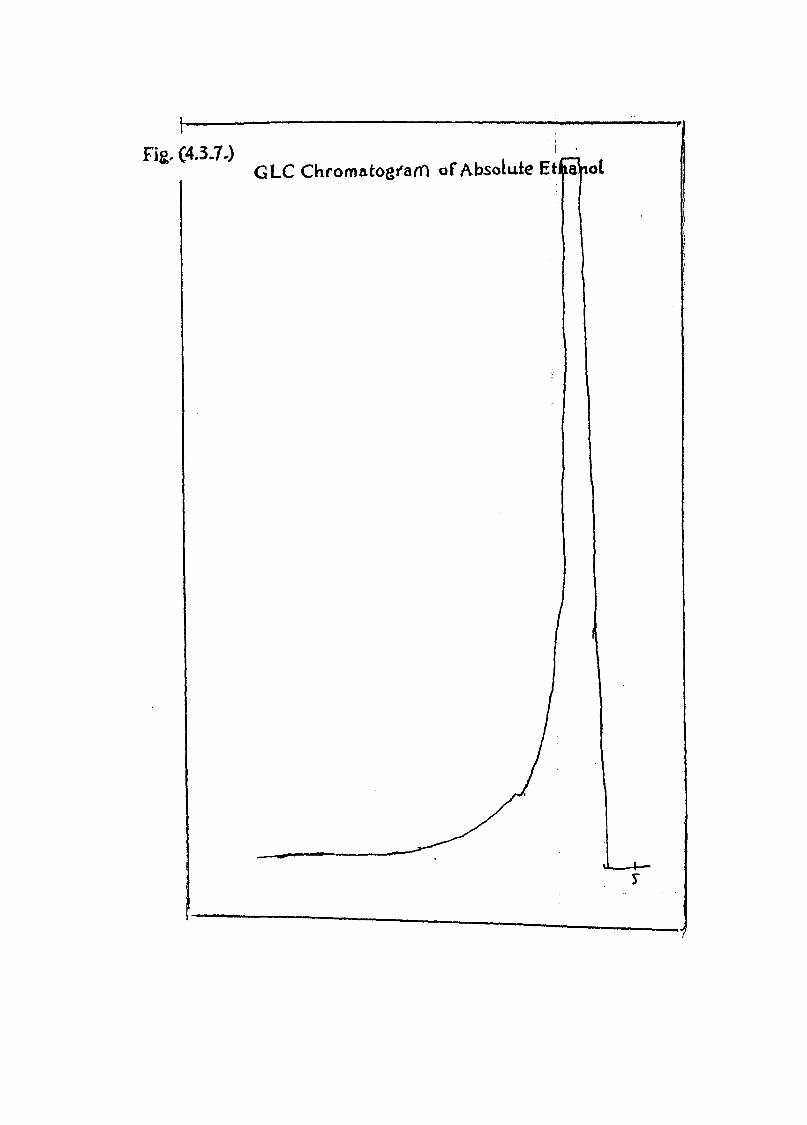
Fig, (4.3.7,)GLC Chromatogi'arn of Absolute Et a?
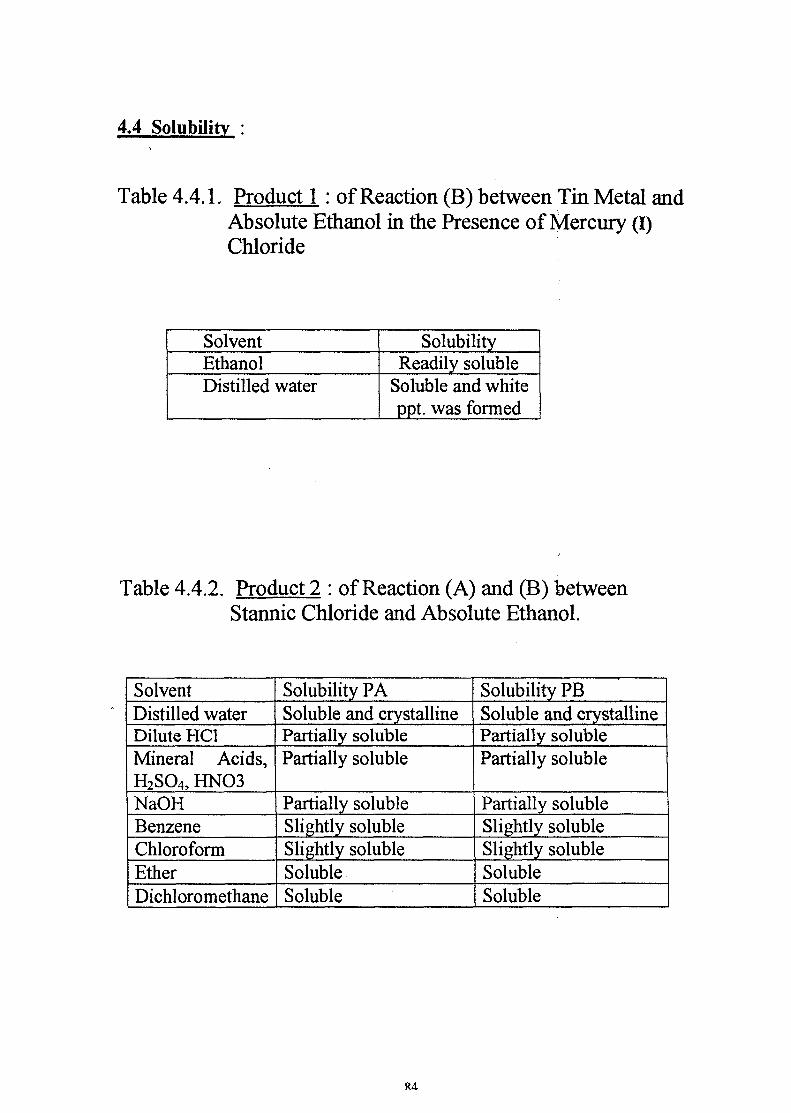
4.4 Solubility :
Table 4.4.1. Product 1 : of Reaction (B) between Tin Metal andAbsolute Ethanol in the Presence of Mercury (I)Chloride
SolventEthanolDistilled water
SolubilityReadily soluble
Soluble and whiteppt. was formed
Table 4.4.2. Product 2 : of Reaction (A) and (B) betweenStannic Chloride and Absolute Ethanol.
SolventDistilled waterDilute HC1Mineral Acids,H2SO4, HNO3NaOHBenzeneChloroformEtherDichloromethane
Solubility PASoluble and crystallinePartially solublePartially soluble
Partially solubleSlightly solubleSlightly solubleSolubleSoluble
Solubility PBSoluble and crystallinePartially solublePartially soluble
Partially solubleSlightly solubleSlightly solubleSolubleSoluble

Table 4.4.3. Product 3 of Reaction (A) and (B) betweenSodium Ethoxide and Stannic Chloride .
SolventEthanolDistilled water
Dilute HC1H2SO4, HNO3NaOHBenzeneChloroformEtherDichloromethane
Solubility PASolubleSoluble andcrystallinePartially solublePartially solublePartially solubleSlightly solubleSlightly solubleSolubleSoluble
Solubility PBSolubleSoluble andcrystallinePartially^solublePartially solublePartially solubleSlightly solubleSlightly solubleSolubleSoluble
4.5. Melting point:
All product 1,2,3, were unmeltable until 340°C.
4.6. Formation of Product:
All product 1,2,3, were white solids.
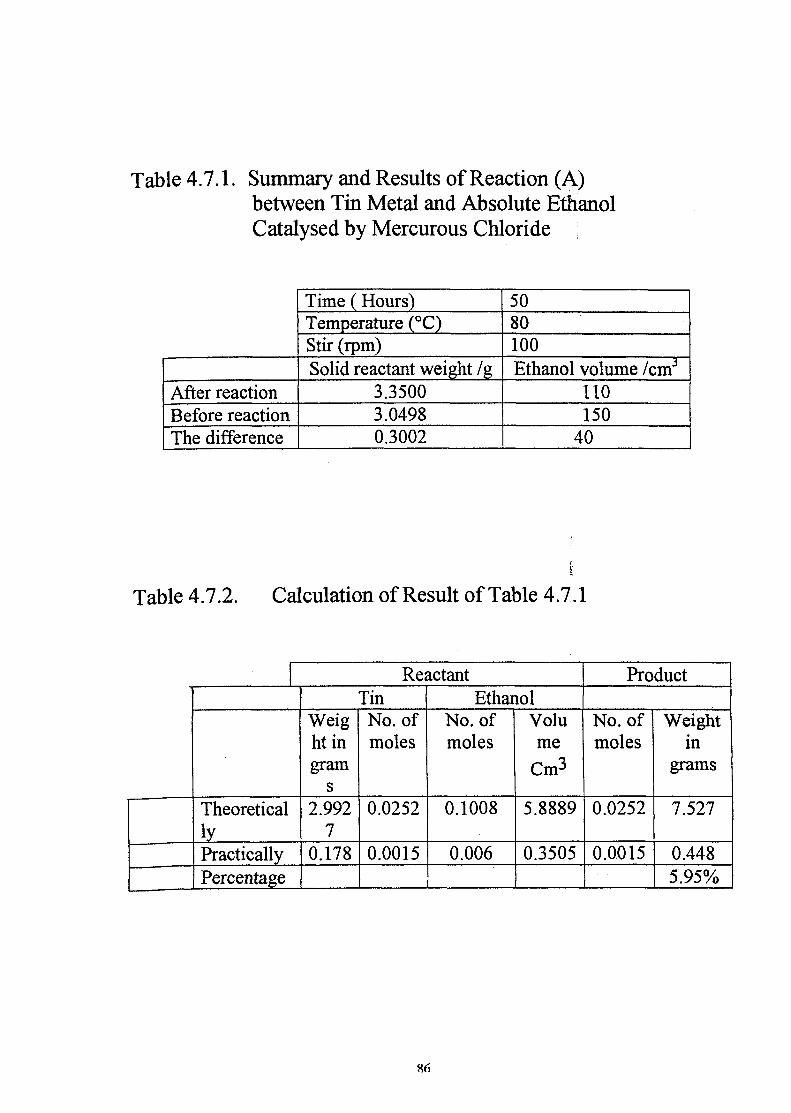
Table 4.7.1. Summary and Results of Reaction (A)between Tin Metal and Absolute EthanolCatalysed by Mercurous Chloride
After reactionBefore reactionThe difference
Time (Hours)Temperature (°C)Stir (rpm)Solid reactant weight /g
3.35003.04980.3002
5080100Ethanol volume /cm3
110150
40
Table 4.7.2. Calculation of Result of Table 4.7.1
TheoreticallyPracticallyPercentage
ReactantTin
Weightingram
s2.992
70.178
No. ofmoles
0.0252
0.0015
EthanolNo. ofmoles
0.1008
0.006
Volume
Cm3
5.8889
0.3505
Product
No. ofmoles
0.0252
0.0.015
Weightin
grams
7.527
0.4485.95%

Table 4.7.3. Summary and Results of Reaction (B) betweenTin metal and Absolute Ethanol Catalysed byMercury (I) Chloride.
Before reactionAfter reaction
ParameterTime (hours)Temperature °CStir (rpm)Solid reactantweight /g
1.0075-
Condition45go100
Ethanolvolume /cm3
10060
Solid productweight/g
0.00.0421
Table 4.7.4. Calculation of Result of Table 4.7.3.
.TheoreticallyPracticallyPercentage
ReactantTin
No. ofgrams1.00750.0119
No. ofmoles0.00850.0001
EthanolNo. ofmoles0.03400.0006
Volumecm3
1.98360.0329
Product
No. ofmoles0.00850.0001
Weight/g
2.53900.04211.658%
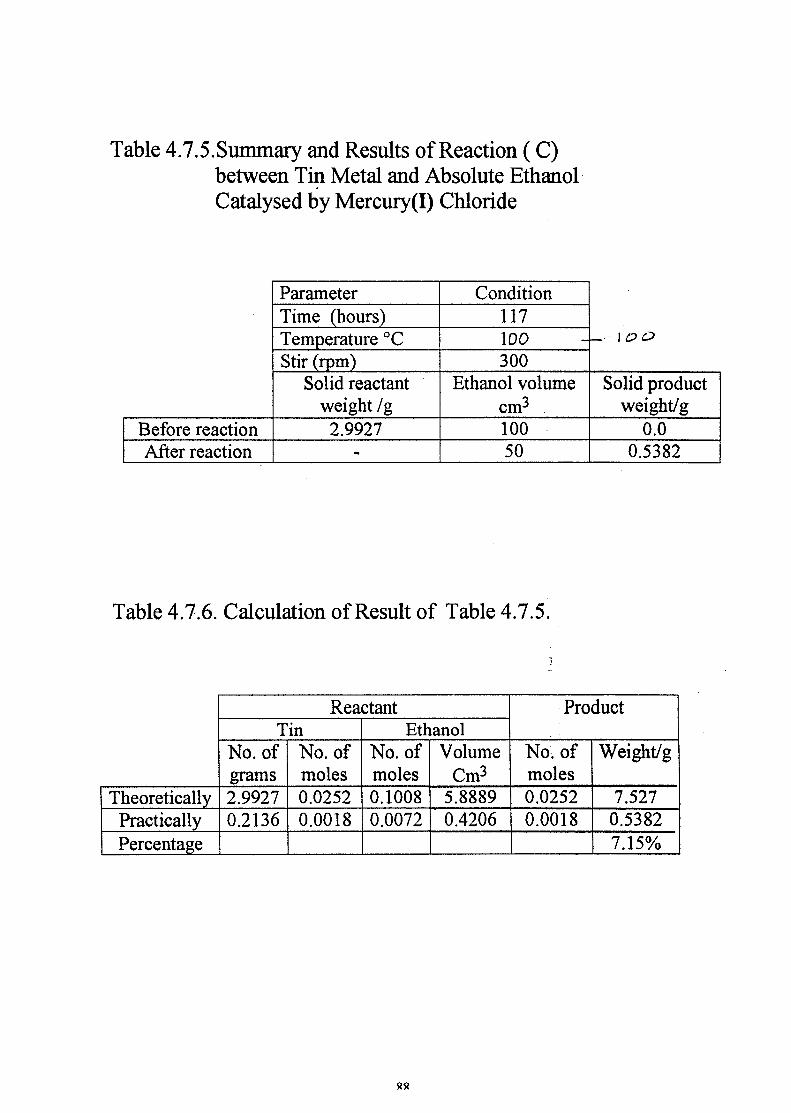
Table 4.7.5.Summary and Results of Reaction (C)between Tin Metal and Absolute EthanolCatalysed by Mercury(I) Chloride
Before reactionAfter reaction
ParameterTime (hours)Temperature °CStir (rpm)
Solid reactantweight /g2.9927
-
Condition117100300
Ethanol volumecm3
10050
Solid productweight/g
0.00.5382
Table 4.7.6. Calculation of Result of Table 4.7.5.
TheoreticallyPracticallyPercentage
ReactantTin
No. ofgrams2.99270.2136
No. ofmoles0.02520.0018
EthanolNo. ofmoles0.10080.0072
VolumeCm3
5.88890.4206
Product
No. ofmoles0.02520.0018
Weight/g
7.5270.53827.15%

Table 4.8.1. Summary and Results of Reaction (A)between Tin Tetrachloride and Absolute Ethanol
Before reactionAfter reaction
ParameterTime (hours)Temperature °CStir (rpm)
Condition680100
Reactantstannic chloridevolume cm3
25-
Ethanolvolume cm3
10060
Product weight/g
0.023.829
Table 4.8.2. Calculation of Result of Table 4.8.2.
TheoreticallyPracticallyPercentage
ReactantTin
No. ofgrams
259.388
No. ofmoles0.21250.0798
EthanolNo. ofmoles49.65818.64
VolumeCm3
0.850.319
Product
No. ofmoles0.21250.0798
Weight/g
63.47423.82937.54%

Table 4.8.3. Summary and Results of Reaction (B)between Tin Tetrachloride and Absolute Ethanol
Before reactionAfter reaction
ParameterTime (hours)
Temperature °CStir (rpm)
Condition12
WO300
ReactantStannic volume
cm3
25-
Ethanol volumecm3
10060
Solid productweight/g
0026.0431
Table 4.8.4. Calculation of Result of Table 4.8.3.
TheoreticallyPracticallyPercentage
ReactantTin
No. ofgrams2.99270.2136
No. ofmoles0.02520.0018
EthanolNo. ofmoles0.10080.0072
VolumeCm3
5.88890.4206
Product
No. ofmoles0.02520.0018
Weight/g
7.5270.53827.15%
90
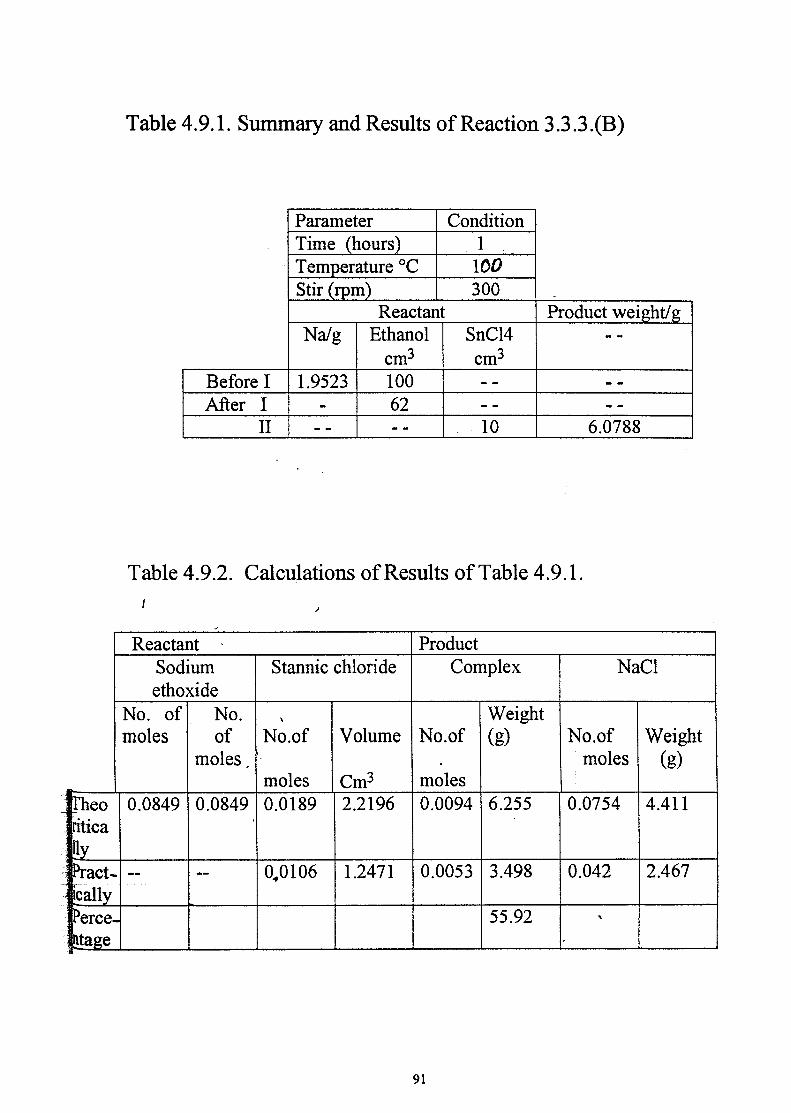
Table 4.9.1. Summary and Results of Reaction 3.3.3.(B)
Before IAfter I
II
ParameterTime (hours)Temperature °CStir (rpm)
Condition1100300
ReactantNa/g
1.9523-
Ethanolcm3
10062
SnC14cm3
10
Product weight/g- -
6.0788
Table 4.9.2. Calculations of Results of Table 4.9.1.
Theoriticallytac t -icallyPerce-ntage
ReactantSodiumethoxide
No. ofmoles
0.0849
—
No.of
moles.
0.0849
—
Stannic
No.of
moles0.0189
0.0106
chloride
Volume
Cm3
2.2196
1.2471
ProductComplex
No.of
moles0.0094
0.0053
Weight(g)
6.255
3.498
55.92
NaCl
No.ofmoles
0.0754
0.042
Weight(g)
4.411
2.467
91

Table 4.9.3.: Summary and Results of reaction 3.3.3. (A)
HParameter
Time in hoursTemperature °C
Stir
BeforereactionAfterreaction
Naweight
(g)1.0048
Conditionl>5
• SO100
Ethanolvolume
cm3
100
60
ParameterTime in hours
Temperature °CStir
Weight ofproduct
- -
3.0502
Condition1.5
( SO100
Volume ofSnCl cm3
A
5
am
Table 4.9.4. (I) Calculations of Results of Table 4.9.3 (I)
Theoretical
Reactant
Na MetalNo.ofgrams
1.0048
No.ofmoles
0.0437
EthanolNo.ofmoles
0.0437
VolumeCm3
2.553
Product
No.ofmoles
0.0437

Table 4.9.4.(11) Calculation of Results of Table 4.9.3 (II)
SodiumEthoxide
Theoretically
Practically
Percentage
No. ofmoles0.0437
0.0239
ReactantStannic
ChlorideNo. ofMoles0.0097
0.0053
VolumeCnP1.1425
0.624
ProductComplex
No. ofmoles0.0086
0.624
Weight(g)3.234
0.0027
54.89
SodiumChloride
No. ofmoles0.0319
1.775
Weight(g)
2.28
0.022

SECTION THREE
DISCUSSION

CHAPTER FIVE
Discussion
94
S.Discussion:
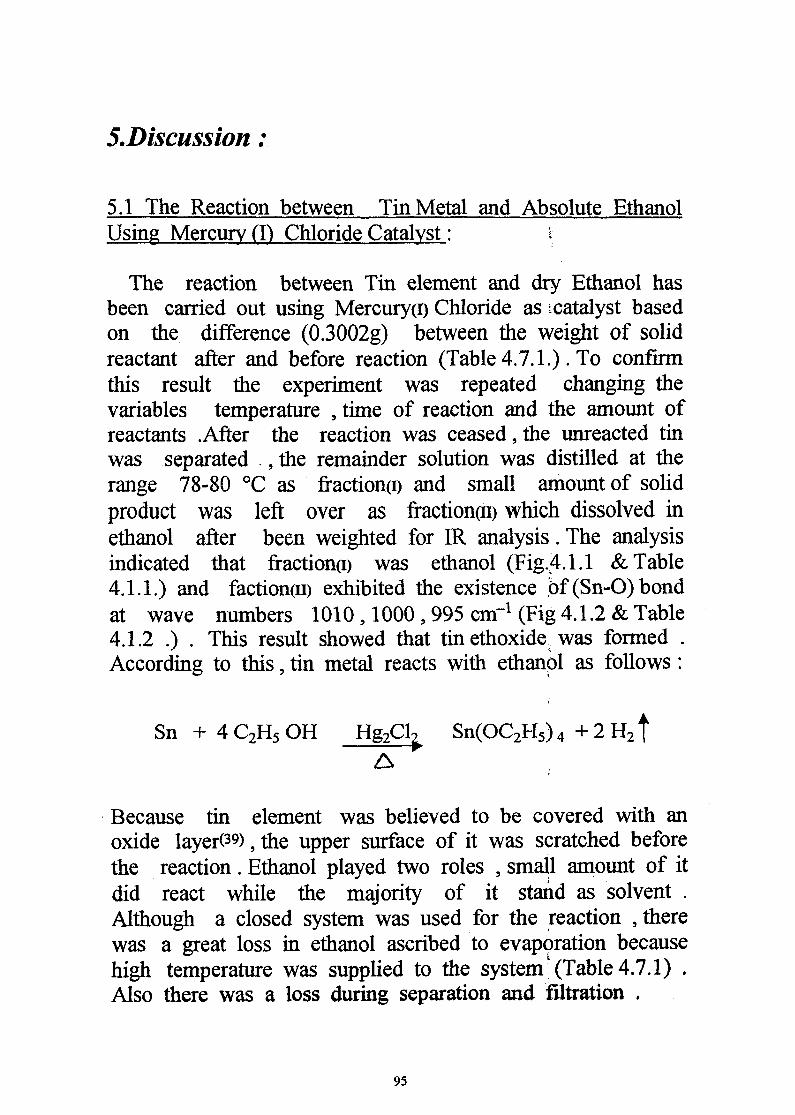
5.1 The Reaction between Tin Metal and Absolute EthanolUsing Mercury (I) Chloride Catalyst: i;
The reaction between Tin element and dry Ethanol hasbeen carried out using Mercury(i) Chloride as icatalyst basedon the difference (0.3002g) between the weight of solidreactant after and before reaction (Table 4.7.1.) . To confirmthis result the experiment was repeated changing thevariables temperature , time of reaction and the amount ofreactants .After the reaction was ceased, the unreacted tinwas separated , the remainder solution was distilled at therange 78-80 °C as fraction(i) and small amount of solidproduct was left over as fractional) which dissolved inethanol after been weighted for IR analysis . The analysisindicated that fraction(i) was ethanol (Fig.4.1.1 & Table4.1.1.) and faction(ii) exhibited the existence bf(Sn-O)bondat wave numbers 1010,1000,995 cnr1 (Fig 4.1.2 & Table4.1.2 .) . This result showed that tin ethoxide. was formed .According to this, tin metal reacts with ethanpl as follows:
Sn + 4 C2H5 OH Hg2Cl^ Sn(OC2H5) 4 + 2 H2 fA
Because tin element was believed to be covered with anoxide layer(39) 9 the upper surface of it was scratched beforethe reaction. Ethanol played two roles , small amount of itdid react while the majority of it stand as solvent .Although a closed system was used for the reaction , therewas a great loss in ethanol ascribed to evaporation becausehigh temperature was supplied to the system'(Table 4.7.1) .Also there was a loss during separation and filtration .
95

Mercury(i) chloride was suitable catalyst to accelerate therate of the reaction . The ion exist* as a dimer Hg+_Hg+ ,and does not dissolve in ethanol , therefore , it wasbelieved that it attacked by the upper oxide layer of tin togive the i
O — Sn — 0: 2Hg+ — Hg+ • 2Hg2O + Sn
Then tin (II) ion attacked by ethanol.
Sn(OEt )2
Tin(n) Ethoxide
To make these results more valid,the formation of(Sn-O) bond was followed by periodical IR analysis byrepeating the experiment and changing the variablestemperature , speed of stir , time and the amount of thereactants . The growth of (Sn-O) was followed at the range845-1250cnr1 . The (Sn-O) peaks interfered with (C-O) peakand the number of them increased with time (Fig 4.1.3.1 &Fig 4.1.3.2).
The G1C analysis for the samples manifested theresult. Taking absolute ethanol as reference (Fig.4.3.7), theChromatogram displayed three peaks . Peak No. 1 representthe solvent ethanol which had the same retention time asreference (Fig 4.1.4. & Fig 4.3.7) . Peak No.2 & Peak No.3were suggested to be the product (Fig4.1.4 to Fig 4.1.8) and(Table 4.1.4). Peak No.2 & Peak No.3 in all samples andproduct nearly had the same retention time (Table 5.1.1),indicating the presence of tin ethoxide . Peak No.2 was smallcompared to Peak No.3 by calculating the areas under thePeaks (Table 5.1.2) . Peak No.2 decreased with time while

Peak No.3 increased , so Peak No.2 might 'A stand asintermediate while Peak No.3 stand as the main product .The ratio between Peak No.2 & Peak No.3 nearly was 2:6 inall samples , thus the ratio of the ethoxy groups in the twopeaks was believed to be 2:6 respectively (Table 5.1.2).Therefore , the component of Peak No.2 was expected to betin(ii) ethoxide [Sn (OC2H5) ] and the component of thePeak No.3 was either a complex hexaethoxytin[Sn(OC2H5) ] or a dimer ditinnoxane [(OC2H5) 3-Sn-O-Sn(OC2H5)3]6
Sn (OC2H5) 2 + 4 C2H5OH •[Sn(OC2H5 V]6
Or
Sn (OC2H5)2 + 4 C2H5OH
[ (OC2H5)3-Sn-O-Sn (OC2H5) 3]
The test of solubility pointed out tinethoxidedissolved in ethanol and distilled water (Table 4.4.1). It waswhite solid , unmeltable until 340C (See 4.5 ,4.6) and itwas found that the variables time , temperature and speedof stir affected the amount of the product (Table 4.7.1 toTable 4.7.6).

Table 5.1.1. The Retention Time of Samples of the Reactionbetween Tin Metal and Ethanol Using Mercury (I)Chloride as Catalyst.
Sample
ABCDE
Time inhours
73784ProductD. Ethanol
Retention time (RT)
PeakNo.l1.21.31.51.11.7
PeakNo.210.010.211.010.010.8
PeakNo.312.112.613.312.312.9
Table 5.1.2. The Percent Area under the Peaks of Samples of theReaction between Tin Metal and Ethanol usingMercury (I) Chloride as Catalyst.
Sample
ABCDE
Time inhours
73784ProductD. Ethanol
Area %
PeakNo.l92.05792.42492.36591.67395.329
PeakNo.22.0821.7571.7171.9221.066
PeakNo.35.8615.8195.9306.4053.605
Ratio
Peak2: Peak3
2 : 62 : 62 : 62 : 61 :4
98

5.2. The Reaction between Stannic Chloride and Absolute
Ethanol
Stannic chloride was added to absolute ethanol, a white
fumes was appeared which was assumed to be hydrogen
chloride gas. Stannic chloride firstly dissolved in ethanol. The
system was refluxed for six hours, then the reaction mixture was
distilled into three fractions, (i), (ii), (in) . Fraction (in) was
white solid which believed to be the product. The three fractions
were analyzed using IR spectrum. Fraction (i) , which was
collected at the range 78-80°C was suggested to be ethanol.
Fraction(ii) ,which was collected at the range 90-120°C was un-
reacted stannic chloride, while fraction (111) which was
dissolved in absolute ethanol for analysis showed the existence
of (Sn-O) bond at wave numbers 1031 ,1000,990 cm-1 this
emphasis the formation of tin ethoxide [See Fig. 4.2.1 & Table
4.2.1] , [See Fig 4.2.2 & Table 4.2.2 ] and [See Fig 4.2.3 &
Table 4.2.3 ]. Thus stannic chloride could react with absolute
ethanol according to the following equation :
SnCU +4C2H5OH • Sn(OC2H5)4 +4HClt
On repeating the experiment using the similar amounts of
starting materials ,changing the variables time, speed of the
magnetic stirrer and temperature ,the growth of tin ethoxide was
99

followed with time by taking a sample periodically for analysis
by IR spectrum. The IR spectrum was taken at the range 845-
1250 cm-i [Fig.4.2.4.2 ] showed that the solid tin ethoxide had
more than fourteen small peaks. That small peaks were
interfered with (C-O) and (C-C) stretching peaks when the solid
dissolved in ethanol. The growth of the peaks was followed up
with time in the range 845-1250 cnr1. The number of the peaks
started growing on increasing the time . Thus, the formation of
tin ethoxide was directly proportional with time through this
method of reaction. The mechanism of the reaction was
suggested to be as that proposed for the reaction of silicon
chloride and ethanol as follows :
Et Cl Cl ,_H _ ? i i C 1
O > Sn (-HC1) O > Sn/ \
fH Cf\ Cl Et EtO Cl
EtO Cl EtO OEt
/ A ^ Q ^
and so on w Sn' x / \
EtO Cl EtO OEt
100
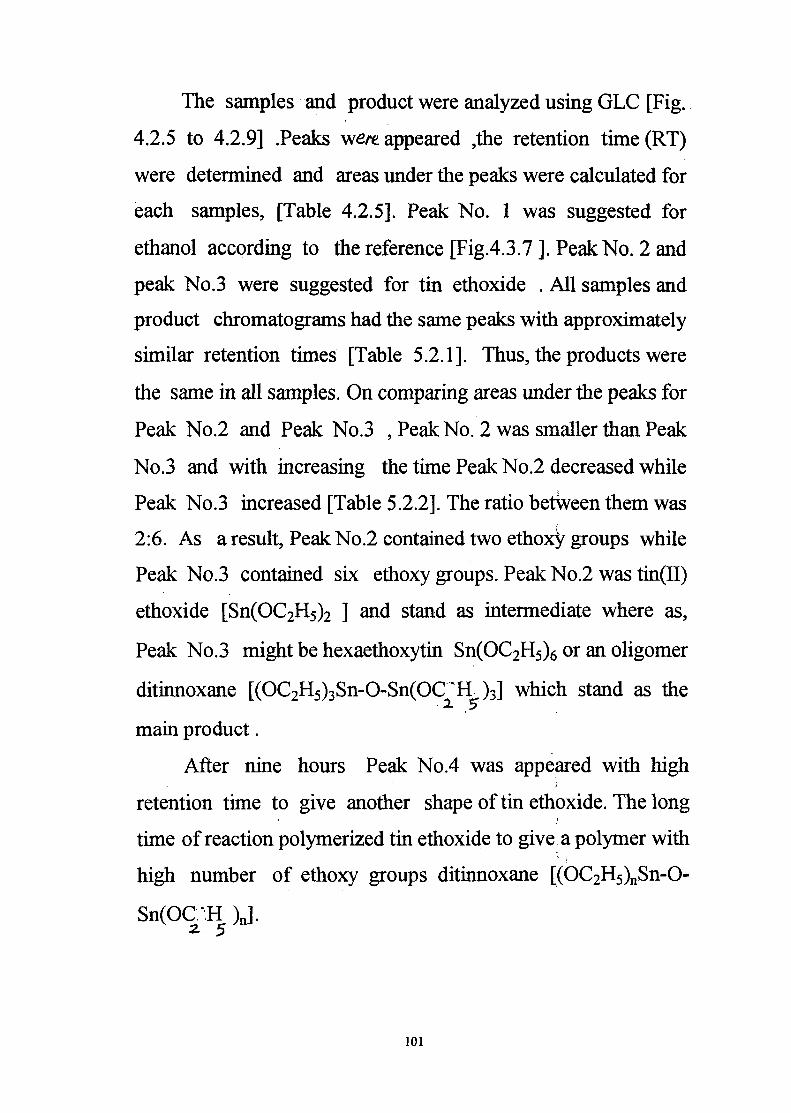
The samples and product were analyzed using GLC [Fig.
4.2.5 to 4.2.9] .Peaks we/* appeared 5the retention time(RT)
were determined and areas under the peaks were calculated for
each samples, [Table 4.2.5]. Peak No. 1 was suggested for
ethanol according to the reference [Fig.4.3.7 ]. Peak No. 2 and
peak No.3 were suggested for tin ethoxide . All samples and
product chromatograms had the same peaks with approximately
similar retention times [Table 5.2.1]. Thus, the products were
the same in all samples. On comparing areas under the peaks for
Peak No.2 and Peak No.3 , Peak No. 2 was smaller than Peak
No.3 and with increasing the time Peak No.2 decreased while
Peak No.3 increased [Table 5.2.2]. The ratio between them was
2:6. As a result, Peak No.2 contained two ethoxy groups while
Peak No.3 contained six ethoxy groups. Peak No.2 was tin(II)
ethoxide [Sn(OC2H5)2 ] and stand as intermediate where as,
Peak No.3 might be hexaethoxytin Sn(OC2H5)6 or an oligomer
ditinnoxane [(OC2H5)3Sn-O-Sn(OC *H )3] which stand as the
main product.
After nine hours Peak No.4 was appeared with high
retention time to give another shape of tin ethoxide. The long
time of reaction polymerized tin ethoxide to give a polymer with
high number of ethoxy groups ditinnoxane [(OC2H5)nSn-O-
Sn(OCJi
101
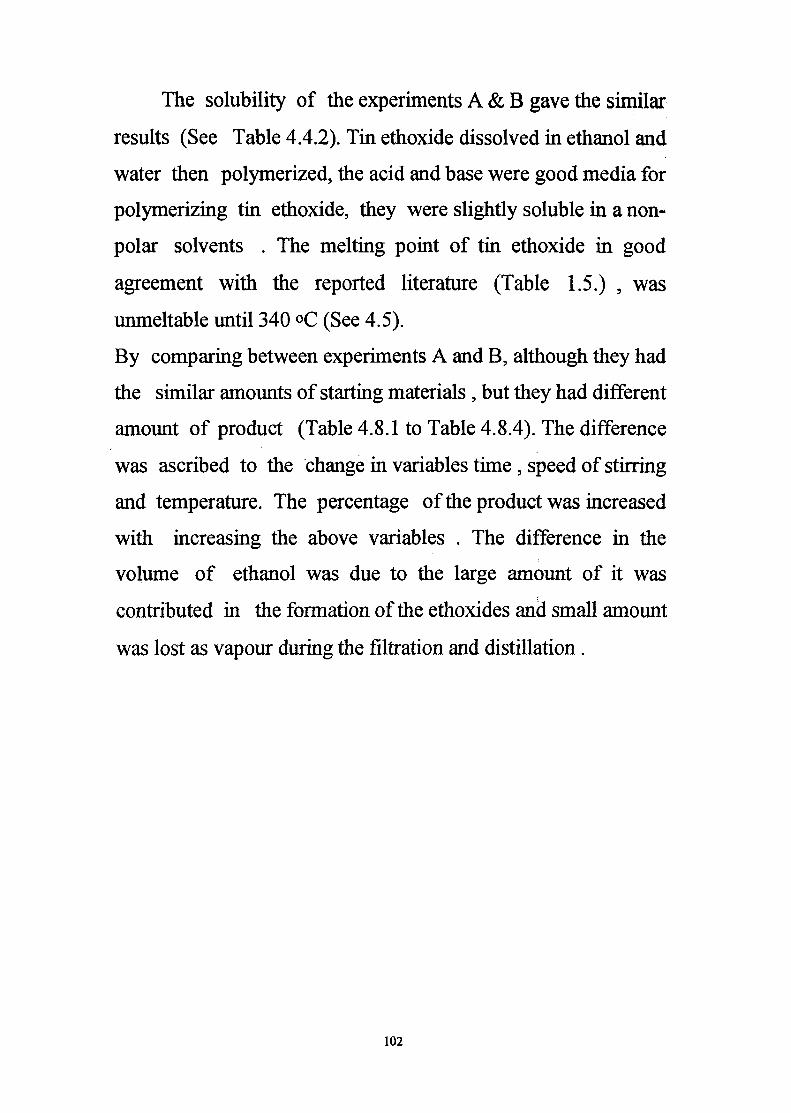
The solubility of the experiments A & B gave the similar
results (See Table 4.4.2). Tin ethoxide dissolved in ethanol and
water then polymerized, the acid and base were good media for
polymerizing tin ethoxide, they were slightly soluble in a non-
polar solvents . The melting point of tin ethoxide in good
agreement with the reported literature (Table 1.5.) , was
unmeltable until 340 °C (See 4.5).
By comparing between experiments A and B, although they had
the similar amounts of starting materials , but they had different
amount of product (Table 4.8.1 to Table 4.8.4). The difference
was ascribed to the change in variables time , speed of stirring
and temperature. The percentage of the product was increased
with increasing the above variables . The difference in the
volume of ethanol was due to the large amount of it was
contributed in the formation of the ethoxides and small amount
was lost as vapour during the filtration and distillation.
102

Table 5.2.1. The Retention Time of the Peaks of Samples of theReaction between Stannic Chloride and Ethanol.
Sample
FGHIProduct
Time inhours
3579 .
Retention time (RT)
PeakNo.l
1.21.21.51.71.2
PeakNo.2
10.710.010.810.710.2
PeakNo.3
12.912.313.112.2
12.6
PeakNo.4
• —
i - -
: - -
18.317.3
Table 5.2.2.The Percent Area under the Peaks of Samples ofthe Reaction between Stannic Chloride andEthanol.
Sample
FGHIJ product
Timeinhours
3579
Area %PeakNo.l
93.36791.72691.16371.31293.467
PeakNo.2
2.1321.8811.7012.0600.805
PeakNo.3
4.5016.3937.1365.0381.462
PeakNo.4
5.8884.266
PeakNo.5
———
15.702
RatioPeak2 : Peak3
2 : 62 : 62 : 72 : 5 : 6 : 1 52 : 2 : 6
103

5.3 ^he^Reftbtion between Sodium Ethoxide and Stannic
CKtorftfe in the presence of Ethanol
The first part of this reaction was to produce sodium
ethoxide through the reaction between sodium metal and
absolute ethanol according to the following equation :
Na C2H5OH •NaOC2H5 + 1/2 H 2 |
The system was refluxed to expel hydrogen gas .Samples
were taken periodically during reflux for analysis. After
stopping the reflux, the unreacted ethanol was separated and the
remainder was a yellow solution dissolved in small amount of
ethanol. Samples were analyzed using IR spectrum [Fig. 4.3.1. ]
and [Table 4.3.1. ] . (Na-O) stretching appeared at wave
numbers 1050 cm-1 and ( 960-940) cm-1.
The variation of (Na-O) with time was followed at the
range 845-1250 cm"1 [Fig. 4.33.1].The second part was the
reaction of the produced sodium ethoxide and stannic(iv)
chloride . An immediate white precipitate separated , it was
accompanied with white fumes. The system was refluxed to
expel the fumes and samples were taken for the analysis . After
the reflux the ethanol was separated and a white precipitate was
left. Samples and product were analyzed with IR spectrum [Fig.
4.3.35-]. (Sn-O) bond peaks appeared at wave numbers 1010,
104

995 cm"1 due to the formation of tin ethoxide also there was
small peak for (Na-O) ascribed to existence of unreacted sodium
ethoxide .The growth of the tin ethoxide was followed on
increasing time at the range 845-1250 cm-1 [See Fig 4.3.3.4]. A
sample from the first part ^preparation of sodium ethoxide, was
analyzed with GLC. The GLC chromatogram gave two peaks
[Fig.4.3.5 & Fig.4.3.6] and [Table 4.3.4]. Peak No.l was
attributed to the solvent ethanol according to the reference [Fig.
4.3.6]. Peak No.2 had the same retention time like that of
sodium ethoxide . Peak No.3 was due to the product tin(II)
ethoxide [Sn(OC2H5)2 ] and PeakNo.4 was due to hexaethoxytin
Sn(OC2H5)6 or an oligomer ditinnoxane [(OC2H5)3Sn-O-
Sn(OC2H5)3] . Peak No.5 appeared in the product due to the
formation of a polymer [Fig. 4.3.6] .The experiment with the
two parts was repeated. The final product in each had the same
solubility (See Table 4.4.5). The product was soluble in ethanol
and distilled water then polymerized. The product reacted with
acids and bases and it was endothermic . That meant it was not
only one product but also there was others.
105

According to the literature (Table 1.5) a complex of a
double alkoxide of NaSn2(OC2H5)9 was formed so the reaction
was occurred as follows :
NaOC2H5 + 2 SnCl4 C2H5O5 NaSn (OC2H5)9 +8 HCl
NaSn2(OC2H5)9+HCl A •NaCl + 2 Sn(OC2H5)4 +
C2H5OH
So that, the product was a mixture of NaSn2(OC2H5)9 ,
Sn(OC2H5) andNaCl .
106
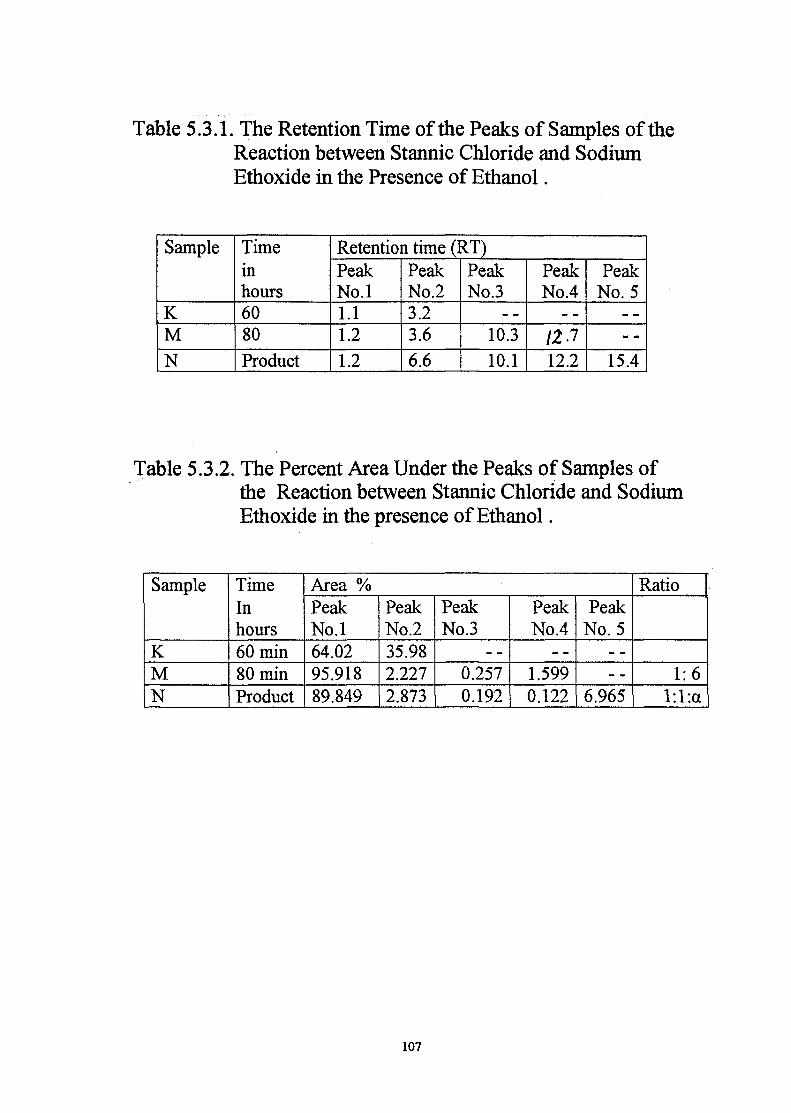
Table 5.3.1. The Retention Time of the Peaks of Samples of theReaction between Stannic Chloride and SodiumEthoxide in the Presence of Ethanol.
Sample
KM
N
Timeinhours6080
Product
Retention time (RT)PeakNo.l1.11.2
1.2
PeakNo.23.23.6
6.6
PeakNo.3
10.3
10.1
PeakNo.4
12.2
PeakNo. 5
15.4
Table 5.3.2. The Percent Area Under the Peaks of Samples ofthe Reaction between Stannic Chloride and SodiumEthoxide in the presence of Ethanol.
Sample
KMN
TimeInhours60 min80minProduct
Area %PeakNo.l64.0295.91889.849
PeakNo.235.982.2272.873
PeakNo.3
0.2570.192
PeakNo.4
—1.5990.122
PeakNo. 5
—
6.965
Ratio
1:6l:l:a
107
5.3. Comparison between Tin Ethoxides Produced by the
three Different Methods:
The tin ethoxide produced by method (3.3.1) required a
long time to form a small yield comparing it with the other
methods . Also the reaction needed high temperature in addition
to catalyst. Ethanol played two roles, solvent and one reagent.
The product was less than 10% (Table 5.4.3) but with high
purity. The tin ethoxide produced by method (3.3.2.) the time
was suitable to give a good yield, temperature Catalysed the
reaction. Ethanol was also used as a solvent and one reagent.
The product was less than 50% (Table 5.4.3.). The tin ethoxide
produced by method (3.3.3.) was obtained immediately and
didn't need catalyst. Ethanol used as solvent. The amount of the
product was more than 50% (Table 5.4.3.).
Tin ethoxide prepared by the three different methods was
white solid unmeltable and soluble in ethanol and distilled
water. The GLC analysis showed three peaks, Peak No. 1, had
similar retention time in the three products due to ethanol, also
peak No.2 had the similar retention time due to tin(II) ethoxide
Sn(OEt)2 and Peak No.3 had the similar retention times ascribed
to the main product (an oligomer of tin ethoxide (0Et)Sn-O3
Sn(OET)3 (Table 5.4.1,). The products of experiment (3.3.2.)
and (3.3.3.) had peak No.4 ascribed to the formation of polymer.
108

Peak No, £ appeared in product of experiment (3.3.3.) due
to a complex NaSn2(OEt)9. An oligomer of experiment (3.3.1)
showed high area under the peak comparing with that of
experiment (3.3.2) and (3.3.3.). The tin(II) ethoxide and the
oligomer of experiments (3.3.2) and (3.3.3.) transferred to
polymers which had the highest area under the peak (Table
3.4.2). Products of (3.3.1) and (3.3.2) containing oligomer of tin
ethoxide while the product of (3.3.3.) containing other products
with tin ethoxide.
109

Table 5.4.1. Comparison of Retention Time (RT) ofTin Ethoxides Produced by different methods
Product
PIP2P3
Retention time (RT)PeakNo.l1.11.21.2
PeakNo.210.010.210.1
PeakNo.3
12.312.612.2
PeakNo.4
17.315.4
PeakNo. 5
6.6
Table 5.4.2. Comparison of Percent Area Under Peaks of TinEthoxides Produced By different methods .
Product
PIPIP3
Area %PeakNo.l91.39691.48689.844
PeakNo.21.9161.0480.360
PeakNo.36.3851.9060.120
PeakNo.4
5.5606.850
PeakNo. 5
—2.826
Table 5.4.3.Comparison between the Percentage of Area Underthe peaks of Tin Ethoxides produced by different
methods .
Product
PIP2P3
Percentage(%)1-7.1537-41.0354.85 - 55.92
Less than 10%Less than 50%
More than 50%
110

Conclusion:
Tin ethoxide has been prepared usingthere different routes. The first route is thedirect synthesis by reacting tin element andliquid ethanol, the second route by reacting tintetra chloride with ethanol liquid and the thirdroute is reacting sodium ethoxide with tintetrachloride. All these reactions are carried outunder similar conditions . It has been foundthat the reaction between tin tetra chloride andliquid ethanol was more effective than otherroutes. This leading to a formation of highyield with high purity.
IR analysis showed that the finalreaction product was tin ethoxide and resultsobtained are in good agreement with allprevious work carried out in this departmentor else where . Also GLC analysis of finalreaction product agreed with IR data.

References:
(1) Okaware R. and Wade M. Advance in OrganometallicChemistry. 1967, vol 5, P.162.
(2) Ayllett B.J., Organometallic Compounds., John Wiley ,NewYork (1979),vol 1, part 2, P:57-75.
(3) Petrosyan V.S., Yashina N.S, Reutor O. A, Advances inOrganometallic Chemistry, (1976), Vol14, P: 84.
(4) BairlarJ.C., Emeleus HJ., Nyholm R., CompreheniveInorganic Chemistry, (c)A.F.Trotmen Dichensonfl973),vol(2), P: 53-69.
(5)The Encyclopedia of the Chemical Elements, Ed.Chifford A. Hampel, consulting chemical engineer,Skokie, illinos,(c)by Reinhold book corporation (1968).
(6)Sneed M. C, Brasted R. C, Comprehensive InorganicChemistry, The Elements and Compounds of Group(iv),
D. Van Nastarnd Company, INC (1958).
(7)Bradley D.C.,Mehrotra R.C. and GaurD.P., MetalAlkoxides ,Academicpress London-New york-Sanfrancisco(1978).
(8)Cotton F.A and Wilkinson G., Advanced InorganicChemistry, A comprehensive Text, Interscience publishers,Td edition 1966.
(9)Pereyre M., QuintardJ.P. and Rohm A., Tin in OrganicSynthesis, Butter worth andled. (publishers) ltd, 1st. ed.(1987) P:4. I
(10) Lee J.D, A New Concise Inorganic Chemistry, VanNostrand Rein Hold(UK) Co. ltd, 3rd.ed (1987) P:172.
HZ

(11) Coates G.E., Creen M.L, Wade K.,OrganicmetallicCompounds, Melthun and Colted London, 3rd ed. Vol (1)(1967),P:413. \
(12) Bradley D.C., J.Chemical Revms., (1989) vol 89, 6,1317.
(13)BryndazH.E. and Tom W. ,J. Chem. Reviews, (1988), VolI 7,1163.
(14)HarwoodJ.H, Industrial Applications of theOrganometallic Compounds, Reinhold publishingCorporation New York,lst.ed. (1963).P:303.
(15) Scheinmann F.,An Introduction to SpectfoscopicMethods for the Identification of Organic compound,Pergamon press, 1st .ed. vol(l), (1970) .
(16) Bellamy L.J., B.Sc. Ph.D., Advances in Infrared Groupfrequencies, Champman and Hall London, 1st ed. Vol (2)(1968) P:87.
(17)Finarl.L., Organic Chemistry, The FundamentalPrinciple, Richard clay, Fungay Suffolk, 5th ed,vol(l).(1967), P:155.
(18)Szymanski H.A., Infrared Band Hand Book, Plenum pressNew York, 1sted. (1964).
(19)Goodwin G.B. and Kenney M.E, JJnorg. Chem (1990).vol (29),6,1216.
(20)Atkins P.W., Physical Chemistry, 4th ed, (1990).
(21) Durrani P.J., M.A., Ph.D., General and InorganicChemistry ,3rd ed.,1964.
IIS

(22) Kolthoft I.M. and Elving P.J., Treatise on AnalyticalChemistry part 2, copy right (c)by Interscience publishInc., vol. 3, 1961.
(23)Smith A.L., Analysis of Silicons, Wiley London (1974).
(24)Szymanski H.A., Interpreted Infrared Spectra, Plenumpress data division, New York, vol(2),(1966).
(25)Davies M., Infrared Spectroscopy and MolecularStructures, elsewhere publishing company, AmsterdamLondon- New York 1963.
(26) Nakanishi K. Infra Red Absorption SpectroscopyPractical , Holden day Inc. San Francisco andMankodo company limited Tokyo 1964.
(27) Lorberth J. and Kula M. R, Chem.Ber. 97, 3444 1964.
(28) Bradley D.C., Caldwell E.Vand Wardlaw W., J.Chem,Soc, 1957 P:4775-4777.
(29)Rochow E.G, Hurd D.T. and LewisR.N., The Chemistryof Organometallic Compounds; John Wiley; New York1957 P:142-187.
(30)Jones R.A., An Introduction to Gas-liquidChromatography, Academic press London New York1970.
(31) Bradley D.C., Metal Alkoxides, Preparative InorganicReactions, W.L. Jolly Interscience publishers ,New York,vol. (2) 1960 P: 304.
(32)Bretzinger D., Josten W., Encyclopedia of ChemicalTechnoP.l-17.Technology, John Wiley New York, 3rd ed. Vol. (2) (1982)
114-

(33) Kleinberg, Angersinger and Griswold , InorganicChemistry, D.C, Health and Company, 1st ed, 1960P:370.
(34) Mahagoub N.S., Alkoxysilanes and Related CompoundsM.Sc, u, of K.1995. \
(35) kolthff I.M. and Elving P.J., Treatise on AnalyticalChemistry, (c) Inter science publish Inc, part 2, vol. (3)(1961).
(36) Elving G. W, Instrumental Methods of ChemicalAnalysis , Me Graw-Hill book company, (1985).
(37) Aust.J.Chem,20,773 (1967).
(38) Feibush .B.,SpailterL, J. Chem. Soc. P:115 (1971).
(39) Sienko M.J. and Plane R.A., Chemistry, MC Graw-Hillbook company Inc, 2nd ed. (1961).
(40) Newton W.E., Rochov E.G. , Inorganic Chemistry vol. 9,no:5, 1071 -1076 (1970).
(41) Mack.G.P., Patent U.S., 2,754, 820 (1956); Chem. Abstr.;6219 (1957).
(42)Sasin G.S.,J.org. chem.,18,1142 (1953).
(43) Davies A.G., Kleinschmidt D.C., Palan P.R. andVasishta S.C., J,Chem. Soc. 3972 (1971).
(44) Ingham R. K., Roseberg S.D.and Gilman H, Chem.Rev., 66,459(1969).
(45) Morrison and Boyd, Organic Chemistry 3rd ed. (1979).
(46) Ahmed .A.Y., Preparative of Significant metal Alkoxidesas Precursors for Ceramic, M.Sc, U of K, 1997.
(47)Parkes G.D., M.A., Phil.D, Melhr's Modern/Inorganic Chemistry , Western Printing Services LTDBristol (1961).
(48) Mohmed A I. Metal Alkoxides as Precursor For Ceramicmaterials , Desertification for B.Sc, U.of K, (1995).