TIMSS Physics Achievement Comparison...
46
TIMSS Physics Achievement Comparison Study Third International Mathematics and Science Study TIMSS International Study Center April 2000
Transcript of TIMSS Physics Achievement Comparison...

TIMSS Physics Achievement Comparison Study
Third InternationalMathematicsand Science
Study
TIMSS International Study Center
April 2000
For more information about this study contact:TIMSS International Study CenterLynch School of EducationCampion Hall Room 332Boston CollegeChestnut Hill, MA 02467United [email protected]
Funding for this study was provided by the U.S. National ScienceFoundation.
Funding for the international coordination of TIMSS is providedby the U.S. National Center for Education Statistics, the U.S.National Science Foundation, the IEA, and the Canadiangovernment. Each partipating country provides funding for thenational implementation of TIMSS.
TIM
SS P
hys
ics
Ach
ieve
men
t C
om
par
iso
n S
tud
y

1
Executive SummaryThe National Science Foundation (NSF) sponsors teacher enhancement and physics material development
programs. This study reports on how students in these programs perform on the Third International
Mathematics and Science Study (TIMSS) physics, and mathematics and science literacy tests, compared to
students in almost 20 countries.
Students in NSF-sponsored programs significantly outperformed physics students from the United States, and
two other countries (Czech Republic, Austria), and performed about the same as four countries (Latvia, Greece,
Canada and France). The significant gender difference, favoring boys, was approximately the same in the NSF-
sponsored physics programs and the United States. Students in the NSF-sponsored physics programs performed
significantly higher on both the science, and composite mathematics and science literacy tests than physics
students from the United States. Across the four content areas, the NSF-sponsored physics students were
stronger than the United States in mechanics, electricity and magnetism, and modern physics. They performed
about the same as United States physics students on the heat component of the TIMSS physics test.
Similar to the United States and many other countries, there was a clear relationship between parents’ education
and student achievement. However, within any particular level of parents’ education, students in the NSF-
sponsored physics programs significantly outperformed physics students in the United States. Sixty-five percent
of students in NSF-sponsored programs reported that at least one parent had finished university, compared with
55% for U.S. physics students in general.
Forty-five percent of the students in the NSF-sponsored physics programs reported receiving four or more hours
of physics instruction a week, compared with just 17% for physics students in general in the United States, and a
further 43%of the students reported receiving five or more hours of physics instruction per week.
While no clear relationship between amount of homework assigned and physics achievement was evident
across countries, the students in the NSF-sponsored physics programs who were assigned homework most
frequently outperformed other students.
Roughly equal proportions of students in the NSF-sponsored physics programs reported doing reasoning tasks
in most or every lesson. Those students who reported doing reasoning tasks every lesson outperformed students
who reported doing reasoning tasks most lessons by 36 points. A small percentage of students in the NSF
sponsored physics programs reported doing reasoning tasks some lessons, and these students had the lowest
achievement of the three categories to which these students responded.

2
Roughly 40% percentage of students in the NSF-sponsored physics programs reported doing experiments some
or most lessons, while 15% reported doing experiments every lesson, and 2% reported not doing any
experiments. The highest achievement was associated with those students who reported doing experiments in
only some lessons. The performance of these students was close to the international mean. These NSF students
outperformed NSF students who did experiments every lesson by 18 points, and those that did experiments
most lessons by 28 points.
The NSF-sponsored physics programs who reported using computers to solve exercises or problems in every
lesson performed 68 points lower that those that used the computer most lessons, and 47 points lower than those
that used the computer some lessons.
Most (95%) of the students in the NSF-sponsored physics programs reported intending to attend university. This
figure is comparable to the percentage reported by the United States students. Compared with the United States
students, the students in the NSF-sponsored programs indicated a preference for engineering, mathematics, or
computer/information science, and relatively fewer for the health sciences or related occupations.
3
IntroductionThe Goals 2000: Educate America Act states that United States students will be first in the world in
mathematics and science achievement by the year 2000. However, the Third International Mathematics and
Science Study (TIMSS), the largest, most comprehensive, and most rigorous international study of student
achievement ever undertaken, showed that United States high-school students are, on average, not leading, but
lagging the world in mathematics and science achievement, and ranked last in physics achievement by the final
year of secondary school.1 The release of the TIMSS reports has promoted, and in some cases instigated,
research for ways of reconciling widely held United States education goals and the low ranking of the United
States students at the middle-school and high school levels.
The National Science Foundation (NSF) has long recognized the need to develop innovative high school
science programs to enhance the science attainment by United States students and has been active in sponsoring
a range of teacher enhancement and material development programs directed to this end. Concerned at the low
performance in mathematics and physics of United States high school seniors, NSF commissioned the TIMSS
International Study Center at Boston College to administer the TIMSS twelfth-grade tests of physics and of
mathematics and science literacy to a sample of twelfth-grade students taught by teachers who had participated
in NSF-sponsored programs.
Comparing the performance of these students with United States twelfth-grade students in general, as well as
with final-year secondary school students in 16 other countries, should give some indication of the potential for
the NSF-sponsored programs to improve the teaching and learning of physics in our nation’s schools.
THE NSF-PHYSICS PROGRAMS AND THEIR STUDENTS
The NSF sponsors a range of teacher enhancement and physics material development programs. The NSF-
physics programs included in this study are led by physics education specialists from Arizona State University,
San Diego State University, University of Dallas, University of Massachusetts, University of Washington, and
Seminole County.2 The programs are offered to Physics teachers, who are invited to participate in them, and to
implement the programs in their classes.
1 Mullis, I. V. S., Martin, M. O., Beaton, A. E., Gonzalez, E. J., Kelly, D. L., and Smith, T. A. (1998) Mathematics and ScienceAchievement in the Final Year of Secondary School: IEA’s Third International Mathematics and Science Study, TIMSSInternational Study Center, Boston College, Chestnut Hill, MA.2 Further information about the specific programs can be obtained from Gerhard Salinger of the National Science Foundation.
4
The sample of students for the TIMSS testing was obtained by randomly sampling from all of the final-year
physics classes in 1999 that had been taught by a teacher who had participated in one of the NSF-sponsored
physics programs. A total of 23 classes were selected from the population of 185 classes, and 296 students were
administered the TIMSS physics test while 195 took the mathematics and science literacy tests.
WHAT IS TIMSS?
TIMSS is the third international comparative study of mathematics achievement and the third international
comparative study of science achievement carried out by the International Association for the Evaluation of
Educational Achievement (IEA). Previous IEA studies of mathematics and science were conducted for each
subject separately at various times during the 1960s, 1970s, and 1980s. TIMSS is the first IEA study that has
assessed both mathematics and science at the same time.
TIMSS was designed to focus on students at three different stages of schooling: midway through elementary
school, midway through secondary school, and at the end of upper secondary school. Initial findings for the 41
countries in the lower secondary school component, the 26 countries that participated in the elementary school
component, and for the 23 countries that participated in the final years of schooling component have been
reported in IEA publications3, and the Pursuing Excellence4 series within the United States.
TIMSS ASSESSMENTS AND NATURE OF THIS REPORT
The TIMSS assessments for the final years of secondary school were conducted in 1995 and focused on four
broad areas of performance:
• Mathematics literacy for all students in the final year of secondary education, including those who had
taken advanced mathematics and science courses;
• Science literacy for all students in the final year of secondary education, including those who had taken
advanced mathematics and science courses;
• Advanced mathematics for students in the final year of secondary education who had taken or were taking
advanced courses in mathematics;
3 The IEA TIMSS publications are available on the internet: http://isc.bc.edu/TIMSS1/TIMSSPublications.html4 Available for downloading at http://nces.ed.gov/timss/

5
• Physics for students in the final year of secondary education who had taken or were taking advanced
courses in physics.
This report presents achievement on the TIMSS physics test, for students in the NSF-sponsored physics
programs, and compares it with achievement in 1995 of physics students in 16 countries: Australia, Austria,
Canada, Cyprus, the Czech Republic, Denmark, France, Germany, Greece, Latvia, Norway, the Russian
Federation, Slovenia, Sweden, Switzerland, and the United States. Additionally, the performance on the TIMSS
tests of mathematics and science literacy of students in the NSF-sponsored physics programs is presented in
Appendix A, together with the performance of students from 21 countries: Australia, Austria, Canada, Cyprus,
the Czech Republic, Denmark, France, Germany, Hungary, Iceland, Italy, Lithuania, the Netherlands, New
Zealand, Norway, the Russian Federation, Slovenia, South Africa, Sweden, Switzerland, and the United States.
Achievement in Physics Content AreasThe physics test for final year students was designed to enable reporting by five content areas as well as for
physics overall. The physics content areas are:
• Mechanics
• Electricity and magnetism
• Heat
• Wave phenomena
• Modern physics: particle, quantum and astrophysics, and relativity
TIMSS is the most fair and accurate international comparison of students that has ever been undertaken. In each
country, the final year students that participated in TIMSS were randomly sampled to represent all students in
the final grade of high school. Martin and Kelly (eds.) (1998)5 describe the procedures and quality control
methods implemented for TIMSS, and duplicated for the present study, while Mullis, Martin, Beaton, Gonzalez,
Kelly and Smith (1998) describe the level of adherence to the rigorous sampling standards set by TIMSS.
WHAT WAS THE NATURE OF THE TIMSS 1995 PHYSICS SAMPLE?
The TIMSS 1995 physics study was designed to provide information about how well prepared the population of
school leavers that has taken physics is to pursue higher education or occupations in science. In all countries the
students participating in the physics testing had taken courses in physics and were in the final year of secondary
5 Martin, M. O. and Kelly, D. L. (eds.) (1998) Third International Mathematics and Science Study: Technical Report, Volume III:Implementation and Analysis, Final Year of Secondary School, TIMSS International Study Center, Boston College, ChestnutHill, MA.
6
school at the time of testing. However, the exact definition of the population varied across countries in terms of
which courses and how much physics the students had taken (see Mullis and others (1998) Appendix A for
more details).
TIMSS developed the Physics TIMSS Coverage Index (PTCI) to estimate the percentage of a country’s school-
leaving age cohort that has taken physics, as an indicator of the selectivity of the country’s physics students.
Table 1 confirms that in most of the TIMSS countries, physics in upper secondary school is taken by only a
small proportion of students. The PTCI was low in Norway (8%), and particularly low in Denmark (3%), Latvia
(3%), and the Russian Federation (1.5%) indicating that physics students in these countries are a very select
group. In contrast, in Slovenia and in Austria, about one third of the school-leaving age cohort takes physics. A
number of countries had PTCI’s about the same as the United States (15%). These countries include: Australia,
Canada, Czech Republic, France, Sweden, and Switzerland.
HOW DOES THE PHYSICS PERFORMANCE OF STUDENTS IN NSF PHYSICS PROGRAMS
COMPARE WITH STUDENTS INTERNATIONALLY?
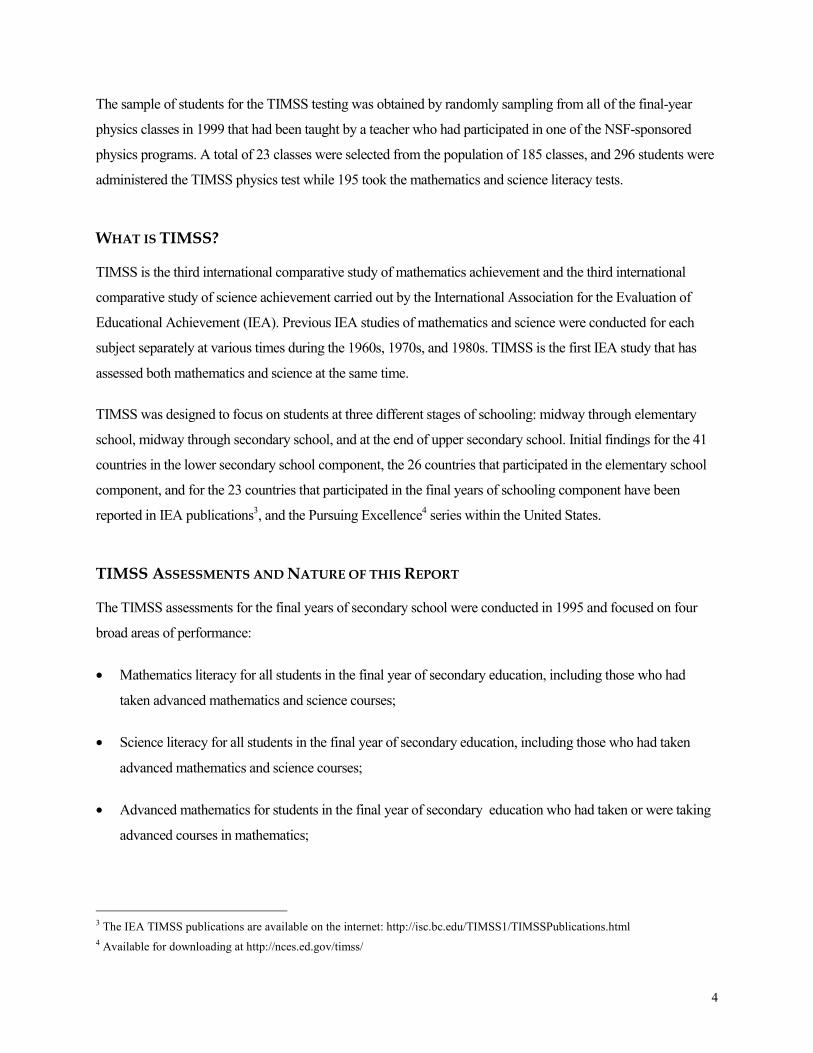
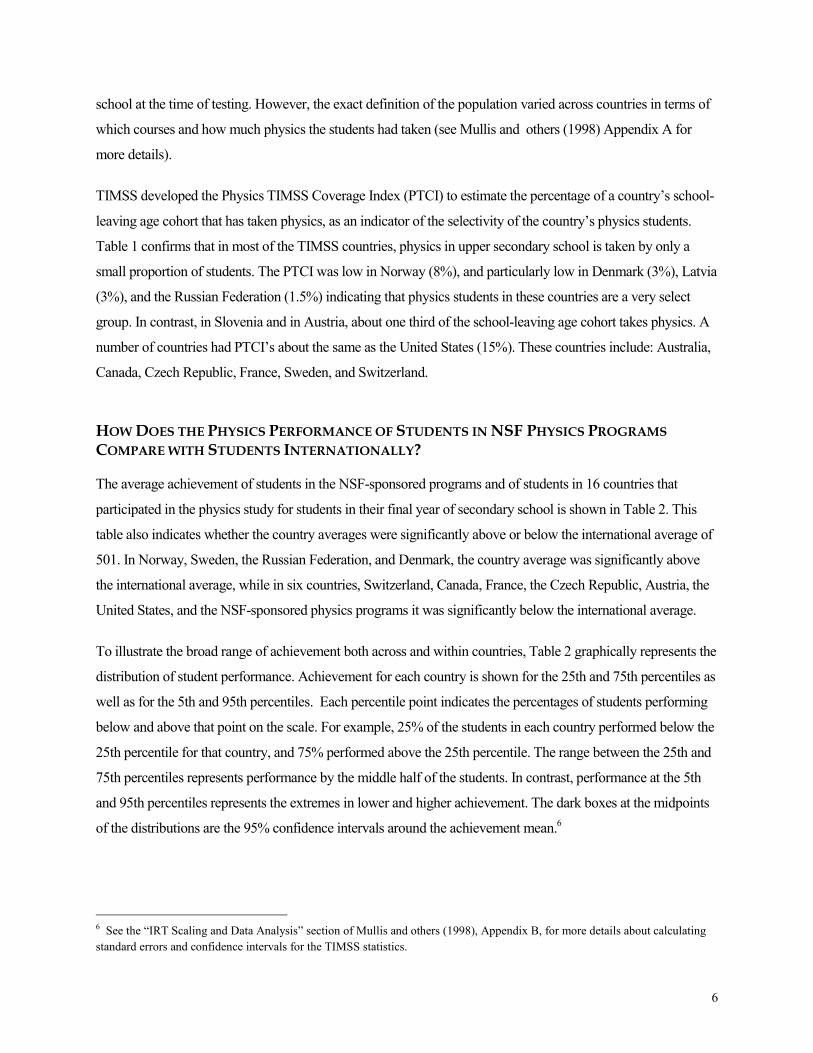
The average achievement of students in the NSF-sponsored programs and of students in 16 countries that
participated in the physics study for students in their final year of secondary school is shown in Table 2. This
table also indicates whether the country averages were significantly above or below the international average of
501. In Norway, Sweden, the Russian Federation, and Denmark, the country average was significantly above
the international average, while in six countries, Switzerland, Canada, France, the Czech Republic, Austria, the
United States, and the NSF-sponsored physics programs it was significantly below the international average.
To illustrate the broad range of achievement both across and within countries, Table 2 graphically represents the
distribution of student performance. Achievement for each country is shown for the 25th and 75th percentiles as
well as for the 5th and 95th percentiles. Each percentile point indicates the percentages of students performing
below and above that point on the scale. For example, 25% of the students in each country performed below the
25th percentile for that country, and 75% performed above the 25th percentile. The range between the 25th and
75th percentiles represents performance by the middle half of the students. In contrast, performance at the 5th
and 95th percentiles represents the extremes in lower and higher achievement. The dark boxes at the midpoints
of the distributions are the 95% confidence intervals around the achievement mean.6
6 See the “IRT Scaling and Data Analysis” section of Mullis and others (1998), Appendix B, for more details about calculatingstandard errors and confidence intervals for the TIMSS statistics.

Table 1TIMSS Coverage Indices (TCIs) for Physics
Country TIMSS Coverage Index (TCI)*
Sample Exclusions
Others NotCovered
Percentage of Students in Sample
Having Taken Physics
TIMSS Coverage Index for Physics
(PTCI)*
Australia 68.1% 4.0% 27.9% 18.5% 12.6% Austria 75.9% 16.8% 7.3% 43.5% 33.1% Canada 70.3% 6.8% 22.9% 19.4% 13.7% Cyprus 47.9% 13.5% 38.6% 18.5% 8.8% Czech Republic 77.6% 5.0% 17.4% 14.1% 11.0% Denmark 57.7% 1.3% 41.0% 5.5% 3.2% France 83.9% 0.9% 15.3% 23.8% 19.9% Germany 75.3% 9.6% — 11.2% 8.4%
1 Greece 10.0% 56.8% 33.2% — 10.0% 2 Latvia 3.0% 16.8% 80.3% — 3.0%
Lithuania 42.5% 0.0% 57.5% — —Norway 84.0% 3.3% 12.7% 10.0% 8.4% Russian Federation 48.1% 36.3% 15.7% 3.2% 1.5% Slovenia 87.8% 5.6% 6.6% 43.9% 38.6% Sweden 70.6% 0.2% 29.2% 23.1% 16.3% Switzerland 81.9% 2.1% 16.0% 17.3% 14.2% United States 63.1% 2.5% 34.5% 22.9% 14.5%
† PTCI: Estimated percentage of school-leaving age cohort covered by TIMSS sample of physics students. See Mullis and others, 1998 Appendix A for characteristics of students sampled and Mullis and others, 1998 Appendix B for details about the PTCI.
1 Greece sampled only students having taken advanced mathematics and physics.2 Latvia sampled only students having taken physics.
Note: Hungary, Iceland, the Netherlands, New Zealand, and South Africa did not participate in the advanced mathematics and physics testing.Norway did not participate in the advanced mathematics testing and Lithuania did not participate in the physics testing.
Table 2Distributions of Physics Achievement for Students Having Taken PhysicsFinal Year of Secondary School*
Country PTCI‡ Average Age
† Norway ▲ 581 (6.5) 8% 19.0 Sweden ▲ 573 (3.9) 16% 18.9 2 Russian Federation ▲ 545 (11.6) 2% 16.9 † Germany ● 522 (11.9) 8% 19.1 2 Cyprus ● 494 (5.8) 9% 17.7 1 Latvia (LSS) ● 488 (21.5) 3% 18.0 Switzerland ▼ 488 (3.5) 14% 19.5 † Greece ● 486 (5.6) 10% 17.7 Canada ▼ 485 (3.3) 14% 18.6 NSF Physics Programs ▼ 475 (1.2) – 17.9 France ▼ 466 (3.8) 20% 18.2 Czech Republic ▼ 451 (6.2) 11% 18.1
Australia ● 518 (6.2) 13% 17.7 2 Austria ▼ 435 (6.4) 33% 19.1 United States ▼ 423 (3.3) 14% 18.0
Denmark ▲ 534 (4.2) 3% 19.1 Slovenia ● 523 (15.5) 39% 18.8
International Average = 501Average of all country means
▲ Country mean significantly higher than international mean
▼ Country mean significantly lower than international mean
●
* See Mullis and others, 1998 Appendix A for characteristics of the students sampled.‡
Because population coverage falls below 65%, Latvia is annotated LSS for Latvian Speaking Schools only.† Met guidelines for sample participation rates only after replacement schools were included (see Mullis and others, 1998 Appendix B for details).1 National Desired Population does not cover all of International Desired Population (see Mullis and others, 1998 Table B.4).2 National Defined Population covers less than 90 percent of National Desired Population (see Mullis and others, 1998 Table B.4).
( ) Standard errors appear in parentheses. Because results are rounded to the nearest whole number, some totals may appear inconsistent.
The Physics TIMSS Coverage Index (PTCI) is an estimate of the percentage of the school-leaving age cohort covered by the TIMSS final-year physics student sample (see Mullis and others, 1998 Appendix B for more information).
Mean Physics Scale Score
Countries Not Satisfying Guidelines for Sample Participation Rates(See Appendix B for Details)
Countries With Unapproved Sampling Procedures and Low Participation Rates (See Appendix B for Details)
No statistically significant difference between country mean and international mean
200 250 300 350 400 450 500 550 600 650 700 750 800
5th 25th 75th 95th
Mean and Confidence Interval (±2SE)
Percentiles of Performance

9
Comparisons can be made across the means and percentiles. For example, the NSF-sponsored physics programs
have a greater range than the United States. While the 5th percentile for the NSF-sponsored programs is
approximately the same as the United States, the 95th percentile for the NSF-sponsored physics programs is
almost 75 points higher than the comparable percentile for the United States.
Figure 1 allows comparison of overall mean achievement between countries.7 It shows whether or not the
differences in mean achievement between pairs of countries are statistically significant. Selecting a country of
interest and reading across the table, a triangle pointing up indicates significantly higher performance than the
country listed across the top, a dot indicates no significant difference, and a triangle pointing down indicates
significantly lower performance.
In terms of average physics achievement, students in the NSF-sponsored programs performed worse than nine
countries: Norway, Sweden, Russian Federation, Denmark, Slovenia, Germany, Australia, Cyprus and
Switzerland. The NSF-sponsored physics programs students performed about the same as students in Latvia,
Greece, Canada, and France, and better than students in the Czech Republic, Austria and the United States.
HOW DOES PERFORMANCE IN PHYSICS COMPARE BY GENDER?
Table 3, which shows the differences in physics achievement by gender, reveals that males had significantly
higher achievement than females in all but one of the participating countries. The table presents mean physics
achievement separately for males and females for each country, as well as the difference between the means.
The gender difference for each country, shown by a bar, indicates the amount of the difference, whether the
direction of difference favors females or males, and whether the difference was statistically significant (a
darkened bar). Only in Latvia (LSS) was the average physics score for males not significantly greater than that
for females, and this may have been partly the result of a larger than usual sampling variance. The gender
difference in achievement for students in the NSF-sponsored physics programs was significant and
approximately the same as for students in Australia, Cyprus and Denmark. More males than females were
involved in the NSF-sponsored physics program, and these males outperformed female students on average by
41 points. In the United States, male physics students significantly out-performed female physics students by 33
points.
7 The significant tests in Figure 1 are based on a Bonferroni procedure for multiple comparisons that holds to 5% the probabilityof erroneously declaring the mean of one country to be different from that of another country.

Figure 1Multiple Comparisons of Physics Achievement for StudentsHaving Taken Physics – Final Year of Secondary School*
No
rway
Swed
en
Russ
ian
Fede
ratio
n
Den
mar
k
Slov
enia
Ger
man
y
Aus
tral
ia
Cyp
rus
Swit
zerl
and
Latv
ia (
LSS)
Gre
ece
Can
ada
NSF
Ph
ysic
s Pr
og
ram
s
Fran
ce
Cze
ch R
epu
blic
Aus
tria
Uni
ted
Stat
es
Norway ● ● ▲ ▲ ▲ ▲ ▲ ▲ ▲ ▲ ▲ ▲ ▲ ▲ ▲ ▲
Sweden ● ● ▲ ▲ ▲ ▲ ▲ ▲ ▲ ▲ ▲ ▲ ▲ ▲ ▲ ▲
Russian Federation ● ● ● ● ● ● ▲ ▲ ● ▲ ▲ ▲ ▲ ▲ ▲ ▲
Denmark ▼ ▼ ● ● ● ● ▲ ▲ ● ▲ ▲ ▲ ▲ ▲ ▲ ▲
Slovenia ▼ ▼ ● ● ● ● ● ● ● ● ● ▲ ▲ ▲ ▲ ▲
Germany ▼ ▼ ● ● ● ● ● ● ● ● ▲ ▲ ▲ ▲ ▲ ▲
Australia ▼ ▼ ● ● ● ● ● ▲ ● ▲ ▲ ▲ ▲ ▲ ▲ ▲
Cyprus ▼ ▼ ▼ ▼ ● ● ● ● ● ● ● ▲ ▲ ▲ ▲ ▲
Switzerland ▼ ▼ ▼ ▼ ● ● ▼ ● ● ● ● ▲ ▲ ▲ ▲ ▲
Latvia (LSS) ▼ ▼ ● ● ● ● ● ● ● ● ● ● ● ● ● ▲
Greece ▼ ▼ ▼ ▼ ● ● ▼ ● ● ● ● ● ▲ ▲ ▲ ▲
Canada ▼ ▼ ▼ ▼ ● ▼ ▼ ● ● ● ● ● ▲ ▲ ▲ ▲
NSF Physics Programs ▼ ▼ ▼ ▼ ▼ ▼ ▼ ▼ ▼ ● ● ● ● ▲ ▲ ▲
France ▼ ▼ ▼ ▼ ▼ ▼ ▼ ▼ ▼ ● ▼ ▼ ● ● ▲ ▲
Czech Republic ▼ ▼ ▼ ▼ ▼ ▼ ▼ ▼ ▼ ● ▼ ▼ ▼ ● ● ▲
Austria ▼ ▼ ▼ ▼ ▼ ▼ ▼ ▼ ▼ ● ▼ ▼ ▼ ▼ ● ●
United States ▼ ▼ ▼ ▼ ▼ ▼ ▼ ▼ ▼ ▼ ▼ ▼ ▼ ▼ ▼ ●
Countries are ordered by mean achievement across the heading and down the rows.
▲ ● ▼
* See Mullis and others, 1998 Appendix A for characteristics of the students sampled.‡ Statistically significant at .05 level, adjusted for multiple comparisons.
Countries shown in italics did not satisfy one or more guidelines for sample participation rates or student sampling (see Mullis and others, 1998 Figure B.6).Because population coverage falls below 65%, Latvia is annotated LSS for Latvia Speaking School only.
Instructions: Read across the row for a country to compare performance with the countries listed in the heading of the chart. The symbols indicate whether the mean achievement of the country in the row is significantly lower than that of the comparison country, significantly higher than that of the comparison country, or if there is no statistically significant difference between the two countries.‡
Mean achievement significantly higher than comparison country
No statistically significant difference from comparison country
Mean achievement significantly lower than comparison country
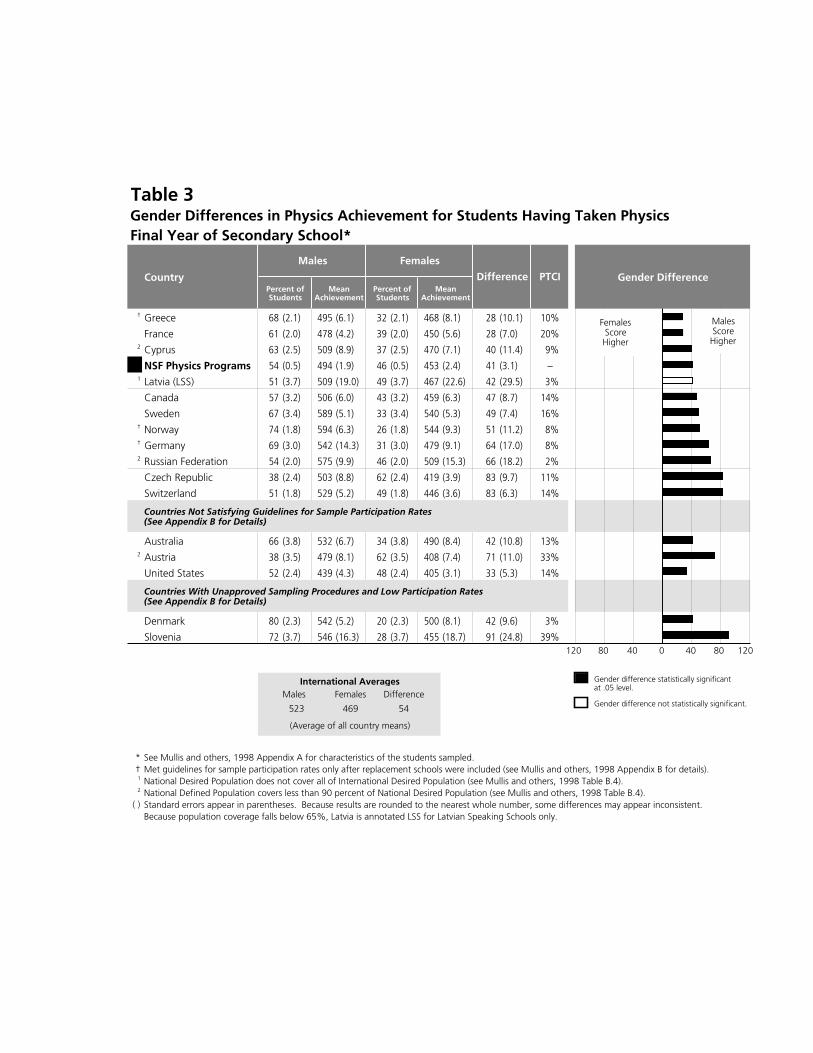
Table 3Gender Differences in Physics Achievement for Students Having Taken PhysicsFinal Year of Secondary School*
† Greece 68 (2.1) 495 (6.1) 32 (2.1) 468 (8.1) 28 (10.1) 10% France 61 (2.0) 478 (4.2) 39 (2.0) 450 (5.6) 28 (7.0) 20% 2 Cyprus 63 (2.5) 509 (8.9) 37 (2.5) 470 (7.1) 40 (11.4) 9% NSF Physics Programs 54 (0.5) 494 (1.9) 46 (0.5) 453 (2.4) 41 (3.1) –1 Latvia (LSS) 51 (3.7) 509 (19.0) 49 (3.7) 467 (22.6) 42 (29.5) 3% Canada 57 (3.2) 506 (6.0) 43 (3.2) 459 (6.3) 47 (8.7) 14% Sweden 67 (3.4) 589 (5.1) 33 (3.4) 540 (5.3) 49 (7.4) 16% † Norway 74 (1.8) 594 (6.3) 26 (1.8) 544 (9.3) 51 (11.2) 8% † Germany 69 (3.0) 542 (14.3) 31 (3.0) 479 (9.1) 64 (17.0) 8% 2 Russian Federation 54 (2.0) 575 (9.9) 46 (2.0) 509 (15.3) 66 (18.2) 2% Czech Republic 38 (2.4) 503 (8.8) 62 (2.4) 419 (3.9) 83 (9.7) 11% Switzerland 51 (1.8) 529 (5.2) 49 (1.8) 446 (3.6) 83 (6.3) 14%
Australia 66 (3.8) 532 (6.7) 34 (3.8) 490 (8.4) 42 (10.8) 13% 2 Austria 38 (3.5) 479 (8.1) 62 (3.5) 408 (7.4) 71 (11.0) 33% United States 52 (2.4) 439 (4.3) 48 (2.4) 405 (3.1) 33 (5.3) 14%
Denmark 80 (2.3) 542 (5.2) 20 (2.3) 500 (8.1) 42 (9.6) 3% Slovenia 72 (3.7) 546 (16.3) 28 (3.7) 455 (18.7) 91 (24.8) 39%
Males Females Difference 523 469 54
* See Mullis and others, 1998 Appendix A for characteristics of the students sampled.† Met guidelines for sample participation rates only after replacement schools were included (see Mullis and others, 1998 Appendix B for details).1 National Desired Population does not cover all of International Desired Population (see Mullis and others, 1998 Table B.4).2 National Defined Population covers less than 90 percent of National Desired Population (see Mullis and others, 1998 Table B.4).
( ) Standard errors appear in parentheses. Because results are rounded to the nearest whole number, some differences may appear inconsistent.Because population coverage falls below 65%, Latvia is annotated LSS for Latvian Speaking Schools only.
Gender DifferenceCountryPercent of Students
Mean Achievement
Males
Percent of Students
Mean Achievement
PTCI
Females
Difference
International Averages
(Average of all country means)
Countries Not Satisfying Guidelines for Sample Participation Rates (See Appendix B for Details)
Countries With Unapproved Sampling Procedures and Low Participation Rates (See Appendix B for Details)
MalesScoreHigher
FemalesScoreHigher
120 1208080 4040 0
Gender difference statistically significant at .05 level.
Gender difference not statistically significant.

12
HOW WELL DID STUDENTS HAVING TAKEN PHYSICS PERFORM IN MATHEMATICS AND
SCIENCE LITERACY?
Table 4 compares the performance of students having taken physics with the performance of final-year students
in general on the TIMSS science literacy test, and on the composite mathematics and science literacy test. It is
clear from this table that students having taken physics generally have high levels of mathematics and science
literacy. For example, physics students in the United States had an average score of 553 compared to 480 for
students in the United States in general. As might be expected, there was a tendency for achievement differences
to be greatest in countries where the coverage index was least. The science literacy difference between all
students and physics students ranged from 49 in Slovenia (PTCI of 39%) to 124 in Norway (PTCI of 8%).
The students in the NSF-sponsored physics programs performed approximately 40 points higher than physics
students in the United States on both the science literacy and the composite mathematics and science literacy
tests. The students in the NSF-sponsored physics programs performed at about the international average for
physics students.
HOW DOES PERFORMANCE COMPARE ACROSS CONTENT AREAS?
As well as scaling the complete physics item pool to obtain an overall physics scale, TIMSS scaled each of the
five physics content areas separately to facilitate analyses at the content level. Table 5 summarizes the country
means and standard errors on each content scale for each country, and also provides the Physics TIMSS
Coverage Index. Not surprising given their performance on the physics tests overall, students in the NSF-
sponsored physics programs performed below the international average in each of the five content areas.
However, they outperformed physics students in the United States in mechanics and wave phenomena by at
least 40 points, and by over 30 points in modern physics. The students in the NSF-sponsored programs
performed roughly the same as the United States students in the heat content area. In their weakest content area,
electricity and magnetism, the NSF-sponsored programs students still outperformed the United States students
by 26 points.
Figure 2 graphically depicts each country’s strengths and weaknesses in the physics content areas compared
with their average performance across all five content areas. The horizontal line indicates each country’s overall
average achievement in physics, and the five darkened boxes indicate the 95% confidence intervals around the
mean achievement in each of the five content areas. If the darkened box is below the line, then the country
performed significantly less well in that content area than it did overall. Similarly, if the darkened box is above
the line, then the country performed significantly better in that content area than it did overall.

Table 4
NSF Physics Programs – – 587 (3.6) – – 595 (4.1) – –
Canada 526 (2.6) 594 (5.5) 532 (2.6) 596 (5.5) 70% 14% 1 Cyprus 447 (2.5) 521 (6.1) 448 (3.0) 526 (6.2) 48% 9% Czech Republic 476 (10.5) 582 (7.2) 487 (8.8) 591 (6.8) 78% 11% France 505 (4.9) 572 (5.0) 487 (5.1) 553 (4.9) 84% 20% † Germany 496 (5.4) 591 (7.3) 497 (5.1) 586 (7.5) 75% 8% † Norway 536 (4.0) 658 (6.7) 544 (4.1) 668 (8.0) 84% 8% Sweden 555 (4.3) 664 (3.7) 559 (4.4) 668 (4.1) 71% 16% Switzerland 531 (5.4) 618 (4.2) 523 (5.3) 617 (4.5) 82% 14%
Australia 525 (9.5) 610 (7.7) 527 (9.8) 610 (8.9) 68% 13% 1 Austria 519 (5.4) 567 (5.9) 520 (5.6) 570 (6.2) 76% 33% United States 471 (3.1) 548 (5.2) 480 (3.3) 553 (5.7) 63% 14%
Denmark 528 (3.2) 610 (6.7) 509 (3.6) 592 (7.3) 58% 3% Slovenia 514 (8.2) 563 (8.0) 517 (8.2) 566 (8.7) 88% 39%
International Average 510 (1.6) 592 (1.7) 510 (1.6) 592 (1.8)
† Met guidelines for sample participation rates only after replacement schools were included (see Mullis and others, 1998 Appendix B for details).
1 National Defined Population covers less than 90 percent of National Desired Population (see Mullis and others, 1998 Table B.4).( )
Greece did not test the population of all students in their final year of secondary school.Because population coverage falls below 65%, Latvia is annotated LSS for Latvian Speaking Schools only.
Comparison Between All Students in Their Final Year of Secondary School and Final-Year Students Having Taken Physics in Mathematics and Science Literacy
Standard errors appear in parentheses. Because results are rounded to the nearest whole number, some totals may appear inconsistent.
Physics TCICountry
Physics Students
Overall TCI
Mean Achievement
Mathematics and Science Literacy Science Literacy
The procedures used by Latvia (LSS) and Russian Federation do not permit estimating literacy achievement for students taking physics.
Countries Not Satisfying Guidelines for Sample Participation Rates (See Appendix B for Details)
Countries With Unapproved Sampling Procedures and Low Participation Rates (See Appendix B for Details)
All Students Physics Students
All Students
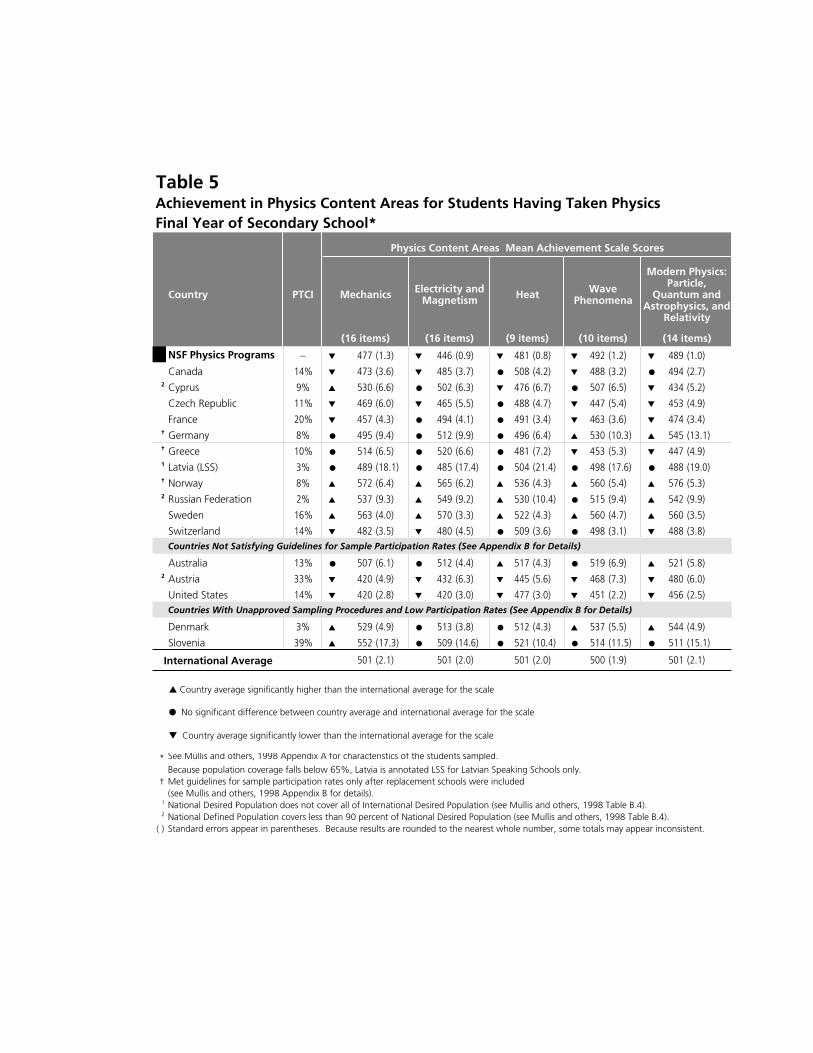
Table 5Achievement in Physics Content Areas for Students Having Taken PhysicsFinal Year of Secondary School*
Country PTCI
(16 items) (16 items) (9 items) (10 items) (14 items)
NSF Physics Programs – ▼ 477 (1.3) ▼ 446 (0.9) ▼ 481 (0.8) ▼ 492 (1.2) ▼ 489 (1.0) Canada 14% ▼ 473 (3.6) ▼ 485 (3.7) ● 508 (4.2) ▼ 488 (3.2) ● 494 (2.7) 2 Cyprus 9% ▲ 530 (6.6) ● 502 (6.3) ▼ 476 (6.7) ● 507 (6.5) ▼ 434 (5.2) Czech Republic 11% ▼ 469 (6.0) ▼ 465 (5.5) ● 488 (4.7) ▼ 447 (5.4) ▼ 453 (4.9) France 20% ▼ 457 (4.3) ● 494 (4.1) ● 491 (3.4) ▼ 463 (3.6) ▼ 474 (3.4) † Germany 8% ● 495 (9.4) ● 512 (9.9) ● 496 (6.4) ▲ 530 (10.3) ▲ 545 (13.1) † Greece 10% ● 514 (6.5) ● 520 (6.6) ● 481 (7.2) ▼ 453 (5.3) ▼ 447 (4.9) 1 Latvia (LSS) 3% ● 489 (18.1) ● 485 (17.4) ● 504 (21.4) ● 498 (17.6) ● 488 (19.0) † Norway 8% ▲ 572 (6.4) ▲ 565 (6.2) ▲ 536 (4.3) ▲ 560 (5.4) ▲ 576 (5.3) 2 Russian Federation 2% ▲ 537 (9.3) ▲ 549 (9.2) ▲ 530 (10.4) ● 515 (9.4) ▲ 542 (9.9) Sweden 16% ▲ 563 (4.0) ▲ 570 (3.3) ▲ 522 (4.3) ▲ 560 (4.7) ▲ 560 (3.5) Switzerland 14% ▼ 482 (3.5) ▼ 480 (4.5) ● 509 (3.6) ● 498 (3.1) ▼ 488 (3.8)
Australia 13% ● 507 (6.1) ● 512 (4.4) ▲ 517 (4.3) ● 519 (6.9) ▲ 521 (5.8)2 Austria 33% ▼ 420 (4.9) ▼ 432 (6.3) ▼ 445 (5.6) ▼ 468 (7.3) ▼ 480 (6.0) United States 14% ▼ 420 (2.8) ▼ 420 (3.0) ▼ 477 (3.0) ▼ 451 (2.2) ▼ 456 (2.5)
Denmark 3% ▲ 529 (4.9) ● 513 (3.8) ● 512 (4.3) ▲ 537 (5.5) ▲ 544 (4.9) Slovenia 39% ▲ 552 (17.3) ● 509 (14.6) ● 521 (10.4) ● 514 (11.5) ● 511 (15.1)
International Average 501 (2.1) 501 (2.0) 501 (2.0) 500 (1.9) 501 (2.1)
*Because population coverage falls below 65%, Latvia is annotated LSS for Latvian Speaking Schools only.
† Met guidelines for sample participation rates only after replacement schools were included (see Mullis and others, 1998 Appendix B for details).
1 National Desired Population does not cover all of International Desired Population (see Mullis and others, 1998 Table B.4).2 National Defined Population covers less than 90 percent of National Desired Population (see Mullis and others, 1998 Table B.4).
( ) Standard errors appear in parentheses. Because results are rounded to the nearest whole number, some totals may appear inconsistent.
Countries With Unapproved Sampling Procedures and Low Participation Rates (See Appendix B for Details)
See Mullis and others, 1998 Appendix A for characteristics of the students sampled.
Countries Not Satisfying Guidelines for Sample Participation Rates (See Appendix B for Details)
Physics Content Areas Mean Achievement Scale Scores
Mechanics Electricity and Magnetism Heat Wave
Phenomena
Modern Physics: Particle,
Quantum and Astrophysics, and
Relativity
▲ Country average significantly higher than the international average for the scale
▼ Country average significantly lower than the international average for the scale
● No significant difference between country average and international average for the scale

Figure 2
Country
Ph
ysic
s TC
I
Mec
han
ics
Ele
ctri
city
an
d
Mag
net
ism
Hea
t
Wav
e Ph
eno
men
a
Mo
der
n P
hys
ics
Country
Ph
ysic
s TC
I
Mec
han
ics
Ele
ctri
city
an
d
Mag
net
ism
Hea
t
Wav
e Ph
eno
men
a
Mo
der
n P
hys
ics
NSF Physics Programs – † Greece 10%
Canada 14% 1 Latvia (LSS) 3%
2 Cyprus 9% † Norway 8%
Czech Republic 11% 2 Russian Federation 2%
France 20% Sweden 16%
† Germany 8% Switzerland 14%
Mec
han
ics
Elec
tric
ity
and
M
agn
etis
m
Hea
t
Wav
e Ph
eno
men
a
Mo
der
n P
hys
ics
* See Mullis and others, 1998 Appendix A for characteristics of students sampled.Because population coverage falls below 65%, Latvia is annotated LSS for Latvia Speaking School only.
† Met guidelines for sample participation rates only after replacement schools were included (see Mullis and others, 1998 Appendix B for details).1 National Desired Population does not cover all of International Desired Population (see Mullis and others, 1998 Table B.4).2 National Defined Population covers less than 90 percent of National Desired Population (see Mullis and others, 1998 Table B.4).
Profiles of Performance in Physics Content Areas for Students Having Taken Physics Final Year of Secondary School*
Legend
-80
-40
0
40
80
-80
-40
0
40
80
-80
-40
0
40
80
-80
-40
0
40
80
-80
-40
0
40
80
-80
-40
0
40
80
-80
-40
0
40
80
-80
-40
0
40
80
-80
-40
0
40
80
-80
-40
0
40
80
-80
-40
0
40
80
-80
-40
0
40
80
-80
-40
0
40
80
Dif
fere
nce
fro
m P
hys
ics
Ove
rall
Mea
n S
cale
Sco
re
Line represents country's overall mean.
Shaded boxes indicate mean and confidence intervals (±2 SE) for the content areas

Figure 2 (Continued)
Country
Ph
ysic
s TC
I
Mec
han
ics
Ele
ctri
city
an
d
Mag
net
ism
Hea
t
Wav
e Ph
eno
men
a
Mo
der
n P
hys
ics
Country
Ph
ysic
s TC
I
Mec
han
ics
Ele
ctri
city
an
d
Mag
net
ism
Hea
t
Wav
e Ph
eno
men
a
Mo
der
n P
hys
ics
Countries Not Satisfying Guidelines for Sample Participation Rates (See Appendix B for Details):
Australia 13% United States 14%
2 Austria 33%
Countries With Unapproved Sampling Procedures and Low Participation Rates (See Appendix B):
Denmark 3% Slovenia 39%
Mec
han
ics
Elec
tric
ity
and
M
agn
etis
m
Hea
t
Wav
e Ph
eno
men
a
Mo
der
n P
hys
ics
* See Mullis and others, 1998 Appendix A for characteristics of students sampled.† Met guidelines for sample participation rates only after replacement schools were included (see Mullis and others, 1998 Appendix B for details).1 National Desired Population does not cover all of International Desired Population (see Mullis and others, 1998 Table B.4).2 National Defined Population covers less than 90 percent of National Desired Population (see Mullis and others, 1998 Table B.4).
Profiles of Performance in Physics Content Areas for Students Having Taken Physics Final Year of Secondary School*
-80
-40
0
40
80
-80
-40
0
40
80
-80
-40
0
40
80
-80
-40
0
40
80
-80
-40
0
40
80
Legend
-80
-40
0
40
80
Line represents country's overall mean.
Shaded boxes indicate mean and confidence intervals (±2 SE) for the
Dif
fere
nce
fro
m P
hys
ics
Ove
rall
Mea
n S
cale
Sco
re
17
Most countries did relatively better in some areas and less well in others. Students in the NSF-sponsored physics
programs performed better in wave phenomena and modern physics, but had a relative weakness in electricity
and magnetism.
It was evident from Table 3 that male students outperformed female students on the overall physics test in all
countries but one. Table 6 provides further information on this issue by presenting gender differences for each
country on each physics content area scale. The international average for males was significantly higher than the
average for females on each of the content area scales, with the greatest differences in mechanics. For students
in the NSF-sponsored physics program, the average performance for males also was significantly higher in all
five content areas. The gender gap for these students was least in modern physics (22), then heat (32), and
equally large in mechanics, electricity and magnetism, and wave phenomena (40).
WHAT ARE THE INSTRUCTIONAL PRACTICES IN PHYSICS CLASSES?
The amount of physics instruction received by students in physics classes in their final year varied considerably
across countries, but in general was less than five hours per week (Table 7). Students in Australia, the Russian
Federation, and the United States mostly reported between three and five hours of physics instruction per week,
while in Canada, about half of the students then taking physics reported having five hours or more of physics
instruction each week. In Cyprus, Denmark, Greece, and Norway, almost all physics students reported between
three and four hours of instruction per week, whereas less than three hours was the norm for students in the
Czech Republic, Germany, Latvia (LSS), Sweden, and Switzerland. Forty-five percent of the students in the
NSF-sponsored physics programs reported receiving four or more hours of physics instruction a week,
compared with just 17% for physics students in general in the United States, and a further 43%of the students
reported receiving five or more hours of physics instruction per week.
The relationship between physics achievement and amount of instruction varied across countries; the most
common was a curvilinear relationship, with the highest achievement associated with between three and five
hours of instruction. This curvilinear relationship is also present in the NSF-sponsored physics program. Those
students who received 4 to 5 hours of physics instruction outperformed students who received five or more
hours of instruction per week by 26 points, and performed about the same as those that received 3 to 4 hours of
instruction per week, and substantially higher than those students receiving less than 3 hours physics instruction
per week.

Table 6Achievement in Physics Content Areas by Gender for Students Having Taken PhysicsFinal Year of Secondary School*
Physics Content Areas Mean Achievement Scale Scores
Physics TCI
NSF Physics Programs – 455 (1.8) ▲ 495 (1.9) 423 (1.5) ▲ 463 (1.6) 463 (1.5) ▲ 495 (1.5) Canada 14% 440 (5.7) ▲ 499 (6.6) 468 (6.5) ▲ 497 (6.2) 492 (8.1) 520 (5.2)2 Cyprus 9% 496 (10.3) ▲ 551 (9.6) 494 (7.4) 507 (8.5) 461 (11.2) 484 (9.8) Czech Republic 11% 440 (4.8) ▲ 514 (8.4) 443 (3.3) ▲ 501 (8.7) 472 (4.5) ▲ 513 (6.6) France 20% 437 (5.5) ▲ 470 (5.6) 491 (5.2) 495 (4.2) 487 (5.7) 496 (4.0)† Germany 8% 453 (10.6) ▲ 515 (9.6) 491 (7.7) 522 (12.1) 461 (10.6) ▲ 513 (6.3)† Greece 10% 489 (7.2) ▲ 525 (7.0) 515 (11.0) 522 (6.5) 460 (10.5) 490 (8.1)1 Latvia (LSS) 3% 468 (19.8) 509 (15.2) 474 (18.4) 496 (16.8) 484 (23.4) 523 (17.8)† Norway 8% 523 (9.0) ▲ 589 (6.1) 549 (10.0) 570 (6.2) 511 (7.0) ▲ 545 (4.4)2 Russian Federation 2% 507 (12.3) ▲ 563 (7.4) 519 (12.9) ▲ 575 (7.7) 501 (14.8) ▲ 555 (7.5) Sweden 16% 517 (4.4) ▲ 586 (4.6) 551 (4.7) ▲ 579 (4.8) 507 (5.4) 529 (5.8) Switzerland 14% 444 (3.5) ▲ 519 (5.3) 452 (4.5) ▲ 507 (7.1) 480 (5.7) ▲ 538 (4.3)
Australia 13% 474 (6.8) ▲ 524 (7.8) 488 (8.3) ▲ 525 (6.7) 503 (6.2) 524 (5.0)2 Austria 33% 399 (6.3) ▲ 459 (6.6) 409 (6.9) ▲ 468 (9.1) 420 (6.8) ▲ 485 (8.0) United States 14% 393 (2.8) ▲ 446 (3.5) 409 (3.6) ▲ 430 (3.5) 474 (2.7) 480 (4.2)
Denmark 3% 483 (10.2) ▲ 540 (5.5) 498 (7.8) 515 (4.5) 487 (9.6) 517 (5.3) Slovenia 39% 487 (21.7) ▲ 576 (17.5) 470 (13.8) 522 (16.6) 470 (18.7) ▲ 538 (13.1)
International Average ✃ 466 (2.6) ▲ 524 (2.2) 483 (2.3) ▲ 514 (2.2) 479 (2.7) ▲ 516 (2.0)
* See Mullis and others, 1998 Appendix A for characteristics of the students sampled.† Met guidelines for sample participation rates only after replacement schools were included (see Mullis and others, 1998 Appendix B for details).1 National Desired Population does not cover all of International Desired Population (see Mullis and others, 1998 Table B.4).2 National Defined Population covers less than 90 percent of National Desired Population (see Mullis and others, 1998 Table B.4).
( ) Standard errors appear in parentheses. Because results are rounded to the nearest whole number, some totals may appear inconsistent.Because population coverage falls below 65%, Latvia is annotated LSS for Latvian Speaking Schools only.
Country
Females Males
(16 items)
Mechanics
Countries Not Satisfying Guidelines for Sample Participation Rates (See Appendix B for Details)
Countries With Unapproved Sampling Procedures and Low Participation Rates (See Appendix B for Details)
HeatElectricity and Magnetism
Females Males Females Males
(16 items) (9 items)
▲ = Difference from other gender statistically significant at .05 level, adjusted for multiple comparisons

Table 6 (Continued)Achievement in Physics Content Areas by Gender for StudentsHaving Taken Physics Final Year of Secondary School*
Physics TCI
NSF Physics Programs – 471 (1.3) ▲ 511 (1.7) 478 (0.6) ▲ 500 (1.6)Canada 14% 476 (6.4) 497 (4.3) 471 (5.1) ▲ 513 (6.0)
2 Cyprus 9% 486 (8.4) 519 (10.4) 411 (9.9) ▲ 450 (7.7) Czech Republic 11% 419 (4.9) ▲ 491 (7.2) 425 (4.6) ▲ 498 (6.9) France 20% 448 (4.6) ▲ 475 (5.6) 457 (4.1) ▲ 485 (4.3)
† Germany 8% 485 (10.1) ▲ 551 (12.7) 508 (13.5) 561 (15.3)† Greece 10% 444 (7.2) 457 (7.4) 426 (5.7) ▲ 456 (6.4)1 Latvia (LSS) 3% 480 (16.2) 515 (17.3) 470 (20.8) 505 (16.6)† Norway 8% 519 (10.2) ▲ 575 (4.9) 549 (9.9) ▲ 585 (5.0)2 Russian Federation 2% 487 (12.4) ▲ 539 (7.9) 520 (13.9) 561 (7.9) Sweden 16% 528 (5.9) ▲ 576 (6.1) 538 (6.2) ▲ 570 (3.3) Switzerland 14% 460 (4.4) ▲ 533 (4.8) 457 (4.4) ▲ 519 (5.8)
Australia 13% 498 (7.2) 529 (9.0) 497 (7.8) ▲ 533 (6.7)2 Austria 33% 444 (9.7) ▲ 506 (7.3) 465 (6.1) ▲ 505 (9.9) United States 14% 442 (3.0) ▲ 460 (2.6) 446 (2.3) ▲ 466 (3.6)
Denmark 3% 493 (10.0) ▲ 547 (6.3) 529 (7.4) 546 (6.0) Slovenia 39% 446 (13.4) ▲ 538 (11.9) 458 (14.1) ▲ 528 (18.7)
International Average 472 (2.3) ▲ 519 (2.2) 477 (2.4) ▲ 518 (2.3)
* See Mullis and others, 1998 Appendix A for characteristics of the students sampled.† Met guidelines for sample participation rates only after replacement schools were included (see Mullis and others, 1998 Appendix B for details).1 National Desired Population does not cover all of International Desired Population (see Mullis and Others, 1998 Table B.4).2 National Defined Population covers less than 90 percent of National Desired Population (see Mullis and others, 1998 Table B.4).
( ) Standard errors appear in parentheses. Because results are rounded to the nearest whole number, some totals may appear inconsistent.Because population coverage falls below 65%, Latvia is annotated LSS for Latvian Speaking Schools only.
(10 items)
Wave Phenomena
Countries With Unapproved Sampling Procedures and Low Participation Rates (See Appendix B for Details)
(14 items)
Females Males
Modern Physics: Particle, Quantum and Astrophysics,
and Relativity
Physics Content AreasMean Achievement Scale Scores
Countries Not Satisfying Guidelines for Sample Participation Rates (See Appendix B for Details)
Country
Females Males
▲ = Difference from other gender statistically significant at .05 level, adjusted for multiple comparisons
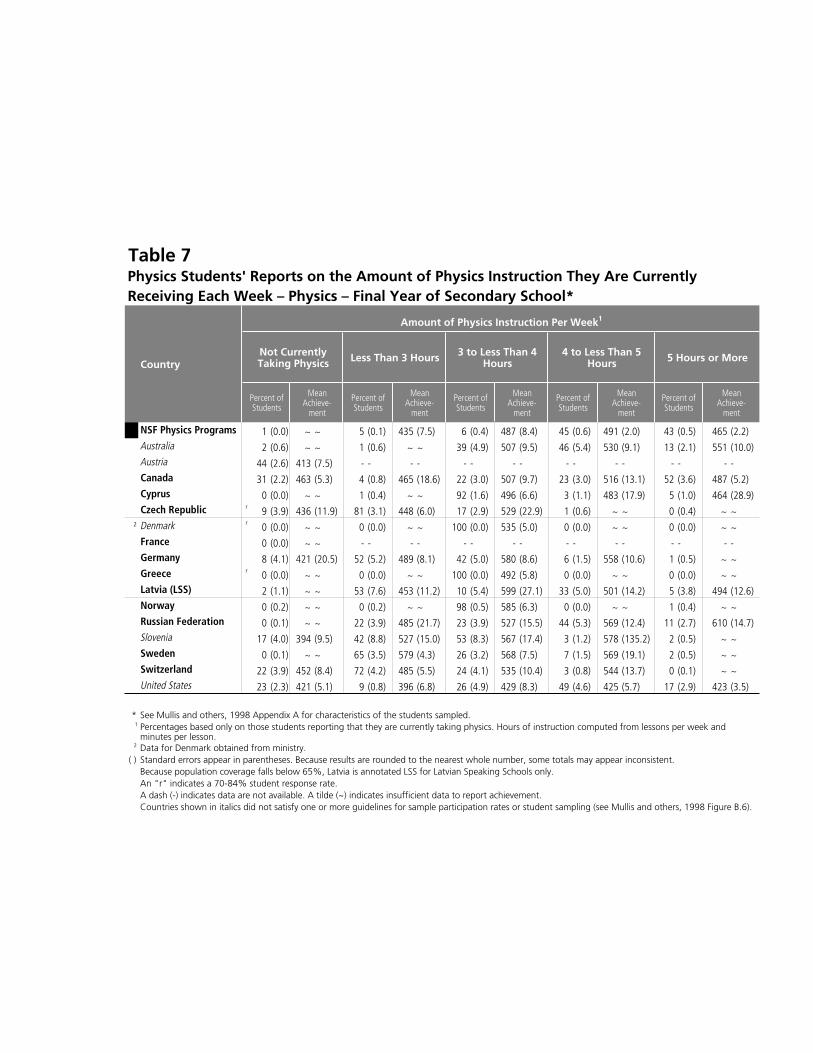
Table 7Physics Students' Reports on the Amount of Physics Instruction They Are CurrentlyReceiving Each Week – Physics – Final Year of Secondary School*
NSF Physics Programs 1 (0.0) ~ ~ 5 (0.1) 435 (7.5) 6 (0.4) 487 (8.4) 45 (0.6) 491 (2.0) 43 (0.5) 465 (2.2)Australia 2 (0.6) ~ ~ 1 (0.6) ~ ~ 39 (4.9) 507 (9.5) 46 (5.4) 530 (9.1) 13 (2.1) 551 (10.0)Austria 44 (2.6) 413 (7.5) - - - - - - - - - - - - - - - -Canada 31 (2.2) 463 (5.3) 4 (0.8) 465 (18.6) 22 (3.0) 507 (9.7) 23 (3.0) 516 (13.1) 52 (3.6) 487 (5.2)Cyprus 0 (0.0) ~ ~ 1 (0.4) ~ ~ 92 (1.6) 496 (6.6) 3 (1.1) 483 (17.9) 5 (1.0) 464 (28.9)Czech Republic r 9 (3.9) 436 (11.9) 81 (3.1) 448 (6.0) 17 (2.9) 529 (22.9) 1 (0.6) ~ ~ 0 (0.4) ~ ~
2 Denmark r 0 (0.0) ~ ~ 0 (0.0) ~ ~ 100 (0.0) 535 (5.0) 0 (0.0) ~ ~ 0 (0.0) ~ ~France 0 (0.0) ~ ~ - - - - - - - - - - - - - - - -Germany 8 (4.1) 421 (20.5) 52 (5.2) 489 (8.1) 42 (5.0) 580 (8.6) 6 (1.5) 558 (10.6) 1 (0.5) ~ ~Greece r 0 (0.0) ~ ~ 0 (0.0) ~ ~ 100 (0.0) 492 (5.8) 0 (0.0) ~ ~ 0 (0.0) ~ ~Latvia (LSS) 2 (1.1) ~ ~ 53 (7.6) 453 (11.2) 10 (5.4) 599 (27.1) 33 (5.0) 501 (14.2) 5 (3.8) 494 (12.6)Norway 0 (0.2) ~ ~ 0 (0.2) ~ ~ 98 (0.5) 585 (6.3) 0 (0.0) ~ ~ 1 (0.4) ~ ~Russian Federation 0 (0.1) ~ ~ 22 (3.9) 485 (21.7) 23 (3.9) 527 (15.5) 44 (5.3) 569 (12.4) 11 (2.7) 610 (14.7)Slovenia 17 (4.0) 394 (9.5) 42 (8.8) 527 (15.0) 53 (8.3) 567 (17.4) 3 (1.2) 578 (135.2) 2 (0.5) ~ ~Sweden 0 (0.1) ~ ~ 65 (3.5) 579 (4.3) 26 (3.2) 568 (7.5) 7 (1.5) 569 (19.1) 2 (0.5) ~ ~Switzerland 22 (3.9) 452 (8.4) 72 (4.2) 485 (5.5) 24 (4.1) 535 (10.4) 3 (0.8) 544 (13.7) 0 (0.1) ~ ~United States 23 (2.3) 421 (5.1) 9 (0.8) 396 (6.8) 26 (4.9) 429 (8.3) 49 (4.6) 425 (5.7) 17 (2.9) 423 (3.5)
* See Mullis and others, 1998 Appendix A for characteristics of the students sampled.1
2 Data for Denmark obtained from ministry.( ) Standard errors appear in parentheses. Because results are rounded to the nearest whole number, some totals may appear inconsistent.
Because population coverage falls below 65%, Latvia is annotated LSS for Latvian Speaking Schools only.An "r" indicates a 70-84% student response rate.A dash (-) indicates data are not available. A tilde (~) indicates insufficient data to report achievement.Countries shown in italics did not satisfy one or more guidelines for sample participation rates or student sampling (see Mullis and others, 1998 Figure B.6).
Percentages based only on those students reporting that they are currently taking physics. Hours of instruction computed from lessons per week and minutes per lesson.
CountryNot Currently Taking Physics
Percent ofStudents
Mean Achieve-
ment
Percent of Students
Mean Achieve-
ment
Percent of Students
Mean Achieve-
ment
Amount of Physics Instruction Per Week1
Less Than 3 Hours 3 to Less Than 4 Hours
4 to Less Than 5 Hours 5 Hours or More
Percent of Students
Mean Achieve-
ment
Percent of Students
Mean Achieve-
ment

21
The assignment of homework to final-year physics students is also something that varies considerably from
country to country, as may be seen in Table 8. On one hand, most students taking physics in Austria, the Czech
Republic, Latvia (LSS), and Slovenia reported that they were assigned physics homework less than once a
week, while on the other, most students in Australia, Canada, Cyprus, Greece, Norway, the Russian Federation,
and the United States reported physics homework assignments three or more times a week. Roughly 40% of the
students in the NSF-sponsored physics programs reported being assigned physics homework either once or
twice a week, or three or more times a week, with most of the remaining students being assigned homework less
than once a week. While no clear relationship between amount of homework assigned and physics achievement
was evident across countries, the students in the NSF-sponsored physics programs who were assigned
homework most frequently outperformed other students. There was little difference between those students in
NSF sponsored physics programs who reported being assigned homework less than once a week and once or
twice a week.
To provide information about instructional practices, students were asked how often in their physics lessons
they are asked to do reasoning tasks, apply science to everyday problems, conduct laboratory experiments, and
use computers to do exercises or solve problems. As shown in Table 9, virtually all students in every country
except Austria reported being asked to do reasoning tasks in at least some lessons. While there was essentially
no relationship between the frequency of doing reasoning tasks in class for students within the United States, the
students in the NSF-sponsored programs show a clear relationship with higher achievement being paired with
higher frequency of reasoning tasks. Roughly equal proportions of students in the NSF-sponsored physics
programs reported doing reasoning tasks in most or every lesson. Those students who reported doing reasoning
tasks every lesson outperformed students who reported doing reasoning tasks most lessons by 36 points. A
small percentage of students in the NSF sponsored physics programs reported doing reasoning tasks some
lessons, and these students had the lowest achievement of the three categories to which these students
responded.
Students reported that applying science to everyday problems is a frequent activity in physics classes. As may
be seen in Table 10, most students in every country reported that they are asked to do this in some or most
lessons. The practice was reportedly least common in Sweden, where 30% of physics students reported that they
were never, or almost never, asked in class to apply science to everyday problems. The application of physics to
every day problems was common in the NSF-sponsored physics programs, where 28% of the physics students
reported being asked to apply science to everyday problems during every lesson

Table 8Physics Students' Reports on How Often They Are Assigned Physics HomeworkPhysics – Final Year of Secondary School*
How Often Physics Homework Is Assigned1
NSF Physics Programs 1 (0.0) ~ ~ 17 (0.8) 463 (2.8) 42 (0.4) 455 (1.9) 41 (0.6) 505 (3.7)
Australia 2 (0.6) ~ ~ 12 (2.8) 529 (14.5) 27 (2.6) 525 (10.6) 60 (3.8) 518 (7.7)
Austria 44 (2.6) 413 (7.5) 97 (1.2) 450 (9.1) 3 (1.2) 454 (21.7) 0 (0.3) ~ ~
Canada 31 (2.2) 463 (5.3) 6 (1.3) 535 (16.0) 25 (3.1) 514 (9.1) 68 (3.9) 487 (4.9)
Cyprus 0 (0.0) ~ ~ 2 (0.5) ~ ~ 6 (1.1) 508 (24.9) 92 (1.0) 493 (6.9)
Czech Republic r 9 (3.9) 436 (11.9) 84 (2.5) 459 (7.9) 15 (2.4) 480 (12.2) 1 (0.4) ~ ~
Denmark r 0 (0.0) ~ ~ 7 (1.4) 531 (13.4) 45 (3.0) 525 (7.3) 48 (3.4) 545 (8.4)
France 0 (0.0) ~ ~ - - - - - - - - - - - -
Germany 8 (4.1) 421 (20.5) 41 (4.7) 507 (13.4) 40 (3.3) 538 (6.7) 18 (3.3) 579 (15.6)
Greece 0 (0.0) ~ ~ 8 (1.9) 465 (20.5) 10 (1.4) 488 (17.0) 82 (2.2) 496 (5.6)
Latvia (LSS) 2 (1.1) ~ ~ 53 (4.8) 482 (23.0) 30 (3.4) 497 (20.2) 17 (3.3) 473 (16.9)
Norway 0 (0.2) ~ ~ 10 (2.1) 595 (20.8) 15 (2.6) 589 (7.8) 75 (3.6) 581 (6.9)
Russian Federation 0 (0.1) ~ ~ 6 (1.1) 554 (22.8) 20 (2.6) 541 (24.2) 74 (2.9) 546 (12.6)
Slovenia 17 (4.0) 394 (9.5) 67 (4.6) 559 (15.3) 29 (4.1) 535 (20.2) 3 (1.1) 506 (37.6)
Sweden 0 (0.1) ~ ~ 33 (3.8) 569 (7.2) 64 (3.8) 577 (4.9) 3 (0.9) 551 (18.5)
Switzerland 22 (3.9) 452 (8.4) 41 (3.1) 475 (7.4) 51 (2.9) 514 (6.0) 7 (1.2) 529 (15.3)
United States 23 (2.3) 421 (5.1) 13 (2.2) 418 (7.6) 36 (2.3) 422 (4.6) 51 (2.7) 425 (4.8)
* See Mullis and others, 1998 Appendix A for characteristics of the students sampled.1 Percentages based only on those students reporting that they are currently taking physics.
( ) Standard errors appear in parentheses. Because results are rounded to the nearest whole number, some totals may appear inconsistent.An "r" indicates a 70-84% student response rate.A dash (-) indicates data are not available. A tilde (~) indicates insufficient data to report achievement.Countries shown in italics did not satisfy one or more guidelines for sample participation rates or student sampling (see Mullis and others, 1998 Figure B.6).Because population coverage falls below 65%, Latvia is annotated LSS for Latvian Speaking Schools only.
Country
Not Currently Taking Physics
Percent of Students
Mean Achievement
Less Than Once a Week
Percent of Students
Mean Achievement
Once or Twice a Week
3 or More Times a Week
Percent of Students
Mean Achievement
Percent of Students
Mean Achievement
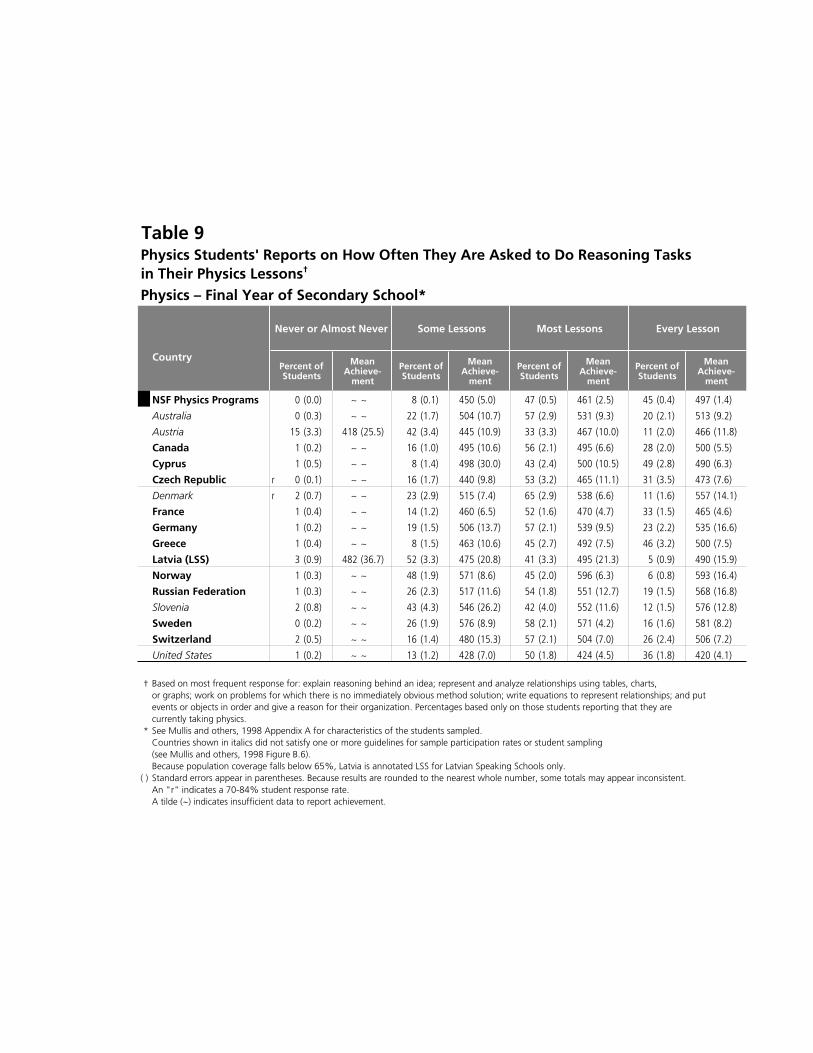
Table 9Physics Students' Reports on How Often They Are Asked to Do Reasoning Tasksin Their Physics Lessons†
Physics – Final Year of Secondary School*
Never or Almost Never Some Lessons Most Lessons Every Lesson
CountryPercent of Students
Mean Achieve-
ment
Percent of Students
Mean Achieve-
ment
Percent of Students
Mean Achieve-
ment
Percent of Students
Mean Achieve-
ment
NSF Physics Programs 0 (0.0) ~ ~ 8 (0.1) 450 (5.0) 47 (0.5) 461 (2.5) 45 (0.4) 497 (1.4)
Australia 0 (0.3) ~ ~ 22 (1.7) 504 (10.7) 57 (2.9) 531 (9.3) 20 (2.1) 513 (9.2)
Austria 15 (3.3) 418 (25.5) 42 (3.4) 445 (10.9) 33 (3.3) 467 (10.0) 11 (2.0) 466 (11.8)
Canada 1 (0.2) ~ ~ 16 (1.0) 495 (10.6) 56 (2.1) 495 (6.6) 28 (2.0) 500 (5.5)
Cyprus 1 (0.5) ~ ~ 8 (1.4) 498 (30.0) 43 (2.4) 500 (10.5) 49 (2.8) 490 (6.3)
Czech Republic r 0 (0.1) ~ ~ 16 (1.7) 440 (9.8) 53 (3.2) 465 (11.1) 31 (3.5) 473 (7.6)
Denmark r 2 (0.7) ~ ~ 23 (2.9) 515 (7.4) 65 (2.9) 538 (6.6) 11 (1.6) 557 (14.1)
France 1 (0.4) ~ ~ 14 (1.2) 460 (6.5) 52 (1.6) 470 (4.7) 33 (1.5) 465 (4.6)
Germany 1 (0.2) ~ ~ 19 (1.5) 506 (13.7) 57 (2.1) 539 (9.5) 23 (2.2) 535 (16.6)
Greece 1 (0.4) ~ ~ 8 (1.5) 463 (10.6) 45 (2.7) 492 (7.5) 46 (3.2) 500 (7.5)
Latvia (LSS) 3 (0.9) 482 (36.7) 52 (3.3) 475 (20.8) 41 (3.3) 495 (21.3) 5 (0.9) 490 (15.9)
Norway 1 (0.3) ~ ~ 48 (1.9) 571 (8.6) 45 (2.0) 596 (6.3) 6 (0.8) 593 (16.4)
Russian Federation 1 (0.3) ~ ~ 26 (2.3) 517 (11.6) 54 (1.8) 551 (12.7) 19 (1.5) 568 (16.8)
Slovenia 2 (0.8) ~ ~ 43 (4.3) 546 (26.2) 42 (4.0) 552 (11.6) 12 (1.5) 576 (12.8)
Sweden 0 (0.2) ~ ~ 26 (1.9) 576 (8.9) 58 (2.1) 571 (4.2) 16 (1.6) 581 (8.2)
Switzerland 2 (0.5) ~ ~ 16 (1.4) 480 (15.3) 57 (2.1) 504 (7.0) 26 (2.4) 506 (7.2)
United States 1 (0.2) ~ ~ 13 (1.2) 428 (7.0) 50 (1.8) 424 (4.5) 36 (1.8) 420 (4.1)
† Based on most frequent response for: explain reasoning behind an idea; represent and analyze relationships using tables, charts,or graphs; work on problems for which there is no immediately obvious method solution; write equations to represent relationships; and putevents or objects in order and give a reason for their organization. Percentages based only on those students reporting that they arecurrently taking physics.
* See Mullis and others, 1998 Appendix A for characteristics of the students sampled.Countries shown in italics did not satisfy one or more guidelines for sample participation rates or student sampling (see Mullis and others, 1998 Figure B.6).Because population coverage falls below 65%, Latvia is annotated LSS for Latvian Speaking Schools only.
( ) Standard errors appear in parentheses. Because results are rounded to the nearest whole number, some totals may appear inconsistent. An "r" indicates a 70-84% student response rate.A tilde (~) indicates insufficient data to report achievement.

Table 10Physics Students' Reports on How Often They Are Asked to Apply Science to
Everyday Problems in Their Physics Lessons†
Physics – Final Year of Secondary School*
Never or Almost Never Some Lessons Most Lessons Every Lesson
CountryPercent of Students
Mean Achieve-
ment
Percent of Students
Mean Achieve-
ment
Percent of Students
Mean Achieve-
ment
Percent of Students
Mean Achieve-
ment
NSF Physics Programs 4 (0.4) 466 (9.1) 30 (0.6) 478 (2.7) 38 (0.6) 469 (2.3) 28 (0.4) 487 (3.4)
Australia 7 (1.4) 493 (16.6) 40 (3.2) 514 (9.0) 38 (3.4) 536 (8.8) 14 (1.8) 521 (12.4)
Austria 25 (2.8) 436 (14.6) 40 (3.8) 461 (7.8) 26 (2.9) 459 (13.6) 9 (2.6) 422 (18.6)
Canada 8 (0.8) 451 (17.1) 35 (1.8) 504 (7.8) 39 (2.4) 498 (4.7) 17 (2.5) 501 (10.4)
Cyprus 14 (1.6) 491 (25.1) 41 (2.3) 489 (9.7) 35 (2.5) 505 (7.9) 11 (1.5) 480 (21.1)
Czech Republic r 13 (1.4) 448 (10.6) 49 (2.0) 461 (8.5) 31 (1.7) 470 (9.8) 7 (2.5) 478 (16.3)
Denmark r 10 (1.5) 497 (12.3) 40 (2.7) 531 (7.5) 45 (2.7) 544 (7.1) 6 (1.3) 540 (22.4)
France 16 (1.3) 450 (7.7) 44 (1.1) 473 (4.7) 30 (1.3) 469 (5.6) 10 (1.1) 463 (8.0)
Germany 16 (2.0) 519 (11.1) 57 (2.4) 529 (10.7) 22 (1.8) 551 (15.4) 5 (0.9) 523 (21.2)
Greece 22 (2.4) 485 (11.5) 51 (2.9) 488 (8.4) 20 (2.2) 505 (9.0) 7 (1.4) 514 (13.8)
Latvia (LSS) 29 (3.6) 485 (21.0) 55 (4.1) 484 (21.0) 12 (1.3) 480 (19.2) 3 (0.8) 472 (19.2)
Norway 26 (1.6) 565 (7.6) 57 (1.6) 588 (7.2) 16 (1.0) 597 (8.8) 1 (0.4) ~ ~
Russian Federation 22 (2.0) 522 (14.8) 50 (1.5) 546 (13.6) 25 (2.0) 562 (10.3) 3 (0.6) 555 (24.3)
Slovenia 15 (2.4) 513 (18.3) 52 (2.8) 554 (15.5) 28 (2.4) 565 (20.9) 5 (1.2) 560 (19.8)
Sweden 30 (1.9) 564 (8.6) 54 (1.7) 577 (4.4) 14 (1.3) 577 (10.1) 2 (0.6) ~ ~
Switzerland 16 (1.3) 464 (11.2) 49 (1.5) 504 (7.1) 31 (1.8) 508 (6.4) 4 (0.8) 522 (21.7)
United States 6 (0.9) 412 (7.0) 31 (1.4) 422 (4.7) 40 (1.7) 421 (4.2) 23 (2.1) 430 (6.6)
† Percentages based only on those students reporting that they are currently taking physics.* See Mullis and others, 1998 Appendix A for characteristics of the students sampled.
Countries shown in italics did not satisfy one or more guidelines for sample participation rates or student sampling (see Mullis and others, 1998 Figure B.6).Because population coverage falls below 65%, Latvia is annotated LSS for Latvian Speaking Schools only.
( ) Standard errors appear in parentheses. Because results are rounded to the nearest whole number, some totals may appear inconsistent. An "r" indicates a 70-84% student response rate.A tilde (~) indicates insufficient data to report achievement.

25
The percentages of students for each category of the table are similar for the NSF-sponsored physics programs
and the United States. For both the NSF-sponsored physics programs and the United States there is no clear
relationship between the frequency of students being asked to apply science to everyday problems and
achievement. Although experimentation is the cornerstone of at least some branches of physics and might be
expected to play a central role in physics classes for students in the final year of upper secondary school,
students’ reports indicate a wide range of approaches (Table 11). In Austria, Germany, and Greece, the majority
of the students reported that they never or almost never conduct laboratory experiments, whereas one-fourth or
more of the students in Canada, Cyprus, Denmark, France, Switzerland, and the United States reported
conducting experiments in most or all lessons. In about half of the countries, the majority of students reported
conducting experiments in some lessons. Roughly 40% percentage of students in the NSF-sponsored physics
programs reported doing experiments some or most lessons, while 15% reported doing experiments every
lesson, and 2% reported not doing any experiments. The highest achievement was associated with those
students who reported doing experiments in only some lessons. The performance of these students was close to
the international mean. These NSF students outperformed NSF students who did experiments every lesson by
18 points, and those that did experiments most lessons by 28 points.
In eight countries, Australia, Austria, the Czech Republic, Latvia (LSS), Norway, the Russian Federation,
Sweden, and Switzerland, 80% or more of the students reported never or almost never using computers in
physics classes (Table 12). Only in Cyprus and Slovenia did more than 20% of the physics students report using
a computer in every lesson. Computer use in physics lessons was reportedly more common among students in
NSF-sponsored programs than among U.S. physics students in general. Less than one fourth of students in NSF-
sponsored programs reported never or almost never using a computer in physics class, compared with more than
half U.S. physics students in general. While there was no consistent relationship between computer use in class
and physics achievement across the countries, it is noteworthy that those students in the NSF-sponsored physics
programs who reported using computers to solve exercises or problems in every lesson performed 68 points
lower that those that used the computer most lessons, and 47 points lower than those that used the computer
some lessons.

Table 11
Never or Almost Never Some Lessons Most Lessons Every Lesson
Percent of Students
Mean Achievement
Percent of Students
Mean Achievement
Percent of Students
Mean Achievement
Percent of Students
Mean Achievement
NSF Physics Programs 2 (0.0) ~ ~ 41 (0.4) 493 (2.3) 42 (0.5) 465 (2.9) 15 (0.2) 475 (3.9)
Australia 12 (1.7) 508 (16.0) 80 (2.2) 523 (6.0) 8 (1.9) 524 (28.3) 0 (0.3) ~ ~
Austria 52 (4.8) 434 (10.6) 33 (4.3) 465 (10.8) 10 (1.9) 476 (25.2) 6 (4.0) 469 (21.1)
Canada 8 (1.1) 496 (11.9) 65 (2.5) 493 (7.5) 24 (2.8) 506 (15.4) 3 (0.4) 504 (12.5)
Cyprus 7 (1.1) 541 (36.1) 68 (2.2) 489 (7.5) 19 (1.9) 487 (12.1) 6 (1.1) 513 (32.4)
Czech Republic r 33 (2.9) 449 (9.0) 58 (3.1) 470 (9.1) 8 (1.4) 480 (14.5) 1 (0.8) ~ ~
Denmark r 4 (1.2) 505 (20.3) 48 (3.0) 537 (6.8) 48 (3.2) 535 (7.6) 0 (0.0) ~ ~
France 5 (0.9) 449 (14.9) 62 (2.1) 471 (4.0) 30 (2.3) 464 (5.5) 3 (0.5) 446 (8.8)
Germany 62 (3.2) 515 (9.6) 33 (3.2) 556 (16.8) 4 (1.2) 551 (21.6) 1 (0.4) ~ ~
Greece 78 (2.7) 500 (5.7) 17 (2.3) 468 (13.0) 4 (1.2) 453 (29.6) 2 (0.6) ~ ~
Latvia (LSS) 17 (3.6) 450 (27.4) 77 (3.2) 489 (16.6) 6 (1.4) 512 (28.5) 0 (0.2) ~ ~
Norway 3 (0.9) 583 (23.2) 93 (1.6) 584 (6.3) 4 (0.9) 575 (19.9) 0 (0.3) ~ ~
Russian Federation 9 (1.6) 539 (13.3) 72 (1.9) 545 (13.9) 18 (1.7) 544 (13.4) 2 (0.3) ~ ~
Slovenia 14 (2.9) 532 (23.3) 68 (3.9) 560 (18.6) 16 (3.4) 531 (14.9) 2 (0.9) ~ ~
Sweden 4 (1.0) 581 (20.6) 79 (1.8) 576 (4.4) 16 (1.4) 562 (6.5) 1 (0.7) ~ ~
Switzerland 31 (4.4) 477 (10.8) 36 (2.1) 512 (6.9) 28 (2.9) 507 (8.6) 5 (1.7) 503 (15.4)
United States 4 (0.6) 410 (11.2) 49 (2.6) 425 (4.1) 37 (2.2) 423 (5.3) 10 (1.1) 414 (6.9)
† Percentages based only on those students reporting that they are currently taking physics.* See Mullis and others, 1998 Appendix A for characteristics of the students sampled.
Countries shown in italics did not satisfy one or more guidelines for sample participation rates or student sampling (see Mullis and others, 1998 Figure B.6).Because population coverage falls below 65%, Latvia is annotated LSS for Latvian Speaking Schools only.
( ) Standard errors appear in parentheses. Because results are rounded to the nearest whole number, some totals may appear inconsAn "r" indicates a 70-84% student response rate.A tilde (~) indicates insufficient data to report achievement.
Country
Physics Students' Reports on How Often They Are Asked to Conduct Laboratory Experiments in Their Physics Lessons†
Physics – Final Year of Secondary School*
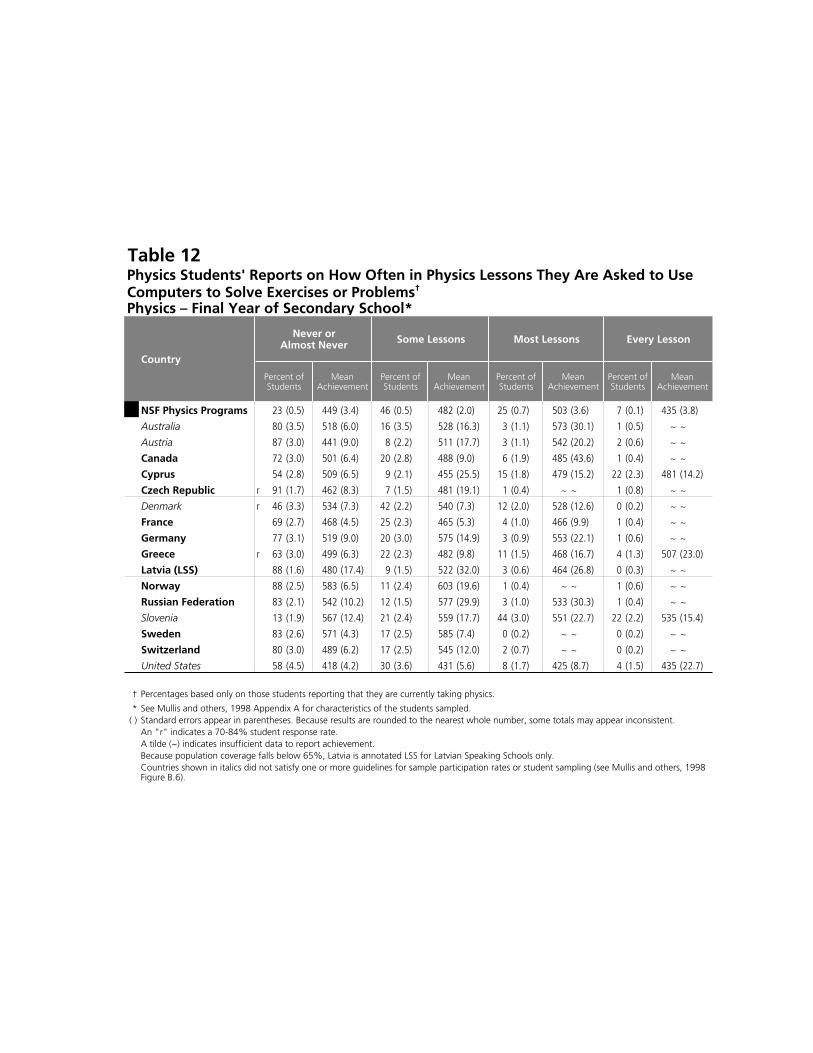
Table 12
NSF Physics Programs 23 (0.5) 449 (3.4) 46 (0.5) 482 (2.0) 25 (0.7) 503 (3.6) 7 (0.1) 435 (3.8)
Australia 80 (3.5) 518 (6.0) 16 (3.5) 528 (16.3) 3 (1.1) 573 (30.1) 1 (0.5) ~ ~
Austria 87 (3.0) 441 (9.0) 8 (2.2) 511 (17.7) 3 (1.1) 542 (20.2) 2 (0.6) ~ ~
Canada 72 (3.0) 501 (6.4) 20 (2.8) 488 (9.0) 6 (1.9) 485 (43.6) 1 (0.4) ~ ~
Cyprus 54 (2.8) 509 (6.5) 9 (2.1) 455 (25.5) 15 (1.8) 479 (15.2) 22 (2.3) 481 (14.2)
Czech Republic r 91 (1.7) 462 (8.3) 7 (1.5) 481 (19.1) 1 (0.4) ~ ~ 1 (0.8) ~ ~
Denmark r 46 (3.3) 534 (7.3) 42 (2.2) 540 (7.3) 12 (2.0) 528 (12.6) 0 (0.2) ~ ~
France 69 (2.7) 468 (4.5) 25 (2.3) 465 (5.3) 4 (1.0) 466 (9.9) 1 (0.4) ~ ~
Germany 77 (3.1) 519 (9.0) 20 (3.0) 575 (14.9) 3 (0.9) 553 (22.1) 1 (0.6) ~ ~
Greece r 63 (3.0) 499 (6.3) 22 (2.3) 482 (9.8) 11 (1.5) 468 (16.7) 4 (1.3) 507 (23.0)
Latvia (LSS) 88 (1.6) 480 (17.4) 9 (1.5) 522 (32.0) 3 (0.6) 464 (26.8) 0 (0.3) ~ ~
Norway 88 (2.5) 583 (6.5) 11 (2.4) 603 (19.6) 1 (0.4) ~ ~ 1 (0.6) ~ ~
Russian Federation 83 (2.1) 542 (10.2) 12 (1.5) 577 (29.9) 3 (1.0) 533 (30.3) 1 (0.4) ~ ~
Slovenia 13 (1.9) 567 (12.4) 21 (2.4) 559 (17.7) 44 (3.0) 551 (22.7) 22 (2.2) 535 (15.4)
Sweden 83 (2.6) 571 (4.3) 17 (2.5) 585 (7.4) 0 (0.2) ~ ~ 0 (0.2) ~ ~
Switzerland 80 (3.0) 489 (6.2) 17 (2.5) 545 (12.0) 2 (0.7) ~ ~ 0 (0.2) ~ ~
United States 58 (4.5) 418 (4.2) 30 (3.6) 431 (5.6) 8 (1.7) 425 (8.7) 4 (1.5) 435 (22.7)
† Percentages based only on those students reporting that they are currently taking physics.
* See Mullis and others, 1998 Appendix A for characteristics of the students sampled.( )
An "r" indicates a 70-84% student response rate.A tilde (~) indicates insufficient data to report achievement.Because population coverage falls below 65%, Latvia is annotated LSS for Latvian Speaking Schools only.Countries shown in italics did not satisfy one or more guidelines for sample participation rates or student sampling (see Mullis and others, 1998 Figure B.6).
Country
Never or Almost Never Some Lessons Most Lessons
Mean Achievement
Every Lesson
Physics Students' Reports on How Often in Physics Lessons They Are Asked to Use Computers to Solve Exercises or Problems†
Physics – Final Year of Secondary School*
Standard errors appear in parentheses. Because results are rounded to the nearest whole number, some totals may appear inconsistent.
Percent of Students
Mean Achievement
Percent of Students
Mean Achievement
Percent of Students
Mean Achievement
Percent of Students

28
WHAT ARE SECONDARY SCHOOL STUDENTS’ EDUCATIONAL RESOURCES AND PLANS?
The results for final-year students having taken physics are given for three levels of parents’ education: finished
university, finished upper secondary school but not university, and finished primary school but not upper
secondary school (Table 13). A clear positive relationship between parents’ education and achievement is
apparent for students having taken physics. More than 30% of the physics students reported that at least one
parent had finished university in every country except Austria. More than half the physics students in Canada,
Germany, Latvia (LSS), the Russian Federation, and the United States reported that at least one parent had
completed university. Sixty-five percent of students in NSF-sponsored programs reported that at least one
percent had finished university, compared with 55% for U.S. physics students in general.
The plans for further education of final-year final-year physics students center mainly on university. The
students planning to attend university, as reported in Table 14, are in the majority in every country; and in 11
countries, Australia, Canada, Cyprus, the Czech Republic, Greece, Latvia (LSS), the Russian Federation,
Slovenia, Sweden, Switzerland, and the United States, the percentage planning a university career exceeded
80%. Most (95%) of the students in the NSF-sponsored physics programs reported intending to attend
university. This figure is comparable to the percentage reported by the United States students.
Students who have studied physics in upper secondary school are well positioned to continue their education in
the sciences or in areas of scientific application. Table 15 presents students’ reports of their choices for study
after secondary school from a range of areas where students with advanced preparation in physics might seek
further education. The areas include physics or chemistry, biological or earth science, health sciences or related
occupations, mathematics or computer/information sciences, engineering, and business. An “other” category
was provided for students whose preferred area of study was not included. Although choice of study area varied
considerably across countries, the most popular were engineering, mathematics or computer/information
sciences, health sciences or related occupations, and business. For the NSF-sponsored physics programs
students, 25% of the students selected the “other” category. A further 22% chose engineering, 14% selected
health sciences or related occupations, 14% business and 13% indicated mathematics or computer/information
sciences. Compared to the United States physics students, relatively more students in the NSF-sponsored
physics programs indicated a preference for engineering or mathematics or computer/information sciences, and
relatively fewer for the health sciences or related occupations.

Table 13Physics Students' Reports on the Highest Level of Education of Either Parent†
Physics – Final Year of Secondary School*
NSF Physics Programs 65 (0.5) 499 (1.8) 33 (0.6) 434 (1.3) 1 (0.3) ~ ~ 0 (0.0) ~ ~
Australia 42 (3.3) 539 (8.3) 34 (3.0) 511 (8.1) 19 (2.1) 481 (9.7) 5 (1.5) 533 (24.8)
Austria 19 (2.0) 447 (10.0) 71 (2.0) 434 (7.5) 8 (1.5) 409 (11.7) 2 (0.6) ~ ~
Canada 51 (1.6) 502 (4.5) 37 (1.3) 472 (4.7) 7 (0.8) 481 (11.0) 6 (1.1) 444 (21.8)
Cyprus 44 (1.8) 507 (7.5) 36 (2.6) 488 (9.5) 17 (1.9) 481 (12.0) 3 (0.9) 477 (23.7)
Czech Republic 48 (1.9) 469 (9.1) 41 (1.8) 440 (5.7) 11 (1.1) 425 (6.1) 0 (0.0) ~ ~
Denmark r 36 (2.1) 554 (9.8) 54 (2.3) 525 (4.8) 6 (1.2) 527 (20.7) 5 (1.1) 506 (30.2)
France 30 (2.1) 488 (4.9) 43 (2.1) 464 (4.0) 22 (2.3) 444 (8.4) 5 (0.7) 466 (12.5)
Germany 52 (3.2) 537 (13.4) 46 (3.1) 507 (13.3) 2 (0.6) ~ ~ - - - -
Greece 34 (2.4) 510 (8.4) 42 (2.3) 479 (7.2) 21 (2.7) 472 (10.6) 3 (1.2) 449 (39.0)
Latvia (LSS) 52 (5.1) 508 (25.0) 44 (5.1) 467 (14.0) 2 (0.8) ~ ~ 2 (0.5) ~ ~
Norway 43 (2.5) 599 (7.4) 45 (2.2) 575 (7.9) 7 (1.1) 559 (11.8) 5 (0.8) 555 (14.4)
Russian Federation 65 (2.2) 559 (10.4) 35 (2.2) 518 (15.7) 0 (0.1) ~ ~ 0 (0.2) ~ ~
Slovenia 39 (3.0) 548 (23.5) 53 (2.1) 507 (12.9) 8 (1.3) 481 (15.3) 0 (0.2) ~ ~
Sweden 41 (2.0) 587 (6.2) 41 (2.0) 565 (7.4) 8 (1.6) 571 (11.1) 9 (1.3) 551 (9.4)
Switzerland 34 (1.4) 490 (4.9) 59 (1.8) 489 (4.7) 5 (1.0) 473 (10.5) 1 (0.4) ~ ~
United States 55 (2.5) 440 (3.9) 41 (2.4) 407 (4.1) 3 (0.5) 387 (6.8) 2 (0.3) ~ ~
†
* See Mullis and others, 1998 Appendix A for characteristics of the students sampled.1 In most countries, defined as completion of at least a 4-year degree program at a university or an equivalent institute of higher education.2
3 Finished primary or some secondary school not equivalent to completion of upper secondary.( ) Standard errors appear in parentheses. Because results are rounded to the nearest whole number, some totals may appear inconsistent.
Because population coverage falls below 65%, Latvia is annotated LSS for Latvian Speaking Schools only.An "r" indicates a 70-84% student response rate.A dash (-) indicates data are not available. A tilde (~) indicates insufficient data to report achievement.
Countries shown in italics did not satisfy one or more guidelines for sample participation rates or student sampling (see Mullis and others, 1998 Figure B.6).
Do Not Know
The response categories were defined by each country to conform to their own educational system and may not be strictly comparable across countries. See Mullis and others, 1998 Figure 4.5 for country modifications to the definitions of educational levels.
Finished upper secondary school with or without some tertiary education not equivalent to a university degree. In most countries, finished secondary corresponds to completion of an upper secondary track terminating after 11 to 13 years of schooling.
Percent of
Students
Mean Achievement
Mean Achievement
Percent of
Students
Mean Achievement
Percent of
Students
Country
Mean Achievement
Finished University1
Finished Upper Secondary
but Not University2
Finished Primary but Not Upper
Secondary3
Percent of
Students

Table 14Physics Students' Reports on Their Plans for Future Education†
Physics – Final Year of Secondary School*
NSF Physics Programs 95 (0.5) 478 (1.4) 2 (0.0) ~ ~ 3 (0.5) 462 (11.5) 0 (0.0) ~ ~
Australia 89 (1.6) 524 (7.0) 4 (1.0) 460 (13.4) 2 (0.8) ~ ~ 4 (1.3) 455 (9.4)
Austria 68 (2.0) 444 (7.1) 12 (1.5) 413 (12.8) 6 (1.0) 417 (12.6) 14 (1.6) 421 (13.1)
Canada 82 (1.6) 488 (4.7) 5 (1.2) 462 (10.3) 12 (1.8) 485 (12.6) 1 (0.9) ~ ~
Cyprus 91 (1.5) 500 (5.1) 6 (1.3) 454 (26.3) 2 (0.7) ~ ~ 1 (0.7) ~ ~
Czech Republic 93 (1.0) 456 (6.5) 5 (0.7) 396 (8.9) 1 (0.3) ~ ~ 2 (0.5) ~ ~
Denmark r 74 (2.0) 555 (6.6) 5 (1.1) 453 (15.8) 10 (1.4) 490 (13.4) 10 (1.5) 518 (15.5)
France 75 (1.7) 471 (4.4) 12 (1.2) 453 (5.6) 12 (1.0) 457 (6.9) 1 (0.4) ~ ~
Germany 76 (5.5) 540 (9.6) 17 (4.6) 456 (17.9) 3 (0.9) 493 (22.1) 3 (0.8) 501 (15.1)
Greece 86 (1.9) 499 (5.2) 5 (1.3) 430 (19.7) 8 (1.2) 432 (15.4) 2 (0.7) ~ ~
Latvia (LSS) 85 (1.4) 491 (21.1) 7 (0.8) 478 (17.7) 8 (1.0) 447 (30.9) 1 (0.4) ~ ~
Norway 75 (2.2) 595 (6.4) 19 (1.9) 554 (10.8) 5 (0.9) 535 (11.5) 1 (0.3) ~ ~
Russian Federation 89 (2.2) 554 (10.7) 9 (1.9) 473 (24.2) 2 (0.5) ~ ~ 0 (0.1) ~ ~
Slovenia 92 (1.6) 526 (16.5) 5 (1.3) 485 (20.4) 1 (0.5) ~ ~ 1 (0.6) ~ ~
Sweden 92 (0.8) 580 (3.7) 3 (0.7) 503 (24.8) 4 (0.6) 508 (15.2) 2 (0.5) ~ ~
Switzerland 90 (1.1) 492 (3.7) 2 (0.5) ~ ~ 4 (0.5) 454 (11.5) 4 (1.0) 465 (17.5)
United States 92 (0.7) 425 (3.4) 3 (0.4) 383 (6.7) 5 (0.7) 391 (6.4) 0 (0.0) ~ ~
† Educational options were defined by each country to conform to their national systems and may not be comparable across countries.* See Mullis and others, 1998 Appendix A for characteristics of the students sampled.1 In most countries, defined as at least a 3-year degree program at a university or an equivalent institute of higher education.2
3
( ) Standard errors appear in parentheses. Because results are rounded to the nearest whole number, some totals may appear inconsistent.
Because population coverage falls below 65%, Latvia is annotated LSS for Latvian Speaking Schools only.An "r" indicates a 70-84% student response rate.A tilde (~) indicates insufficient data to report achievement.See Mullis and others, 1998 Figure 4.2 for definitions and any national adaptations of the international options in each category.
Mean Achievement
Percent of Students
Mean Achievement
Percent of Students
Mean Achievement
Percent of Students
Countries shown in italics did not satisfy one or more guidelines for sample participation rates or student sampling (see Mullis and others, 1998 Figure B.6).
Mean Achievement
Country
University1 Vocationally Oriented Programs2
Other Postsecondary3
Education
Defined in most countries as vocational or technical courses at a tertiary institution not equivalent to a university degree program (e.g., trade or business school, junior or community college, and other shorter vocational programs), but may also include higher-level upper secondary vocational programs in some countriesIncludes other postsecondary education defined in each country. Includes categories such as academic courses at junior or community college, short university or polytechnic courses, and college-preparatory courses.
Does Not Intend to Continue Education
Percent of Students

Table 15Physics Students' Reports on the Area They Intend to Study After Secondary School†
Physics – Final Year of Secondary School*
NSF Physics Programs 6 (0.1) 6 (0.3) 14 (0.2) 13 (0.1) 22 (0.7) 14 (0.2) 25 (0.6)
Australia 8 (1.4) 8 (1.2) 21 (2.2) 15 (2.8) 27 (3.0) 8 (1.2) 12 (2.1)
Austria s 4 (1.0) 5 (1.3) 20 (1.9) 5 (1.2) 8 (1.6) 15 (1.8) 43 (2.7)
Canada 8 (1.0) 9 (1.3) 27 (1.5) 10 (0.7) 22 (1.9) 10 (1.3) 15 (1.0)
Cyprus 7 (1.5) 5 (1.3) 25 (2.4) 19 (1.8) 22 (1.7) 4 (1.1) 19 (1.6)
Czech Republic 2 (0.5) 14 (1.5) 13 (1.1) 12 (1.3) 3 (0.6) 20 (1.8) 37 (3.3)
Denmark r 10 (1.5) 5 (1.3) 12 (1.6) 12 (1.5) 29 (2.7) 11 (1.5) 22 (2.7)
France 10 (1.3) 18 (1.8) 19 (1.3) 18 (1.2) 15 (1.6) 7 (1.1) 14 (1.3)
Germany 8 (1.7) 4 (0.8) 7 (1.8) 13 (2.2) 18 (1.5) 26 (3.9) 24 (2.6)
Greece 13 (1.9) 2 (0.9) 0 (0.3) 36 (2.1) 28 (2.1) 2 (0.9) 18 (1.8)
Latvia (LSS) 3 (0.6) 5 (0.8) 8 (1.2) 12 (1.6) 6 (0.9) 35 (2.3) 32 (2.6)
Norway 12 (1.0) 4 (0.9) 20 (1.3) 13 (1.5) 30 (1.7) 7 (1.1) 15 (0.9)
Russian Federation 6 (1.0) 3 (0.8) 6 (1.3) 29 (2.3) 9 (1.0) 30 (1.9) 17 (1.5)
Slovenia 7 (1.6) 5 (0.9) 12 (2.2) 21 (3.3) 18 (3.6) 18 (2.0) 19 (2.9)
Sweden 8 (1.2) 7 (1.1) 11 (1.9) 12 (2.2) 42 (3.6) 4 (0.7) 17 (2.1)
Switzerland 5 (0.7) 7 (1.0) 18 (1.4) 4 (0.7) 8 (1.1) 14 (1.6) 46 (1.7)
United States 3 (0.6) 7 (0.7) 23 (1.5) 7 (0.7) 15 (1.3) 16 (1.2) 29 (1.9)
† Percentages based only on those students reporting that they intend to continue their education after secondary school.* See Mullis and others, 1998 Appendix A for characteristics of the students sampled.
( ) Standard errors appear in parentheses. Because results are rounded to the nearest whole number, some totals may appear inconsistent.
Because population coverage falls below 65%, Latvia is annotated LSS for Latvian Speaking Schools only.An "r" indicates a 70-84% student response rate. An "s" indicates a 50-69% student response rate.
Countries shown in italics did not satisfy one or more guidelines for sample participation rates or student sampling (see Mullis and others, 1998 Figure B.6).
CountryPhysics or Chemistry
Biological or Earth Sciences
Health Sciences or
Related Occupations
Percent of Students
Mathematics or
Computer/ Information
Sciences
Engineering Business Other

32
There were considerable differences between male and female physics students in their choice of area for further
study (Table 16). Among students choosing health sciences or related occupations, and to a lesser extent
biological or earth sciences, there were proportionately more females than males in many countries. For students
in the NSF-sponsored programs, approximately three times as many females than males indicated that they
intended to study in these occupations. However, in engineering, and in mathematics or computer/information
sciences, males often outnumbered females by a substantial margin. This pattern was also evident in the
responses of students in the NSF-sponsored physics programs where four times as many males indicated an
intention to study engineering, or mathematics or computer/information science compared to female students.

Table 16
Physics – Final Year of Secondary School*
Percent of Students
Country
Physics or Chemistry Biological or Earth Sciences
Health Sciences or Related Occupations
Mathematics or Computer /
Information Sciences
Males Females Males Females Males Females Males Females
NSF Physics Programs 4 (0.1) 8 (0.1) 4 (0.5) 7 (0.1) 7 (0.1) 23 (0.6) 20 (0.3) 5 (0.1)Australia 7 (1.8) 9 (2.5) 6 (1.5) 10 (2.5) 14 (2.6) 34 (4.1) 19 (4.0) 8 (2.3)Austria s 5 (1.7) 3 (1.1) 4 (2.1) 5 (1.5) 17 (2.4) 23 (2.8) 9 (2.5) 1 (0.7)Canada 7 (1.3) 8 (1.5) 7 (1.2) 11 (2.0) 16 (2.3) 39 (2.9) 14 (0.9) 6 (1.0)Cyprus 7 (2.0) 6 (1.5) 5 (1.6) 5 (2.1) 21 (3.4) 30 (3.8) 20 (2.1) 18 (3.4)Czech Republic 4 (0.9) 1 (0.6) 11 (1.9) 16 (1.8) 11 (1.9) 14 (1.6) 23 (2.2) 4 (1.0)Denmark r 11 (1.8) 9 (3.7) 5 (1.5) 5 (2.3) 8 (1.9) 25 (4.0) 14 (2.0) 4 (1.5)France 10 (1.4) 9 (1.9) 16 (2.1) 21 (2.5) 11 (1.6) 31 (2.6) 22 (1.7) 11 (1.7)Germany 8 (2.0) 7 (3.2) 4 (1.1) 4 (1.3) 5 (2.6) 10 (2.6) 18 (3.0) 4 (1.6)Greece 11 (2.2) 16 (3.3) 2 (0.8) 3 (1.4) 0 (0.3) 1 (0.5) 36 (2.6) 37 (5.2)Latvia (LSS) 3 (0.9) 2 (1.3) 4 (1.4) 6 (1.4) 5 (1.6) 11 (1.6) 18 (2.3) 7 (1.1)Norway 13 (1.2) 9 (1.5) 4 (1.1) 4 (1.1) 12 (1.4) 41 (2.6) 14 (1.7) 7 (2.2)Russian Federation 9 (1.8) 3 (1.3) 3 (1.3) 3 (1.0) 3 (0.8) 11 (2.5) 36 (2.8) 20 (2.8)Slovenia 7 (1.5) 8 (5.0) 5 (1.2) 5 (2.3) 7 (2.3) 24 (5.3) 26 (4.4) 10 (2.6)Sweden 6 (1.4) 11 (1.9) 5 (1.1) 13 (2.4) 4 (0.9) 25 (4.0) 17 (2.9) 3 (1.0)Switzerland 7 (1.2) 2 (0.7) 7 (1.3) 7 (1.2) 10 (1.4) 25 (2.4) 5 (1.1) 2 (0.8)United States 5 (0.8) 2 (0.5) 7 (0.9) 8 (0.9) 16 (2.4) 31 (2.5) 10 (1.1) 4 (0.6)
* See Mullis and others, 1998 Appendix A for characteristics of the students sampled.
Because population coverage falls below 65%, Latvia is annotated LSS for Latvian Speaking Schools only.( ) Standard errors appear in parentheses. Because results are rounded to the nearest whole number, some totals may appear inconsistent.
An "r" indicates a 70-84% student response rate. An "s" indicates a 50-69% student response rate.
Countries shown in italics did not satisfy one or more guidelines for sample participation rates or student sampling (see Mullis and others, 1998 Figure B.6).
Physics Students' Reports on the Area They Intend to Study After Secondary School by Gender
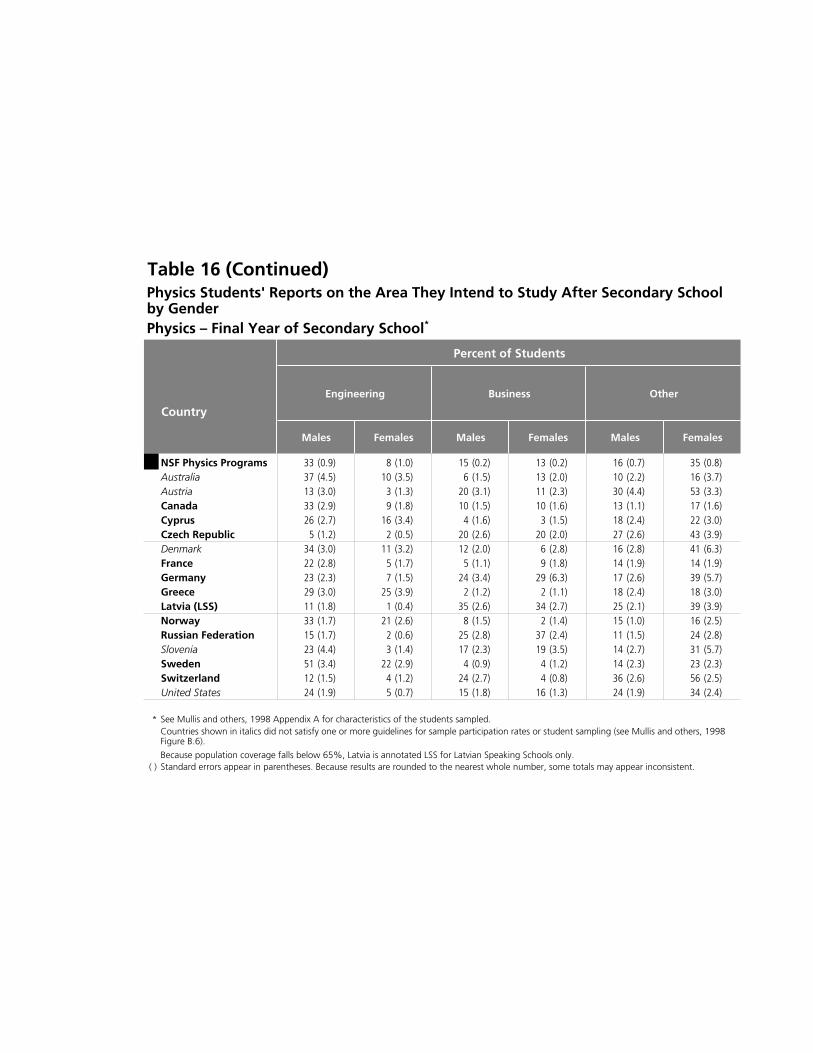
Table 16 (Continued)
Physics – Final Year of Secondary School*
Percent of Students
Country
Engineering Business Other
Males Females Males Females Males Females
NSF Physics Programs 33 (0.9) 8 (1.0) 15 (0.2) 13 (0.2) 16 (0.7) 35 (0.8)Australia 37 (4.5) 10 (3.5) 6 (1.5) 13 (2.0) 10 (2.2) 16 (3.7)Austria 13 (3.0) 3 (1.3) 20 (3.1) 11 (2.3) 30 (4.4) 53 (3.3)Canada 33 (2.9) 9 (1.8) 10 (1.5) 10 (1.6) 13 (1.1) 17 (1.6)Cyprus 26 (2.7) 16 (3.4) 4 (1.6) 3 (1.5) 18 (2.4) 22 (3.0)Czech Republic 5 (1.2) 2 (0.5) 20 (2.6) 20 (2.0) 27 (2.6) 43 (3.9)Denmark 34 (3.0) 11 (3.2) 12 (2.0) 6 (2.8) 16 (2.8) 41 (6.3)France 22 (2.8) 5 (1.7) 5 (1.1) 9 (1.8) 14 (1.9) 14 (1.9)Germany 23 (2.3) 7 (1.5) 24 (3.4) 29 (6.3) 17 (2.6) 39 (5.7)Greece 29 (3.0) 25 (3.9) 2 (1.2) 2 (1.1) 18 (2.4) 18 (3.0)Latvia (LSS) 11 (1.8) 1 (0.4) 35 (2.6) 34 (2.7) 25 (2.1) 39 (3.9)Norway 33 (1.7) 21 (2.6) 8 (1.5) 2 (1.4) 15 (1.0) 16 (2.5)Russian Federation 15 (1.7) 2 (0.6) 25 (2.8) 37 (2.4) 11 (1.5) 24 (2.8)Slovenia 23 (4.4) 3 (1.4) 17 (2.3) 19 (3.5) 14 (2.7) 31 (5.7)Sweden 51 (3.4) 22 (2.9) 4 (0.9) 4 (1.2) 14 (2.3) 23 (2.3)Switzerland 12 (1.5) 4 (1.2) 24 (2.7) 4 (0.8) 36 (2.6) 56 (2.5)United States 24 (1.9) 5 (0.7) 15 (1.8) 16 (1.3) 24 (1.9) 34 (2.4)
* See Mullis and others, 1998 Appendix A for characteristics of the students sampled.
Because population coverage falls below 65%, Latvia is annotated LSS for Latvian Speaking Schools only.( ) Standard errors appear in parentheses. Because results are rounded to the nearest whole number, some totals may appear inconsistent.
Countries shown in italics did not satisfy one or more guidelines for sample participation rates or student sampling (see Mullis and others, 1998 Figure B.6).
Physics Students' Reports on the Area They Intend to Study After Secondary School by Gender
35
APPENDIX
MATHEMATICS AND SCIENCE LITERACYTABLES AND FIGURES

Table A1
Country Mean TCI‡Average
AgeMathematics and Science Literacy
Achievement Scale Score
NSF Physics Programs ▲ 587 (3.6) – 17.9 Sweden ▲ 555 (4.3) 71% 18.9 Switzerland ▲ 531 (5.4) 82% 19.8 † New Zealand ▲ 525 (4.7) 70% 17.6 Hungary ▼ 477 (3.0) 65% 17.5 2 Russian Federation ▼ 476 (5.8) 48% 16.9 Czech Republic ● 476 (10.5) 78% 17.8 1 Lithuania ▼ 465 (5.8) 43% 18.1 2 Cyprus ▼ 447 (2.5) 48% 17.7
Australia ● 525 (9.5) 68% 17.7 2 Austria ▲ 519 (5.4) 76% 19.1 Canada ▲ 526 (2.6) 70% 18.6 France ● 505 (4.9) 84% 18.8 Iceland ▲ 541 (1.6) 55% 21.2 1 Italy ▼ 475 (5.3) 52% 18.7 Norway ▲ 536 (4.0) 84% 19.5 United States ▼ 471 (3.1) 63% 18.2
† Germany ● 496 (5.4) 75% 19.4
Denmark ▲ 528 (3.2) 58% 19.1 2 Netherlands ▲ 559 (4.9) 78% 18.5 Slovenia ● 514 (8.2) 88% 18.8 South Africa ▼ 352 (9.3) 49% 20.1
International Average = 500Average of all country means
▲ Country mean significantly higher than international mean
▼ Country mean significantly lower than international mean
●
* See Mullis and others, 1998 Appendix A for characteristics of students sampled.‡
†
1 National Desired Population does not cover all of International Desired Population (see Mullis and others, 1998 Table B.4).2 National Defined Population covers less than 90 percent of National Desired Population (see Mullis and others, 1998 Table B.4).
( ) Standard errors appear in parentheses. Because results are rounded to the nearest whole number, some totals may appear inconsistent.
Distributions of Mathematics and Science Literacy Achievement for Students in Their Final Year of Secondary School*
Met guidelines for sample participation rates only after replacement schools were included (see Mullis and Others, 1998 Appendix B for details).
Countries With Unapproved Student Sampling (See Appendix B for Details)
Countries With Unapproved Sampling Procedures and Low Participation Rates (See Appendix B for Details)
Countries Not Satisfying Guidelines for Sample Participation Rates (See Appendix B for Details)
The TIMSS Coverage Index (TCI) is an estimate of the percentage of the school-leaving age cohort covered by the TIMSS final-year student sample (see Mullis and others, 1998 Appendix B for more information).
No statistically significant difference between country mean and international mean
200 250 300 350 400 450 500 550 600 650 700 750 800
5th 25th 75th 95th
Mean and Confidence Interval (±2SE)
Percentiles of Performance
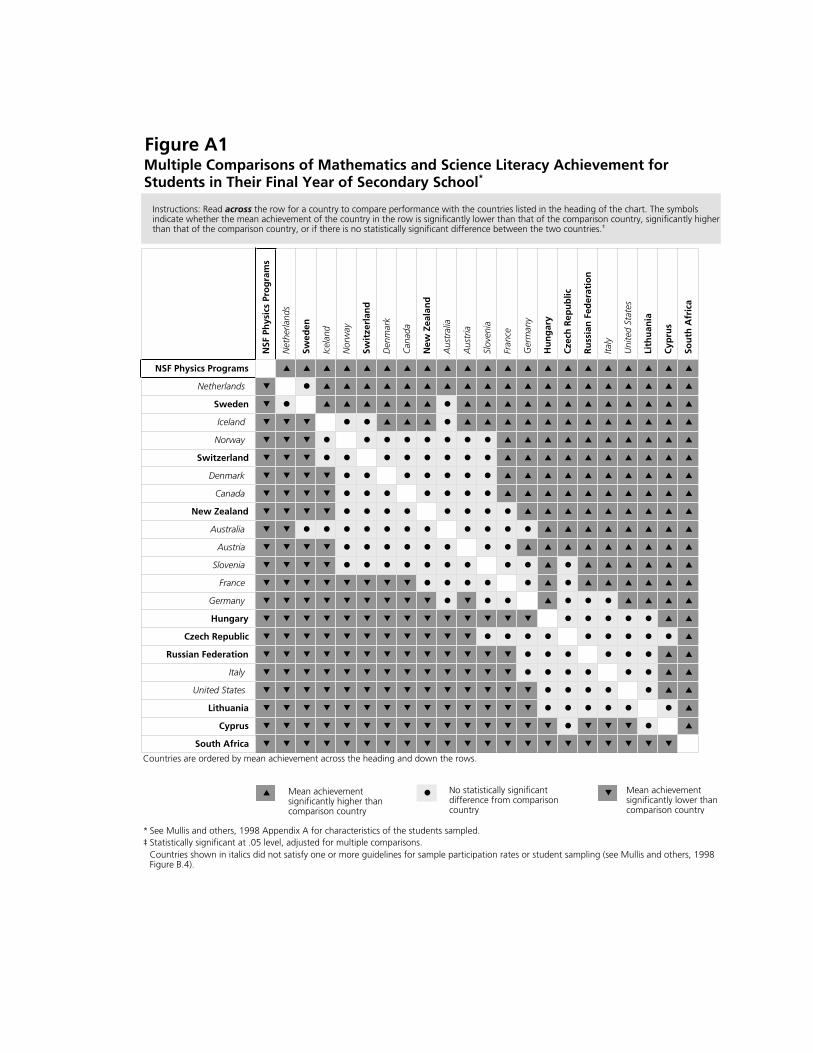
Figure A1
NSF
Ph
ysic
s Pr
og
ram
s
Net
herla
nds
Swed
en
Icel
and
Nor
way
Swit
zerl
and
Den
mar
k
Can
ada
New
Zea
lan
d
Aus
tral
ia
Aus
tria
Slov
enia
Fran
ce
Ger
man
y
Hu
ng
ary
Cze
ch R
epu
blic
Ru
ssia
n F
eder
atio
n
Italy
Uni
ted
Stat
es
Lith
uan
ia
Cyp
rus
Sou
th A
fric
a
NSF Physics Programs ▲ ▲ ▲ ▲ ▲ ▲ ▲ ▲ ▲ ▲ ▲ ▲ ▲ ▲ ▲ ▲ ▲ ▲ ▲ ▲ ▲
Netherlands ▼ ● ▲ ▲ ▲ ▲ ▲ ▲ ▲ ▲ ▲ ▲ ▲ ▲ ▲ ▲ ▲ ▲ ▲ ▲ ▲
Sweden ▼ ● ▲ ▲ ▲ ▲ ▲ ▲ ● ▲ ▲ ▲ ▲ ▲ ▲ ▲ ▲ ▲ ▲ ▲ ▲
Iceland ▼ ▼ ▼ ● ● ▲ ▲ ▲ ● ▲ ▲ ▲ ▲ ▲ ▲ ▲ ▲ ▲ ▲ ▲ ▲
Norway ▼ ▼ ▼ ● ● ● ● ● ● ● ● ▲ ▲ ▲ ▲ ▲ ▲ ▲ ▲ ▲ ▲
Switzerland ▼ ▼ ▼ ● ● ● ● ● ● ● ● ▲ ▲ ▲ ▲ ▲ ▲ ▲ ▲ ▲ ▲
Denmark ▼ ▼ ▼ ▼ ● ● ● ● ● ● ● ▲ ▲ ▲ ▲ ▲ ▲ ▲ ▲ ▲ ▲
Canada ▼ ▼ ▼ ▼ ● ● ● ● ● ● ● ▲ ▲ ▲ ▲ ▲ ▲ ▲ ▲ ▲ ▲
New Zealand ▼ ▼ ▼ ▼ ● ● ● ● ● ● ● ● ▲ ▲ ▲ ▲ ▲ ▲ ▲ ▲ ▲
Australia ▼ ▼ ● ● ● ● ● ● ● ● ● ● ● ▲ ▲ ▲ ▲ ▲ ▲ ▲ ▲
Austria ▼ ▼ ▼ ▼ ● ● ● ● ● ● ● ● ▲ ▲ ▲ ▲ ▲ ▲ ▲ ▲ ▲
Slovenia ▼ ▼ ▼ ▼ ● ● ● ● ● ● ● ● ● ▲ ● ▲ ▲ ▲ ▲ ▲ ▲
France ▼ ▼ ▼ ▼ ▼ ▼ ▼ ▼ ● ● ● ● ● ▲ ● ▲ ▲ ▲ ▲ ▲ ▲
Germany ▼ ▼ ▼ ▼ ▼ ▼ ▼ ▼ ▼ ● ▼ ● ● ▲ ● ● ● ▲ ▲ ▲ ▲
Hungary ▼ ▼ ▼ ▼ ▼ ▼ ▼ ▼ ▼ ▼ ▼ ▼ ▼ ▼ ● ● ● ● ● ▲ ▲
Czech Republic ▼ ▼ ▼ ▼ ▼ ▼ ▼ ▼ ▼ ▼ ▼ ● ● ● ● ● ● ● ● ● ▲
Russian Federation ▼ ▼ ▼ ▼ ▼ ▼ ▼ ▼ ▼ ▼ ▼ ▼ ▼ ● ● ● ● ● ● ▲ ▲
Italy ▼ ▼ ▼ ▼ ▼ ▼ ▼ ▼ ▼ ▼ ▼ ▼ ▼ ● ● ● ● ● ● ▲ ▲
United States ▼ ▼ ▼ ▼ ▼ ▼ ▼ ▼ ▼ ▼ ▼ ▼ ▼ ▼ ● ● ● ● ● ▲ ▲
Lithuania ▼ ▼ ▼ ▼ ▼ ▼ ▼ ▼ ▼ ▼ ▼ ▼ ▼ ▼ ● ● ● ● ● ● ▲
Cyprus ▼ ▼ ▼ ▼ ▼ ▼ ▼ ▼ ▼ ▼ ▼ ▼ ▼ ▼ ▼ ● ▼ ▼ ▼ ● ▲
South Africa ▼ ▼ ▼ ▼ ▼ ▼ ▼ ▼ ▼ ▼ ▼ ▼ ▼ ▼ ▼ ▼ ▼ ▼ ▼ ▼ ▼
Countries are ordered by mean achievement across the heading and down the rows.
▲ ● ▼
* See Mullis and others, 1998 Appendix A for characteristics of the students sampled.‡ Statistically significant at .05 level, adjusted for multiple comparisons.
Instructions: Read across the row for a country to compare performance with the countries listed in the heading of the chart. The symbols indicate whether the mean achievement of the country in the row is significantly lower than that of the comparison country, significantly higher than that of the comparison country, or if there is no statistically significant difference between the two countries.‡
Countries shown in italics did not satisfy one or more guidelines for sample participation rates or student sampling (see Mullis and others, 1998 Figure B.4).
Multiple Comparisons of Mathematics and Science Literacy Achievement for Students in Their Final Year of Secondary School*
Mean achievement significantly higher than comparison country
No statistically significant difference from comparison country
Mean achievement significantly lower than comparison country

Table A2Gender Differences in Mathematics and Science Literacy Achievement for Students inTheir Final Year of Secondary School*
NSF Physics Programs 57 (1.4) 592 (4.7) 43 (1.4) 584 (5.7) 8 (7.4) – Hungary 52 (2.5) 485 (4.5) 48 (2.5) 468 (4.5) 17 (6.3) 65%
2 Cyprus 45 (2.1) 456 (4.9) 55 (2.1) 439 (3.0) 18 (5.8) 48%1 Lithuania 35 (3.0) 483 (6.7) 65 (3.0) 456 (7.4) 27 (10.0) 43%† New Zealand 49 (1.7) 540 (5.7) 51 (1.7) 511 (5.5) 28 (7.9) 70% Switzerland 56 (2.5) 547 (6.0) 44 (2.5) 511 (7.5) 37 (9.6) 82%
2 Russian Federation 38 (1.0) 499 (5.9) 62 (1.0) 462 (6.5) 37 (8.8) 48% Sweden 49 (2.5) 579 (5.9) 51 (2.5) 533 (3.6) 46 (6.9) 71% Czech Republic 51 (5.1) 500 (9.9) 49 (5.1) 452 (13.8) 48 (17.0) 78%
Australia 42 (2.9) 543 (10.7) 58 (2.9) 511 (9.3) 32 (14.2) 68%2 Austria 39 (3.2) 549 (7.8) 61 (3.2) 502 (5.5) 47 (9.6) 76% Canada 47 (1.4) 544 (3.4) 53 (1.4) 511 (3.4) 33 (4.8) 70% France 47 (3.1) 526 (5.9) 53 (3.1) 487 (4.8) 38 (7.6) 84% Iceland 48 (0.8) 565 (2.9) 52 (0.8) 522 (1.9) 43 (3.5) 55%
1 Italy 46 (3.3) 492 (6.9) 54 (3.3) 461 (5.7) 31 (8.9) 52% Norway 51 (2.0) 564 (5.0) 49 (2.0) 507 (4.5) 57 (6.8) 84% United States 50 (1.3) 479 (4.2) 50 (1.3) 462 (3.5) 17 (5.5) 63%
† Germany 56 (5.2) 512 (8.2) 44 (5.2) 479 (8.5) 32 (11.8) 75%
Denmark 45 (2.0) 554 (4.5) 55 (2.0) 507 (3.7) 47 (5.8) 58%2 Netherlands 52 (2.3) 584 (5.5) 48 (2.3) 533 (5.9) 51 (8.0) 78% Slovenia 51 (3.3) 538 (12.6) 49 (3.3) 492 (7.1) 46 (14.4) 88% South Africa 49 (1.6) 366 (10.3) 51 (1.6) 341 (11.8) 25 (15.7) 49%
Males Females Difference 519 483 36
*† Met guidelines for sample participation rates only after replacement schools were included (see Mullis and others, 1998 Appendix B for details).1 National Desired Population does not cover all of International Desired Population (see Mullis and others, 1998 Table B.4).2 National Defined Population covers less than 90 percent of National Desired Population (see Mullis and others, 1998 Table B.4).
( ) Standard errors appear in parentheses. Because results are rounded to the nearest whole number, some differences may appear inconsistent.
(Average of all country means)
See Mullis and others, 1998 Appendix A for characteristics of students tested.
Difference TCI Gender DifferenceCountry
Countries Not Satisfying Guidelines for Sample Participation Rates (See Appendix B for Details)
Males
International Averages
Percent of Students
Countries With Unapproved Student Sampling (See Appendix B for Details)
Countries With Unapproved Sampling Procedures and Low Participation Rates (See Appendix B for Details)
Percent of Students
Mean Achievement
Mean Achievement
Females
MalesScoreHigher
40120
Gender difference statistically significant at .05 level.
Gender difference not statistically significant.
80 40 0 80 120
FemalesScoreHigher
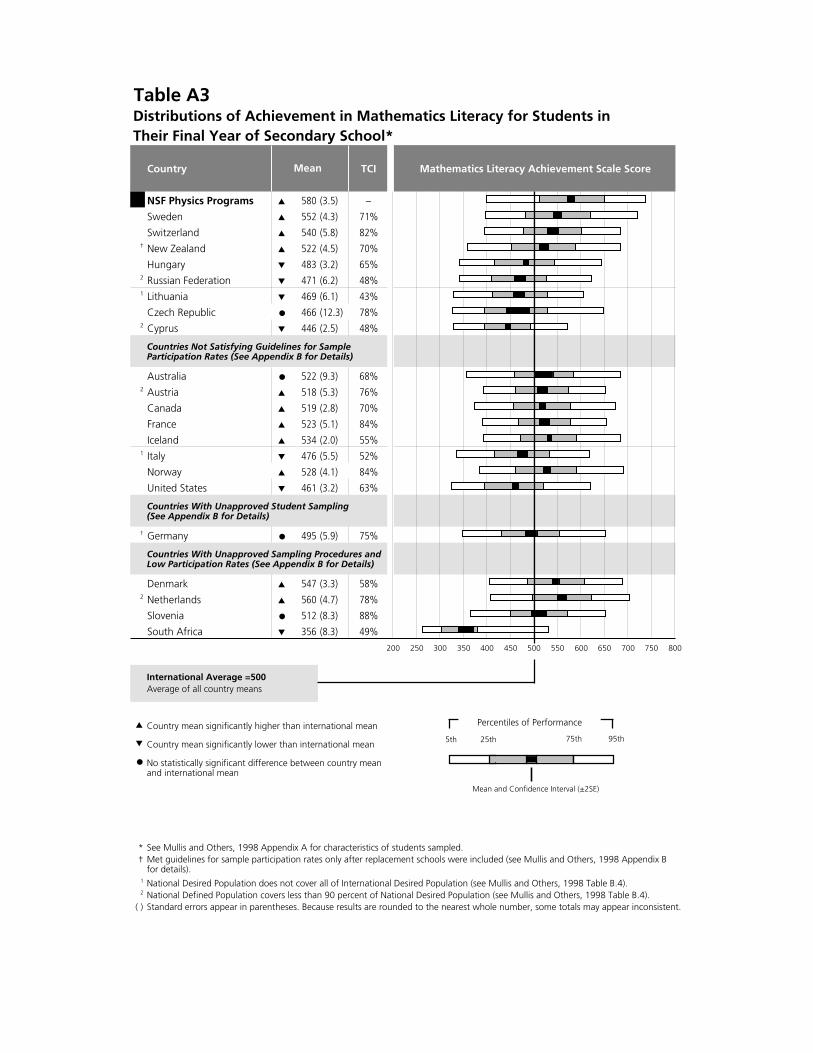
Table A3Distributions of Achievement in Mathematics Literacy for Students in Their Final Year of Secondary School*
Country Mean TCI Mathematics Literacy Achievement Scale Score
NSF Physics Programs ▲ 580 (3.5) – Sweden ▲ 552 (4.3) 71% Switzerland ▲ 540 (5.8) 82%
† New Zealand ▲ 522 (4.5) 70% Hungary ▼ 483 (3.2) 65%
2 Russian Federation ▼ 471 (6.2) 48%1 Lithuania ▼ 469 (6.1) 43% Czech Republic ● 466 (12.3) 78%
2 Cyprus ▼ 446 (2.5) 48%
Australia ● 522 (9.3) 68%2 Austria ▲ 518 (5.3) 76% Canada ▲ 519 (2.8) 70% France ▲ 523 (5.1) 84% Iceland ▲ 534 (2.0) 55%
1 Italy ▼ 476 (5.5) 52% Norway ▲ 528 (4.1) 84% United States ▼ 461 (3.2) 63%
† Germany ● 495 (5.9) 75%
Denmark ▲ 547 (3.3) 58%2 Netherlands ▲ 560 (4.7) 78% Slovenia ● 512 (8.3) 88% South Africa ▼ 356 (8.3) 49%
International Average =500Average of all country means
▲ Country mean significantly higher than international mean
▼ Country mean significantly lower than international mean
●
* See Mullis and Others, 1998 Appendix A for characteristics of students sampled.†
1 National Desired Population does not cover all of International Desired Population (see Mullis and Others, 1998 Table B.4).2 National Defined Population covers less than 90 percent of National Desired Population (see Mullis and Others, 1998 Table B.4).
( )
Countries Not Satisfying Guidelines for Sample Participation Rates (See Appendix B for Details)
Countries With Unapproved Sampling Procedures and Low Participation Rates (See Appendix B for Details)
Standard errors appear in parentheses. Because results are rounded to the nearest whole number, some totals may appear inconsistent.
Countries With Unapproved Student Sampling(See Appendix B for Details)
No statistically significant difference between country mean and international mean
Met guidelines for sample participation rates only after replacement schools were included (see Mullis and Others, 1998 Appendix B for details).
200 250 300 350 400 450 500 550 600 650 700 750 800
5th 25th 75th 95th
Mean and Confidence Interval (±2SE)
Percentiles of Performance
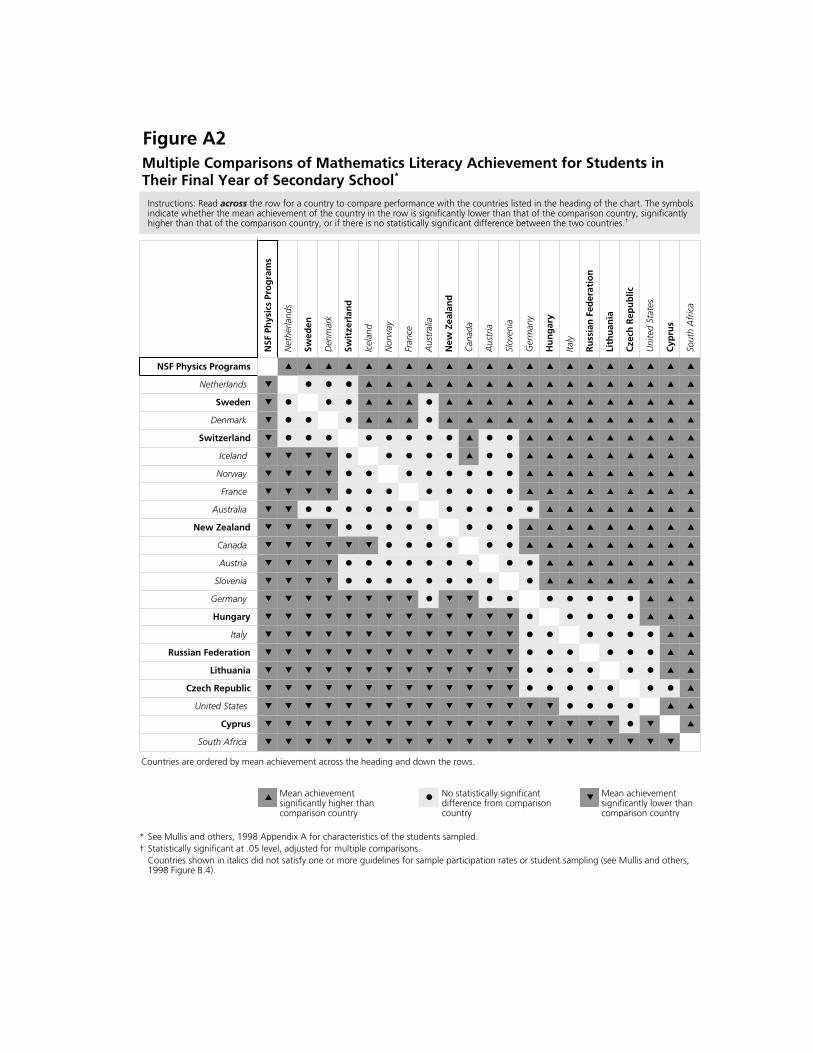
Figure A2
NSF
Ph
ysic
s Pr
og
ram
s
Net
herla
nds
Swed
en
Den
mar
k
Swit
zerl
and
Icel
and
Nor
way
Fran
ce
Aus
tral
ia
New
Zea
lan
d
Can
ada
Aus
tria
Slov
enia
Ger
man
y
Hu
ng
ary
Italy
Ru
ssia
n F
eder
atio
n
Lith
uan
ia
Cze
ch R
epu
blic
Uni
ted
Stat
es
Cyp
rus
Sout
h A
fric
a
NSF Physics Programs ▲ ▲ ▲ ▲ ▲ ▲ ▲ ▲ ▲ ▲ ▲ ▲ ▲ ▲ ▲ ▲ ▲ ▲ ▲ ▲ ▲
Netherlands ▼ ● ● ● ▲ ▲ ▲ ▲ ▲ ▲ ▲ ▲ ▲ ▲ ▲ ▲ ▲ ▲ ▲ ▲ ▲
Sweden ▼ ● ● ● ▲ ▲ ▲ ● ▲ ▲ ▲ ▲ ▲ ▲ ▲ ▲ ▲ ▲ ▲ ▲ ▲
Denmark ▼ ● ● ● ▲ ▲ ▲ ● ▲ ▲ ▲ ▲ ▲ ▲ ▲ ▲ ▲ ▲ ▲ ▲ ▲
Switzerland ▼ ● ● ● ● ● ● ● ● ▲ ● ● ▲ ▲ ▲ ▲ ▲ ▲ ▲ ▲ ▲
Iceland ▼ ▼ ▼ ▼ ● ● ● ● ● ▲ ● ● ▲ ▲ ▲ ▲ ▲ ▲ ▲ ▲ ▲
Norway ▼ ▼ ▼ ▼ ● ● ● ● ● ● ● ● ▲ ▲ ▲ ▲ ▲ ▲ ▲ ▲ ▲
France ▼ ▼ ▼ ▼ ● ● ● ● ● ● ● ● ▲ ▲ ▲ ▲ ▲ ▲ ▲ ▲ ▲
Australia ▼ ▼ ● ● ● ● ● ● ● ● ● ● ● ▲ ▲ ▲ ▲ ▲ ▲ ▲ ▲
New Zealand ▼ ▼ ▼ ▼ ● ● ● ● ● ● ● ● ▲ ▲ ▲ ▲ ▲ ▲ ▲ ▲ ▲
Canada ▼ ▼ ▼ ▼ ▼ ▼ ● ● ● ● ● ● ▲ ▲ ▲ ▲ ▲ ▲ ▲ ▲ ▲
Austria ▼ ▼ ▼ ▼ ● ● ● ● ● ● ● ● ● ▲ ▲ ▲ ▲ ▲ ▲ ▲ ▲
Slovenia ▼ ▼ ▼ ▼ ● ● ● ● ● ● ● ● ● ▲ ▲ ▲ ▲ ▲ ▲ ▲ ▲
Germany ▼ ▼ ▼ ▼ ▼ ▼ ▼ ▼ ● ▼ ▼ ● ● ● ● ● ● ● ▲ ▲ ▲
Hungary ▼ ▼ ▼ ▼ ▼ ▼ ▼ ▼ ▼ ▼ ▼ ▼ ▼ ● ● ● ● ● ▲ ▲ ▲
Italy ▼ ▼ ▼ ▼ ▼ ▼ ▼ ▼ ▼ ▼ ▼ ▼ ▼ ● ● ● ● ● ● ▲ ▲
Russian Federation ▼ ▼ ▼ ▼ ▼ ▼ ▼ ▼ ▼ ▼ ▼ ▼ ▼ ● ● ● ● ● ● ▲ ▲
Lithuania ▼ ▼ ▼ ▼ ▼ ▼ ▼ ▼ ▼ ▼ ▼ ▼ ▼ ● ● ● ● ● ● ▲ ▲
Czech Republic ▼ ▼ ▼ ▼ ▼ ▼ ▼ ▼ ▼ ▼ ▼ ▼ ▼ ● ● ● ● ● ● ● ▲
United States ▼ ▼ ▼ ▼ ▼ ▼ ▼ ▼ ▼ ▼ ▼ ▼ ▼ ▼ ▼ ● ● ● ● ▲ ▲
Cyprus ▼ ▼ ▼ ▼ ▼ ▼ ▼ ▼ ▼ ▼ ▼ ▼ ▼ ▼ ▼ ▼ ▼ ▼ ● ▼ ▲
South Africa ▼ ▼ ▼ ▼ ▼ ▼ ▼ ▼ ▼ ▼ ▼ ▼ ▼ ▼ ▼ ▼ ▼ ▼ ▼ ▼ ▼
Countries are ordered by mean achievement across the heading and down the rows.
▲ ● ▼
* See Mullis and others, 1998 Appendix A for characteristics of the students sampled.† Statistically significant at .05 level, adjusted for multiple comparisons.
Instructions: Read across the row for a country to compare performance with the countries listed in the heading of the chart. The symbols indicate whether the mean achievement of the country in the row is significantly lower than that of the comparison country, significantly higher than that of the comparison country, or if there is no statistically significant difference between the two countries.†
Multiple Comparisons of Mathematics Literacy Achievement for Students in Their Final Year of Secondary School*
Countries shown in italics did not satisfy one or more guidelines for sample participation rates or student sampling (see Mullis and others, 1998 Figure B.4).
Mean achievement significantly higher than comparison country
No statistically significant difference from comparison country
Mean achievement significantly lower than comparison country

Table A4Distributions of Achievement in Science Literacy for Students in TheirFinal Year of Secondary School*
Country TCI‡
NSF Physics Programs ▲ 595 (4.1) – Sweden ▲ 559 (4.4) 71%† New Zealand ▲ 529 (5.2) 70% Switzerland ▲ 523 (5.3) 82% Czech Republic ● 487 (8.8) 78%
2 Russian Federation ▼ 481 (5.7) 48% Hungary ▼ 471 (3.0) 65%1 Lithuania ▼ 461 (5.7) 43%2 Cyprus ▼ 448 (3.0) 48%
Australia ● 527 (9.8) 68%2 Austria ▲ 520 (5.6) 76% Canada ▲ 532 (2.6) 70% France ● 487 (5.1) 84% Iceland ▲ 549 (1.5) 55%
1 Italy ▼ 475 (5.3) 52% Norway ▲ 544 (4.1) 84% United States ▼ 480 (3.3) 63%
† Germany ● 497 (5.1) 75%
Denmark ● 509 (3.6) 58%2 Netherlands ▲ 558 (5.3) 78% Slovenia ● 517 (8.2) 88% South Africa ▼ 349 (10.5) 49%
International Average = 500Average of all country means
▲ Country mean significantly higher than international mean
▼ Country mean significantly lower than international mean
●
*†1
2
( )National Defined Population covers less than 90 percent of National Desired Population (see Mullis and others, 1998 Table B.4).Standard errors appear in parentheses. Because results are rounded to the nearest whole number, some totals may appear inconsistent.
No statistically significant difference between country mean and international mean
See Mullis and others, 1998 Appendix A for characteristics of students sampled.Met guidelines for sample participation rates only after replacement schools were included (see Mullis and others, 1998 Appendix B National Desired Population does not cover all of International Desired Population (see Mullis and others, 1998 Table B.4).
Countries With Unapproved Student Sampling (See Appendix B for Details)
Countries With Unapproved Sampling Procedures and Low Participation Rates (See Appendix B for Details)
Mean Science Literacy Achievement Scale Score
Countries Not Satisfying Guidelines for Sample Participation Rates (See Appendix B for Details)
5th 25th 75th 95th
Mean and Confidence Interval (±2SE)
Percentiles of Performance
200 250 300 350 400 450 500 550 600 650 700 750 800

Table A5Achievement in Mathematics Literacy by Gender for Students in Their Final Yearof Secondary School*
Hungary 52 (2.5) 485 (4.9) 48 (2.5) 481 (4.8) 5 (6.9) 65% NSF Physics Programs 57 (1.4) 583 (4.0) 43 (1.4) 577 (6.3) 6 (7.5) –2 Cyprus 45 (2.1) 454 (4.9) 55 (2.1) 439 (3.7) 15 (6.1) 48%1 Lithuania 35 (3.0) 485 (7.3) 65 (3.0) 461 (7.7) 23 (10.6) 43%2 Russian Federation 38 (1.0) 488 (6.5) 62 (1.0) 460 (6.6) 27 (9.2) 48%† New Zealand 49 (1.7) 536 (4.9) 51 (1.7) 507 (6.2) 29 (7.9) 70% Switzerland 56 (2.5) 555 (6.4) 44 (2.5) 522 (7.4) 33 (9.8) 82% Sweden 49 (2.5) 573 (5.9) 51 (2.5) 531 (3.9) 42 (7.1) 71% Czech Republic 51 (5.1) 488 (11.3) 49 (5.1) 443 (16.8) 45 (20.2) 78%
Australia 42 (2.9) 540 (10.3) 58 (2.9) 510 (9.3) 30 (13.9) 68%2 Austria 39 (3.2) 545 (7.2) 61 (3.2) 503 (5.5) 41 (9.0) 76% Canada 47 (1.4) 537 (3.8) 53 (1.4) 504 (3.5) 34 (5.2) 70% France 47 (3.1) 544 (5.6) 53 (3.1) 506 (5.3) 38 (7.7) 84% Iceland 48 (0.8) 558 (3.4) 52 (0.8) 514 (2.2) 44 (4.1) 55%1 Italy 46 (3.3) 490 (7.4) 54 (3.3) 464 (6.0) 26 (9.5) 52% Norway 51 (2.0) 555 (5.3) 49 (2.0) 501 (4.8) 54 (7.1) 84% United States 50 (1.3) 466 (4.1) 50 (1.3) 456 (3.6) 11 (5.5) 63%
† Germany 56 (5.2) 509 (8.7) 44 (5.2) 480 (8.8) 29 (12.4) 75%
Denmark 45 (2.0) 575 (4.0) 55 (2.0) 523 (4.0) 52 (5.7) 58%2 Netherlands 52 (2.3) 585 (5.6) 48 (2.3) 533 (5.9) 53 (8.2) 78% Slovenia 51 (3.3) 535 (12.7) 49 (3.3) 490 (8.0) 46 (15.0) 88% South Africa 49 (1.6) 365 (9.3) 51 (1.6) 348 (10.8) 17 (14.3) 49%
Males Females Difference 518 485 33
* See Mullis and others, 1998 Appendix A for characteristics of students sampled.†
1 National Desired Population does not cover all of International Desired Population (see Mullis and others, 1998 Table B.4).2 National Defined Population covers less than 90 percent of National Desired Population (see Mullis and others, 1998 Table B.4).
( )
Met guidelines for sample participation rates only after replacement schools were included (see Mullis and others, 1998 Appendix B for details).
TCICountry
Males
Percent of Students
Mean Achievement
Percent of Students
Gender Difference
Standard errors appear in parentheses. Because results are rounded to the nearest whole number, some differences may appear inconsistent.
Countries With Unapproved Sampling Procedures and Low Participation Rates (See Appendix B for Details)
International Averages
(Average of all country means)
Mean Achievement
Countries Not Satisfying Guidelines for Sample Participation Rates (See Appendix B for Details)
Females
Countries With Unapproved Student Sampling (See Appendix B for Details)
Difference
Gender difference statistically significant at .05 level.
Gender difference not statistically significant.
120 80 40 0 40 80 120

Table A6
NSF Physics Programs 57 (1.4) 601 (5.5) 43 (1.4) 590 (6.3) 11 (8.3) –2 Cyprus 45 (2.1) 459 (5.8) 55 (2.1) 439 (3.0) 20 (6.5) 48%† New Zealand 49 (1.7) 543 (7.1) 51 (1.7) 515 (5.2) 28 (8.8) 70% Hungary 52 (2.5) 484 (4.2) 48 (2.5) 455 (4.3) 29 (6.0) 65%1 Lithuania 35 (3.0) 481 (6.4) 65 (3.0) 450 (7.3) 31 (9.7) 43% Switzerland 56 (2.5) 540 (6.1) 44 (2.5) 500 (7.8) 40 (9.9) 82%2 Russian Federation 38 (1.0) 510 (5.7) 62 (1.0) 463 (6.7) 47 (8.8) 48% Sweden 49 (2.5) 585 (6.0) 51 (2.5) 534 (3.5) 51 (6.9) 71% Czech Republic 51 (5.1) 512 (8.8) 49 (5.1) 460 (11.0) 51 (14.0) 78%
Australia 42 (2.9) 547 (11.5) 58 (2.9) 513 (9.4) 34 (14.8) 68%2 Austria 39 (3.2) 554 (8.7) 61 (3.2) 501 (5.8) 53 (10.4) 76% Canada 47 (1.4) 550 (3.6) 53 (1.4) 518 (3.8) 32 (5.2) 70% France 47 (3.1) 508 (6.7) 53 (3.1) 468 (4.8) 39 (8.3) 84% Iceland 48 (0.8) 572 (2.7) 52 (0.8) 530 (2.1) 41 (3.4) 55%1 Italy 46 (3.3) 495 (6.7) 54 (3.3) 458 (5.6) 37 (8.8) 52% Norway 51 (2.0) 574 (5.1) 49 (2.0) 513 (4.5) 61 (6.8) 84% United States 50 (1.3) 492 (4.5) 50 (1.3) 469 (3.9) 23 (5.9) 63%
† Germany 56 (5.2) 514 (7.9) 44 (5.2) 478 (8.5) 35 (11.6) 75%
Denmark 45 (2.0) 532 (5.4) 55 (2.0) 490 (4.1) 41 (6.8) 58%2 Netherlands 52 (2.3) 582 (5.7) 48 (2.3) 532 (6.2) 49 (8.4) 78% Slovenia 51 (3.3) 541 (12.7) 49 (3.3) 494 (6.4) 47 (14.3) 88% South Africa 49 (1.6) 367 (11.5) 51 (1.6) 333 (13.0) 34 (17.4) 49%
Males Females Difference 521 482 39
* See Mullis and others, 1998 Appendix A for characteristics of students sampled.†
1 National Desired Population does not cover all of International Desired Population (see Mullis and others, 1998 Table B.4).2 National Defined Population covers less than 90 percent of National Desired Population (see Mullis and others, 1998 Table B.4).
( )
Achievement in Science Literacy by Gender for Students in Their Final Year of Secondary School*
Standard errors appear in parentheses. Because results are rounded to the nearest whole number, some differences may appear inconsistent.
Countries Not Satisfying Guidelines for Sample Participation Rates (See Appendix B for Details)
Countries With Unapproved Student Sampling (See Appendix B for Details)
Percent of Students
Country Difference TCIMean
Achievement
Met guidelines for sample participation rates only after replacement schools were included (see Mullis and others, 1998 Appendix B for details).
International Averages
Gender Difference
Countries With Unapproved Sampling Procedures and Low Participation Rates (See Appendix B for Details)
(Average of all country means)
FemalesMales
Percent of Students
Mean Achievement
MalesScoreHigher
FemalesScoreHigher
Gender difference statistically significant at .05 level.
Gender difference not statistically significant.
120 12080 40 0 40 80

Figure A3
NSF
Ph
ysic
s Pr
og
ram
s
Swed
en
Net
herla
nds
Icel
and
Nor
way
Can
ada
New
Zea
lan
d
Aus
tral
ia
Swit
zerl
and
Aus
tria
Slov
enia
Den
mar
k
Ger
man
y
Isra
el
Fran
ce
Cze
ch R
epu
blic
Ru
ssia
n F
eder
atio
n
Uni
ted
Stat
es
Italy
Hu
ng
ary
Lith
uan
ia
Cyp
rus
Sout
h A
fric
a
NSF Physics Programs ▲ ▲ ▲ ▲ ▲ ▲ ▲ ▲ ▲ ▲ ▲ ▲ ▲ ▲ ▲ ▲ ▲ ▲ ▲ ▲ ▲ ▲
Sweden ▼ ● ● ● ▲ ▲ ● ▲ ▲ ▲ ▲ ▲ ▲ ▲ ▲ ▲ ▲ ▲ ▲ ▲ ▲ ▲
Netherlands ▼ ● ● ● ▲ ▲ ● ▲ ▲ ▲ ▲ ▲ ▲ ▲ ▲ ▲ ▲ ▲ ▲ ▲ ▲ ▲
Iceland ▼ ● ● ● ▲ ▲ ● ▲ ▲ ▲ ▲ ▲ ▲ ▲ ▲ ▲ ▲ ▲ ▲ ▲ ▲ ▲
Norway ▼ ● ● ● ● ● ● ▲ ▲ ● ▲ ▲ ▲ ▲ ▲ ▲ ▲ ▲ ▲ ▲ ▲ ▲
Canada ▼ ▼ ▼ ▼ ● ● ● ● ● ● ▲ ▲ ▲ ▲ ▲ ▲ ▲ ▲ ▲ ▲ ▲ ▲
New Zealand ▼ ▼ ▼ ▼ ● ● ● ● ● ● ▲ ▲ ▲ ▲ ▲ ▲ ▲ ▲ ▲ ▲ ▲ ▲
Australia ▼ ● ● ● ● ● ● ● ● ● ● ● ● ▲ ▲ ▲ ▲ ▲ ▲ ▲ ▲ ▲
Switzerland ▼ ▼ ▼ ▼ ▼ ● ● ● ● ● ● ▲ ● ▲ ▲ ▲ ▲ ▲ ▲ ▲ ▲ ▲
Austria ▼ ▼ ▼ ▼ ▼ ● ● ● ● ● ● ▲ ● ▲ ▲ ▲ ▲ ▲ ▲ ▲ ▲ ▲
Slovenia ▼ ▼ ▼ ▼ ● ● ● ● ● ● ● ● ● ▲ ● ▲ ▲ ▲ ▲ ▲ ▲ ▲
Denmark ▼ ▼ ▼ ▼ ▼ ▼ ▼ ● ● ● ● ● ● ▲ ● ▲ ▲ ▲ ▲ ▲ ▲ ▲
Germany ▼ ▼ ▼ ▼ ▼ ▼ ▼ ● ▼ ▼ ● ● ● ● ● ● ● ● ▲ ▲ ▲ ▲
Israel ▼ ▼ ▼ ▼ ▼ ▼ ▼ ● ● ● ● ● ● ● ● ● ● ● ● ● ▲ ▲
France ▼ ▼ ▼ ▼ ▼ ▼ ▼ ▼ ▼ ▼ ▼ ▼ ● ● ● ● ● ● ● ▲ ▲ ▲
Czech Republic ▼ ▼ ▼ ▼ ▼ ▼ ▼ ▼ ▼ ▼ ● ● ● ● ● ● ● ● ● ● ▲ ▲
Russian Federation ▼ ▼ ▼ ▼ ▼ ▼ ▼ ▼ ▼ ▼ ▼ ▼ ● ● ● ● ● ● ● ● ▲ ▲
United States ▼ ▼ ▼ ▼ ▼ ▼ ▼ ▼ ▼ ▼ ▼ ▼ ● ● ● ● ● ● ● ● ▲ ▲
Italy ▼ ▼ ▼ ▼ ▼ ▼ ▼ ▼ ▼ ▼ ▼ ▼ ● ● ● ● ● ● ● ● ▲ ▲
Hungary ▼ ▼ ▼ ▼ ▼ ▼ ▼ ▼ ▼ ▼ ▼ ▼ ▼ ● ● ● ● ● ● ● ▲ ▲
Lithuania ▼ ▼ ▼ ▼ ▼ ▼ ▼ ▼ ▼ ▼ ▼ ▼ ▼ ● ▼ ● ● ● ● ● ● ▲
Cyprus ▼ ▼ ▼ ▼ ▼ ▼ ▼ ▼ ▼ ▼ ▼ ▼ ▼ ▼ ▼ ▼ ▼ ▼ ▼ ▼ ● ▲
South Africa ▼ ▼ ▼ ▼ ▼ ▼ ▼ ▼ ▼ ▼ ▼ ▼ ▼ ▼ ▼ ▼ ▼ ▼ ▼ ▼ ▼ ▼
Countries are ordered by mean achievement across the heading and down the rows.
▲ ● ▼
* See Mullis and others, 1998 Appendix A for characteristics of the students sampled.
† Statistically significant at .05 level, adjusted for multiple comparisons.
Instructions: Read across the row for a country to compare performance with the countries listed in the heading of the chart. The symbols indicate whether the mean achievement of the country in the row is significantly lower than that of the comparison country, significantly higher than that of the comparison country, or if there is no statistically significant difference between the two countries.†
Multiple Comparisons of Science Literacy Achievement for Students in Their Final Year of Secondary School*
Countries shown in italics did not satisfy one or more guidelines for sample participation rates or student sampling (see Mullis and others, 1998 Figure B.4).
Mean achievement significantly higher than comparison country
No statistically significant difference from comparison country
Mean achievement significantly lower than comparison country