TIMSS 2015 - ACER
98
A first look at Australia ’ s results Sue Thomson Nicole Wernert Elizabeth O’Grady Sima Rodrigues TIMSS 2015
Transcript of TIMSS 2015 - ACER
A first look at Australia’s results
Sue Thomson
Nicole Wernert
Elizabeth O’Grady
Sima Rodrigues
TIM
SS
2015
Su
e Th
om
son N
icole W
ernert E
lizab
eth O’G
rady S
ima R
od
rigu
es
TIMSS 2015
Sue Thomson
Nicole Wernert
Elizabeth O’Grady
Sima Rodrigues
A first look at Australia’s results
TIMSS 2015
First published 2016by Australian Council for Educational Research Ltd19 Prospect Hill Road, Camberwell, Victoria, 3124, Australia
www.acer.edu.auwww.acer.edu.au/timss
Text © Australian Council for Educational Research Ltd
This report is copyright. All rights reserved. Except under the conditions described in the Copyright Act 1968 of Australia and subsequent amendments, and any exceptions permitted under the current statutory licence scheme administered by Copyright Agency (www.copyright.com.au), no part of this publication may be reproduced, stored in a retrieval system, transmitted, broadcast or communicated in any form or by any means, optical, digital, electronic, mechanical, photocopying, recording or otherwise, without the written permission of the publisher.
Cover design, text design and typesetting by ACER Creative ServicesEdited by David Parnham
National Library of Australia Cataloguing-in-Publication entry
Thomson, S. (Susan), 1958– author.
TIMSS 2015: a first look at Australia’s results / Sue Thomson, Nicole Wernert, Elizabeth O’Grady, Sima Rodrigues.
ISBN: 978-1-74286-422-8 (ebook: PDF)
Trends in International Mathematics and Science Study.Mathematical ability—Testing.Scientific ability—Testing.Educational tests and measurements—Australia.Students—Rating of—AustraliaEducational evaluation—Australia.
Wernert, Nicole, author.O’Grady, Elizabeth Jane, author.Rodrigues, Sima, author.Australian Council for Educational Research, issuing body.
The views expressed in this report are those of the authors and not necessarily those of the Commonwealth, state and territory governments.
Contents iii
Contents
Acknowledgements ............................................................................................ iv
Executive summary ..............................................................................................v
List of figures and tables ...................................................................................viii
Reader’s Guide ...................................................................................................xi
Chapter 1 Introduction ....................................................................................................... 1
TIMSS 2015 ........................................................................................................ 1
Who participated in TIMSS 2015?...................................................................... 2
Assessment areas in TIMSS 2015 ...................................................................... 3
Reporting of results in TIMSS 2015 .................................................................... 4
Chapter 2 Year 4 mathematics .......................................................................................... 9
Australia’s Year 4 mathematics results within the international context ............. 9
Mathematics performance in TIMSS 2015 for the Australian jurisdictions ...... 15
Australia’s mathematics achievement for different demographic groups ........ 20
Chapter 3 Year 8 mathematics ........................................................................................ 27
Australia’s Year 8 mathematics results within the international context ........... 27
Mathematics performance in TIMSS 2015 for the Australian jurisdictions ...... 32
Australia’s mathematics achievement for different demographic groups ........ 37
Chapter 4 Year 4 science ................................................................................................. 47
Australia’s Year 4 science results within the international context ................... 47
Science performance in TIMSS 2015 for the Australian jurisdictions .............. 52
Australia’s science achievement for different demographic groups ................. 57
Chapter 5 Year 8 science ................................................................................................. 65
Australia’s Year 8 science results within the international context ................... 65
Science performance in TIMSS 2015 for the Australian jurisdictions .............. 70
Australia’s science achievement for different demographic groups ................. 75
iv TIMSS 2015: A first look at Australia’s results
AcknowledgementsThe funding for the Australian component of TIMSS 2015 was provided jointly by the Australian Government and the state and territory governments. All of Australia’s share of the international overheads and half of the basic funding for TIMSS within Australia was defrayed by the Australian Government Department of Education and Training (DET), while each state and territory government school system provided funding in proportion to the size of its student population.
In Australia, TIMSS is managed by a team from the Australian Council for Educational Research (ACER) and guided by the International Assessments Joint National Advisory Committee (IAJNAC). ACER wishes to thank the IAJNAC members for their continued interest in, and commitment to, the project throughout each of its phases. The IAJNAC members’ involvement included assisting with the implementation of TIMSS in schools in their jurisdiction, reviewing the report and providing valuable information to ensure the continued success of TIMSS in Australia.
The undertaking of TIMSS 2015 was a collaborative effort. A national survey such as TIMSS could not be successfully undertaken without the cooperation of the school systems, principals, teachers, parents and, of course, the students. Data of the quality collected and analysed in TIMSS depends upon a high participation rate of the randomly selected schools and students. Australia was able to satisfy the internationally set response criteria for schools and students for TIMSS 2015. ACER gratefully recognises the assistance both of education-system officials Australia wide, and of the principals, teachers, parents and students in the participating schools – who gave generously of their time and support in contributing to the project.
Parts of this report are reproduced and/or modified, with permission, from the TIMSS 2015 International Results in Mathematics report, the TIMSS 2015 International Results in Science report and the TIMSS 2015 Assessment Frameworks:
Î Mullis, I. V. S., Martin, M. O., Foy, P., & Hooper, M. (2016). TIMSS 2015 International Results in Mathematics. Retrieved from http://timssandpirls.bc.edu/timss2015/international-results.
Î Martin, M. O., Mullis, I. V. S., Foy, P., & Hooper, M. (2016). TIMSS 2015 International Results in Science. Retrieved from http://timssandpirls.bc.edu/timss2015/international-results.
Î Mullis, I. V. S. & Martin, M. O. (Eds). (2013). TIMSS 2015 Assessment Frameworks. Chestnut Hill, MA: TIMSS & PIRLS International Study Center, Boston College.
Executive summary
The Trends in International Mathematics and Science Study (TIMSS) is an international comparative study of student achievement directed by the International Association for the Evaluation of Educational Achievement (IEA). TIMSS 2015 represents the sixth such study since TIMSS was first conducted in 1995. Forty-nine education systems tested at Year 4 level and 39 tested at Year 8 level. In Australia, TIMSS is managed by the Australian Council for Educational Research (ACER) and is jointly funded by the Australian Government and the state and territory governments.
The goal of TIMSS is to provide comparative information about educational achievement across countries to improve teaching and learning in mathematics and science. It is designed, broadly, to align with the mathematics and science curricula in the participating education systems and countries, and focuses on assessment at Year 4 and Year 8. It also provides comparative perspectives on trends in achievement in the context of different education systems, school organisational approaches and instructional practices; and to enable this, TIMSS collects a rich array of background data from students, schools and teachers, and also collects data about the education systems themselves.
This report is a first look at the results from TIMSS 2015. Focusing on the achievement results in mathematics and science at Year 4 and Year 8, this report will be followed early in 2017 by the full Australian National Report, which will examine achievement more fully and incorporate descriptive and analytical findings using the background and demographic data.
Executive summary vExecutive summary vExecutive summary v
Key findings from this report Mathematics at Year 4
h With an average score of 517 score points on the TIMSS Year 4 mathematics scale, Australian students significantly outperformed students in 20 other countries, such as Italy, Spain and New Zealand.
h However, Australian Year 4 students were outperformed by students in 21 other countries, including Northern Ireland, Ireland, England and the United States, as well as the participating East Asian countries Singapore, Hong Kong, Korea, Chinese Taipei and Japan.
h Australia’s 2015 Year 4 mathematics score is significantly higher than the corresponding score in 1995. This, however, is due to a single increase recorded in TIMSS 2007 with no dip in following years; for the past three cycles, Australia’s Year 4 mathematics scores have remained the same.
h Nine per cent of Australian Year 4 students achieved the Advanced international benchmark in mathematics – compared to 50 per cent of students in Singapore and 27 per cent of students in Northern Ireland.
h Seventy per cent of Australian Year 4 students achieved the Intermediate international benchmark – the proficient standard for Australia.
Mathematics at Year 8
h With an average score of 505 score points on the TIMSS Year 8 mathematics scale, Australian students significantly outperformed students in 21 other countries, such as Italy, New Zealand and Malaysia.
h However, Australian Year 8 students were outperformed by students in 12 other countries, including Canada, Ireland, England and the United States, as well as the top five countries from Asia – Singapore, Korea, Chinese Taipei, Hong Kong and Japan.
h Australia’s result dipped in TIMSS 2007 and was followed by a recovery in TIMSS 2011. Australia’s 2015 Year 8 mathematics score is exactly the same as the corresponding score in 1995.
h Seven per cent of Australian Year 8 students achieved the Advanced international benchmark in mathematics – compared to more than one-third of students in the top five countries and 54 per cent of students in Singapore.
h Sixty-four per cent of Australian Year 8 students achieved the Intermediate international benchmark – the proficient standard for Australia.
Science at Year 4
h With an average score of 524 score points on the TIMSS Year 4 science scale, Australian students significantly outperformed students in 17 other countries, such as Portugal, New Zealand and France.
h However, Australian Year 4 students were outperformed by students in 17 other countries, including the United States and England, as well as the participating East Asian countries Singapore, Korea, Japan, Hong Kong and Chinese Taipei.
vi TIMSS 2015: A first look at Australia’s results
h Notwithstanding a 2015 recovery following the dip in TIMSS 2011, Australia’s TIMSS 2015 Year 4 science score is not significantly different to that of TIMSS 1995.
h Eight per cent of Australian Year 4 students achieved the Advanced international benchmark in science – compared to 37 per cent of students in Singapore.
h Seventy-five per cent of Australian Year 4 students achieved the Intermediate international benchmark – the proficient standard for Australia.
Science at Year 8
h With an average score of 512 score points on the TIMSS Year 8 science scale, Australian students significantly outperformed students in 20 other countries, such as Italy, Turkey and Malaysia.
h However, Australian Year 8 students were outperformed by students in 14 other countries, including Canada, the United States, England and Ireland, as well as the top five Asian countries – Singapore, Japan, Chinese Taipei, Korea and Hong Kong.
h Australia recorded an improved score in TIMSS 2003 followed by a weaker result in TIMSS 2007. Australia’s 2015 Year 8 science score is not significantly different to that of TIMSS 1995.
h Seven per cent of Australian Year 8 students achieved the Advanced international benchmark in science – compared to more than one-fifth of students in Chinese Taipei and Japan, and 42 per cent of students in Singapore.
h Sixty-nine per cent of Australian Year 8 students achieved the Intermediate international benchmark – the proficient standard for Australia.
Executive summary vii
viii TIMSS 2015: A first look at Australia’s results
List of figures
FIGURE 1.1 Map of participating countries ...................................................................................................2
FIGURE 2.1 Mean scores and percentages of students at the international benchmarks for Year 4 mathematics, by country ...........................................................................................................11
FIGURE 2.2 Trends in Year 4 mathematics achievement scores, 1995–2015, selected countries..............12
FIGURE 2.3 Percentages of high- and low-achieving students in Year 4 mathematics in TIMSS 1995 and TIMSS 2015, by country .............................................................................................14
FIGURE 2.4 Mean scores and percentages of Australian students at the international benchmarks for Year 4 mathematics, by jurisdiction .....................................................................................15
FIGURE 2.5 Trends in Year 4 mathematics achievement within Australia, 1995–2015, by jurisdiction .......17
FIGURE 2.6 Percentages of high- and low-achieving students in Year 4 mathematics from TIMSS 1995 to TIMSS 2015, by jurisdiction ..........................................................................................19
FIGURE 2.7 Sex differences in Year 4 mathematics achievement, by country ............................................20
FIGURE 2.8 Mean scores and percentages of Australian students at the international benchmarks for Year 4 mathematics, by sex .................................................................................................21
FIGURE 2.9 Trends in Year 4 mathematics achievement within Australia, 1995–2015, by sex ...................21
FIGURE 2.10 Sex differences in Year 4 mathematics achievement within Australia, by jurisdiction ............22
FIGURE 2.11 Percentages of Australian students at the international benchmarks for Year 4 mathematics, by sex within jurisdiction.....................................................................................22
FIGURE 2.12 Mean scores and percentages of students at the international benchmarks for Year 4 mathematics, by number of books in the home ........................................................................23
FIGURE 2.13 Mean scores and percentages of students at the international benchmarks for Year 4 mathematics, by Indigenous background .................................................................................24
FIGURE 2.14 Trends in Year 4 mathematics achievement within Australia, 1995–2015, by Indigenous background ................................................................................................................................24
FIGURE 2.15 Mean scores and percentages of students at the international benchmarks for Year 4 mathematics, by language spoken at home .............................................................................25
FIGURE 2.16 Mean scores and percentages of students at the international benchmarks for Year 4 mathematics, by geographic location .......................................................................................25
FIGURE 3.1 Mean scores and percentages of students at the international benchmarks for Year 8 mathematics, by country ...........................................................................................................28
FIGURE 3.2 Trends in Year 8 mathematics achievement scores, 1995–2015, selected countries..............29
FIGURE 3.3 Percentages of high- and low-achieving students in Year 8 mathematics in TIMSS 1995 and TIMSS 2015, by country .............................................................................................31
FIGURE 3.4 Mean scores and percentages of Australian students at the international benchmarks for Year 8 mathematics, by jurisdiction .....................................................................................32
FIGURE 3.5 Trends in Year 8 mathematics achievement within Australia, 1995–2015, by jurisdiction .......34
FIGURE 3.6 Percentages of high- and low-achieving students in Year 8 mathematics from TIMSS 1995 to TIMSS 2015, by jurisdiction ..........................................................................................36
FIGURE 3.7 Sex differences in Year 8 mathematics achievement, by country ............................................37
FIGURE 3.8 Mean scores and percentages of Australian students at the international benchmarks for Year 8 mathematics, by sex .................................................................................................38
FIGURE 3.9 Trends in Year 8 mathematics achievement within Australia, 1995–2015, by sex ...................39
FIGURE 3.10 Sex differences in Year 8 mathematics achievement within Australia, by jurisdiction ............39
FIGURE 3.11 Percentages of Australian students at the international benchmarks for Year 8 mathematics, by sex within jurisdiction.....................................................................................40
List of figures ix
FIGURE 3.12 Mean scores and percentages of students at the international benchmarks for Year 8 mathematics, by number of books in the home ........................................................................40
FIGURE 3.13 Mean scores and percentages of students at the international benchmarks for Year 8 mathematics, by parental education .........................................................................................41
FIGURE 3.14 Mean scores and percentages of students at the international benchmarks for Year 8 mathematics, by educational resources in the home ...............................................................42
FIGURE 3.15 Mean scores and percentages of students at the international benchmarks for Year 8 mathematics, by Indigenous background .................................................................................43
FIGURE 3.16 Trends in Year 8 mathematics achievement within Australia, 1995–2015, by Indigenous background ................................................................................................................................43
FIGURE 3.17 Mean scores and percentages of students at the international benchmarks for Year 8 mathematics, by language spoken at home .............................................................................44
FIGURE 3.18 Mean scores and percentages of students at the international benchmarks for Year 8 mathematics, by geographic location .......................................................................................44
FIGURE 4.1 Mean scores and percentages of students at the international benchmarks for Year 4 science, by country ....................................................................................................................48
FIGURE 4.2 Trends in Year 4 science achievement scores, 1995–2015, selected countries .....................49
FIGURE 4.3 Percentages of high- and low-achieving students in Year 4 science in TIMSS 1995 and TIMSS 2015, by country ......................................................................................................51
FIGURE 4.4 Mean scores and percentages of Australian students at the international benchmarks for Year 4 science, by jurisdiction ..............................................................................................52
FIGURE 4.5 Trends in Year 4 science achievement within Australia, 1995–2015, by jurisdiction ...............54
FIGURE 4.6 Percentages of high- and low-achieving students in Year 4 science from TIMSS 1995 to TIMSS 2015, by jurisdiction .......................................................................................................56
FIGURE 4.7 Sex differences in Year 4 science achievement, by country ....................................................57
FIGURE 4.8 Mean scores and percentages of Australian students at the international benchmarks for Year 4 science, by sex ..........................................................................................................58
FIGURE 4.9 Trends in Year 4 science achievement within Australia, 1995–2015, by sex ............................58
FIGURE 4.10 Sex differences in Year 4 science achievement within Australia, by jurisdiction .....................59
FIGURE 4.11 Percentages of Australian students at the international benchmarks for Year 4 science, by sex within jurisdiction ............................................................................................................59
FIGURE 4.12 Mean scores and percentages of students at the international benchmarks for Year 4 science, by number of books in the home ................................................................................60
FIGURE 4.13 Mean scores and percentages of students at the international benchmarks for Year 4 science, by Indigenous background ..........................................................................................61
FIGURE 4.14 Trends in Year 4 science achievement within Australia, 1995–2015, by Indigenous background ................................................................................................................................61
FIGURE 4.15 Mean scores and percentages of students at the international benchmarks for Year 4 science, by language spoken at home ......................................................................................62
FIGURE 4.16 Mean scores and percentages of students at the international benchmarks for Year 4 science, by geographic location ................................................................................................63
FIGURE 5.1 Mean scores and percentages of students at the international benchmarks for Year 8 science, by country ....................................................................................................................66
FIGURE 5.2 Trends in Year 8 science achievement scores, 1995–2015, selected countries .....................67
FIGURE 5.3 Percentages of high- and low-achieving students in Year 8 science in TIMSS 1995 and TIMSS 2015, by country .............................................................................................................69
FIGURE 5.4 Mean scores and percentages of Australian students at the international benchmarks for Year 8 science, by jurisdiction ..............................................................................................70
FIGURE 5.5 Trends in Year 8 science achievement within Australia, 1995–2015, by jurisdiction ...............72
x TIMSS 2015: A first look at Australia’s results
FIGURE 5.6 Percentages of high- and low-achieving students in Year 8 science from TIMSS 1995 to TIMSS 2015, by jurisdiction .......................................................................................................74
FIGURE 5.7 Sex differences in Year 8 science achievement, by country ....................................................75
FIGURE 5.8 Mean scores and percentages of Australian students at the international benchmarks for Year 8 science, by sex ..........................................................................................................76
FIGURE 5.9 Trends in Year 8 science achievement within Australia, 1995–2015, by sex ............................76
FIGURE 5.10 Sex differences in Year 8 science achievement within Australia, by jurisdiction .....................77
FIGURE 5.11 Percentages of Australian students at the international benchmarks for Year 8 science, by sex within jurisdiction ............................................................................................................78
FIGURE 5.12 Mean scores and percentages of students at the international benchmarks for Year 8 science, by number of books in the home ................................................................................78
FIGURE 5.13 Mean scores and percentages of students at the international benchmarks for Year 8 science, by parental education ..................................................................................................79
FIGURE 5.14 Mean scores and percentages of students at the international benchmarks for Year 8 science, by educational resources in the home ........................................................................80
FIGURE 5.15 Mean scores and percentages of students at the international benchmarks for Year 8 science, by Indigenous background ..........................................................................................80
FIGURE 5.16 Trends in Year 8 science achievement within Australia, 1995–2015, by Indigenous background ................................................................................................................................81
FIGURE 5.17 Mean scores and percentages of students at the international benchmarks for Year 8 science, by language spoken at home ......................................................................................81
FIGURE 5.18 Mean scores and percentages of students at the international benchmarks for Year 8 science, by geographic location ................................................................................................82
List of tables
TABLE 1.1 Distribution of weighted student numbers across the Australian jurisdictions in TIMSS 2015 ................................................................................................................................3
TABLE 1.2 TIMSS mathematics and science content and cognitive domains, and percentages of assessment for each domain .....................................................................................................3
TABLE 1.3 The TIMSS 2015 international benchmarks for mathematics ...................................................5
TABLE 1.4 The TIMSS 2015 international benchmarks for science ...........................................................6
TABLE 2.1 Relative trends in Year 4 mathematics achievement, by country .............................................13
TABLE 2.2 Multiple comparisons of Year 4 mathematics achievement, by jurisdiction ............................16
TABLE 3.1 Relative trends in Year 8 mathematics achievement, by country .............................................30
TABLE 3.2 Multiple comparisons of Year 8 mathematics achievement, by jurisdiction ............................33
TABLE 4.1 Relative trends in Year 4 science achievement, by country .....................................................50
TABLE 4.2 Multiple comparisons of Year 4 science achievement, by jurisdiction .....................................53
TABLE 5.1 Relative trends in Year 8 science achievement, by country .....................................................68
TABLE 5.2 Multiple comparisons of Year 8 science achievement, by jurisdiction .....................................71
Reader’s Guide
Sample surveysTIMSS is conducted as a sample survey in most participating countries. In surveys such as this, a sample of students is selected to represent the population of students at a particular year level in that country. The samples are designed and conducted so that they provide reliable estimates about the population that they represent. Sample surveys are cheaper to undertake and less of a burden for schools than a full census of the particular population.
The basic sample design for TIMSS is generally referred to as ‘a two-stage stratified cluster sample design’. The first stage consists of a sample of schools and the second stage consists of the identification of a single mathematics classroom selected at random from the target year level in sampled schools.
The students in the selected classroom are representative of the students in the population, and weights are used to adjust for any differences arising from intended features of the design (e.g. to over-sample minorities) or non-participation by students who were selected. In this way we can provide measures of achievement for the population, based on the responses of a sample.
Scores in TIMSS 2015TIMSS 2015 used item response theory (IRT) methods to summarise the achievement of students on a scale with a mean of 500 and a standard deviation of 100 (please refer to the international TIMSS website for more information about IRT methods: http://timss.bc.edu/publications/timss/2015-methods.html). It should be noted that the results for Year 4 and Year 8 should not be compared, nor should the results for mathematics and science at a particular year level. While the scales are expressed in the same numerical units, they are not directly comparable such that conclusions could be drawn about how much learning in mathematics equals how much learning in science (or how much learning at Year 4 equals how much learning at Year 8). That is, achievement on the TIMSS scales cannot be described in absolute terms (like all such scales developed using IRT technology). Comparisons can be made only in terms of relative performance (higher or lower), for example, among countries and population groups as well as over time.
The TIMSS mathematics and science scales for Year 4 and Year 8 were based on the 1995 assessments and the methodology enables comparable trend measures from assessment to assessment within each year level.
Reader’s Guide xi
International comparison statisticsSeveral international comparison statistics are given in the report: the TIMSS scale centrepoint, the international average and the international median.
The TIMSS scale centrepoint is the mean of the scales (for each of Year 4 mathematics, Year 4 science, Year 8 mathematics and Year 8 science) established in the first cycle of the study, calibrated to be 500, with a standard deviation of 100 score points.
The international average is the mean score or percentage of all countries participating in TIMSS 2015 at that year level.
The international median is the midpoint in a ranking of countries by score or percentage. By definition, half of the countries will have a score or percentage above the median and half below.
It should be noted that both the international average and the international median will be different depending on the set of countries included. Therefore, these statistics should be used in the context of a number of comparison statistics.
Standard errors and confidence intervalsIn this and other reports, student achievement is often described by a mean score. For TIMSS, each mean score is calculated from the sample of students who undertook the assessments. These sample means are an approximation of the actual mean score (known as the population mean) that would have been derived had all students in Australia participated in the TIMSS assessment.
If another sample of students was chosen on a different day, it is highly likely that the sample mean would be slightly different. Indeed, the sample mean is just one point along the range of student achievement scores, and so more information is needed to gauge whether the sample mean is an underestimation or overestimation of the population mean.
In this report, means are presented with an associated standard error. The standard error is an estimate of the error in the estimate of the population mean from the sample and is based on the standard deviation of sampling distribution of the mean. The size of the sample, as well as the variance in the scores within the sample, can affect the size of the standard error. Smaller samples, or samples with a greater variance in scores, will have larger standard errors.
The calculation of confidence intervals can assist our assessment of a sample mean’s precision as a population mean. Confidence intervals provide a range of scores within which we are ‘confident’ that the population mean actually lies. The confidence interval is within plus or minus 1.96 standard errors of the sample mean. A larger standard error results in a larger confidence interval, and a greater likelihood that the confidence intervals of two means will overlap and, therefore, reduce any difference to non-significance (see the next section on statistical significance).
Statistical significanceThe term ‘significantly’ is used throughout the report to describe a difference that meets the requirements of statistical significance at the 0.05 level, indicating that the difference is real, and would be found in at least 95 analyses out of 100 if the comparison were to be repeated. It is not to be confused with the term ‘substantial’, which is qualitative and based on judgement rather than statistical comparisons. A difference may appear substantial but not be statistically significant (due to factors that affect the size of the standard errors around the estimate, for example) while another difference may seem small but reach statistical significance because the estimate was more accurate.
TrendsIt should be noted that a change in 2015 to the method of calculating standard errors means that standard errors for data from past cycles will not match those presented in earlier reports (please refer to the international TIMSS website for more information on calculation of standard errors: http://timss.bc.edu/publications/timss/2015-methods.html).
xii TIMSS 2015: A first look at Australia’s results
Please note that there was no fourth-grade assessment in 1999. Additionally, the Australian eighth-grade sample that participated in 1999 was not comparable to that in other cycles, so no trend results are provided for Australia at Year 8 in 1999.
Rounding of figuresDue to rounding to eliminate decimals, some percentages in tables and figures may not exactly add to the totals. Totals, differences and averages are always calculated on the basis of exact numbers and are rounded only after calculation. When standard errors have been rounded to one decimal place and the value 0.0 is shown, this does not imply that the standard error is zero, but that it is smaller than 0.05.
Notes about participating countriesA number of countries have official names that are longer than those by which they are usually designated in conversation. In order to facilitate the reading of the TIMSS reports, these countries are referred to by their shortened form (e.g. Hong Kong, Korea, Iran) in the text, but are referred to by their official name (e.g. Hong Kong SAR; Korea, Republic of; Iran, Islamic Republic of) in the box displaying participating countries in Figure 1.1.
Seven countries participated in TIMSS Numeracy – namely, Bahrain, Indonesia, Iran, Jordan, Kuwait, Morocco and South Africa (please refer to the international TIMSS website for more information about TIMSS Numeracy: http://timssandpirls.bc.edu/timss2015/frameworks.html). Except for Jordan and South Africa, they also participated in the TIMSS fourth-grade assessment, and their Year 4 mathematics results are based on an average of both assessments. As Jordan and South Africa participated only in TIMSS Numeracy, their Year 4 mathematics results are based solely on the results of TIMSS Numeracy and, additionally, they will not appear in the results for Year 4 science.
Norway chose to assess fifth and ninth grades to obtain better comparisons with Sweden and Finland (but also collected benchmark data at fourth and eighth grades to enable trend measurement). Botswana and South Africa assessed ninth grade to better match their curricula and to maintain trend measurement.
Definitions of background characteristicsThere are various definitions used in this report that are particular to the Australian context, as well as many that are used internationally. This section provides an explanation for those that are not self-evident.
Number of books in the homeThis variable is used as a proxy for socioeconomic status, where information about parents’ occupations, education and wealth are not available. It is derived from student self-reports of the number of books in their homes. Their responses have been grouped so that a few books equals 25 or fewer books, an average number of books equals between 26 and 200 books and many books equals more than 200 books. While the relationship between the number of books in the home and student achievement is not definitive, there is a very strong relationship between the two.
Parental educationParental education is a component of socioeconomic status. Year 8 students were asked to indicate the highest level of education attained by each of their parents or guardians. For the analyses in this report, the responses from both questions were combined to identify the highest level of education attained by either parent. Where no response is given for one parent, the response for the other parent was used. Where no information was given for either parent, parental education was recorded as missing.
Please note that, due to a very low response rate to the Early Learning Survey, completed by parents, information about parental education is not available for Year 4 students.
Reader’s Guide xiii
Educational resources in the homeThe presence or absence of educational resources in the home expresses potential advantage or disadvantage for students that may reflect the ability of parents to provide materially for their children or indicate differences in practical and psychological support for academic achievement. These resources may be physical, such as books or an internet connection, or take the form of more intangible attributes such as parental education or occupation.
The Home Educational Resources scale was created, using Year 8 students’ responses to three items:
Î parents’ educational background
Î number of books in the home
Î home study supports – students having their own room and an internet connection at home.
Students with many resources had a score on the scale of at least 12.4, which corresponds to their reporting that they had more than 100 books in the home along with both home study supports (own room and an internet connection), and that at least one of their parents had finished university, on average. In contrast, students with few resources had a scale score no higher than 8.3, which corresponds to their reporting that they had 25 or fewer books in the home, that they had neither their own room nor an internet connection, and that neither of their parents had proceeded beyond upper secondary school. All other students were classified as having some resources.
Please note that, due to a very low response rate to the Early Learning Survey, completed by parents, information about parental education, and therefore the Home Educational Resources scale, is not available for Year 4 students.
Indigenous backgroundIndigenous background is derived from school records – collected from parents and guardians in accordance with the nationally agreed definitions as set out in the 2012 Data Standards Manual of the Australian Curriculum, Assessment and Reporting Authority – that identify students as being of Australian Aboriginal or Torres Strait Islander origin. Students were identified as either Indigenous or not Indigenous for the purpose of TIMSS.
Language spoken at homeThe language spoken at home variable is derived from student self-report of how often English was spoken at home. Where the student spoke English ‘never’ or only ‘sometimes’, the student was considered to speak a language other than English at home. Those who indicated that they spoke English ‘always’ or ‘almost always’ were considered to be English speakers in the home environment.
Geographic location of the schoolIn Australia, the participating schools were coded with respect to the Ministerial Council on Education, Employment, Training and Youth Affairs (MCEETYA) Schools Geographic Location Classification. For the analysis in this report, only the broadest categories are used:
Î metropolitan – including mainland state capital cities or major urban districts with a population of 100,000 or more (e.g. Queanbeyan, Cairns, Geelong, Hobart)
Î provincial – including provincial cities and other non-remote provincial areas (e.g. Darwin, Ballarat, Bundaberg, Geraldton, Tamworth)
Î remote – remote areas and very remote areas. Remote: very restricted accessibility of goods, services and opportunities for social interaction (e.g. Coolabah, Mallacoota, Capella, Mt Isa, Port Lincoln, Port Hedland and Alice Springs). Very remote: very little accessibility of goods, services and opportunities for social interaction (e.g. Bourke, Thursday Island, Yalata, Condingup, Nhulunbuy).
ReferenceAustralian Curriculum, Assessment and Reporting Authority (2012). Data Standards Manual: Student background
characteristics, 6th edn. Retrieved from http://www.acara.edu.au/reporting/data-standards-manual-student-background-characteristics.
xiv TIMSS 2015: A first look at Australia’s results
Introduction
TIMSS 2015
The Trends in International Mathematics and Science Study (TIMSS) is an international study directed by the International Association for the Evaluation of Educational Achievement (IEA), an independent international cooperative of national research institutions and government agencies that has been conducting studies of cross-national achievement in a wide range of subjects since 1959. In Australia, TIMSS is implemented by the Australian Council for Educational Research (ACER), which is Australia’s representative to the IEA. In Australia, TIMSS is part of the National Assessment Program.
TIMSS is an assessment of mathematics and science that has been conducted at Year 4 and Year 8 on a four-year cycle since 1995. Australia has participated in TIMSS since its inception, providing rich data about trends in mathematics and science achievement over 20 years.
To inform educational policy in the participating countries, TIMSS also routinely collects extensive background information that addresses concerns about the quantity, quality and content of instruction. This background information is collected through a series of questionnaires for students, parents, teachers, principals and curriculum specialists.
What is the focus of TIMSS?The main goal of TIMSS is to assist countries to monitor and evaluate mathematics and science teaching and learning across time and across year levels. TIMSS has a curriculum focus. Three levels of the curriculum have been defined in previous studies, and considered in relation to the context in which they occur. These are:
Î The intended curriculum – defined as the curriculum as specified at national or system level. What are mathematics and science students around the world expected to learn? How do countries vary in their intended goals, and what characteristics of education systems, schools and students influence the development of these goals? How should the education system be organised to facilitate this learning?
Î The implemented curriculum – defined as the curriculum as interpreted and delivered by classroom teachers. What is actually taught in classrooms? Who teaches it? What opportunities are provided for students to learn mathematics and science? How do instructional practices vary among countries and what factors influence these variations?
Introduction 1
1Chapter
Î The attained curriculum – which is that part of the curriculum that is learnt by students, as demonstrated by their attitudes and achievements. What mathematics and science concepts, processes and attitudes have students learnt? What factors are linked to students’ opportunity to learn, and how do these factors influence students’ achievements?
Who participated in TIMSS 2015?
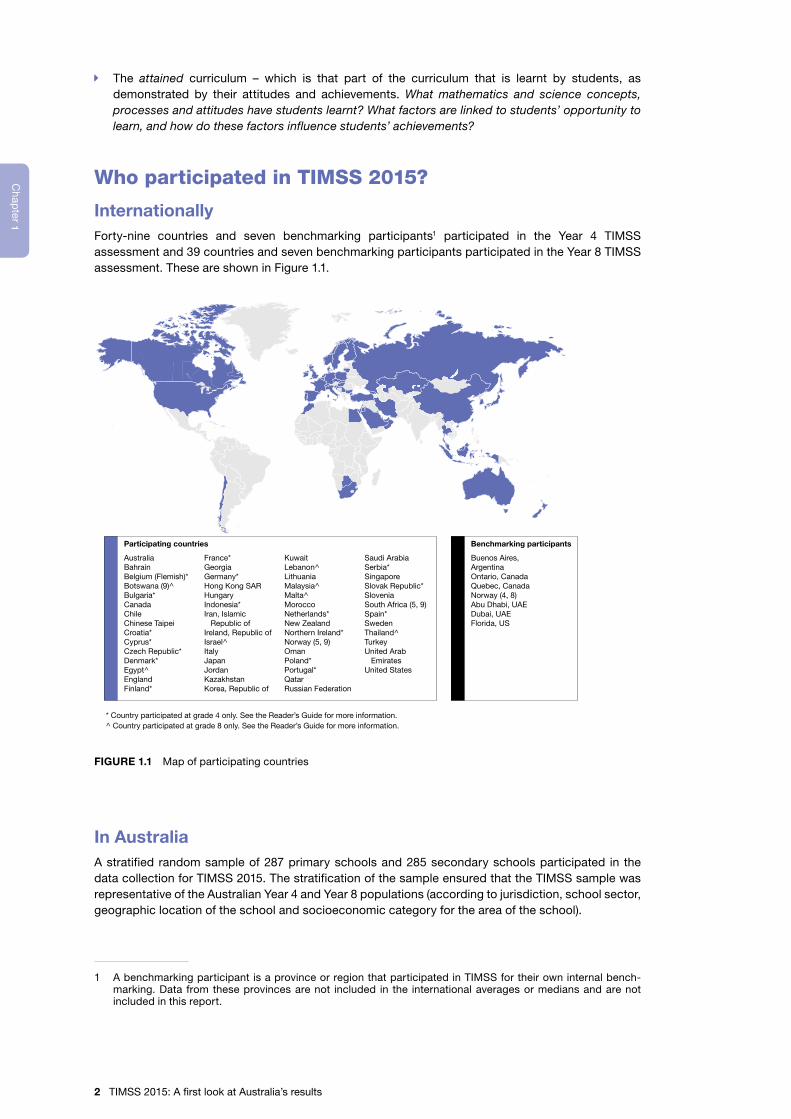
InternationallyForty-nine countries and seven benchmarking participants1 participated in the Year 4 TIMSS assessment and 39 countries and seven benchmarking participants participated in the Year 8 TIMSS assessment. These are shown in Figure 1.1.
AustraliaBahrainBelgium (Flemish)*Botswana (9)^Bulgaria*CanadaChileChinese TaipeiCroatia*Cyprus*Czech Republic*Denmark*Egypt^EnglandFinland*
France*GeorgiaGermany*Hong Kong SARHungaryIndonesia*Iran, Islamic Republic ofIreland, Republic ofIsrael^ItalyJapanJordanKazakhstanKorea, Republic of
KuwaitLebanon^LithuaniaMalaysia^Malta^MoroccoNetherlands*New ZealandNorthern Ireland*Norway (5, 9)OmanPoland*Portugal*QatarRussian Federation
Saudi ArabiaSerbia*SingaporeSlovak Republic*SloveniaSouth Africa (5, 9)Spain*SwedenThailand^TurkeyUnited Arab EmiratesUnited States
Participating countries
Buenos Aires, ArgentinaOntario, CanadaQuebec, CanadaNorway (4, 8)Abu Dhabi, UAEDubai, UAEFlorida, US
Benchmarking participants
* Country participated at grade 4 only. See the Reader’s Guide for more information.^ Country participated at grade 8 only. See the Reader’s Guide for more information.
FIGURE 1.1 Map of participating countries
In AustraliaA stratified random sample of 287 primary schools and 285 secondary schools participated in the data collection for TIMSS 2015. The stratification of the sample ensured that the TIMSS sample was representative of the Australian Year 4 and Year 8 populations (according to jurisdiction, school sector, geographic location of the school and socioeconomic category for the area of the school).
1 A benchmarking participant is a province or region that participated in TIMSS for their own internal bench-marking. Data from these provinces are not included in the international averages or medians and are not included in this report.
2 TIMSS 2015: A first look at Australia’s results
1C
hap
ter
1C
hapter
At each school at least one intact class from the relevant year level – along with all Indigenous students in that year level – was selected to participate in TIMSS 2015. This resulted in a sample of 6057 Year 4 students and 10,338 Year 8 students. Statistical weighting enables those students to represent the total student population at each year level (for more information, please refer to the Reader’s Guide). Table 1.1 provides the distribution of the weighted student numbers across the Australian jurisdictions at both Year 4 and Year 8.
TABLE 1.1 Distribution of weighted student numbers across the Australian jurisdictions in TIMSS 2015
ACT NSW VIC QLD SA WA TAS NT Total
Year 4 4886 92,855 62,187 57,370 16,999 30,399 5662 2548 272,907
Year 8 4393 84,266 67,334 57,134 17,922 26,912 6392 2101 266,454
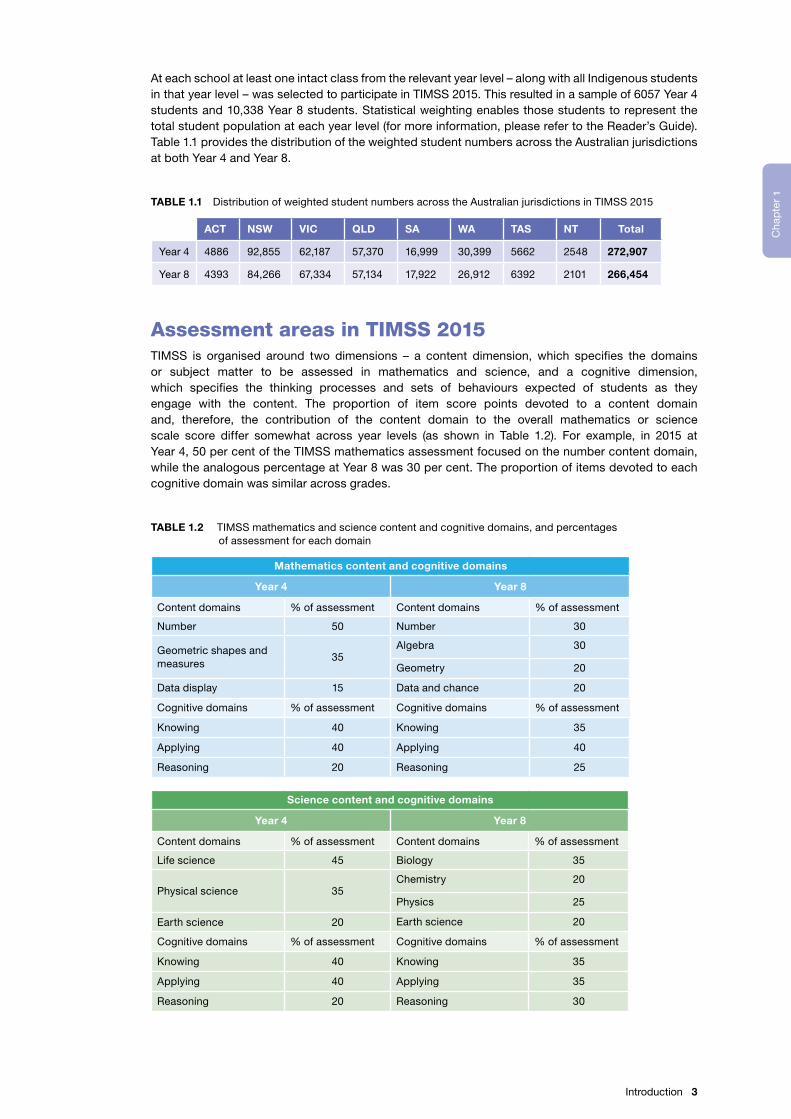
Assessment areas in TIMSS 2015TIMSS is organised around two dimensions – a content dimension, which specifies the domains or subject matter to be assessed in mathematics and science, and a cognitive dimension, which specifies the thinking processes and sets of behaviours expected of students as they engage with the content. The proportion of item score points devoted to a content domain and, therefore, the contribution of the content domain to the overall mathematics or science scale score differ somewhat across year levels (as shown in Table 1.2). For example, in 2015 at Year 4, 50 per cent of the TIMSS mathematics assessment focused on the number content domain, while the analogous percentage at Year 8 was 30 per cent. The proportion of items devoted to each cognitive domain was similar across grades.
TABLE 1.2 TIMSS mathematics and science content and cognitive domains, and percentages of assessment for each domain
Mathematics content and cognitive domains
Year 4 Year 8
Content domains % of assessment Content domains % of assessment
Number 50 Number 30
Geometric shapes and measures
35Algebra 30
Geometry 20
Data display 15 Data and chance 20
Cognitive domains % of assessment Cognitive domains % of assessment
Knowing 40 Knowing 35
Applying 40 Applying 40
Reasoning 20 Reasoning 25
Science content and cognitive domains
Year 4 Year 8
Content domains % of assessment Content domains % of assessment
Life science 45 Biology 35
Physical science 35Chemistry 20
Physics 25
Earth science 20 Earth science 20
Cognitive domains % of assessment Cognitive domains % of assessment
Knowing 40 Knowing 35
Applying 40 Applying 35
Reasoning 20 Reasoning 30
Introduction 3
1C
hap
ter
1C
hapter
Reporting of results in TIMSS 2015
Means and standard errorsThe TIMSS 2015 mathematics and science results are represented as average scores on the TIMSS mathematics and science scales. These scales, each at both Year 4 and Year 8, were established in TIMSS 1995 to have a mean of 500 and a standard deviation of 100, and were designed to remain constant from assessment to assessment.
Typically, changes in mean performance of students from one cycle of an assessment to the next are used to assess improvement in the quality of schools and education systems. However, the mean level of performance does not provide the complete picture of student achievement and can mask significant variation within an individual class, school or education system. Countries aim not only to encourage high performance but also to minimise internal disparities in performance. Therefore, as well as a high mean score, a limited range of scores is desirable. This will be reported by examining the difference between the 5th and 95th percentiles.
Countries are generally shown in decreasing order of achievement; however, this should not be interpreted as a simple ranking. Statistical tests are used to determine whether a country’s score is significantly different to that of Australia, and appropriate colour coding is used in figures.
The TIMSS benchmarksThe TIMSS achievement scales summarise Year 4 and Year 8 students’ performance when interacting with a variety of mathematical and scientific tasks and questions. Students’ achievement is based on their responses to test questions designed to assess a range of content areas. When comparing groups of students across and within countries, summary statistics such as the average, or mean, scale score are often used. This score, however, does not provide detailed information as to what types of tasks the students were able to undertake successfully. Instead, to provide descriptions of achievement on the scale in relation to performance on the questions asked, TIMSS uses points on the scale as international benchmarks.
Internationally, it was decided that performance should be measured at four levels. These four levels summarise the achievement reached by:
Î the ‘Advanced international benchmark’, which was set at 625
Î the ‘High international benchmark’, which was set at 550
Î the ‘Intermediate international benchmark’, which was set at 475
Î the ‘Low international benchmark’, which was set at 400.
The descriptions of the levels are cumulative, so that a student who reached the High benchmark can typically demonstrate the knowledge and skills for both the Intermediate and the Low benchmarks as well.
The Measurement Framework for Schooling in Australia 2015 (the Australian Curriculum, Assessment and Reporting Authority, 2015) has set the Proficient Standard for TIMSS mathematics and science as the Intermediate international benchmark.
The Measurement Framework for Schooling in Australia is the basis for reporting on progress towards the Melbourne Declaration on Educational Goals for Young Australians. Proficient standards represent a ‘challenging but reasonable’ expectation of student achievement.
Tables 1.3 and 1.4 describe the TIMSS 2015 international benchmarks for mathematics and science.
4 TIMSS 2015: A first look at Australia’s results
1C
hap
ter
1C
hapter
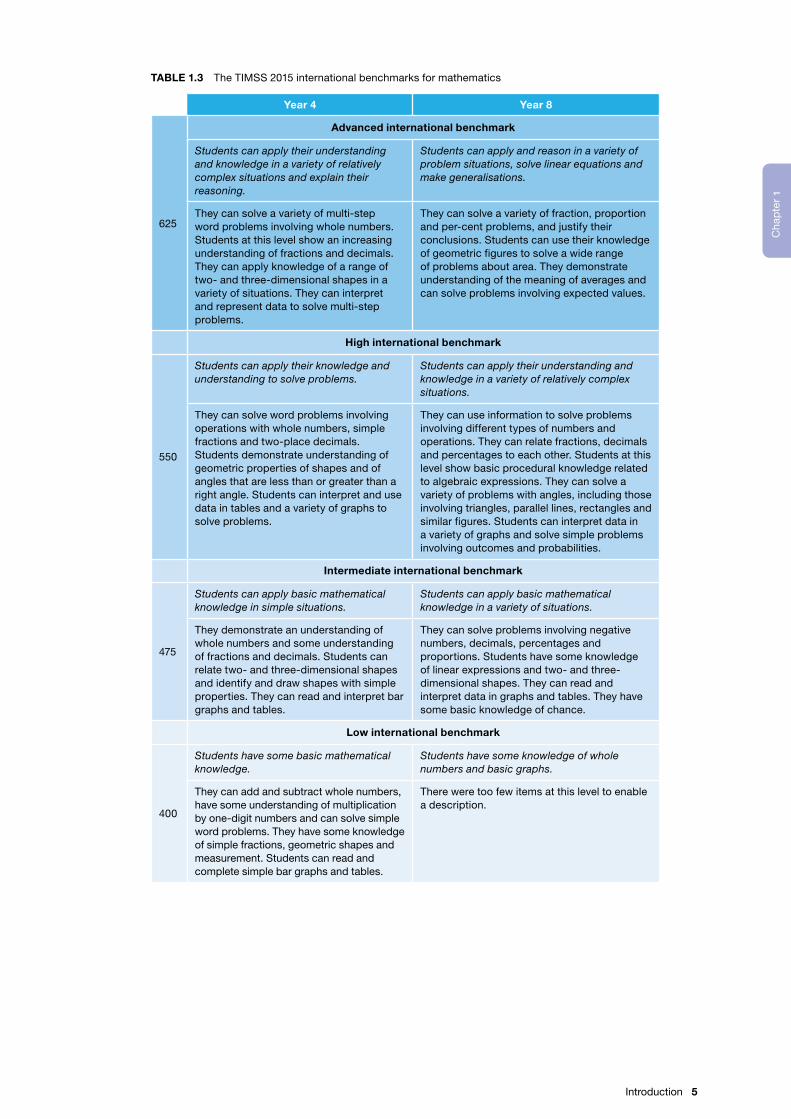
TABLE 1.3 The TIMSS 2015 international benchmarks for mathematics
Year 4 Year 8
625
Advanced international benchmark
Students can apply their understanding and knowledge in a variety of relatively complex situations and explain their reasoning.
Students can apply and reason in a variety of problem situations, solve linear equations and make generalisations.
They can solve a variety of multi-step word problems involving whole numbers. Students at this level show an increasing understanding of fractions and decimals. They can apply knowledge of a range of two- and three-dimensional shapes in a variety of situations. They can interpret and represent data to solve multi-step problems.
They can solve a variety of fraction, proportion and per-cent problems, and justify their conclusions. Students can use their knowledge of geometric figures to solve a wide range of problems about area. They demonstrate understanding of the meaning of averages and can solve problems involving expected values.
High international benchmark
550
Students can apply their knowledge and understanding to solve problems.
Students can apply their understanding and knowledge in a variety of relatively complex situations.
They can solve word problems involving operations with whole numbers, simple fractions and two-place decimals. Students demonstrate understanding of geometric properties of shapes and of angles that are less than or greater than a right angle. Students can interpret and use data in tables and a variety of graphs to solve problems.
They can use information to solve problems involving different types of numbers and operations. They can relate fractions, decimals and percentages to each other. Students at this level show basic procedural knowledge related to algebraic expressions. They can solve a variety of problems with angles, including those involving triangles, parallel lines, rectangles and similar figures. Students can interpret data in a variety of graphs and solve simple problems involving outcomes and probabilities.
Intermediate international benchmark
475
Students can apply basic mathematical knowledge in simple situations.
Students can apply basic mathematical knowledge in a variety of situations.
They demonstrate an understanding of whole numbers and some understanding of fractions and decimals. Students can relate two- and three-dimensional shapes and identify and draw shapes with simple properties. They can read and interpret bar graphs and tables.
They can solve problems involving negative numbers, decimals, percentages and proportions. Students have some knowledge of linear expressions and two- and three-dimensional shapes. They can read and interpret data in graphs and tables. They have some basic knowledge of chance.
Low international benchmark
400
Students have some basic mathematical knowledge.
Students have some knowledge of whole numbers and basic graphs.
They can add and subtract whole numbers, have some understanding of multiplication by one-digit numbers and can solve simple word problems. They have some knowledge of simple fractions, geometric shapes and measurement. Students can read and complete simple bar graphs and tables.
There were too few items at this level to enable a description.
Introduction 5
1C
hap
ter
1C
hapter
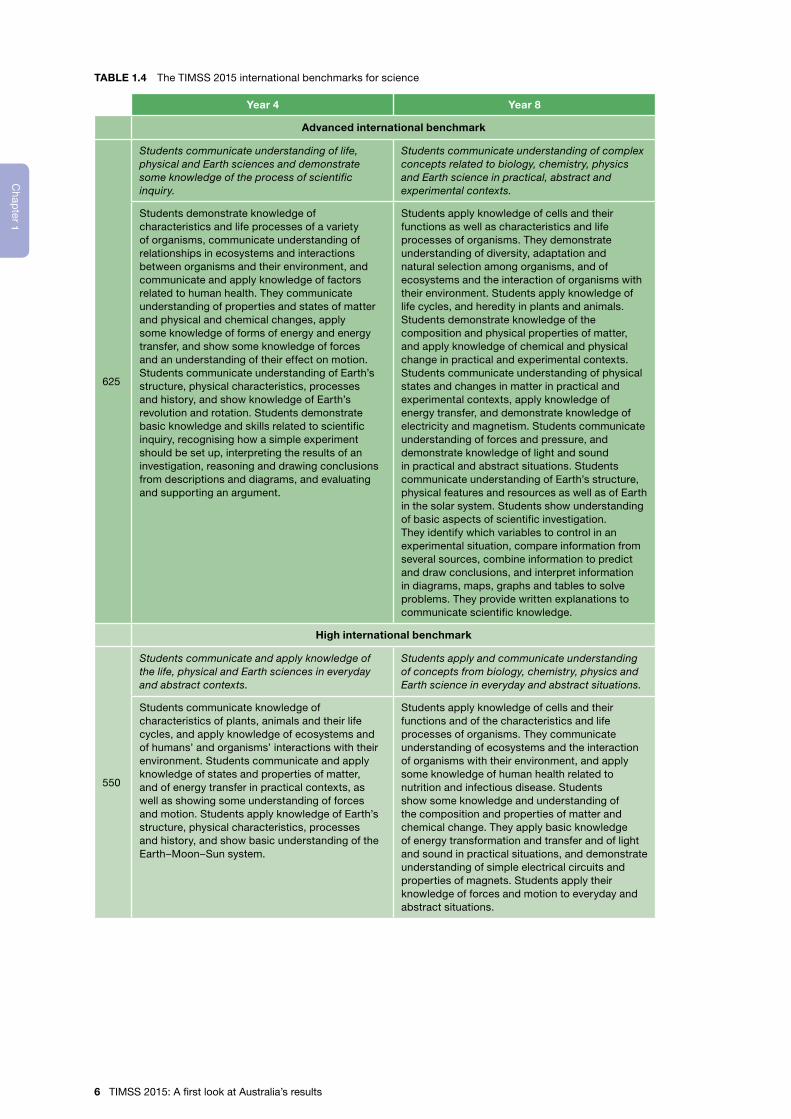
TABLE 1.4 The TIMSS 2015 international benchmarks for science
Year 4 Year 8
Advanced international benchmark
625
Students communicate understanding of life, physical and Earth sciences and demonstrate some knowledge of the process of scientific inquiry.
Students communicate understanding of complex concepts related to biology, chemistry, physics and Earth science in practical, abstract and experimental contexts.
Students demonstrate knowledge of characteristics and life processes of a variety of organisms, communicate understanding of relationships in ecosystems and interactions between organisms and their environment, and communicate and apply knowledge of factors related to human health. They communicate understanding of properties and states of matter and physical and chemical changes, apply some knowledge of forms of energy and energy transfer, and show some knowledge of forces and an understanding of their effect on motion. Students communicate understanding of Earth’s structure, physical characteristics, processes and history, and show knowledge of Earth’s revolution and rotation. Students demonstrate basic knowledge and skills related to scientific inquiry, recognising how a simple experiment should be set up, interpreting the results of an investigation, reasoning and drawing conclusions from descriptions and diagrams, and evaluating and supporting an argument.
Students apply knowledge of cells and their functions as well as characteristics and life processes of organisms. They demonstrate understanding of diversity, adaptation and natural selection among organisms, and of ecosystems and the interaction of organisms with their environment. Students apply knowledge of life cycles, and heredity in plants and animals. Students demonstrate knowledge of the composition and physical properties of matter, and apply knowledge of chemical and physical change in practical and experimental contexts. Students communicate understanding of physical states and changes in matter in practical and experimental contexts, apply knowledge of energy transfer, and demonstrate knowledge of electricity and magnetism. Students communicate understanding of forces and pressure, and demonstrate knowledge of light and sound in practical and abstract situations. Students communicate understanding of Earth’s structure, physical features and resources as well as of Earth in the solar system. Students show understanding of basic aspects of scientific investigation. They identify which variables to control in an experimental situation, compare information from several sources, combine information to predict and draw conclusions, and interpret information in diagrams, maps, graphs and tables to solve problems. They provide written explanations to communicate scientific knowledge.
High international benchmark
550
Students communicate and apply knowledge of the life, physical and Earth sciences in everyday and abstract contexts.
Students apply and communicate understanding of concepts from biology, chemistry, physics and Earth science in everyday and abstract situations.
Students communicate knowledge of characteristics of plants, animals and their life cycles, and apply knowledge of ecosystems and of humans’ and organisms’ interactions with their environment. Students communicate and apply knowledge of states and properties of matter, and of energy transfer in practical contexts, as well as showing some understanding of forces and motion. Students apply knowledge of Earth’s structure, physical characteristics, processes and history, and show basic understanding of the Earth–Moon–Sun system.
Students apply knowledge of cells and their functions and of the characteristics and life processes of organisms. They communicate understanding of ecosystems and the interaction of organisms with their environment, and apply some knowledge of human health related to nutrition and infectious disease. Students show some knowledge and understanding of the composition and properties of matter and chemical change. They apply basic knowledge of energy transformation and transfer and of light and sound in practical situations, and demonstrate understanding of simple electrical circuits and properties of magnets. Students apply their knowledge of forces and motion to everyday and abstract situations.
6 TIMSS 2015: A first look at Australia’s results
1C
hap
ter
1C
hapter
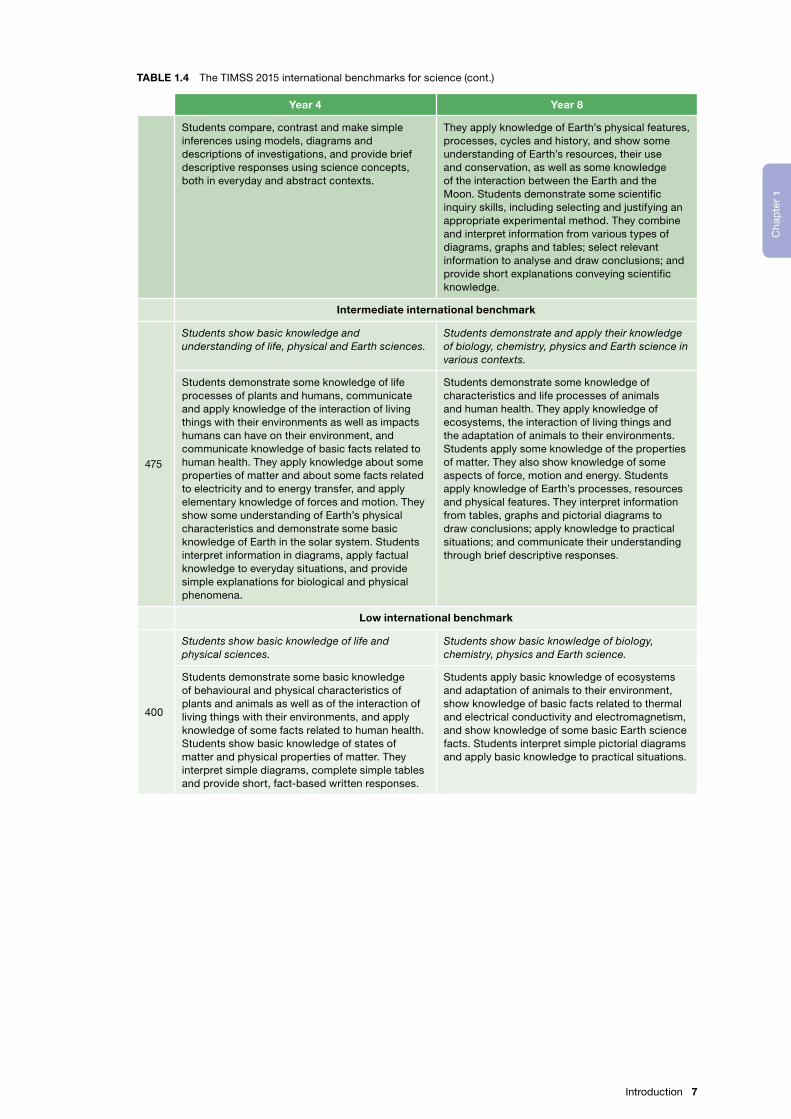
TABLE 1.4 The TIMSS 2015 international benchmarks for science (cont.)
Year 4 Year 8
Students compare, contrast and make simple inferences using models, diagrams and descriptions of investigations, and provide brief descriptive responses using science concepts, both in everyday and abstract contexts.
They apply knowledge of Earth’s physical features, processes, cycles and history, and show some understanding of Earth’s resources, their use and conservation, as well as some knowledge of the interaction between the Earth and the Moon. Students demonstrate some scientific inquiry skills, including selecting and justifying an appropriate experimental method. They combine and interpret information from various types of diagrams, graphs and tables; select relevant information to analyse and draw conclusions; and provide short explanations conveying scientific knowledge.
Intermediate international benchmark
475
Students show basic knowledge and understanding of life, physical and Earth sciences.
Students demonstrate and apply their knowledge of biology, chemistry, physics and Earth science in various contexts.
Students demonstrate some knowledge of life processes of plants and humans, communicate and apply knowledge of the interaction of living things with their environments as well as impacts humans can have on their environment, and communicate knowledge of basic facts related to human health. They apply knowledge about some properties of matter and about some facts related to electricity and to energy transfer, and apply elementary knowledge of forces and motion. They show some understanding of Earth’s physical characteristics and demonstrate some basic knowledge of Earth in the solar system. Students interpret information in diagrams, apply factual knowledge to everyday situations, and provide simple explanations for biological and physical phenomena.
Students demonstrate some knowledge of characteristics and life processes of animals and human health. They apply knowledge of ecosystems, the interaction of living things and the adaptation of animals to their environments. Students apply some knowledge of the properties of matter. They also show knowledge of some aspects of force, motion and energy. Students apply knowledge of Earth’s processes, resources and physical features. They interpret information from tables, graphs and pictorial diagrams to draw conclusions; apply knowledge to practical situations; and communicate their understanding through brief descriptive responses.
Low international benchmark
400
Students show basic knowledge of life and physical sciences.
Students show basic knowledge of biology, chemistry, physics and Earth science.
Students demonstrate some basic knowledge of behavioural and physical characteristics of plants and animals as well as of the interaction of living things with their environments, and apply knowledge of some facts related to human health. Students show basic knowledge of states of matter and physical properties of matter. They interpret simple diagrams, complete simple tables and provide short, fact-based written responses.
Students apply basic knowledge of ecosystems and adaptation of animals to their environment, show knowledge of basic facts related to thermal and electrical conductivity and electromagnetism, and show knowledge of some basic Earth science facts. Students interpret simple pictorial diagrams and apply basic knowledge to practical situations.
Introduction 7
1C
hap
ter
1C
hapter

2
Year 4 mathematics 9
Chapter
Year 4 mathematics
Australia’s Year 4 mathematics results within the international contextFigure 2.1 (see page 11) shows the means, standard errors, gaps between the 5th and 95th percen-tiles and, to the right of the percentile gaps, the percentages of students in each country at the TIMSS benchmarks.
Î Singapore and Hong Kong were the top-performing countries of TIMSS 2015, scoring at the upper levels of the High international benchmark, and almost at the Advanced international benchmark, the cut point of which is set at 625 score points. The scores for these countries were not significantly different to each other but were significantly higher than those for all other countries.
Î Australia’s average score of 517 score points was significantly higher than the scores for 20 other countries, such as Italy, Spain and New Zealand, and places average achievement at the Intermediate benchmark.
Î Australia’s average score was significantly lower than the average scores for 21 other countries, including Northern Ireland, Ireland, England and the United States, as well as the participating Asian countries Singapore, Hong Kong, Korea, Chinese Taipei and Japan.
Î This figure also shows the range of achievement within countries, with 288 score points separating the 5th and 95th percentiles for Singapore, but more than 340 score points separating highest and lowest in Kuwait (342 points), the United Arab Emirates (347 points) and Jordan (355 score points).
Î Australia’s gap between high and low achievers – of 275 score points – was mid-range, similar to that of Singapore (288 points). New Zealand had a 297 score-points gap between high and low performers. As a comparison, the gap for students in the Netherlands was the lowest, at 183 points.
Î In Singapore, 50 per cent of students achieved the Advanced international benchmark. In Hong Kong, Korea, Japan and Chinese Taipei, very high proportions of students (between 32 and 45%) also achieved the Advanced benchmark.

Î Very low levels of students in these countries (between 2 and 7%) performed either at or below the Low international benchmark.
Î Northern Ireland was the best-performing of the non-Asian countries, with 27 per cent of students at the Advanced benchmark; however, in contrast to the high standards achieved in Asian countries, 14 per cent of its students were achieving either at or below the Low benchmark.
Î Nine per cent of Australian students achieved the Advanced international benchmark. Seventy per cent of Australian students achieved at least the Intermediate international benchmark, which is the proficient standard for Australia. Of concern are the 30 per cent of Australian Year 4 students achieving at or below the Low international benchmark (21% performed at the Low benchmark and a further 9% did not reach the Low benchmark).
10 TIMSS 2015: A first look at Australia’s results
2C
hap
ter
2C
hapter
Note: In cases in which the proportion of students in a benchmark band is 1% or less, the numeric label will not appear on the band. This convention has been used for all figures about benchmarks in the chapter.
Due to rounding, some percentages in the figure may not match to totals in the text. See the Reader’s Guide for more information.
FIGURE 2.1 Mean scores and percentages of students at the international benchmarks for Year 4 mathematics, by country
0 20 40 60 80 100100 80 60 40 20
6 13 30 50
14 39 45
3 16 40 41
5 19 41 35
4 21 42 32
3 11 25 34 27
9 30 39 20
12 36 36 14
3 13 33 37 14
4 16 31 32 17
11 41 37 10
4 16 33 31 16
3 15 36 34 12
5 16 32 33 14
4 16 34 34 12
4 15 37 34 10
3 15 39 35 8
4 16 36 34 10
16 46 33 4
8 17 31 31 13
4 18 40 30 8
7 19 35 29 10
4 19 43 29 5
5 20 41 28 6
8 17 35 30 10
5 20 41 29 5
9 19 35 27 10
9 21 34 27 9
8 23 38 25 6
7 24 41 24 4
7 26 40 24 3
7 26 43 21 3
12 23 39 22 4
16 25 33 20 6
13 29 37 19 2
19 24 32 20 5
22 31 32 13 2
22 36 32 9
32 26 24 13 5
28 31 28 11 2
35 29 23 10 3
35 29 25 10
40 28 21 9 2
50 30 17 3
50 29 16 5
57 27 13 3
59 24 14 3
61 22 12 4
67
2
2
321 9
2
Below Low Low Intermediate High Advanced
Country Mean SE Gap 95th–5th percentiles Performance at each of the TIMSS international benchmarks
Ach
ieve
men
t si
gni
fican
tly h
ighe
r th
an A
ustr
alia
’s
Singapore 618 3.8 288
Hong Kong 615 2.9 216
Korea 608 2.2 221
Chinese Taipei 597 1.9 235
Japan 593 2.0 227
Northern Ireland 570 2.9 282
Russian Federation 564 3.4 242
Norway (5) 549 2.5 231
Ireland 547 2.1 238
England 546 2.8 275
Belgium (Flemish) 546 2.1 200
Kazakhstan 544 4.5 269
Portugal 541 2.2 237
United States 539 2.3 269
Denmark 539 2.7 248
Lithuania 535 2.5 235
Finland 535 2.0 218
Poland 535 2.1 233
Netherlands 530 1.7 183
Hungary 529 3.2 288
Czech Republic 528 2.2 231
Ach
ieve
men
t no
t d
iffer
ent
to A
ustr
alia
’s
Bulgaria 524 5.3 276
Cyprus 523 2.7 266
Germany 522 2.0 216
Slovenia 520 1.9 228
Sweden 519 2.8 228
Serbia 518 3.5 287
Australia 517 3.1 275
Canada 511 2.3 247
Ach
ieve
men
t si
gni
fican
tly lo
wer
tha
n A
ustr
alia
’s
Italy 507 2.6 236
Spain 505 2.5 226
Croatia 502 1.8 215
Slovak Republic 498 2.5 264
New Zealand 491 2.3 297
France 488 2.9 246
Turkey 483 3.1 312
Georgia 463 3.6 287
Chile 459 2.4 240
United Arab Emirates 452 2.4 347
Bahrain 451 1.6 292
Qatar 439 3.4 318
Iran 431 3.2 335
Oman 425 2.5 331
Indonesia 397 3.7 293
Jordan 388 3.1 355
Saudi Arabia 383 4.1 301
Morocco 377 3.4 313
South Africa (5) 376 3.5 335
Kuwait 353 4.6 342
Year 4 mathematics 11
2C
hap
ter
2C
hapter
Trends in mathematics performance across countriesIn this section, different perspectives are provided on changes of scores over time. Figure 2.2 shows the trends for Australia for TIMSS 1995, 2003, 2007, 2011 and 2015, along with those for several other countries by way of comparison. Table 2.1 shows Australia’s position relative to those of all participating countries in 2015, 2011, 2007, 2003 and 1995. Figure 2.3 shows changes between 1995 and 2015 in the percentages of students achieving the Advanced international benchmark, as well as the percentages of students not achieving the Low benchmark.
Mat
hem
atic
s ac
hiev
emen
t
TIMSS cycle
Australia
Mat
hem
atic
s ac
hiev
emen
t
TIMSS cycle
USA
Mat
hem
atic
s ac
hiev
emen
t
TIMSS cycle
England
Mat
hem
atic
s ac
hiev
emen
t
New Zealand
Mat
hem
atic
s ac
hiev
emen
t
Singapore
Mat
hem
atic
s ac
hiev
emen
t
Czech Republic
TIMSS cycle
20112007200319991995 2015
470
550
20112007200319991995 20112007200319991995
20112007200319991995
440
520
560
640
470
550
2015 2015
2015
TIMSS cycle
20112007200319991995 2015
470
550
470
550
495 499
516 516
484
531541 542
518 518529
541
469
493 492486
590 594599
606
541
486
528
517
539
491
618
511
546
TIMSS cycle
20112007200319991995 2015
FIGURE 2.2 Trends in Year 4 mathematics achievement scores, 1995–2015, selected countries
Î Australia’s 2015 Year 4 mathematics score was significantly higher than the corresponding score in 1995; however, this was due to a single increase between 2003 and 2007, with no following decline. For the past three cycles, Australia’s scores have been the same.
Î Scores for students in the United States significantly increased over the period 2003 to 2011, but did not change over the last cycle. Similarly, England and New Zealand showed significant growth in early cycles but this has slowed over recent years.
Î Singapore’s score has increased steadily since TIMSS 1995, such that the mean score for 2015 is significantly higher than for all other cycles. In comparison, the score for the Czech Republic has rebounded over the past two cycles after a sharp decline in TIMSS 2007.
12 TIMSS 2015: A first look at Australia’s results
2C
hap
ter
2C
hapter
TABLE 2.1 Relative trends in Year 4 mathematics achievement, by country
CountryPosition
relative to Australia 2015
Position relative to
Australia 2011
Position relative to
Australia 2007
Position relative to
Australia 2003
Position relative to
Australia 1995
Singapore Ó Ó Ó Ó Ó
Hong Kong Ó Ó Ó Ó Ó
Korea Ó Ó – – Ó
Chinese Taipei Ó Ó Ó Ó –
Japan Ó Ó Ó Ó Ó
Northern Ireland Ó Ó – – –
Russian Federation Ó Ó Ó Ó –
Norway (5) Ó – – – –
Ireland Ó Ó – – Ó
England Ó Ó Ó Ó Ô
Belgium (Flemish) Ó Ó – Ó –
Kazakhstan Ó Ô – – –
Portugal Ó Ó – – Ô
United States Ó Ó Ó Ó Ó
Denmark Ó Ó • – –
Lithuania Ó Ó Ó Ó –
Finland Ó Ó – – –
Poland Ó – – – –
Netherlands Ó Ó Ó Ó Ó
Hungary Ó • • Ó Ó
Czech Republic Ó • Ô – Ó
Bulgaria • – – – –
Cyprus • – – Ó Ô
Germany • Ó Ó – –
Slovenia • • Ô Ô Ô
Sweden • Ô Ô – –
Serbia • • – – –
Australia
Canada • – – – –
Italy Ô Ô • • –
Spain Ô Ô – – –
Croatia Ô Ô – – –
Slovak Republic Ô Ô Ô – –
New Zealand Ô Ô Ô • Ô
France Ô – – – –
Turkey Ô Ô – – –
Georgia Ô Ô Ô – –
Chile Ô Ô – – –
United Arab Emirates Ô Ô – – –
Bahrain Ô Ô – – –
Qatar Ô Ô – – –
Iran Ô Ô Ô Ô Ô
Oman Ô Ô – – –
Indonesia Ô – – – –
Jordan Ô – – – –
Saudi Arabia Ô Ô – – –
Morocco Ô Ô – – –
South Africa (5) Ô – – – –
Kuwait Ô Ô – – –
Ó Score significantly higher than Australia’s.
Ô Score significantly lower than Australia’s.
• Score not significantly different to that of Australia.
– Did not participate in this cycle.
Year 4 mathematics 13
2C
hap
ter
2C
hapter

Î Of the countries that outperformed Australia at Year 4 in 2015, most also outperformed Australia at Year 4 in 2011.
Î Hungary and the Czech Republic, which had the same score as that of Australia in 2011, outperformed Australia in 2015.
Î Sweden, whose relative position was significantly lower than Australia’s both in 2007 and 2011, achieved a score in TIMSS 2015 that is not significantly different to that of Australia.
Î Kazakhstan, which was placed significantly lower than Australia in 2011, scored significantly higher than Australia in 2015.
Î In terms of trends since 1995, England, Portugal, Cyprus and Slovenia all scored at a significantly lower level than Australia’s in 1995 but have since improved to score at a level the same or significantly higher than Australia’s in 2015.
2015 1995
Singap
ore
Hong
Kong
Korea
Japan
Englan
d
United
Sta
tes
Irelan
d
Hunga
ry
Portu
gal
Cypru
s
Austra
lia
Czech
Rep
ublic
New Z
ealan
d
Sloven
ia
Nethe
rland
s
Norway
(4)
Iran
20
20
60
50
40
30
10
0
10
30
40
50
60
Percentages of students performing below the Low international benchmark
Percentages of students performing at or above theAdvanced international benchmark
Note: A coloured bar and a coloured circle indicate that the difference in the percentages of students between TIMSS 1995 and TIMSS 2015 was significant.
FIGURE 2.3 Percentages of high- and low-achieving students in Year 4 mathematics in TIMSS 1995 and TIMSS 2015, by country
Î In the majority of countries (14 out of 17) that participated in both TIMSS 1995 and TIMSS 2015, the percentages of Year 4 students achieving the Advanced benchmark significantly increased between 1995 and 2015.
Î Similarly, in 14 of the 17 countries, a higher percentage of students achieved the Low benchmark in 2015 than in 1995.
14 TIMSS 2015: A first look at Australia’s results
2C
hap
ter
2C
hapter

Mathematics performance in TIMSS 2015 for the Australian jurisdictions
Î The spread of average scores across the jurisdictions was 77 score points between the highest-performing jurisdiction, the Australian Capital Territory, and the lowest-performing jurisdiction, the Northern Territory.
Î The performance of students in the Australian Capital Territory was significantly higher than that of students in all jurisdictions except Victoria. Students in the Northern Territory performed at a level significantly below those of students in all other jurisdictions.
Î The jurisdiction with the highest percentage of students achieving the Advanced benchmark was the Australian Capital Territory, in which 15 per cent of students achieved the highest level. In New South Wales 11 per cent of students achieved this benchmark, and in Western Australia and Victoria 10 per cent of students achieved it. The Northern Territory had the lowest proportion of students at this level, with just four per cent achieving the Advanced benchmark.
Î Fifty-one per cent of students in the Northern Territory did not reach the Intermediate benchmark, which is the proficient standard for Australia. In the other Australian jurisdictions, this proportion ranged from 18 per cent in the Australian Capital Territory to 33 per cent in Western Australia.
Î Twenty-four per cent of students in the Northern Territory and between four and 13 per cent in all other jurisdictions did not reach the Low benchmark.
Jurisdiction Mean SEGap
95th–5th percentiles
Performance at each of the TIMSS international benchmarks
ACT 544 7.9 251
VIC 525 5.5 257
NSW 519 7.5 282
TAS 513 9.6 269
WA 512 9.1 300
QLD 511 5.6 265
SA 510 7.9 255
NT 467 13.3 311
Australia 517 3.1 275
2810
27 9
29 4
Below Low Low Intermediate High Advanced
9
24
9
10 22 28 6
25 6
27
22
21 34
15
39
34
27302013
27 833239
25 1134228
30 1035206
34 1534144
10
Note: In cases in which the proportion of students in a benchmark band is 1% or less, the numeric label will not appear on the band. This convention has been used for all figures about benchmarks in the chapter.
Due to rounding, some percentages in the figure may not match to totals in the text. See the Reader’s Guide for more information.
FIGURE 2.4 Mean scores and percentages of Australian students at the international benchmarks for Year 4 mathematics, by jurisdiction
Year 4 mathematics 15
2C
hap
ter
2C
hapter
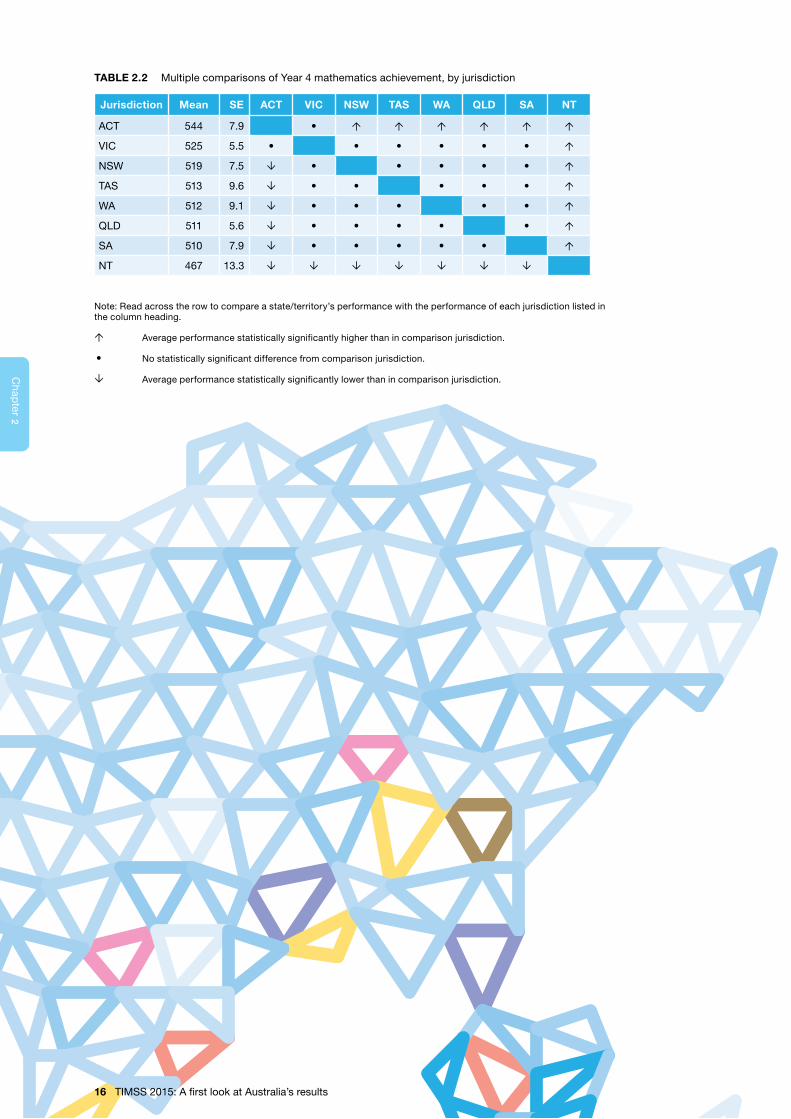
TABLE 2.2 Multiple comparisons of Year 4 mathematics achievement, by jurisdiction
Jurisdiction Mean SE ACT VIC NSW TAS WA QLD SA NT
ACT 544 7.9 • Ó Ó Ó Ó Ó Ó
VIC 525 5.5 • • • • • • Ó
NSW 519 7.5 Ô • • • • • Ó
TAS 513 9.6 Ô • • • • • Ó
WA 512 9.1 Ô • • • • • Ó
QLD 511 5.6 Ô • • • • • Ó
SA 510 7.9 Ô • • • • • Ó
NT 467 13.3 Ô Ô Ô Ô Ô Ô Ô
Note: Read across the row to compare a state/territory’s performance with the performance of each jurisdiction listed in the column heading.
Ó Average performance statistically significantly higher than in comparison jurisdiction.
• No statistically significant difference from comparison jurisdiction.
Ô Average performance statistically significantly lower than in comparison jurisdiction.
16 TIMSS 2015: A first look at Australia’s results
2C
hap
ter
2C
hapter
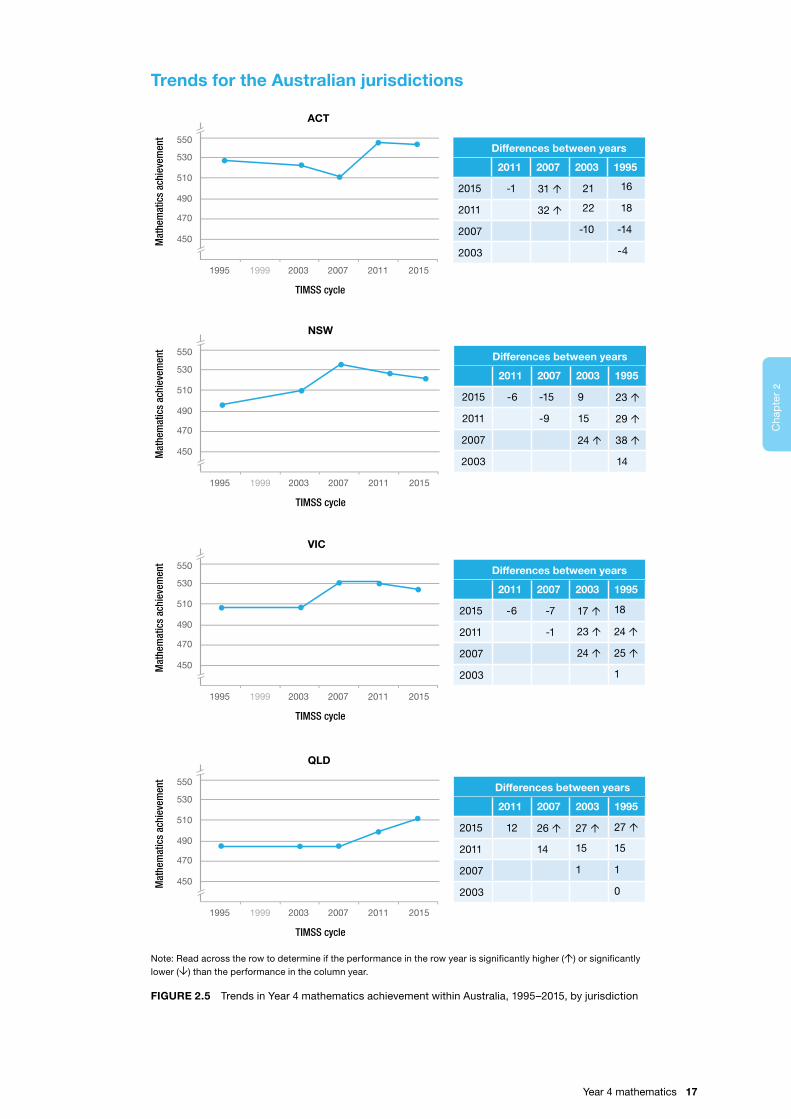
Trends for the Australian jurisdictions
1995 2003 2007 2011 2015
450
550
TIMSS cycle
1999
ACT
Mat
hem
atic
s ac
hiev
emen
t
470
490
510
530Differences between years
2011 2007 2003 1995
2015 -1 31 Ó 21 16
2011 32 Ó 22 18
2007 -10 -14
2003 -4
1995 2003 2007 2011 2015
450
550
TIMSS cycle
1999
NSW
Mat
hem
atic
s ac
hiev
emen
t
470
490
510
530Differences between years
2011 2007 2003 1995
2015 -6 -15 9 23 Ó
2011 -9 15 29 Ó
2007 24 Ó 38 Ó
2003 14
1995 2003 2007 2011 2015
450
550
TIMSS cycle
1999
VIC
Mat
hem
atic
s ac
hiev
emen
t
470
490
510
530Differences between years
2011 2007 2003 1995
2015 -6 -7 17 Ó 18
2011 -1 23 Ó 24 Ó
2007 24 Ó 25 Ó
2003 1
1995 2003 2007 2011 2015
450
550
TIMSS cycle
1999
QLD
Mat
hem
atic
s ac
hiev
emen
t
470
490
510
530 Differences between years
2011 2007 2003 1995
2015 12 26 Ó 27 Ó 27 Ó
2011 14 15 15
2007 1 1
2003 0
Note: Read across the row to determine if the performance in the row year is significantly higher (Ó) or significantly lower (Ô) than the performance in the column year.
FIGURE 2.5 Trends in Year 4 mathematics achievement within Australia, 1995–2015, by jurisdiction
Year 4 mathematics 17
2C
hap
ter
2C
hapter

1995 2003 2007 2011 2015
450
550
TIMSS cycle
1999
SA
Mat
hem
atic
s ac
hiev
emen
t
470
490
510
530Differences between years
2011 2007 2003 1995
2015 8 17 25 Ó 25 Ó
2011 9 17 17
2007 8 8
2003 0
1995 2003 2007 2011 2015
450
550
TIMSS cycle
1999
WA
Mat
hem
atic
s ac
hiev
emen
t
470
490
510
530Differences between years
2011 2007 2003 1995
2015 13 19 40 Ó 29 Ó
2011 6 27 Ó 16
2007 21 Ó 10
2003 -11
1995 2003 2007 2011 2015
450
550
TIMSS cycle
1999
TAS
Mat
hem
atic
s ac
hiev
emen
t
470
490
510
530Differences between years
2011 2007 2003 1995
2015 -4 3 16 27 Ó
2011 7 20 31 Ó
2007 13 24 Ó
2003 11
1995 2003 2007 2011 2015
450
550
TIMSS cycle
1999
NT
Mat
hem
atic
s ac
hiev
emen
t
470
490
510
530Differences between years
2011 2007 2003 1995
2015 -22 -17 -12 -23
2011 5 10 -2
2007 5 -7
2003 -12
Note: Read across the row to determine if the performance in the row year is significantly higher (Ó) or significantly lower (Ô) than the performance in the column year.
FIGURE 2.5 Trends in Year 4 mathematics achievement within Australia, 1995–2015, by jurisdiction (cont.)
Î None of the differences at Year 4 between TIMSS 2011 and TIMSS 2015 were significant.
Î New South Wales, Queensland, South Australia, Western Australia and Tasmania all had significantly higher average scores in 2015 than in 1995.
18 TIMSS 2015: A first look at Australia’s results
2C
hap
ter
2C
hapter
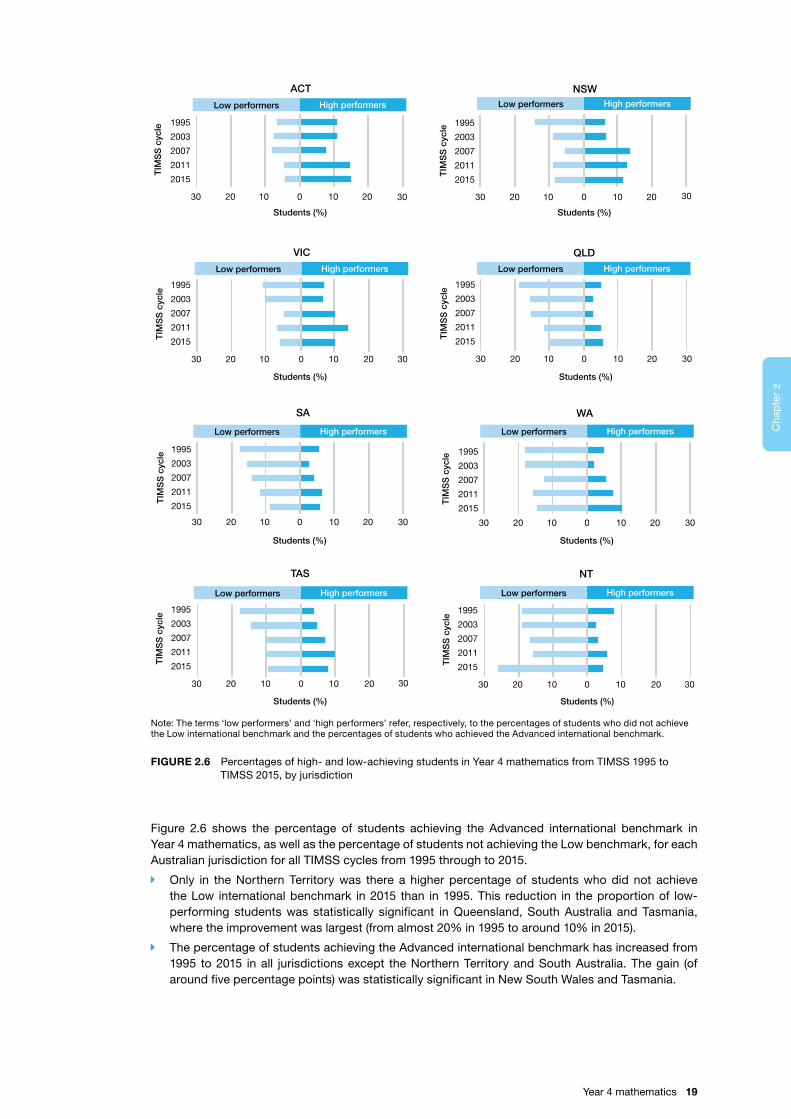
High performersLow performers
High performersLow performers High performersLow performers
High performersLow performers
High performersLow performers High performersLow performers
High performersLow performers High performersLow performers
TIM
SS
cyc
le
Students (%)
TIM
SS
cyc
le
Students (%)
TIM
SS
cyc
le
0 10 20102030
ACT
1995
2003
2007
2011
2015
30
0 10 20102030
1995
2003
2007
2011
2015
30
VIC
NSW
QLD
SA WA
0 10 20102030
1995
2003
2007
2011
2015
30 0 10 20102030
1995
2003
2007
2011
2015
30
0 10 20102030
1995
2003
2007
2011
2015
30
0 10 20102030
1995
2003
2007
2011
2015
Students (%)
TIM
SS
cyc
le
30 0 10 20102030
1995
2003
2007
2011
2015
Students (%)
30
TAS NT
0 10 20102030
1995
2003
2007
2011
2015
30
TIM
SS
cyc
le
Students (%)
TIM
SS
cyc
le
Students (%)
TIM
SS
cyc
le
Students (%)
TIM
SS
cyc
le
Students (%)
Note: The terms ‘low performers’ and ‘high performers’ refer, respectively, to the percentages of students who did not achieve the Low international benchmark and the percentages of students who achieved the Advanced international benchmark.
FIGURE 2.6 Percentages of high- and low-achieving students in Year 4 mathematics from TIMSS 1995 to TIMSS 2015, by jurisdiction
Figure 2.6 shows the percentage of students achieving the Advanced international benchmark in Year 4 mathematics, as well as the percentage of students not achieving the Low benchmark, for each Australian jurisdiction for all TIMSS cycles from 1995 through to 2015.
Î Only in the Northern Territory was there a higher percentage of students who did not achieve the Low international benchmark in 2015 than in 1995. This reduction in the proportion of low-performing students was statistically significant in Queensland, South Australia and Tasmania, where the improvement was largest (from almost 20% in 1995 to around 10% in 2015).
Î The percentage of students achieving the Advanced international benchmark has increased from 1995 to 2015 in all jurisdictions except the Northern Territory and South Australia. The gain (of around five percentage points) was statistically significant in New South Wales and Tasmania.
Year 4 mathematics 19
2C
hap
ter
2C
hapter
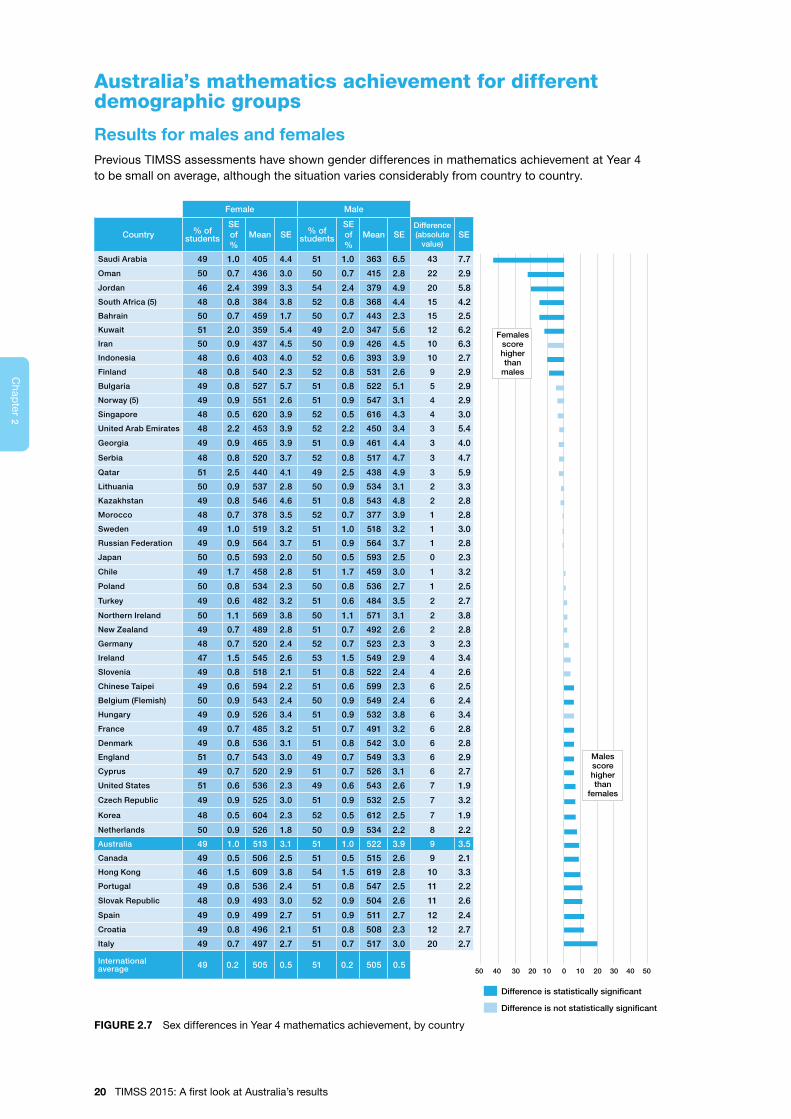
Australia’s mathematics achievement for different demographic groups
Results for males and femalesPrevious TIMSS assessments have shown gender differences in mathematics achievement at Year 4 to be small on average, although the situation varies considerably from country to country.
Female Male
Country % ofstudents
SEof %
Mean SE % ofstudents
SEof %
Mean SEDifference (absolute
value)SE
Saudi Arabia 49 1.0 405 4.4 51 1.0 363 6.5 43 7.7
Oman 50 0.7 436 3.0 50 0.7 415 2.8 22 2.9
Jordan 46 2.4 399 3.3 54 2.4 379 4.9 20 5.8
South Africa (5) 48 0.8 384 3.8 52 0.8 368 4.4 15 4.2
Bahrain 50 0.7 459 1.7 50 0.7 443 2.3 15 2.5
Kuwait 51 2.0 359 5.4 49 2.0 347 5.6 12 6.2
Iran 50 0.9 437 4.5 50 0.9 426 4.5 10 6.3
Indonesia 48 0.6 403 4.0 52 0.6 393 3.9 10 2.7
Finland 48 0.8 540 2.3 52 0.8 531 2.6 9 2.9
Bulgaria 49 0.8 527 5.7 51 0.8 522 5.1 5 2.9
Norway (5) 49 0.9 551 2.6 51 0.9 547 3.1 4 2.9
Singapore 48 0.5 620 3.9 52 0.5 616 4.3 4 3.0
United Arab Emirates 48 2.2 453 3.9 52 2.2 450 3.4 3 5.4
Georgia 49 0.9 465 3.9 51 0.9 461 4.4 3 4.0
Serbia 48 0.8 520 3.7 52 0.8 517 4.7 3 4.7
Qatar 51 2.5 440 4.1 49 2.5 438 4.9 3 5.9
Lithuania 50 0.9 537 2.8 50 0.9 534 3.1 2 3.3
Kazakhstan 49 0.8 546 4.6 51 0.8 543 4.8 2 2.8
Morocco 48 0.7 378 3.5 52 0.7 377 3.9 1 2.8
Sweden 49 1.0 519 3.2 51 1.0 518 3.2 1 3.0
Russian Federation 49 0.9 564 3.7 51 0.9 564 3.7 1 2.8
Japan 50 0.5 593 2.0 50 0.5 593 2.5 0 2.3
Chile 49 1.7 458 2.8 51 1.7 459 3.0 1 3.2
Poland 50 0.8 534 2.3 50 0.8 536 2.7 1 2.5
Turkey 49 0.6 482 3.2 51 0.6 484 3.5 2 2.7
Northern Ireland 50 1.1 569 3.8 50 1.1 571 3.1 2 3.8
New Zealand 49 0.7 489 2.8 51 0.7 492 2.6 2 2.8
Germany 48 0.7 520 2.4 52 0.7 523 2.3 3 2.3
Ireland 47 1.5 545 2.6 53 1.5 549 2.9 4 3.4
Slovenia 49 0.8 518 2.1 51 0.8 522 2.4 4 2.6
Chinese Taipei 49 0.6 594 2.2 51 0.6 599 2.3 6 2.5
Belgium (Flemish) 50 0.9 543 2.4 50 0.9 549 2.4 6 2.4
Hungary 49 0.9 526 3.4 51 0.9 532 3.8 6 3.4
France 49 0.7 485 3.2 51 0.7 491 3.2 6 2.8
Denmark 49 0.8 536 3.1 51 0.8 542 3.0 6 2.8
England 51 0.7 543 3.0 49 0.7 549 3.3 6 2.9
Cyprus 49 0.7 520 2.9 51 0.7 526 3.1 6 2.7
United States 51 0.6 536 2.3 49 0.6 543 2.6 7 1.9
Czech Republic 49 0.9 525 3.0 51 0.9 532 2.5 7 3.2
Korea 48 0.5 604 2.3 52 0.5 612 2.5 7 1.9
Netherlands 50 0.9 526 1.8 50 0.9 534 2.2 8 2.2
Australia 49 1.0 513 3.1 51 1.0 522 3.9 9 3.5
Canada 49 0.5 506 2.5 51 0.5 515 2.6 9 2.1
Hong Kong 46 1.5 609 3.8 54 1.5 619 2.8 10 3.3
Portugal 49 0.8 536 2.4 51 0.8 547 2.5 11 2.2
Slovak Republic 48 0.9 493 3.0 52 0.9 504 2.6 11 2.6
Spain 49 0.9 499 2.7 51 0.9 511 2.7 12 2.4
Croatia 49 0.8 496 2.1 51 0.8 508 2.3 12 2.7
Italy 49 0.7 497 2.7 51 0.7 517 3.0 20 2.7
International average 49 0.2 505 0.5 51 0.2 505 0.5
0 10 20 30 40 5050 40 30 20 10
Femalesscorehigherthan
males
Malesscorehigherthan
females
Difference is statistically significant
Difference is not statistically significant
FIGURE 2.7 Sex differences in Year 4 mathematics achievement, by country
20 TIMSS 2015: A first look at Australia’s results
2C
hap
ter
2C
hapter
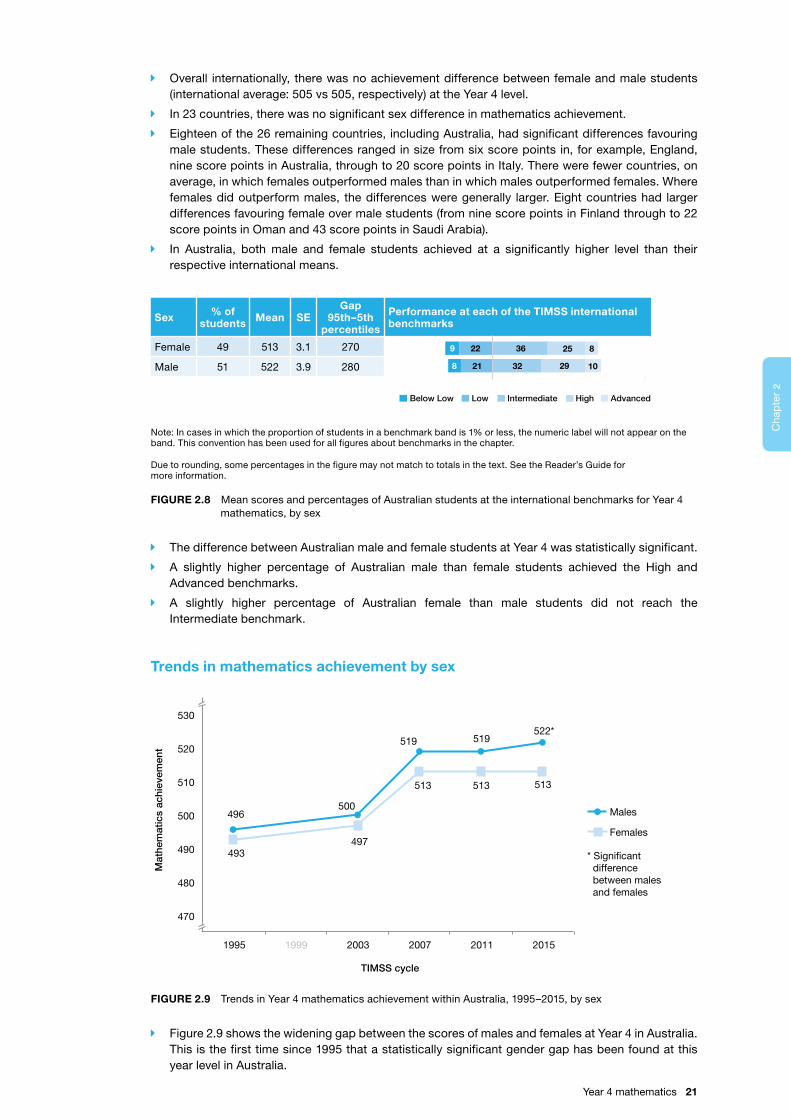
Î Overall internationally, there was no achievement difference between female and male students (international average: 505 vs 505, respectively) at the Year 4 level.
Î In 23 countries, there was no significant sex difference in mathematics achievement.
Î Eighteen of the 26 remaining countries, including Australia, had significant differences favouring male students. These differences ranged in size from six score points in, for example, England, nine score points in Australia, through to 20 score points in ItaIy. There were fewer countries, on average, in which females outperformed males than in which males outperformed females. Where females did outperform males, the differences were generally larger. Eight countries had larger differences favouring female over male students (from nine score points in Finland through to 22 score points in Oman and 43 score points in Saudi Arabia).
Î In Australia, both male and female students achieved at a significantly higher level than their respective international means.
Sex % of students Mean SE
Gap 95th–5th
percentiles
Performance at each of the TIMSS international benchmarks
Female 49 513 3.1 270
Male 51 522 3.9 280 29 1032218
25 836229
Below Low Low Intermediate High Advanced
Note: In cases in which the proportion of students in a benchmark band is 1% or less, the numeric label will not appear on the band. This convention has been used for all figures about benchmarks in the chapter.
Due to rounding, some percentages in the figure may not match to totals in the text. See the Reader’s Guide for more information.
FIGURE 2.8 Mean scores and percentages of Australian students at the international benchmarks for Year 4 mathematics, by sex
Î The difference between Australian male and female students at Year 4 was statistically significant.
Î A slightly higher percentage of Australian male than female students achieved the High and Advanced benchmarks.
Î A slightly higher percentage of Australian female than male students did not reach the Intermediate benchmark.
Trends in mathematics achievement by sex
496500
519 519522*
493497
513 513 513
470
480
490
500
510
520
530
1995 1999 2003 2007 2011 2015
Mat
hem
atic
s ac
hiev
emen
t
Males
Females
TIMSS cycle
* Signi�cant difference between males and females
FIGURE 2.9 Trends in Year 4 mathematics achievement within Australia, 1995–2015, by sex
Î Figure 2.9 shows the widening gap between the scores of males and females at Year 4 in Australia. This is the first time since 1995 that a statistically significant gender gap has been found at this year level in Australia.
Year 4 mathematics 21
2C
hap
ter
2C
hapter
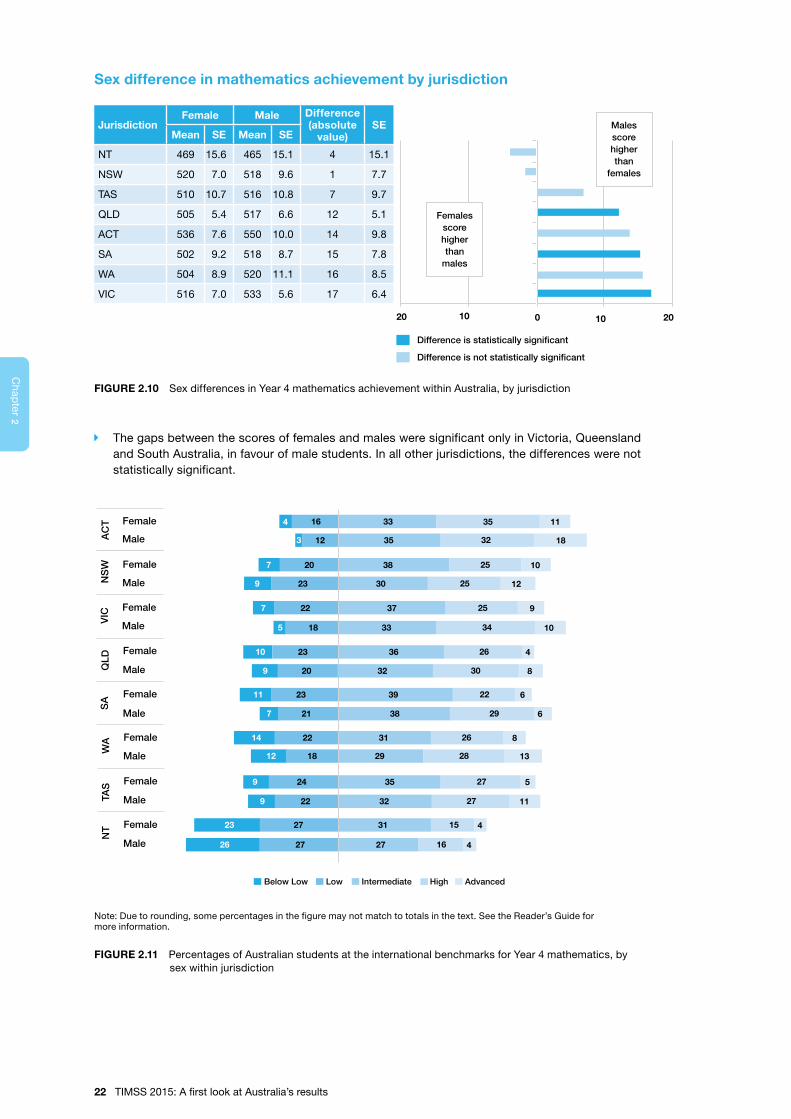
Sex difference in mathematics achievement by jurisdiction
JurisdictionFemale Male Difference
(absolute value)
SEMean SE Mean SE
NT 469 15.6 465 15.1 4 15.1
NSW 520 7.0 518 9.6 1 7.7
TAS 510 10.7 516 10.8 7 9.7
QLD 505 5.4 517 6.6 12 5.1
ACT 536 7.6 550 10.0 14 9.8
SA 502 9.2 518 8.7 15 7.8
WA 504 8.9 520 11.1 16 8.5
VIC 516 7.0 533 5.6 17 6.4
20 10 20100
Femalesscorehigherthan
males
Malesscorehigherthan
females
Difference is statistically significant
Difference is not statistically significant
FIGURE 2.10 Sex differences in Year 4 mathematics achievement within Australia, by jurisdiction
Î The gaps between the scores of females and males were significant only in Victoria, Queensland and South Australia, in favour of male students. In all other jurisdictions, the differences were not statistically significant.
35 113316
32 1835123
25 1038207
25 1230239
25 937227
34 1033185
26 4362310
22 6392311
29 638217
26 8312214
28 13291812
27 535249
27 1132229
15 4312723
16 4272726
30 832209
4Female
MaleAC
T
Female
MaleNS
W
Female
MaleVIC
Female
MaleQLD
Female
Male
SA
Female
MaleWA
Female
MaleTAS
Female
Male
NT
Below Low Low Intermediate High Advanced
Note: Due to rounding, some percentages in the figure may not match to totals in the text. See the Reader’s Guide for more information.
FIGURE 2.11 Percentages of Australian students at the international benchmarks for Year 4 mathematics, by sex within jurisdiction
22 TIMSS 2015: A first look at Australia’s results
2C
hap
ter
2C
hapter
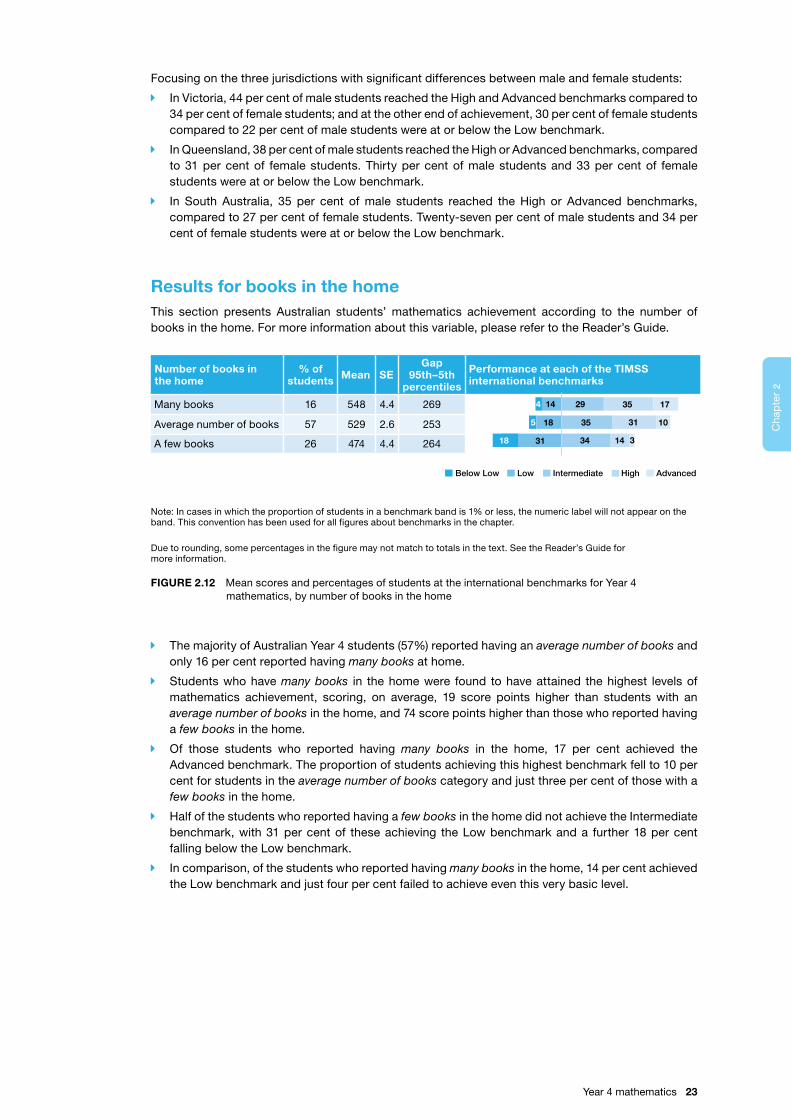
Focusing on the three jurisdictions with significant differences between male and female students:
Î In Victoria, 44 per cent of male students reached the High and Advanced benchmarks compared to 34 per cent of female students; and at the other end of achievement, 30 per cent of female students compared to 22 per cent of male students were at or below the Low benchmark.
Î In Queensland, 38 per cent of male students reached the High or Advanced benchmarks, compared to 31 per cent of female students. Thirty per cent of male students and 33 per cent of female students were at or below the Low benchmark.
Î In South Australia, 35 per cent of male students reached the High or Advanced benchmarks, compared to 27 per cent of female students. Twenty-seven per cent of male students and 34 per cent of female students were at or below the Low benchmark.
Results for books in the homeThis section presents Australian students’ mathematics achievement according to the number of books in the home. For more information about this variable, please refer to the Reader’s Guide.
Number of books in the home
% of students Mean SE
Gap 95th–5th
percentiles
Performance at each of the TIMSS international benchmarks
Many books 16 548 4.4 269
Average number of books 57 529 2.6 253
A few books 26 474 4.4 264
31 1035185
35 1729144
314343118
Below Low Low Intermediate High Advanced
Note: In cases in which the proportion of students in a benchmark band is 1% or less, the numeric label will not appear on the band. This convention has been used for all figures about benchmarks in the chapter.
Due to rounding, some percentages in the figure may not match to totals in the text. See the Reader’s Guide for more information.
FIGURE 2.12 Mean scores and percentages of students at the international benchmarks for Year 4 mathematics, by number of books in the home
Î The majority of Australian Year 4 students (57%) reported having an average number of books and only 16 per cent reported having many books at home.
Î Students who have many books in the home were found to have attained the highest levels of mathematics achievement, scoring, on average, 19 score points higher than students with an average number of books in the home, and 74 score points higher than those who reported having a few books in the home.
Î Of those students who reported having many books in the home, 17 per cent achieved the Advanced benchmark. The proportion of students achieving this highest benchmark fell to 10 per cent for students in the average number of books category and just three per cent of those with a few books in the home.
Î Half of the students who reported having a few books in the home did not achieve the Intermediate benchmark, with 31 per cent of these achieving the Low benchmark and a further 18 per cent falling below the Low benchmark.
Î In comparison, of the students who reported having many books in the home, 14 per cent achieved the Low benchmark and just four per cent failed to achieve even this very basic level.
Year 4 mathematics 23
2C
hap
ter
2C
hapter
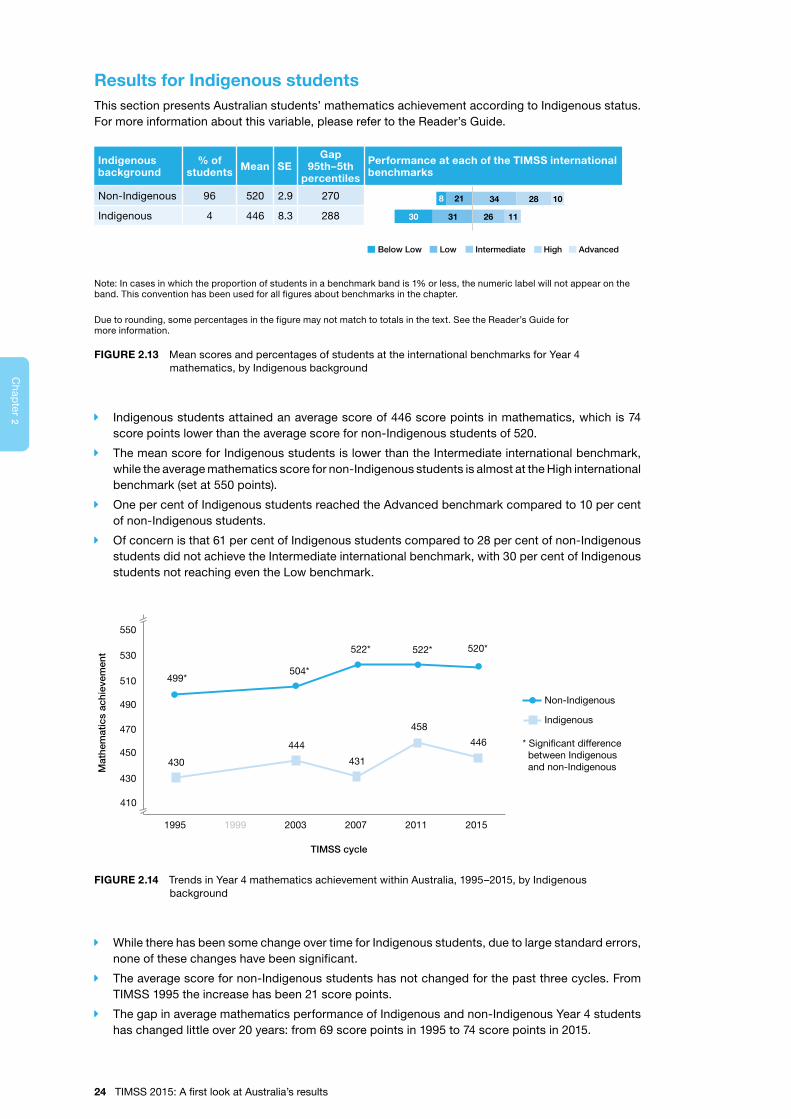
Results for Indigenous studentsThis section presents Australian students’ mathematics achievement according to Indigenous status. For more information about this variable, please refer to the Reader’s Guide.
Indigenous background
% of students Mean SE
Gap 95th–5th
percentiles
Performance at each of the TIMSS international benchmarks
Non-Indigenous 96 520 2.9 270
Indigenous 4 446 8.3 288 3130 26 11
21 34 28 108
Below Low Low Intermediate High Advanced
Note: In cases in which the proportion of students in a benchmark band is 1% or less, the numeric label will not appear on the band. This convention has been used for all figures about benchmarks in the chapter.
Due to rounding, some percentages in the figure may not match to totals in the text. See the Reader’s Guide for more information.
FIGURE 2.13 Mean scores and percentages of students at the international benchmarks for Year 4 mathematics, by Indigenous background
Î Indigenous students attained an average score of 446 score points in mathematics, which is 74 score points lower than the average score for non-Indigenous students of 520.
Î The mean score for Indigenous students is lower than the Intermediate international benchmark, while the average mathematics score for non-Indigenous students is almost at the High international benchmark (set at 550 points).
Î One per cent of Indigenous students reached the Advanced benchmark compared to 10 per cent of non-Indigenous students.
Î Of concern is that 61 per cent of Indigenous students compared to 28 per cent of non-Indigenous students did not achieve the Intermediate international benchmark, with 30 per cent of Indigenous students not reaching even the Low benchmark.
Non-Indigenous
458
431
504*
522*
499*
430
444 446
522* 520*
430
450
470
490
510
530
550
1995 1999 2003 2007 2011 2015
Mat
hem
atic
s ac
hiev
emen
t
Indigenous
TIMSS cycle
* Signi�cant difference between Indigenous and non-Indigenous
410
FIGURE 2.14 Trends in Year 4 mathematics achievement within Australia, 1995–2015, by Indigenous background
Î While there has been some change over time for Indigenous students, due to large standard errors, none of these changes have been significant.
Î The average score for non-Indigenous students has not changed for the past three cycles. From TIMSS 1995 the increase has been 21 score points.
Î The gap in average mathematics performance of Indigenous and non-Indigenous Year 4 students has changed little over 20 years: from 69 score points in 1995 to 74 score points in 2015.
24 TIMSS 2015: A first look at Australia’s results
2C
hap
ter
2C
hapter

Results for language spoken at homeThis section presents Australian students’ mathematics achievement according to whether a language other than English is spoken as the main language at home. For more information about this variable, please refer to the Reader’s Guide.
Language spoken at home
% of students Mean SE
Gap 95th–5th
percentiles
Performance at each of the TIMSS international benchmarks
English 85 518 3.1 271
Other 15 518 6.6 288 9 33 11
21 34 28 98
24
Below Low Low Intermediate High Advanced
23
Note: In cases in which the proportion of students in a benchmark band is 1% or less, the numeric label will not appear on the band. This convention has been used for all figures about benchmarks in the chapter.
Due to rounding, some percentages in the figure may not match to totals in the text. See the Reader’s Guide for more information.
FIGURE 2.15 Mean scores and percentages of students at the international benchmarks for Year 4 mathematics, by language spoken at home
Î While the majority of students tested in Year 4 spoke English ‘always’ or ‘almost always’ at home, there were around 15 per cent of students for whom this was not true.
Î There were no significant differences in the average scores of the two groups.
Results for geographic location of the schoolThis section presents Australian students’ mathematics achievement according to the geographic location of the school. For more information about this variable, please refer to the Reader’s Guide.
Geographic location
% of students Mean SE
Gap 95th–5th
percentiles
Performance at each of the TIMSS international benchmarks
Metropolitan 69 526 3.2 267
Provincial 30 498 7.0 274
Remote 1 456 12.5 310
Below Low Low Intermediate High Advanced
21362513
30 1133207
314272629
6
Note: In cases in which the proportion of students in a benchmark band is 1% or less, the numeric label will not appear on the band. This convention has been used for all figures about benchmarks in the chapter.
Due to rounding, some percentages in the figure may not match to totals in the text. See the Reader’s Guide for more information.
FIGURE 2.16 Mean scores and percentages of students at the international benchmarks for Year 4 mathematics, by geographic location
Î Students attending school in remote areas make up only one per cent of the Year 4 TIMSS sample, while those attending school in metropolitan areas make up 69 per cent of the sample.
Î Students attending schools in metropolitan areas achieved, on average, 29 score points higher than students attending schools in provincial areas, and 70 score points, on average, higher than students in remote schools. Students attending schools in provincial areas scored, on average, 41 score points higher than students attending schools in remote areas. All these differences are statistically significant.
Year 4 mathematics 25
2C
hap
ter
2C
hapter
Î More than half (56%) of the students in remote schools did not reach the Intermediate international benchmark. More than half of these students performed below the Low international benchmark. In contrast, only 13 per cent of students from provincial schools and seven per cent of students from metropolitan schools were performing at a level below that of the Low international benchmark.
Î The difference in achievement is even more evident at the higher end of the achievement spectrum. While some students from remote schools did achieve scores above the international mean score of 500, only three per cent achieved the Advanced international benchmark, compared to six per cent of students from provincial schools and 11 per cent of students from metropolitan schools.
26 TIMSS 2015: A first look at Australia’s results
<Chapter Num
ber>C
hap
ter
2C
hapter
Year 8 mathematics
Australia’s Year 8 mathematics results within the international contextFigure 3.1 (see page 28) shows the means, standard errors, gaps between the 5th and 95th percen-tiles and, to the right of the percentile gaps, the percentages of students in each country at the TIMSS benchmarks.
Î Singapore, Korea, Chinese Taipei, Hong Kong and Japan recorded the highest achievement at Year 8, with average performance above the High international benchmark of 550. Singapore’s score of 621 was significantly higher than the scores of all other countries, followed by Korea (606) and Chinese Taipei (599), whose scores were not significantly different to each other but were significantly higher than those of all other countries. These scores are all in the upper ranges of the High international benchmark, almost achieving an average at the Advanced international benchmark.
Î Australian Year 8 students’ average score of 505 score points was significantly higher than the scores for 21 other countries, such as Italy, New Zealand and Malaysia, and places average achievement at the Intermediate benchmark.
Î Australia was significantly outperformed by 12 countries, including Canada, Ireland, England and the United States, as well as the top five East Asian countries mentioned above and the Russian Federation, Kazakhstan and Slovenia.
Î Canada and Slovenia, both relatively high-achieving countries, had the smallest gap between high and low achievers (229 score points), while Turkey had the largest gap, of 345 score points. Australia’s gap was about mid-range at 272 score points, similar to that of Singapore and the United States.
Î The East Asian countries of Singapore, Chinese Taipei, Korea, Hong Kong and Japan have an impressive percentage of Year 8 students reaching the Advanced benchmark. In the top five countries, over one-third of Year 8 students achieved the Advanced benchmark, with over 50 per cent of Year 8 students in Singapore doing so.
Î Kazakhstan (15%), the Russian Federation (14%), Israel (13%) and Hungary (12%) were the next best at reaching the Advanced benchmark, while 10 per cent of students in England and the United States achieved this standard.
3
Year 8 mathematics 27
Chapter
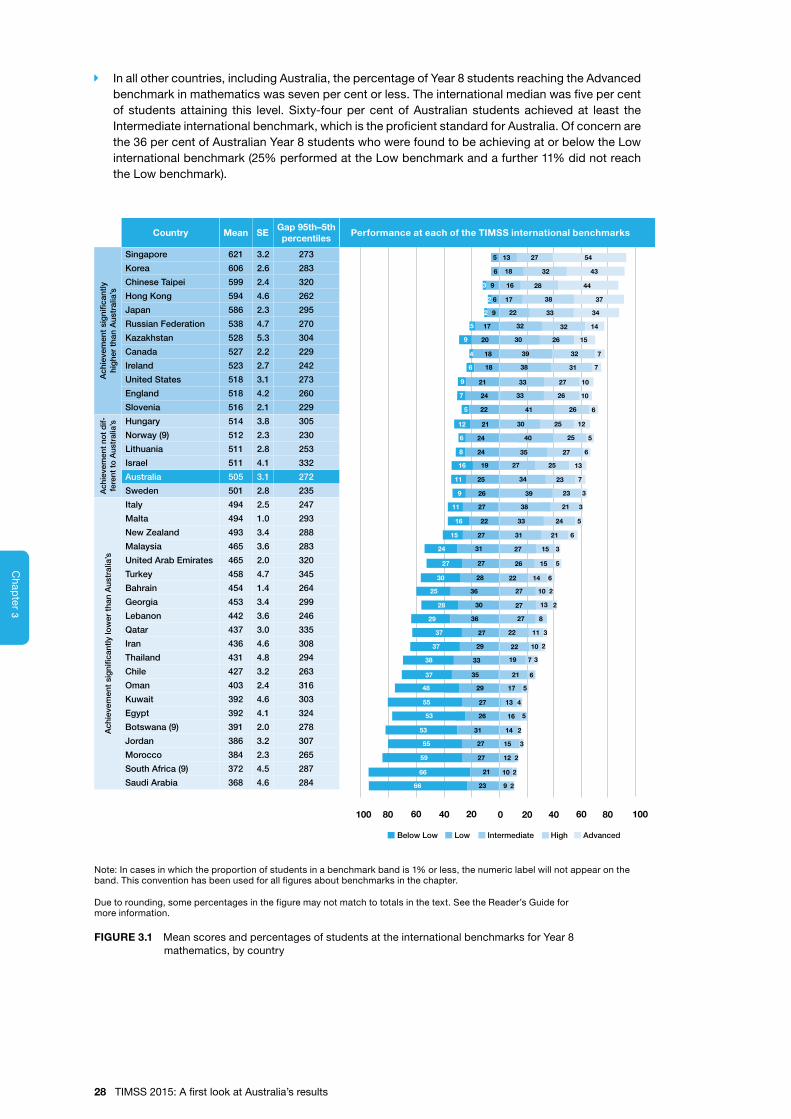
3C
hap
ter
3C
hapter
Î In all other countries, including Australia, the percentage of Year 8 students reaching the Advanced benchmark in mathematics was seven per cent or less. The international median was five per cent of students attaining this level. Sixty-four per cent of Australian students achieved at least the Intermediate international benchmark, which is the proficient standard for Australia. Of concern are the 36 per cent of Australian Year 8 students who were found to be achieving at or below the Low international benchmark (25% performed at the Low benchmark and a further 11% did not reach the Low benchmark).
0 20 40 60 80 100100 80 60 40 20
Below Low Low Intermediate High Advanced
4
3
16
2
13 27 54
6 32 43
9 28 44
6 17 38 37
33 349
5 3217 32 14
9 20 26 15
18 39 32 7
6 3818 31 7
9 3321 27 10
33 26 10
22 41 26 6
21 30 25 12
6 4024 25 5
8 3524 27 6
16 19 27 25
11 34 23
38 21 3
16 3322 24 5
15 27 31 21 6
27 27 26 15 5
30 28 22 14 6
25 36 27 10 2
24 31 27 15 3
28 30 27 13 2
29 36 27 8
37 27 22 11
37 2229 210
38 33 19
37 35 21 6
48 29 17 5
55 27 13
53 26 5
53 1431 2
55 1527 3
59 27 12 2
66 21 10
66 23 9 2
4
16
4
7 3
3
11 27
25
13
12
247
30
222
2
3 16
18
5
5
7
9 26 39 23 3
2
Country Mean SEGap 95th–5th percentiles
Performance at each of the TIMSS international benchmarks
Ach
ieve
men
t si
gni
fican
tly
hig
her
than
Aus
tral
ia’s
Singapore 621 3.2 273
Korea 606 2.6 283
Chinese Taipei 599 2.4 320
Hong Kong 594 4.6 262
Japan 586 2.3 295
Russian Federation 538 4.7 270
Kazakhstan 528 5.3 304
Canada 527 2.2 229
Ireland 523 2.7 242
United States 518 3.1 273
England 518 4.2 260
Slovenia 516 2.1 229
Ach
ieve
men
t no
t d
if-fe
rent
to
Aus
tral
ia’s Hungary 514 3.8 305
Norway (9) 512 2.3 230
Lithuania 511 2.8 253
Israel 511 4.1 332
Australia 505 3.1 272
Sweden 501 2.8 235
Ach
ieve
men
t si
gni
fican
tly lo
wer
tha
n A
ustr
alia
’s
Italy 494 2.5 247
Malta 494 1.0 293
New Zealand 493 3.4 288
Malaysia 465 3.6 283
United Arab Emirates 465 2.0 320
Turkey 458 4.7 345
Bahrain 454 1.4 264
Georgia 453 3.4 299
Lebanon 442 3.6 246
Qatar 437 3.0 335
Iran 436 4.6 308
Thailand 431 4.8 294
Chile 427 3.2 263
Oman 403 2.4 316
Kuwait 392 4.6 303
Egypt 392 4.1 324
Botswana (9) 391 2.0 278
Jordan 386 3.2 307
Morocco 384 2.3 265
South Africa (9) 372 4.5 287
Saudi Arabia 368 4.6 284
Note: In cases in which the proportion of students in a benchmark band is 1% or less, the numeric label will not appear on the band. This convention has been used for all figures about benchmarks in the chapter.
Due to rounding, some percentages in the figure may not match to totals in the text. See the Reader’s Guide for more information.
FIGURE 3.1 Mean scores and percentages of students at the international benchmarks for Year 8 mathematics, by country
28 TIMSS 2015: A first look at Australia’s results

3C
hap
ter
3C
hapter
Trends in mathematics performance across countriesIn this section, different perspectives are provided on changes of scores over time. Figure 3.2 shows the trends for Australia for TIMSS 1995, 2003, 2007, 2011 and 2015, along with those for several other countries by way of comparison. Table 3.1 shows Australia’s position relative to those of all participating countries in 2015, 2011, 2007, 2003 and 1995. Figure 3.3 shows changes between 1995 and 2015 in the percentages of students achieving the Advanced international benchmark, as well as the percentages of students not achieving the Low benchmark.
Mat
hem
atic
s ac
hiev
emen
t
TIMSS cycle
Australia
Mat
hem
atic
s ac
hiev
emen
t
TIMSS cycle
USA
Mat
hem
atic
s ac
hiev
emen
t
TIMSS cycle
England
Mat
hem
atic
s ac
hiev
emen
t
New Zealand
Mat
hem
atic
s ac
hiev
emen
t
Singapore
Mat
hem
atic
s ac
hiev
emen
t
Slovenia
TIMSS cycle
20112007200319991995 2015
460
540
20112007200319991995
470
550
20112007200319991995
470
550
20112007200319991995
450
530
570
650
460
540
2015 2015
2015
TIMSS cycle
20112007200319991995 2015
509 505496
505
498 498
513507
492
504 508 509
609 605593
611
501491 494 488
494501
516
505518
621
493
505
518
TIMSS cycle
20112007200319991995 2015
502
496
604 493
FIGURE 3.2 Trends in Year 8 mathematics achievement scores, 1995–2015, selected countries
Î Australia’s score at Year 8 was the same as in TIMSS 1995, with only a slight dip in scores in 2007 and then a recovery in 2011.
Î The United States and England have improved over recent cycles so that their average performance is now significantly higher than that of Australia.
Î Slovenia has improved slowly and steadily since 2003 – its score has progressed from lower than or equal to Australia’s score to a level, in 2015, that is significantly higher than Australia’s.
Year 8 mathematics 29
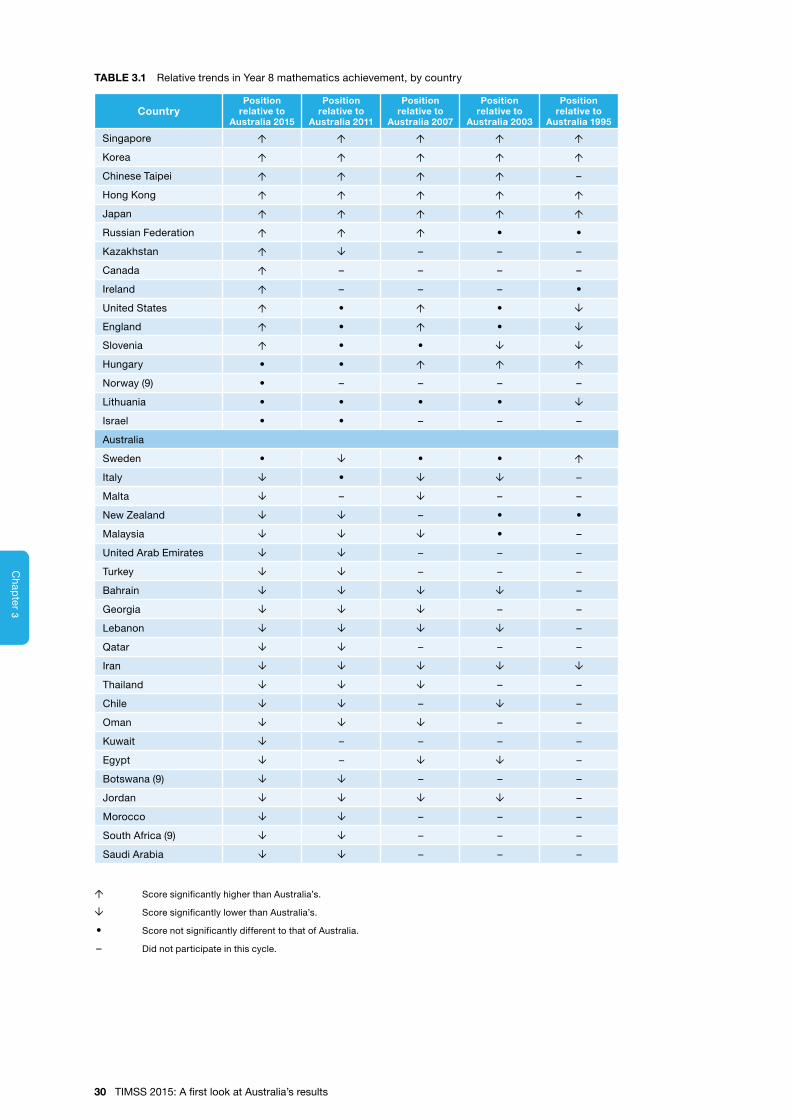
3C
hap
ter
3C
hapter
TABLE 3.1 Relative trends in Year 8 mathematics achievement, by country
CountryPosition
relative to Australia 2015
Position relative to
Australia 2011
Position relative to
Australia 2007
Position relative to
Australia 2003
Position relative to
Australia 1995
Singapore Ó Ó Ó Ó Ó
Korea Ó Ó Ó Ó Ó
Chinese Taipei Ó Ó Ó Ó –
Hong Kong Ó Ó Ó Ó Ó
Japan Ó Ó Ó Ó Ó
Russian Federation Ó Ó Ó • •
Kazakhstan Ó Ô – – –
Canada Ó – – – –
Ireland Ó – – – •
United States Ó • Ó • Ô
England Ó • Ó • Ô
Slovenia Ó • • Ô Ô
Hungary • • Ó Ó Ó
Norway (9) • – – – –
Lithuania • • • • Ô
Israel • • – – –
Australia
Sweden • Ô • • Ó
Italy Ô • Ô Ô –
Malta Ô – Ô – –
New Zealand Ô Ô – • •
Malaysia Ô Ô Ô • –
United Arab Emirates Ô Ô – – –
Turkey Ô Ô – – –
Bahrain Ô Ô Ô Ô –
Georgia Ô Ô Ô – –
Lebanon Ô Ô Ô Ô –
Qatar Ô Ô – – –
Iran Ô Ô Ô Ô Ô
Thailand Ô Ô Ô – –
Chile Ô Ô – Ô –
Oman Ô Ô Ô – –
Kuwait Ô – – – –
Egypt Ô – Ô Ô –
Botswana (9) Ô Ô – – –
Jordan Ô Ô Ô Ô –
Morocco Ô Ô – – –
South Africa (9) Ô Ô – – –
Saudi Arabia Ô Ô – – –
Ó Score significantly higher than Australia’s.
Ô Score significantly lower than Australia’s.
• Score not significantly different to that of Australia.
– Did not participate in this cycle.
30 TIMSS 2015: A first look at Australia’s results
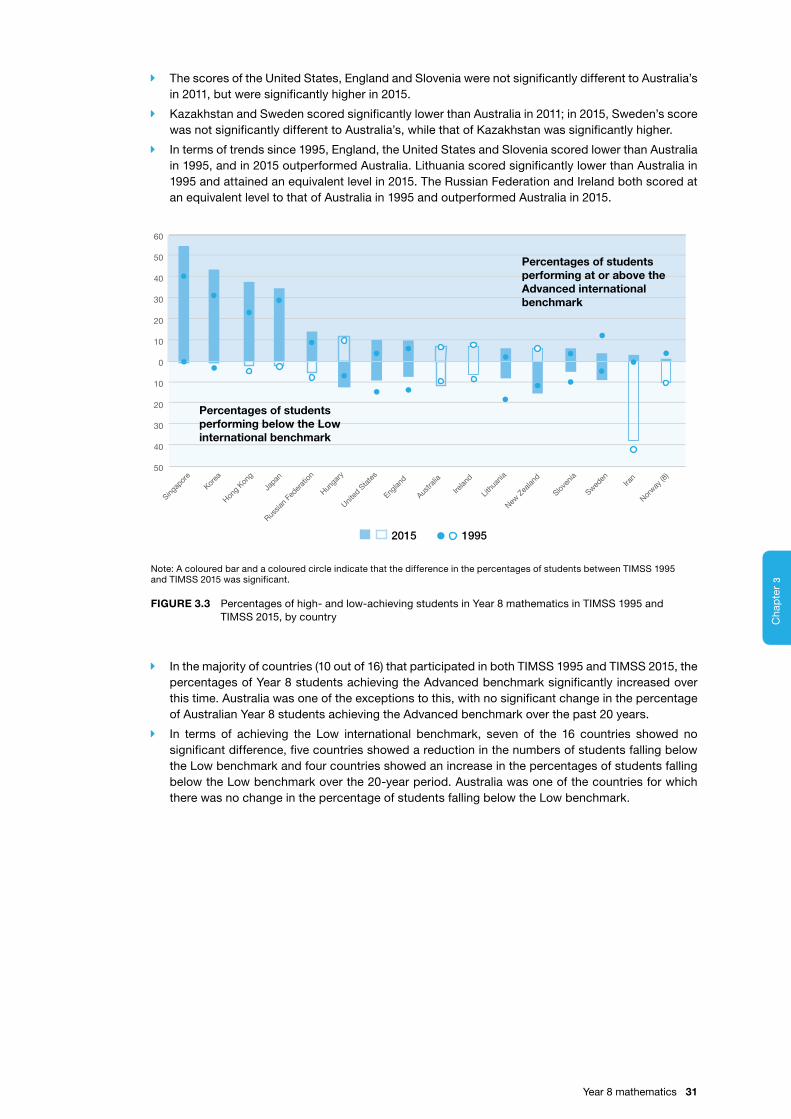
3C
hap
ter
3C
hapter
Î The scores of the United States, England and Slovenia were not significantly different to Australia’s in 2011, but were significantly higher in 2015.
Î Kazakhstan and Sweden scored significantly lower than Australia in 2011; in 2015, Sweden’s score was not significantly different to Australia’s, while that of Kazakhstan was significantly higher.
Î In terms of trends since 1995, England, the United States and Slovenia scored lower than Australia in 1995, and in 2015 outperformed Australia. Lithuania scored significantly lower than Australia in 1995 and attained an equivalent level in 2015. The Russian Federation and Ireland both scored at an equivalent level to that of Australia in 1995 and outperformed Australia in 2015.
20
20
50
40
30
10
0
10
30
40
50
60
Percentages of students performing below the Low international benchmark
Percentages of students performing at or above theAdvanced international benchmark
Singap
ore
Korea
Hong
Kong
Japan
Russia
n Fe
derat
ion
Hunga
ry
United
Sta
tes
Sloven
ia
Sweden
Norway
(8)
Iran
Englan
d
Austra
lia
Irelan
d
Lithu
ania
New Z
ealan
d
2015 1995
Note: A coloured bar and a coloured circle indicate that the difference in the percentages of students between TIMSS 1995 and TIMSS 2015 was significant.
FIGURE 3.3 Percentages of high- and low-achieving students in Year 8 mathematics in TIMSS 1995 and TIMSS 2015, by country
Î In the majority of countries (10 out of 16) that participated in both TIMSS 1995 and TIMSS 2015, the percentages of Year 8 students achieving the Advanced benchmark significantly increased over this time. Australia was one of the exceptions to this, with no significant change in the percentage of Australian Year 8 students achieving the Advanced benchmark over the past 20 years.
Î In terms of achieving the Low international benchmark, seven of the 16 countries showed no significant difference, five countries showed a reduction in the numbers of students falling below the Low benchmark and four countries showed an increase in the percentages of students falling below the Low benchmark over the 20-year period. Australia was one of the countries for which there was no change in the percentage of students falling below the Low benchmark.
Year 8 mathematics 31
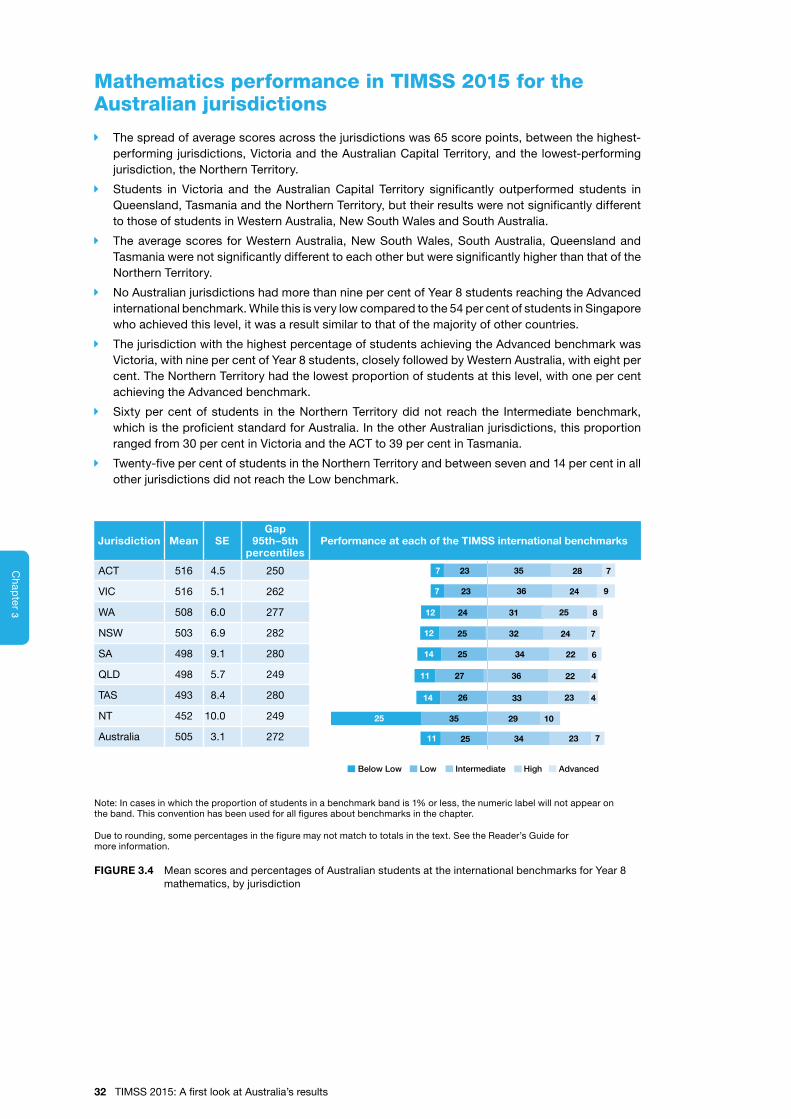
3C
hap
ter
3C
hapter
Mathematics performance in TIMSS 2015 for the Australian jurisdictions
Î The spread of average scores across the jurisdictions was 65 score points, between the highest-performing jurisdictions, Victoria and the Australian Capital Territory, and the lowest-performing jurisdiction, the Northern Territory.
Î Students in Victoria and the Australian Capital Territory significantly outperformed students in Queensland, Tasmania and the Northern Territory, but their results were not significantly different to those of students in Western Australia, New South Wales and South Australia.
Î The average scores for Western Australia, New South Wales, South Australia, Queensland and Tasmania were not significantly different to each other but were significantly higher than that of the Northern Territory.
Î No Australian jurisdictions had more than nine per cent of Year 8 students reaching the Advanced international benchmark. While this is very low compared to the 54 per cent of students in Singapore who achieved this level, it was a result similar to that of the majority of other countries.
Î The jurisdiction with the highest percentage of students achieving the Advanced benchmark was Victoria, with nine per cent of Year 8 students, closely followed by Western Australia, with eight per cent. The Northern Territory had the lowest proportion of students at this level, with one per cent achieving the Advanced benchmark.
Î Sixty per cent of students in the Northern Territory did not reach the Intermediate benchmark, which is the proficient standard for Australia. In the other Australian jurisdictions, this proportion ranged from 30 per cent in Victoria and the ACT to 39 per cent in Tasmania.
Î Twenty-five per cent of students in the Northern Territory and between seven and 14 per cent in all other jurisdictions did not reach the Low benchmark.
24 7322512
12 24 25 831
22 4362711
2810
34 23
35 10
Below Low Low Intermediate High Advanced
9
25
14 23 426
11 25
29
33
22342514
36 9237
28 723 357
6
7
24
Jurisdiction Mean SEGap
95th–5th percentiles
Performance at each of the TIMSS international benchmarks
ACT 516 4.5 250
VIC 516 5.1 262
WA 508 6.0 277
NSW 503 6.9 282
SA 498 9.1 280
QLD 498 5.7 249
TAS 493 8.4 280
NT 452 10.0 249
Australia 505 3.1 272
Note: In cases in which the proportion of students in a benchmark band is 1% or less, the numeric label will not appear on the band. This convention has been used for all figures about benchmarks in the chapter.
Due to rounding, some percentages in the figure may not match to totals in the text. See the Reader’s Guide for more information.
FIGURE 3.4 Mean scores and percentages of Australian students at the international benchmarks for Year 8 mathematics, by jurisdiction
32 TIMSS 2015: A first look at Australia’s results
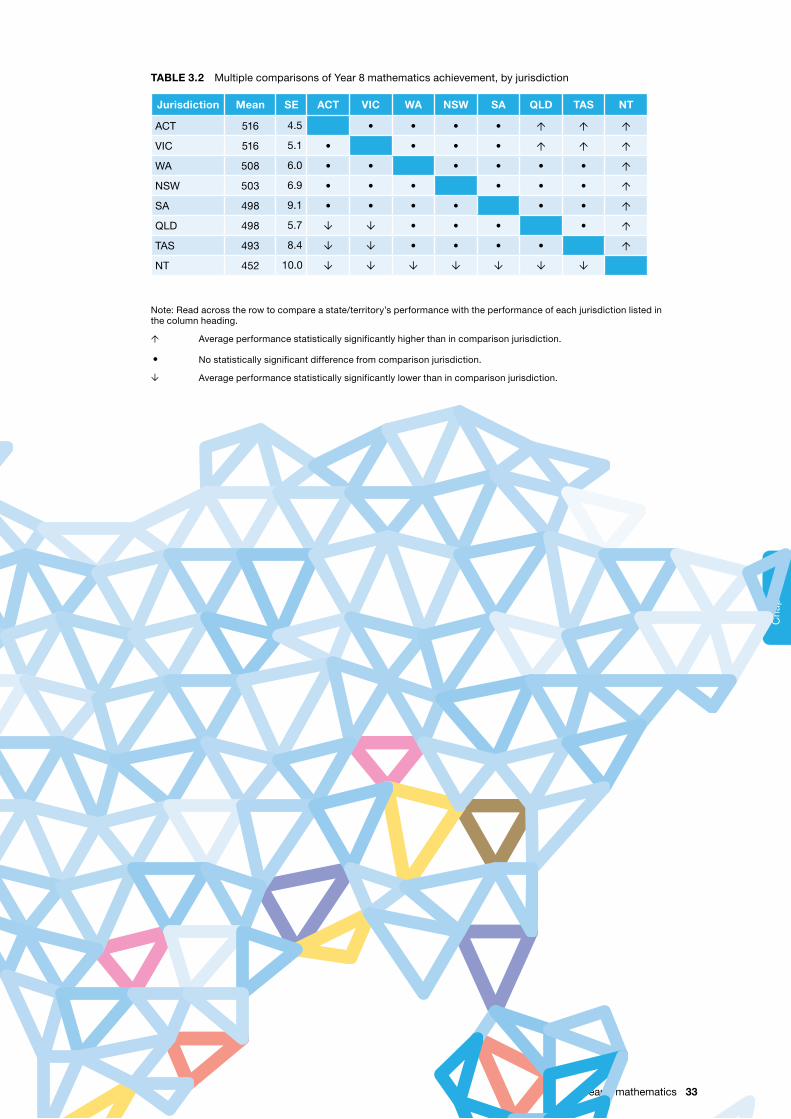
3C
hap
ter
3C
hapter
TABLE 3.2 Multiple comparisons of Year 8 mathematics achievement, by jurisdiction
Jurisdiction Mean SE ACT VIC WA NSW SA QLD TAS NT
ACT 516 4.5 • • • • Ó Ó Ó
VIC 516 5.1 • • • • Ó Ó Ó
WA 508 6.0 • • • • • • Ó
NSW 503 6.9 • • • • • • Ó
SA 498 9.1 • • • • • • Ó
QLD 498 5.7 Ô Ô • • • • Ó
TAS 493 8.4 Ô Ô • • • • Ó
NT 452 10.0 Ô Ô Ô Ô Ô Ô Ô
Note: Read across the row to compare a state/territory’s performance with the performance of each jurisdiction listed in the column heading.
Ó Average performance statistically significantly higher than in comparison jurisdiction.
• No statistically significant difference from comparison jurisdiction.
Ô Average performance statistically significantly lower than in comparison jurisdiction.
Year 8 mathematics 33
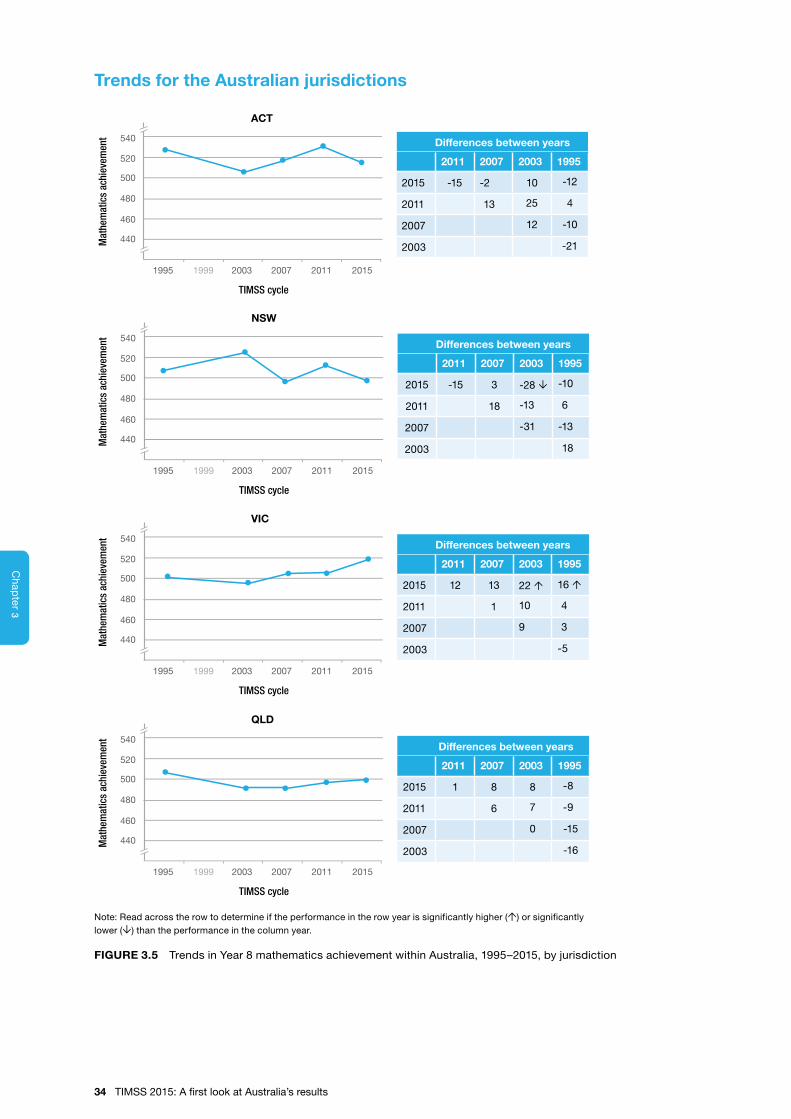
3C
hap
ter
3C
hapter
Trends for the Australian jurisdictions
1995 2003 2007 2011 2015
TIMSS cycle
1999
ACT
Mat
hem
atic
s ac
hiev
emen
t
440
460
480
500
520
540 Differences between years
2011 2007 2003 1995
2015 -15 -2 10 -12
2011 13 25 4
2007 12 -10
2003 -21
1995 2003 2007 2011 2015
TIMSS cycle
1999
NSW
Mat
hem
atic
s ac
hiev
emen
t
440
460
480
500
520
540Differences between years
2011 2007 2003 1995
2015 -15 3 -28 Ô -10
2011 18 -13 6
2007 -31 -13
2003 18
1995 2003 2007 2011 2015
TIMSS cycle
1999
VIC
Mat
hem
atic
s ac
hiev
emen
t
440
460
480
500
520
540Differences between years
2011 2007 2003 1995
2015 12 13 22 Ó 16 Ó
2011 1 10 4
2007 9 3
2003 -5
1995 2003 2007 2011 2015
TIMSS cycle
1999
QLD
Mat
hem
atic
s ac
hiev
emen
t
440
460
480
500
520
540 Differences between years
2011 2007 2003 1995
2015 1 8 8 -8
2011 6 7 -9
2007 0 -15
2003 -16
Note: Read across the row to determine if the performance in the row year is significantly higher (Ó) or significantly lower (Ô) than the performance in the column year.
FIGURE 3.5 Trends in Year 8 mathematics achievement within Australia, 1995–2015, by jurisdiction
34 TIMSS 2015: A first look at Australia’s results

3C
hap
ter
3C
hapter
1995 2003 2007 2011 2015
TIMSS cycle
1999
SA
Mat
hem
atic
s ac
hiev
emen
t
440
460
480
500
520
540Differences between years
2011 2007 2003 1995
2015 10 8 -3 -14
2011 -2 -13 -24 Ô
2007 -11 -22 Ô
2003 -11
1995 2003 2007 2011 2015
TIMSS cycle
1999
WA
Mat
hem
atic
s ac
hiev
emen
t
440
460
480
500
520
540Differences between years
2011 2007 2003 1995
2015 14 23 Ó 20 Ó -19 Ô
2011 8 6 -34 Ô
2007 -2 -42 Ô
2003 -40 Ô
1995 2003 2007 2011 2015
TIMSS cycle
1999
TAS
Mat
hem
atic
s ac
hiev
emen
t
440
460
480
500
520
540Differences between years
2011 2007 2003 1995
2015 18 8 16 -3
2011 -11 -2 -21
2007 9 -11
2003 -20
1995 2003 2007 2011 2015
TIMSS cycle
1999
NT
Mat
hem
atic
s ac
hiev
emen
t
440
460
480
500
520
540Differences between years
2011 2007 2003 1995
2015 -10 -31 3 -18
2011 -22 13 -9
2007 34 13
2003 -21
Note: Read across the row to determine if the performance in the row year is significantly higher (Ó) or significantly lower (Ô) than the performance in the column year.
FIGURE 3.5 Trends in Year 8 mathematics achievement within Australia, 1995–2015, by jurisdiction (cont.)
Î None of the differences between TIMSS 2011 and TIMSS 2015 were significant.
Î The only significant differences from TIMSS 1995 were for Victoria (significantly higher than in 1995) and Western Australia (significantly lower than in 1995).
Year 8 mathematics 35
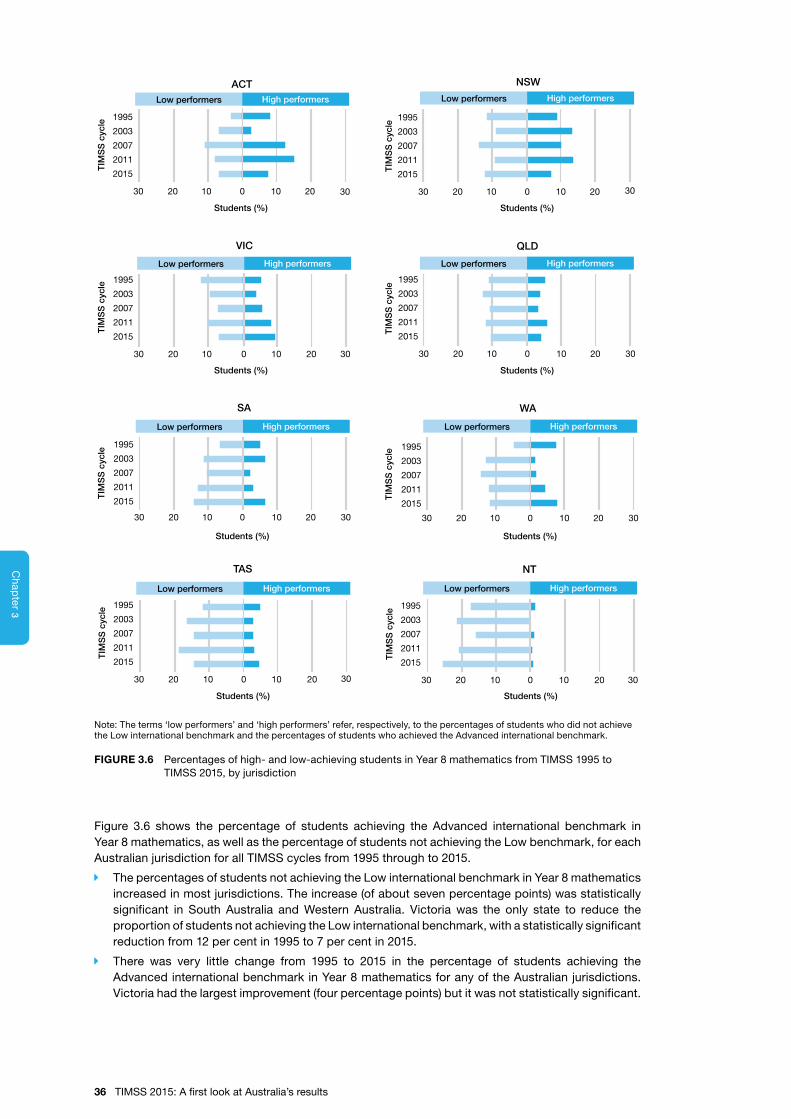
3C
hap
ter
3C
hapter
High performersLow performers
High performersLow performers High performersLow performers
High performersLow performers
High performersLow performers High performersLow performers
High performersLow performers High performersLow performers
TIM
SS
cyc
le
Students (%)
TIM
SS
cyc
le
Students (%)
0 10 20102030
1995
2003
2007
2011
2015
30
0 10 20102030
1995
2003
2007
2011
2015
30
VIC
NSW
QLD
SA WA
0 10 20102030
1995
2003
2007
2011
2015
30 0 10 20102030
1995
2003
2007
2011
2015
30
0 10 20102030
1995
2003
2007
2011
2015
30
0 10 20102030
1995
2003
2007
2011
2015
30 0 10 20102030
1995
2003
2007
2011
2015
30
TAS NT
0 10 20102030
1995
2003
2007
2011
2015
30
TIM
SS
cyc
le
Students (%)
TIM
SS
cyc
le
Students (%)
TIM
SS
cyc
le
Students (%)
TIM
SS
cyc
le
Students (%)
TIM
SS
cyc
le
Students (%)
TIM
SS
cyc
le
Students (%)
ACT
Note: The terms ‘low performers’ and ‘high performers’ refer, respectively, to the percentages of students who did not achieve the Low international benchmark and the percentages of students who achieved the Advanced international benchmark.
FIGURE 3.6 Percentages of high- and low-achieving students in Year 8 mathematics from TIMSS 1995 to TIMSS 2015, by jurisdiction
Figure 3.6 shows the percentage of students achieving the Advanced international benchmark in Year 8 mathematics, as well as the percentage of students not achieving the Low benchmark, for each Australian jurisdiction for all TIMSS cycles from 1995 through to 2015.
Î The percentages of students not achieving the Low international benchmark in Year 8 mathematics increased in most jurisdictions. The increase (of about seven percentage points) was statistically significant in South Australia and Western Australia. Victoria was the only state to reduce the proportion of students not achieving the Low international benchmark, with a statistically significant reduction from 12 per cent in 1995 to 7 per cent in 2015.
Î There was very little change from 1995 to 2015 in the percentage of students achieving the Advanced international benchmark in Year 8 mathematics for any of the Australian jurisdictions. Victoria had the largest improvement (four percentage points) but it was not statistically significant.
36 TIMSS 2015: A first look at Australia’s results
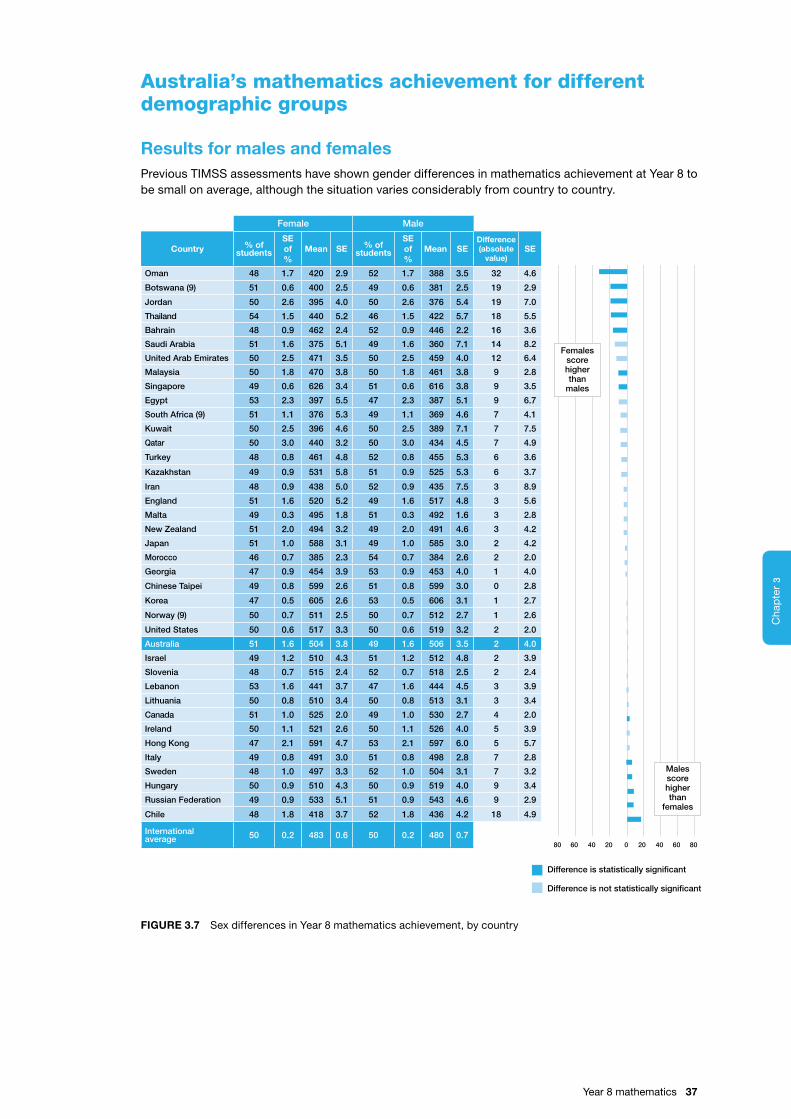
3C
hap
ter
3C
hapter
Australia’s mathematics achievement for different demographic groups
Results for males and femalesPrevious TIMSS assessments have shown gender differences in mathematics achievement at Year 8 to be small on average, although the situation varies considerably from country to country.
Female Male
Country % ofstudents
SEof %
Mean SE % ofstudents
SEof %
Mean SEDifference (absolute
value)SE
Oman 48 1.7 420 2.9 52 1.7 388 3.5 32 4.6
Botswana (9) 51 0.6 400 2.5 49 0.6 381 2.5 19 2.9
Jordan 50 2.6 395 4.0 50 2.6 376 5.4 19 7.0
Thailand 54 1.5 440 5.2 46 1.5 422 5.7 18 5.5
Bahrain 48 0.9 462 2.4 52 0.9 446 2.2 16 3.6
Saudi Arabia 51 1.6 375 5.1 49 1.6 360 7.1 14 8.2
United Arab Emirates 50 2.5 471 3.5 50 2.5 459 4.0 12 6.4
Malaysia 50 1.8 470 3.8 50 1.8 461 3.8 9 2.8
Singapore 49 0.6 626 3.4 51 0.6 616 3.8 9 3.5
Egypt 53 2.3 397 5.5 47 2.3 387 5.1 9 6.7
South Africa (9) 51 1.1 376 5.3 49 1.1 369 4.6 7 4.1
Kuwait 50 2.5 396 4.6 50 2.5 389 7.1 7 7.5
Qatar 50 3.0 440 3.2 50 3.0 434 4.5 7 4.9
Turkey 48 0.8 461 4.8 52 0.8 455 5.3 6 3.6
Kazakhstan 49 0.9 531 5.8 51 0.9 525 5.3 6 3.7
Iran 48 0.9 438 5.0 52 0.9 435 7.5 3 8.9
England 51 1.6 520 5.2 49 1.6 517 4.8 3 5.6
Malta 49 0.3 495 1.8 51 0.3 492 1.6 3 2.8
New Zealand 51 2.0 494 3.2 49 2.0 491 4.6 3 4.2
Japan 51 1.0 588 3.1 49 1.0 585 3.0 2 4.2
Morocco 46 0.7 385 2.3 54 0.7 384 2.6 2 2.0
Georgia 47 0.9 454 3.9 53 0.9 453 4.0 1 4.0
Chinese Taipei 49 0.8 599 2.6 51 0.8 599 3.0 0 2.8
Korea 47 0.5 605 2.6 53 0.5 606 3.1 1 2.7
Norway (9) 50 0.7 511 2.5 50 0.7 512 2.7 1 2.6
United States 50 0.6 517 3.3 50 0.6 519 3.2 2 2.0
Australia 51 1.6 504 3.8 49 1.6 506 3.5 2 4.0
Israel 49 1.2 510 4.3 51 1.2 512 4.8 2 3.9
Slovenia 48 0.7 515 2.4 52 0.7 518 2.5 2 2.4
Lebanon 53 1.6 441 3.7 47 1.6 444 4.5 3 3.9
Lithuania 50 0.8 510 3.4 50 0.8 513 3.1 3 3.4
Canada 51 1.0 525 2.0 49 1.0 530 2.7 4 2.0
Ireland 50 1.1 521 2.6 50 1.1 526 4.0 5 3.9
Hong Kong 47 2.1 591 4.7 53 2.1 597 6.0 5 5.7
Italy 49 0.8 491 3.0 51 0.8 498 2.8 7 2.8
Sweden 48 1.0 497 3.3 52 1.0 504 3.1 7 3.2
Hungary 50 0.9 510 4.3 50 0.9 519 4.0 9 3.4
Russian Federation 49 0.9 533 5.1 51 0.9 543 4.6 9 2.9
Chile 48 1.8 418 3.7 52 1.8 436 4.2 18 4.9
International average 50 0.2 483 0.6 50 0.2 480 0.7
0 20 40 60 8080 60 40 20
Femalesscorehigherthan
males
Malesscorehigherthan
females
Difference is statistically significant
Difference is not statistically significant
FIGURE 3.7 Sex differences in Year 8 mathematics achievement, by country
Year 8 mathematics 37
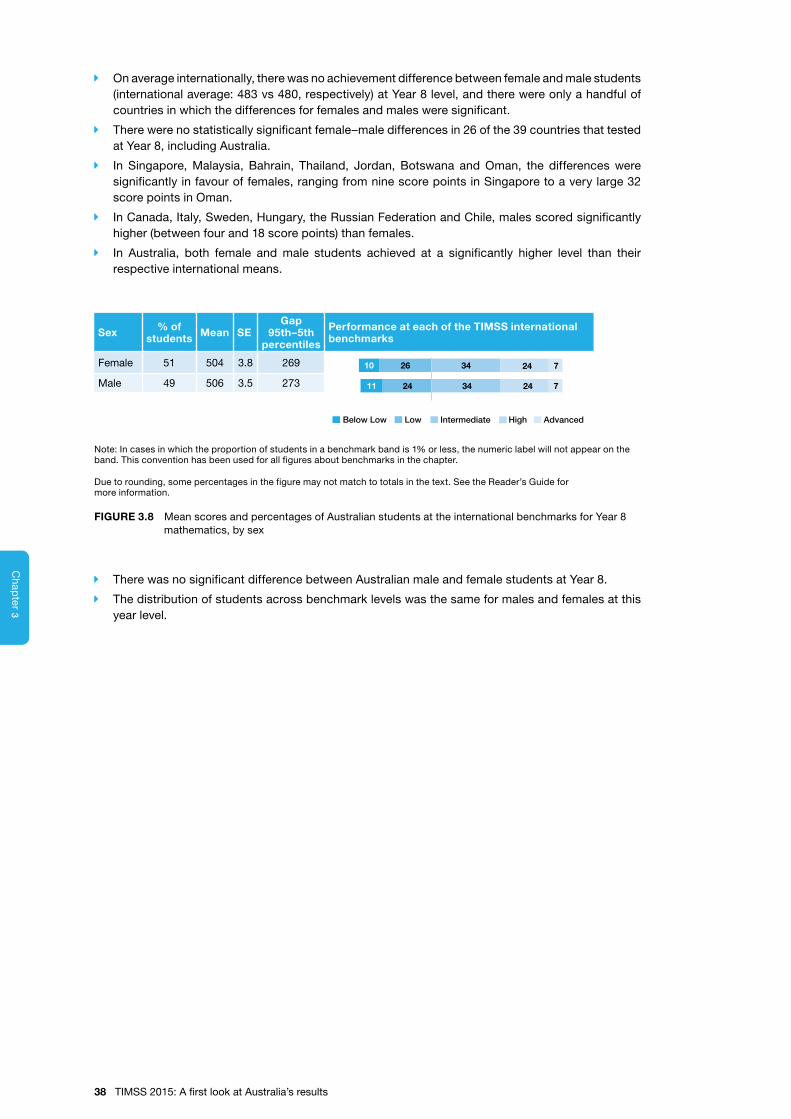
3C
hap
ter
3C
hapter
Î On average internationally, there was no achievement difference between female and male students (international average: 483 vs 480, respectively) at Year 8 level, and there were only a handful of countries in which the differences for females and males were significant.
Î There were no statistically significant female–male differences in 26 of the 39 countries that tested at Year 8, including Australia.
Î In Singapore, Malaysia, Bahrain, Thailand, Jordan, Botswana and Oman, the differences were significantly in favour of females, ranging from nine score points in Singapore to a very large 32 score points in Oman.
Î In Canada, Italy, Sweden, Hungary, the Russian Federation and Chile, males scored significantly higher (between four and 18 score points) than females.
Î In Australia, both female and male students achieved at a significantly higher level than their respective international means.
Sex % of students Mean SE
Gap 95th–5th
percentiles
Performance at each of the TIMSS international benchmarks
Female 51 504 3.8 269
Male 49 506 3.5 273 24 7342411
24 7342610
Below Low Low Intermediate High Advanced
Note: In cases in which the proportion of students in a benchmark band is 1% or less, the numeric label will not appear on the band. This convention has been used for all figures about benchmarks in the chapter.
Due to rounding, some percentages in the figure may not match to totals in the text. See the Reader’s Guide for more information.
FIGURE 3.8 Mean scores and percentages of Australian students at the international benchmarks for Year 8 mathematics, by sex
Î There was no significant difference between Australian male and female students at Year 8.
Î The distribution of students across benchmark levels was the same for males and females at this year level.
38 TIMSS 2015: A first look at Australia’s results
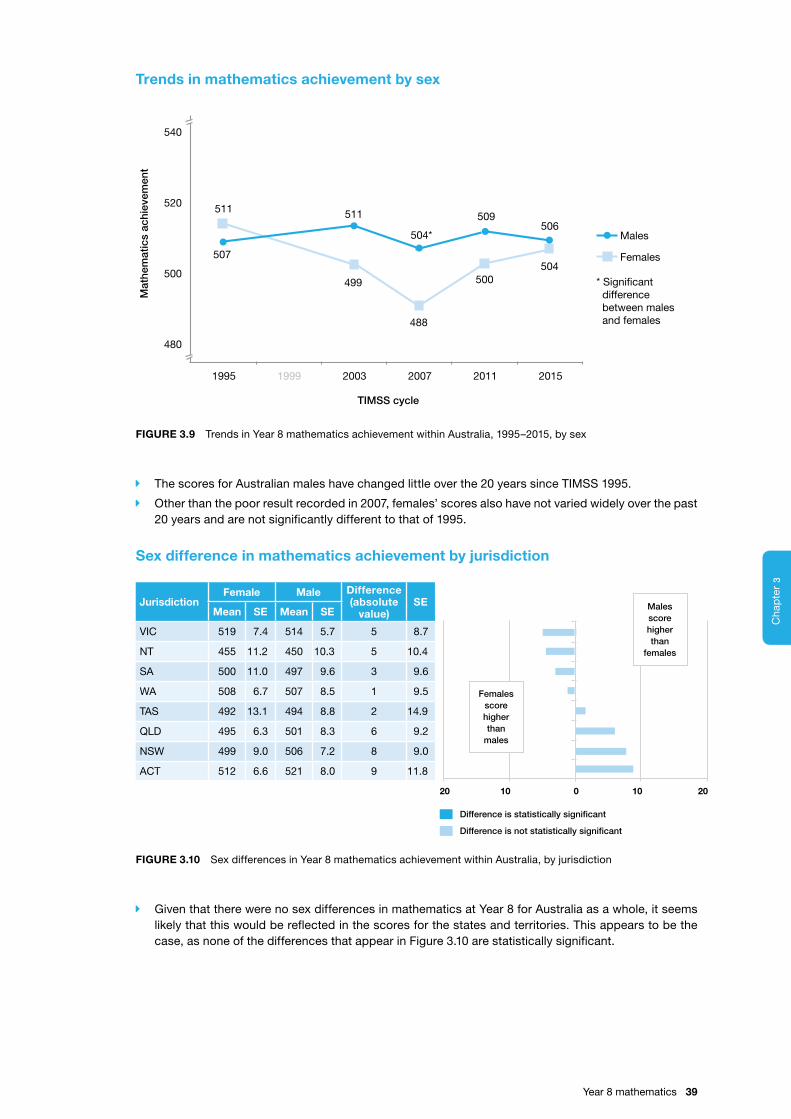
3C
hap
ter
3C
hapter
Trends in mathematics achievement by sex
511 511
504*
509506
507
499
488
500504
480
500
520
540
1995 1999 2003 2007 2011 2015
Males
Females
TIMSS cycle
* Signi�cant difference between males and females
Mat
hem
atic
s ac
hiev
emen
t
FIGURE 3.9 Trends in Year 8 mathematics achievement within Australia, 1995–2015, by sex
Î The scores for Australian males have changed little over the 20 years since TIMSS 1995.
Î Other than the poor result recorded in 2007, females’ scores also have not varied widely over the past 20 years and are not significantly different to that of 1995.
Sex difference in mathematics achievement by jurisdiction
JurisdictionFemale Male Difference
(absolute value)
SEMean SE Mean SE
VIC 519 7.4 514 5.7 5 8.7
NT 455 11.2 450 10.3 5 10.4
SA 500 11.0 497 9.6 3 9.6
WA 508 6.7 507 8.5 1 9.5
TAS 492 13.1 494 8.8 2 14.9
QLD 495 6.3 501 8.3 6 9.2
NSW 499 9.0 506 7.2 8 9.0
ACT 512 6.6 521 8.0 9 11.8
20 10 20100
Femalesscorehigherthan
males
Malesscorehigherthan
females
Difference is statistically significant
Difference is not statistically significant
FIGURE 3.10 Sex differences in Year 8 mathematics achievement within Australia, by jurisdiction
Î Given that there were no sex differences in mathematics at Year 8 for Australia as a whole, it seems likely that this would be reflected in the scores for the states and territories. This appears to be the case, as none of the differences that appear in Figure 3.10 are statistically significant.
Year 8 mathematics 39
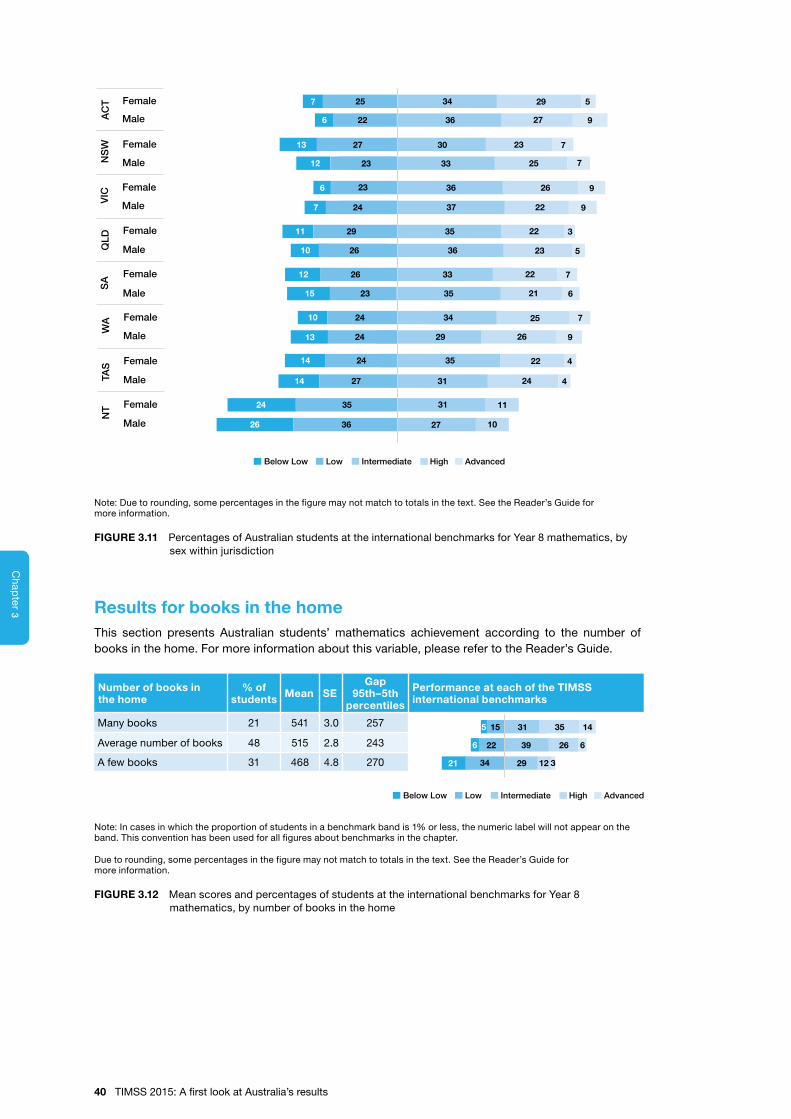
3C
hap
ter
3C
hapter
29 525 34
27 936226
23 7302713
25 7332312
26 936236
22 937247
22 3352911
23 5362610
22 7332612
21 6352315
25 7342410
26 9292413
22 4352414
24 4312714
31 113524
27 103626
7Female
MaleAC
T
Female
MaleNS
W
Female
MaleVIC
Female
MaleQLD
Female
Male
SA
Female
MaleWA
Female
MaleTAS
Female
Male
NT
Below Low Low Intermediate High Advanced
Note: Due to rounding, some percentages in the figure may not match to totals in the text. See the Reader’s Guide for more information.
FIGURE 3.11 Percentages of Australian students at the international benchmarks for Year 8 mathematics, by sex within jurisdiction
Results for books in the homeThis section presents Australian students’ mathematics achievement according to the number of books in the home. For more information about this variable, please refer to the Reader’s Guide.
62639226
35 1431155
312293421
Below Low Low Intermediate High Advanced
Number of books in the home
% of students Mean SE
Gap 95th–5th
percentiles
Performance at each of the TIMSS international benchmarks
Many books 21 541 3.0 257
Average number of books 48 515 2.8 243
A few books 31 468 4.8 270
Note: In cases in which the proportion of students in a benchmark band is 1% or less, the numeric label will not appear on the band. This convention has been used for all figures about benchmarks in the chapter.
Due to rounding, some percentages in the figure may not match to totals in the text. See the Reader’s Guide for more information.
FIGURE 3.12 Mean scores and percentages of students at the international benchmarks for Year 8 mathematics, by number of books in the home
40 TIMSS 2015: A first look at Australia’s results
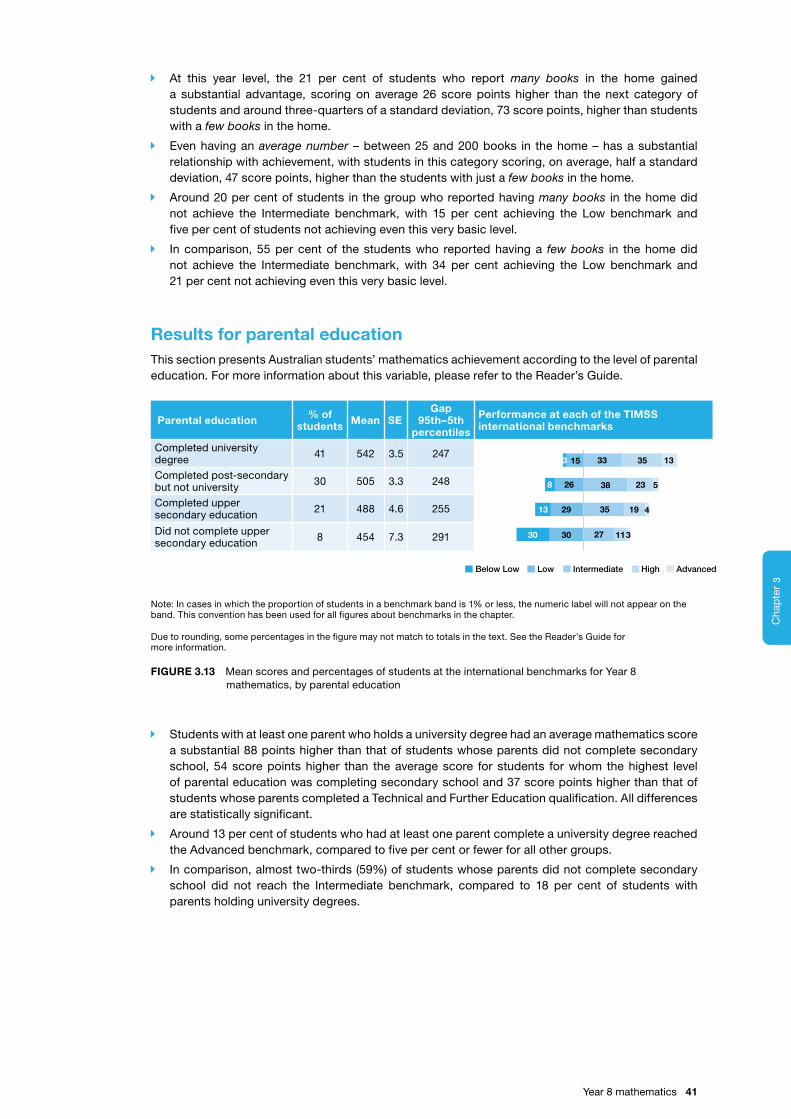
3C
hap
ter
3C
hapter
Î At this year level, the 21 per cent of students who report many books in the home gained a substantial advantage, scoring on average 26 score points higher than the next category of students and around three-quarters of a standard deviation, 73 score points, higher than students with a few books in the home.
Î Even having an average number – between 25 and 200 books in the home – has a substantial relationship with achievement, with students in this category scoring, on average, half a standard deviation, 47 score points, higher than the students with just a few books in the home.
Î Around 20 per cent of students in the group who reported having many books in the home did not achieve the Intermediate benchmark, with 15 per cent achieving the Low benchmark and five per cent of students not achieving even this very basic level.
Î In comparison, 55 per cent of the students who reported having a few books in the home did not achieve the Intermediate benchmark, with 34 per cent achieving the Low benchmark and 21 per cent not achieving even this very basic level.
Results for parental educationThis section presents Australian students’ mathematics achievement according to the level of parental education. For more information about this variable, please refer to the Reader’s Guide.
Parental education % of students Mean SE
Gap 95th–5th
percentiles
Performance at each of the TIMSS international benchmarks
Completed university degree 41 542 3.5 247
Completed post-secondary but not university 30 505 3.3 248
Completed upper secondary education 21 488 4.6 255
Did not complete upper secondary education 8 454 7.3 291 3030 11
29 35 19 413
Below Low Low Intermediate High Advanced
26 38 23 58
3315 35 133
27 3
Note: In cases in which the proportion of students in a benchmark band is 1% or less, the numeric label will not appear on the band. This convention has been used for all figures about benchmarks in the chapter.
Due to rounding, some percentages in the figure may not match to totals in the text. See the Reader’s Guide for more information.
FIGURE 3.13 Mean scores and percentages of students at the international benchmarks for Year 8 mathematics, by parental education
Î Students with at least one parent who holds a university degree had an average mathematics score a substantial 88 points higher than that of students whose parents did not complete secondary school, 54 score points higher than the average score for students for whom the highest level of parental education was completing secondary school and 37 score points higher than that of students whose parents completed a Technical and Further Education qualification. All differences are statistically significant.
Î Around 13 per cent of students who had at least one parent complete a university degree reached the Advanced benchmark, compared to five per cent or fewer for all other groups.
Î In comparison, almost two-thirds (59%) of students whose parents did not complete secondary school did not reach the Intermediate benchmark, compared to 18 per cent of students with parents holding university degrees.
Year 8 mathematics 41
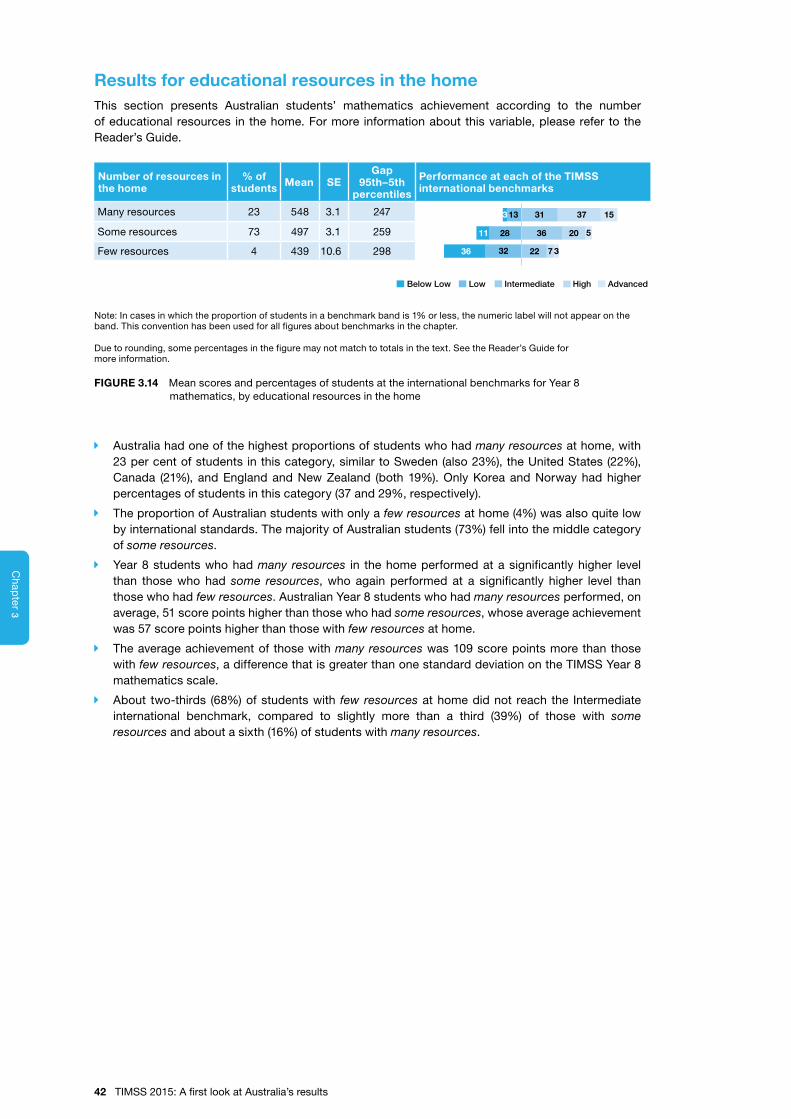
3C
hap
ter
3C
hapter
Results for educational resources in the homeThis section presents Australian students’ mathematics achievement according to the number of educational resources in the home. For more information about this variable, please refer to the Reader’s Guide.
Number of resources in the home
% of students Mean SE
Gap 95th–5th
percentiles
Performance at each of the TIMSS international benchmarks
Many resources 23 548 3.1 247
Some resources 73 497 3.1 259
Few resources 4 439 10.6 298
20362811
37 1531133
37223236
Below Low Low Intermediate High Advanced
5
Note: In cases in which the proportion of students in a benchmark band is 1% or less, the numeric label will not appear on the band. This convention has been used for all figures about benchmarks in the chapter.
Due to rounding, some percentages in the figure may not match to totals in the text. See the Reader’s Guide for more information.
FIGURE 3.14 Mean scores and percentages of students at the international benchmarks for Year 8 mathematics, by educational resources in the home
Î Australia had one of the highest proportions of students who had many resources at home, with 23 per cent of students in this category, similar to Sweden (also 23%), the United States (22%), Canada (21%), and England and New Zealand (both 19%). Only Korea and Norway had higher percentages of students in this category (37 and 29%, respectively).
Î The proportion of Australian students with only a few resources at home (4%) was also quite low by international standards. The majority of Australian students (73%) fell into the middle category of some resources.
Î Year 8 students who had many resources in the home performed at a significantly higher level than those who had some resources, who again performed at a significantly higher level than those who had few resources. Australian Year 8 students who had many resources performed, on average, 51 score points higher than those who had some resources, whose average achievement was 57 score points higher than those with few resources at home.
Î The average achievement of those with many resources was 109 score points more than those with few resources, a difference that is greater than one standard deviation on the TIMSS Year 8 mathematics scale.
Î About two-thirds (68%) of students with few resources at home did not reach the Intermediate international benchmark, compared to slightly more than a third (39%) of those with some resources and about a sixth (16%) of students with many resources.
42 TIMSS 2015: A first look at Australia’s results
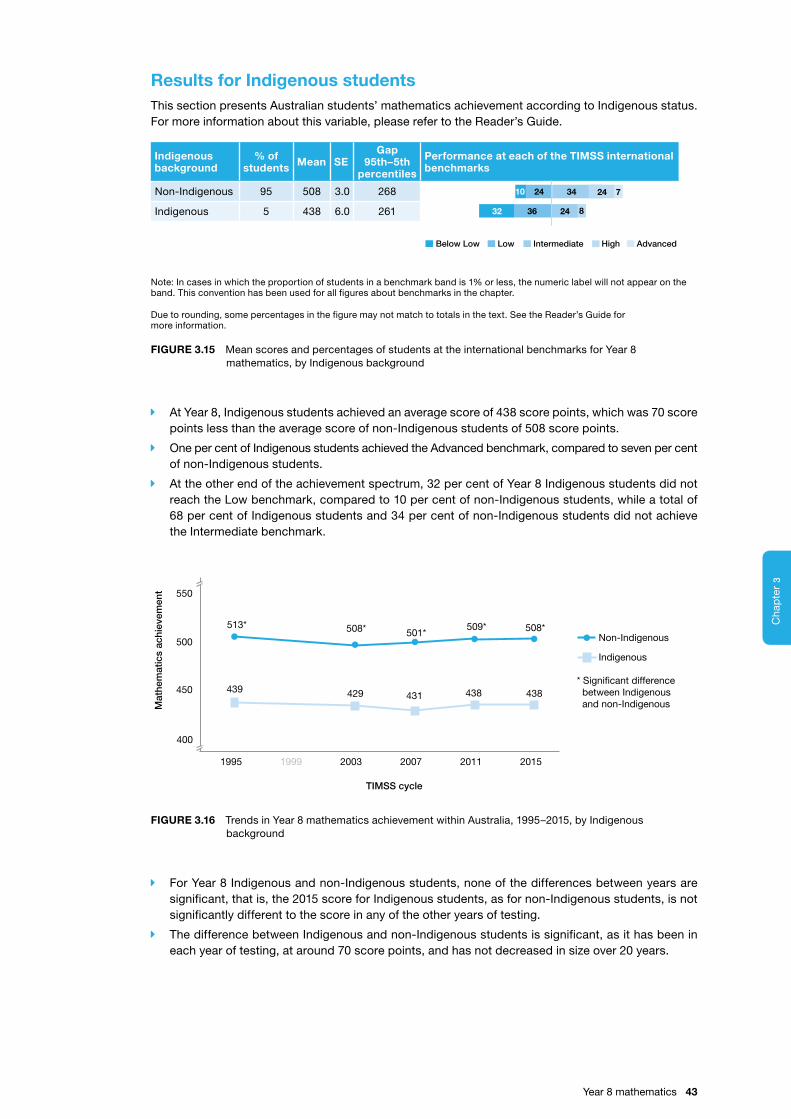
3C
hap
ter
3C
hapter
Results for Indigenous studentsThis section presents Australian students’ mathematics achievement according to Indigenous status. For more information about this variable, please refer to the Reader’s Guide.
Indigenous background
% of students Mean SE
Gap 95th–5th
percentiles
Performance at each of the TIMSS international benchmarks
Non-Indigenous 95 508 3.0 268
Indigenous 5 438 6.0 261 32 2436
3424 24 710
8
Below Low Low Intermediate High Advanced
Note: In cases in which the proportion of students in a benchmark band is 1% or less, the numeric label will not appear on the band. This convention has been used for all figures about benchmarks in the chapter.
Due to rounding, some percentages in the figure may not match to totals in the text. See the Reader’s Guide for more information.
FIGURE 3.15 Mean scores and percentages of students at the international benchmarks for Year 8 mathematics, by Indigenous background
Î At Year 8, Indigenous students achieved an average score of 438 score points, which was 70 score points less than the average score of non-Indigenous students of 508 score points.
Î One per cent of Indigenous students achieved the Advanced benchmark, compared to seven per cent of non-Indigenous students.
Î At the other end of the achievement spectrum, 32 per cent of Year 8 Indigenous students did not reach the Low benchmark, compared to 10 per cent of non-Indigenous students, while a total of 68 per cent of Indigenous students and 34 per cent of non-Indigenous students did not achieve the Intermediate benchmark.
Non-Indigenous
450
500
550
1995 1999 2003 2007 2011 2015
Mat
hem
atic
s ac
hiev
emen
t
Indigenous
TIMSS cycle
* Signi�cant difference between Indigenous and non-Indigenous
400
513* 508*
431
509* 508*
439 429
501*
438 438
FIGURE 3.16 Trends in Year 8 mathematics achievement within Australia, 1995–2015, by Indigenous background
Î For Year 8 Indigenous and non-Indigenous students, none of the differences between years are significant, that is, the 2015 score for Indigenous students, as for non-Indigenous students, is not significantly different to the score in any of the other years of testing.
Î The difference between Indigenous and non-Indigenous students is significant, as it has been in each year of testing, at around 70 score points, and has not decreased in size over 20 years.
Year 8 mathematics 43
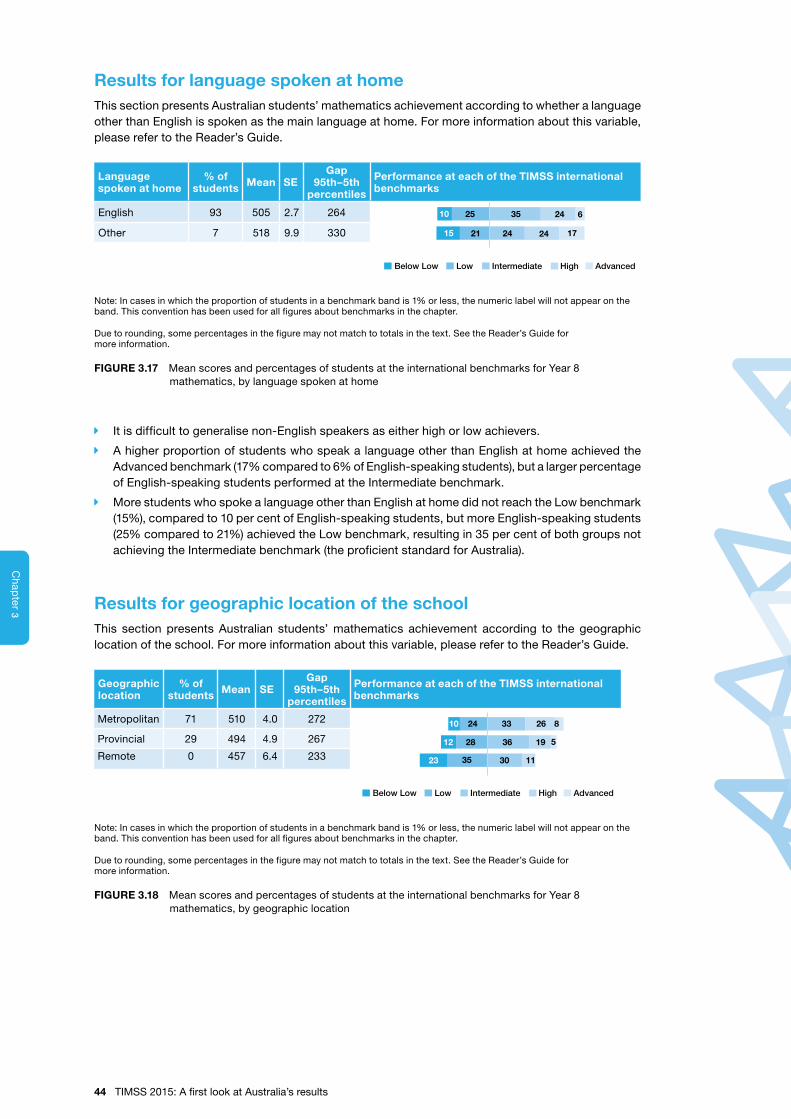
3C
hap
ter
3C
hapter
Results for language spoken at homeThis section presents Australian students’ mathematics achievement according to whether a language other than English is spoken as the main language at home. For more information about this variable, please refer to the Reader’s Guide.
Language spoken at home
% of students Mean SE
Gap 95th–5th
percentiles
Performance at each of the TIMSS international benchmarks
English 93 505 2.7 264
Other 7 518 9.9 330 15 2421
3525 24 610
24
Below Low Low Intermediate High Advanced
17
Note: In cases in which the proportion of students in a benchmark band is 1% or less, the numeric label will not appear on the band. This convention has been used for all figures about benchmarks in the chapter.
Due to rounding, some percentages in the figure may not match to totals in the text. See the Reader’s Guide for more information.
FIGURE 3.17 Mean scores and percentages of students at the international benchmarks for Year 8 mathematics, by language spoken at home
Î It is difficult to generalise non-English speakers as either high or low achievers.
Î A higher proportion of students who speak a language other than English at home achieved the Advanced benchmark (17% compared to 6% of English-speaking students), but a larger percentage of English-speaking students performed at the Intermediate benchmark.
Î More students who spoke a language other than English at home did not reach the Low benchmark (15%), compared to 10 per cent of English-speaking students, but more English-speaking students (25% compared to 21%) achieved the Low benchmark, resulting in 35 per cent of both groups not achieving the Intermediate benchmark (the proficient standard for Australia).
Results for geographic location of the schoolThis section presents Australian students’ mathematics achievement according to the geographic location of the school. For more information about this variable, please refer to the Reader’s Guide.
Geographic location
% of students Mean SE
Gap 95th–5th
percentiles
Performance at each of the TIMSS international benchmarks
Metropolitan 71 510 4.0 272
Provincial 29 494 4.9 267
Remote 0 457 6.4 23319362812
26 8332410
11303523
Below Low Low Intermediate High Advanced
5
Note: In cases in which the proportion of students in a benchmark band is 1% or less, the numeric label will not appear on the band. This convention has been used for all figures about benchmarks in the chapter.
Due to rounding, some percentages in the figure may not match to totals in the text. See the Reader’s Guide for more information.
FIGURE 3.18 Mean scores and percentages of students at the international benchmarks for Year 8 mathematics, by geographic location
44 TIMSS 2015: A first look at Australia’s results

3C
hap
ter
3C
hapter
Î The proportion of students attending remote schools make up less than one per cent of the Year 8 student sample; therefore, the level of uncertainty around statistics may be large. Around 71 per cent of students at this year level attend schools in metropolitan areas.
Î Students attending schools in metropolitan areas achieved, on average, 16 score points higher than students attending schools in provincial areas, and 52 score points, on average, higher than students in remote schools.
Î Students attending schools in provincial areas scored, on average, 36 score points higher than students attending schools in remote areas. All these differences are statistically significant.
Î More than one-third (34%) of students in metropolitan areas, around two-fifths (40%) of students in provincial areas and almost two-thirds (59%) of students in remote areas did not achieve the Intermediate benchmark.
Î Eight per cent of students in metropolitan areas achieved the advanced benchmark, compared to just five per cent of students in provincial areas and less than one per cent of students in remote areas.
Year 8 mathematics 45

4
Year 4 science 47
Chapter
Year 4 science
Australia’s Year 4 science results within the international contextFigure 4.1 (see page 48) shows the means, standard errors, gaps between the 5th and 95th percen-tiles and, to the right of the percentile gaps, the percentages of students in each country at the TIMSS benchmarks.
Î Singapore and Korea were the top-performing countries of TIMSS 2015 in Year 4 science, scoring well in excess of the High international benchmark. The scores for these countries were not significantly different to each other but were significantly higher than those of all other countries.
Î Australia’s average score of 524 score points was significantly higher than the scores for 17 other countries, such as New Zealand, Portugal and France, and places average achievement at the higher end of the Intermediate benchmark.
Î Australia’s average score was significantly lower than the average scores for 17 other countries, including the United States and England, as well as the participating East Asian countries Singapore, Korea, Japan, Hong Kong and Chinese Taipei.
Î This figure also shows that the range of achievement within countries is spread more widely than in mathematics at the same year level, with more than 400 score points separating highest and lowest in Kuwait (412), and almost 400 score points in Morocco (393), Saudi Arabia (379), Oman (389) and United Arab Emirates (394).
Î Australia’s gap between high and low achievers, of 251 score points, was mid-range, similar to that of Singapore (282 points). New Zealand also had a gap of 282 score points between high and low performers. As a comparison, the gap for students in the Netherlands, as in mathematics at Year 4, was the lowest, at 196 score points.
Î In the highest-scoring country, Singapore, 37 per cent of students achieved the Advanced international benchmark. Korea, Japan and the Russian Federation also recorded substantial proportions (29, 19 and 20%, respectively) of students who achieved the Advanced benchmark.
Î Korea showed exceptional performance, with 29 per cent of students achieving the Advanced benchmark but no students performing below the Low international benchmark.
Î Eight per cent of Australian students achieved the Advanced international benchmark. Seventy-five per cent of Australian students achieved at least the Intermediate international benchmark, which is the proficient standard for Australia. Of concern are the 25 per cent of Australian Year 4 students who achieved at or below the Low international benchmark (19% performed at the Low benchmark and a further 6% did not reach the Low benchmark).
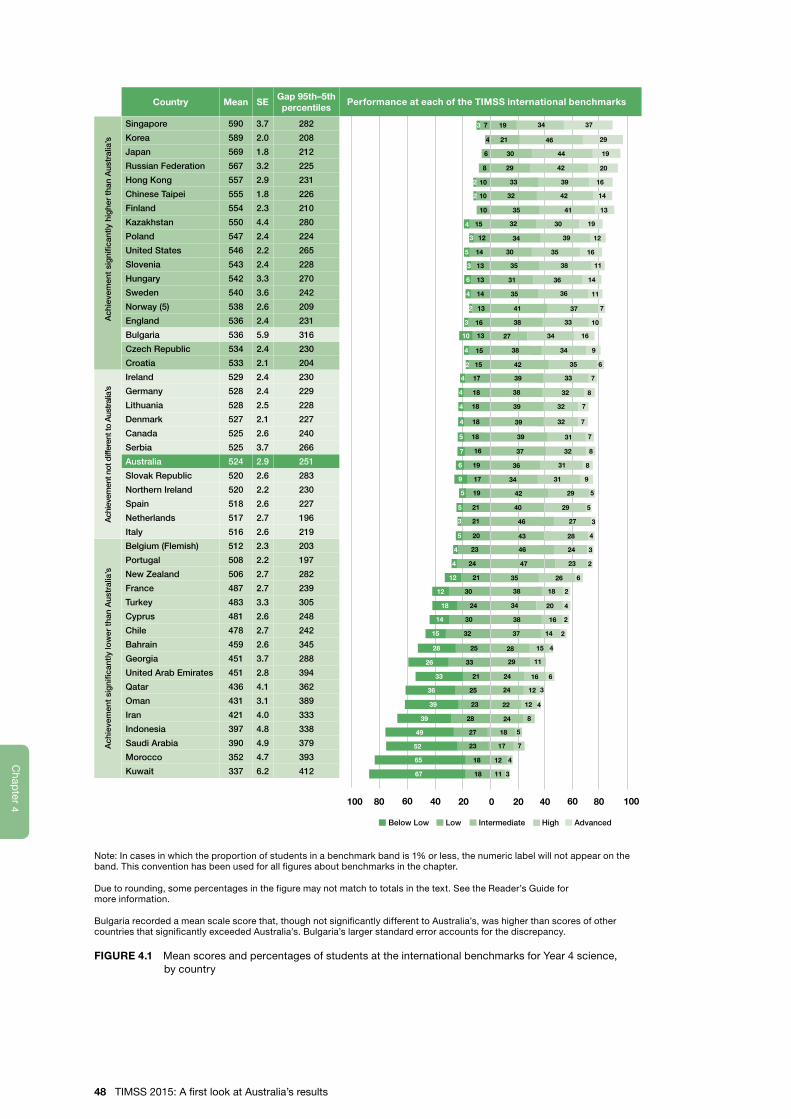
4C
hap
ter
4C
hapter 0 20 40 60 80 100100 80 60 40 20
7 19 34 37
4 21 46 29
6 30 44 19
8 29 42 20
10 33 39 16
10 32 42 14
10 35 41 13
15 32 30 19
12 34 39 12
14 30 35 16
3 13 35 38 11
6 13 31 36 14
4 14 35 36 11
4 13 41 37 7
3 16 38 33 10
10 13 27 34 16
15 38 34 9
15 42 35 6
4 17 39 33 7
4 18 39 32 7
4 18 39 32 7
5 18 39 31 7
4 18 38 32 8
7 16 37 32 8
6 19 36 31 8
9 17 34 31 9
5 19 42 29 5
5 21 40 29 5
3 21 46 27 3
5 20 43 28 4
4 23 46 24 3
24 47 23 2
12 21 35 26 6
12 30 38 18 2
18 24 34 20 4
14 30 38 16
15 32 37 14 2
28 25 28 15 4
26 33 29 11
633 21 24 16
36 25 24 12
39 23 22 12
39 28 24 8
49 27 18 5
52 23 17 7
65 18 12 4
67
2
2
318 11
2
3
4
4
4
2
5
3
3
2
4
Below Low Low Intermediate High Advanced
Country Mean SEGap 95th–5th percentiles
Ach
ieve
men
t si
gni
fican
tly h
ighe
r th
an A
ustr
alia
’s
Singapore 590 3.7 282
Korea 589 2.0 208
Japan 569 1.8 212
Russian Federation 567 3.2 225
Hong Kong 557 2.9 231
Chinese Taipei 555 1.8 226
Finland 554 2.3 210
Kazakhstan 550 4.4 280
Poland 547 2.4 224
United States 546 2.2 265
Slovenia 543 2.4 228
Hungary 542 3.3 270
Sweden 540 3.6 242
Norway (5) 538 2.6 209
England 536 2.4 231
Bulgaria 536 5.9 316
Czech Republic 534 2.4 230
Croatia 533 2.1 204
Ach
ieve
men
t not
diff
eren
t to
Aus
tral
ia’s
Ireland 529 2.4 230
Germany 528 2.4 229
Lithuania 528 2.5 228
Denmark 527 2.1 227
Canada 525 2.6 240
Serbia 525 3.7 266
Australia 524 2.9 251
Slovak Republic 520 2.6 283
Northern Ireland 520 2.2 230
Spain 518 2.6 227
Netherlands 517 2.7 196
Italy 516 2.6 219
Ach
ieve
men
t si
gni
fican
tly lo
wer
tha
n A
ustr
alia
’s
Belgium (Flemish) 512 2.3 203
Portugal 508 2.2 197
New Zealand 506 2.7 282
France 487 2.7 239
Turkey 483 3.3 305
Cyprus 481 2.6 248
Chile 478 2.7 242
Bahrain 459 2.6 345
Georgia 451 3.7 288
United Arab Emirates 451 2.8 394
Qatar 436 4.1 362
Oman 431 3.1 389
Iran 421 4.0 333
Indonesia 397 4.8 338
Saudi Arabia 390 4.9 379
Morocco 352 4.7 393
Kuwait 337 6.2 412
Performance at each of the TIMSS international benchmarks
Note: In cases in which the proportion of students in a benchmark band is 1% or less, the numeric label will not appear on the band. This convention has been used for all figures about benchmarks in the chapter.
Due to rounding, some percentages in the figure may not match to totals in the text. See the Reader’s Guide for more information.
Bulgaria recorded a mean scale score that, though not significantly different to Australia’s, was higher than scores of other countries that significantly exceeded Australia’s. Bulgaria’s larger standard error accounts for the discrepancy.
FIGURE 4.1 Mean scores and percentages of students at the international benchmarks for Year 4 science, by country
48 TIMSS 2015: A first look at Australia’s results
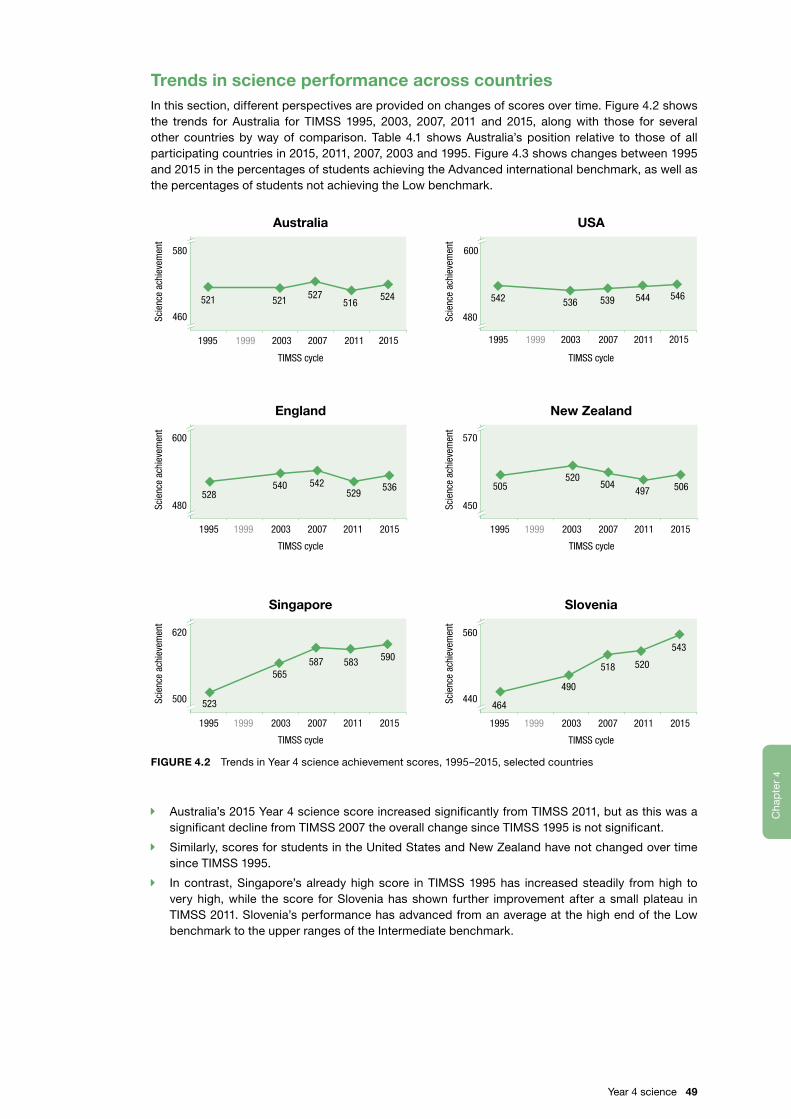
4C
hap
ter
4C
hapter
Trends in science performance across countriesIn this section, different perspectives are provided on changes of scores over time. Figure 4.2 shows the trends for Australia for TIMSS 1995, 2003, 2007, 2011 and 2015, along with those for several other countries by way of comparison. Table 4.1 shows Australia’s position relative to those of all participating countries in 2015, 2011, 2007, 2003 and 1995. Figure 4.3 shows changes between 1995 and 2015 in the percentages of students achieving the Advanced international benchmark, as well as the percentages of students not achieving the Low benchmark.
Scie
nce
achi
evem
ent
TIMSS cycle
Australia
Scie
nce
achi
evem
ent
TIMSS cycle
USA
Scie
nce
achi
evem
ent
TIMSS cycle
England
Scie
nce
achi
evem
ent
New Zealand
Scie
nce
achi
evem
ent
Singapore
Scie
nce
achi
evem
ent
Slovenia
TIMSS cycle
20112007200319991995 2015
460
20112007200319991995
480
600
20112007200319991995
480
600
20112007200319991995
450
570
500
620
440
560
2015 2015
2015
TIMSS cycle
20112007200319991995 2015
580
521 521 527516
528540 542
529
542 536 539 544
523
565587 583
505 504520
497
464
518
543
524 546
590
506
520
536
TIMSS cycle
20112007200319991995 2015
490
FIGURE 4.2 Trends in Year 4 science achievement scores, 1995–2015, selected countries
Î Australia’s 2015 Year 4 science score increased significantly from TIMSS 2011, but as this was a significant decline from TIMSS 2007 the overall change since TIMSS 1995 is not significant.
Î Similarly, scores for students in the United States and New Zealand have not changed over time since TIMSS 1995.
Î In contrast, Singapore’s already high score in TIMSS 1995 has increased steadily from high to very high, while the score for Slovenia has shown further improvement after a small plateau in TIMSS 2011. Slovenia’s performance has advanced from an average at the high end of the Low benchmark to the upper ranges of the Intermediate benchmark.
Year 4 science 49
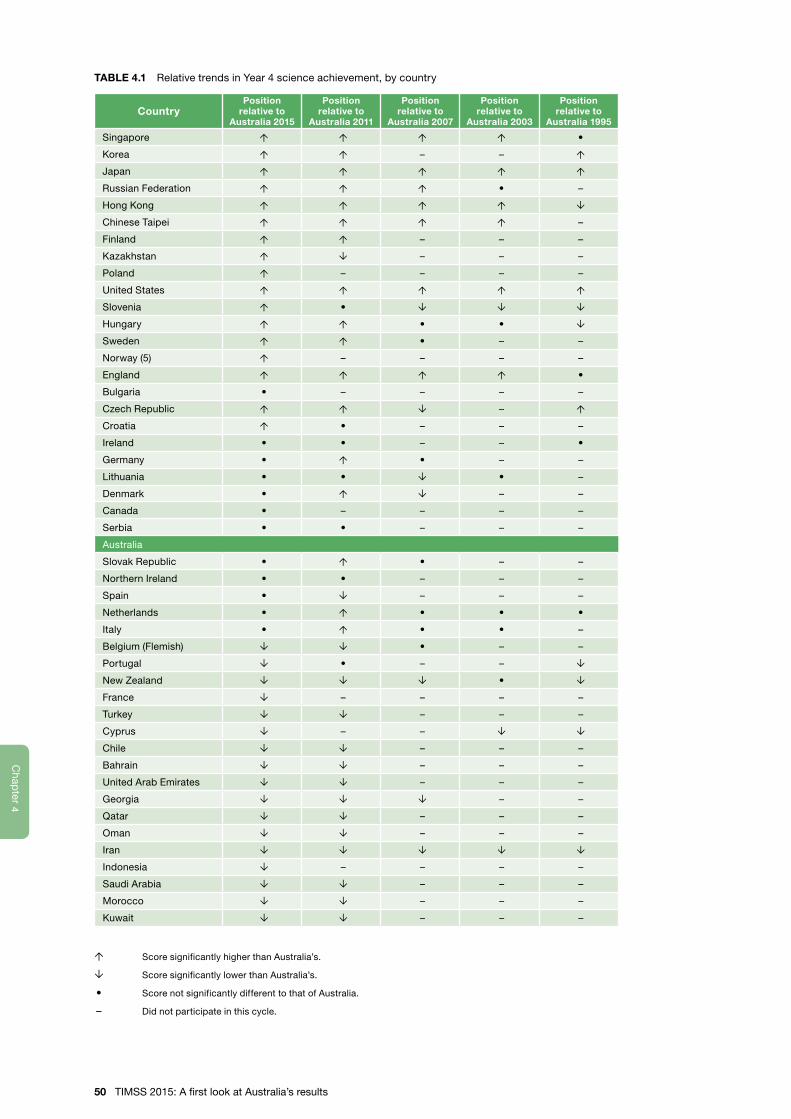
4C
hap
ter
4C
hapter
TABLE 4.1 Relative trends in Year 4 science achievement, by country
CountryPosition
relative to Australia 2015
Position relative to
Australia 2011
Position relative to
Australia 2007
Position relative to
Australia 2003
Position relative to
Australia 1995
Singapore Ó Ó Ó Ó •
Korea Ó Ó – – Ó
Japan Ó Ó Ó Ó Ó
Russian Federation Ó Ó Ó • –
Hong Kong Ó Ó Ó Ó Ô
Chinese Taipei Ó Ó Ó Ó –
Finland Ó Ó – – –
Kazakhstan Ó Ô – – –
Poland Ó – – – –
United States Ó Ó Ó Ó Ó
Slovenia Ó • Ô Ô Ô
Hungary Ó Ó • • Ô
Sweden Ó Ó • – –
Norway (5) Ó – – – –
England Ó Ó Ó Ó •
Bulgaria • – – – –
Czech Republic Ó Ó Ô – Ó
Croatia Ó • – – –
Ireland • • – – •
Germany • Ó • – –
Lithuania • • Ô • –
Denmark • Ó Ô – –
Canada • – – – –
Serbia • • – – –
Australia
Slovak Republic • Ó • – –
Northern Ireland • • – – –
Spain • Ô – – –
Netherlands • Ó • • •
Italy • Ó • • –
Belgium (Flemish) Ô Ô • – –
Portugal Ô • – – Ô
New Zealand Ô Ô Ô • Ô
France Ô – – – –
Turkey Ô Ô – – –
Cyprus Ô – – Ô Ô
Chile Ô Ô – – –
Bahrain Ô Ô – – –
United Arab Emirates Ô Ô – – –
Georgia Ô Ô Ô – –
Qatar Ô Ô – – –
Oman Ô Ô – – –
Iran Ô Ô Ô Ô Ô
Indonesia Ô – – – –
Saudi Arabia Ô Ô – – –
Morocco Ô Ô – – –
Kuwait Ô Ô – – –
Ó Score significantly higher than Australia’s.
Ô Score significantly lower than Australia’s.
• Score not significantly different to that of Australia.
– Did not participate in this cycle.
50 TIMSS 2015: A first look at Australia’s results
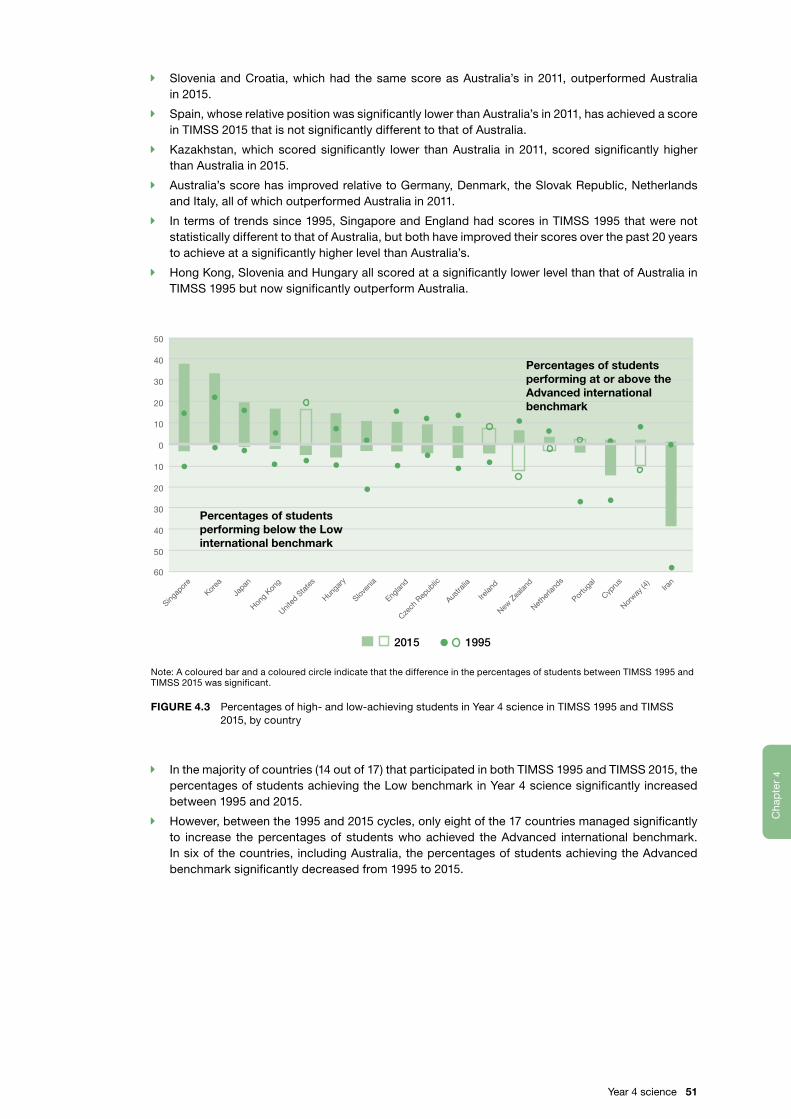
4C
hap
ter
4C
hapter
Î Slovenia and Croatia, which had the same score as Australia’s in 2011, outperformed Australia in 2015.
Î Spain, whose relative position was significantly lower than Australia’s in 2011, has achieved a score in TIMSS 2015 that is not significantly different to that of Australia.
Î Kazakhstan, which scored significantly lower than Australia in 2011, scored significantly higher than Australia in 2015.
Î Australia’s score has improved relative to Germany, Denmark, the Slovak Republic, Netherlands and Italy, all of which outperformed Australia in 2011.
Î In terms of trends since 1995, Singapore and England had scores in TIMSS 1995 that were not statistically different to that of Australia, but both have improved their scores over the past 20 years to achieve at a significantly higher level than Australia’s.
Î Hong Kong, Slovenia and Hungary all scored at a significantly lower level than that of Australia in TIMSS 1995 but now significantly outperform Australia.
20
20
50
40
30
10
0
10
30
40
50
60
Percentages of students performing below the Low international benchmark
Percentages of students performing at or above theAdvanced international benchmark
Singap
ore
Korea
Japan
Hong
Kong
Hunga
ry
United
Sta
tes
Nethe
rland
s
Portu
gal
Norway
(4)
Iran
Englan
d
Austra
lia
Irelan
d
Czech
Rep
ublic
New Z
ealan
d
2015 1995
Cypru
s
Sloven
ia
Note: A coloured bar and a coloured circle indicate that the difference in the percentages of students between TIMSS 1995 and TIMSS 2015 was significant.
FIGURE 4.3 Percentages of high- and low-achieving students in Year 4 science in TIMSS 1995 and TIMSS 2015, by country
Î In the majority of countries (14 out of 17) that participated in both TIMSS 1995 and TIMSS 2015, the percentages of students achieving the Low benchmark in Year 4 science significantly increased between 1995 and 2015.
Î However, between the 1995 and 2015 cycles, only eight of the 17 countries managed significantly to increase the percentages of students who achieved the Advanced international benchmark. In six of the countries, including Australia, the percentages of students achieving the Advanced benchmark significantly decreased from 1995 to 2015.
Year 4 science 51
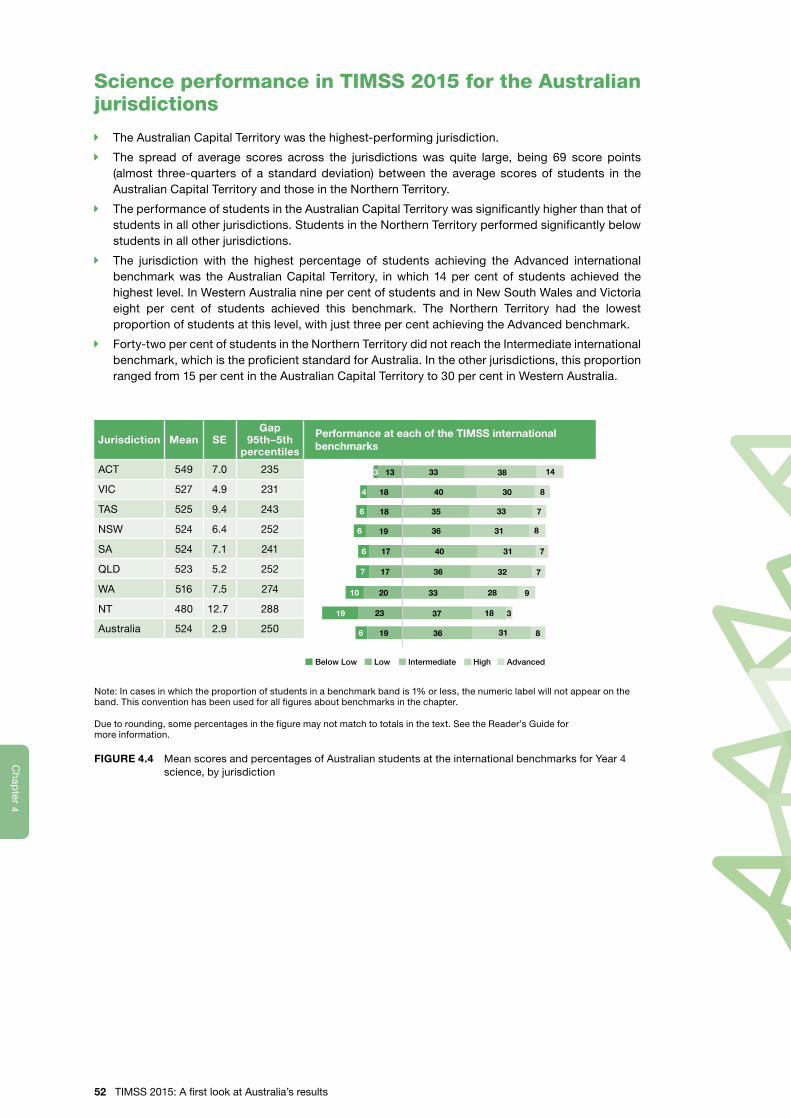
4C
hap
ter
4C
hapter
Science performance in TIMSS 2015 for the Australian jurisdictions
Î The Australian Capital Territory was the highest-performing jurisdiction.
Î The spread of average scores across the jurisdictions was quite large, being 69 score points (almost three-quarters of a standard deviation) between the average scores of students in the Australian Capital Territory and those in the Northern Territory.
Î The performance of students in the Australian Capital Territory was significantly higher than that of students in all other jurisdictions. Students in the Northern Territory performed significantly below students in all other jurisdictions.
Î The jurisdiction with the highest percentage of students achieving the Advanced international benchmark was the Australian Capital Territory, in which 14 per cent of students achieved the highest level. In Western Australia nine per cent of students and in New South Wales and Victoria eight per cent of students achieved this benchmark. The Northern Territory had the lowest proportion of students at this level, with just three per cent achieving the Advanced benchmark.
Î Forty-two per cent of students in the Northern Territory did not reach the Intermediate international benchmark, which is the proficient standard for Australia. In the other jurisdictions, this proportion ranged from 15 per cent in the Australian Capital Territory to 30 per cent in Western Australia.
2810
19 316
19
10 20 28 9
18 323
36
37
33
3236177
31 740176
31 836196
35 7186
30 818 404
7
33
38 1413 333
8
Below Low Low Intermediate High Advanced
Jurisdiction Mean SEGap
95th–5th percentiles
Performance at each of the TIMSS international benchmarks
ACT 549 7.0 235
VIC 527 4.9 231
TAS 525 9.4 243
NSW 524 6.4 252
SA 524 7.1 241
QLD 523 5.2 252
WA 516 7.5 274
NT 480 12.7 288
Australia 524 2.9 250
Note: In cases in which the proportion of students in a benchmark band is 1% or less, the numeric label will not appear on the band. This convention has been used for all figures about benchmarks in the chapter.
Due to rounding, some percentages in the figure may not match to totals in the text. See the Reader’s Guide for more information.
FIGURE 4.4 Mean scores and percentages of Australian students at the international benchmarks for Year 4 science, by jurisdiction
52 TIMSS 2015: A first look at Australia’s results
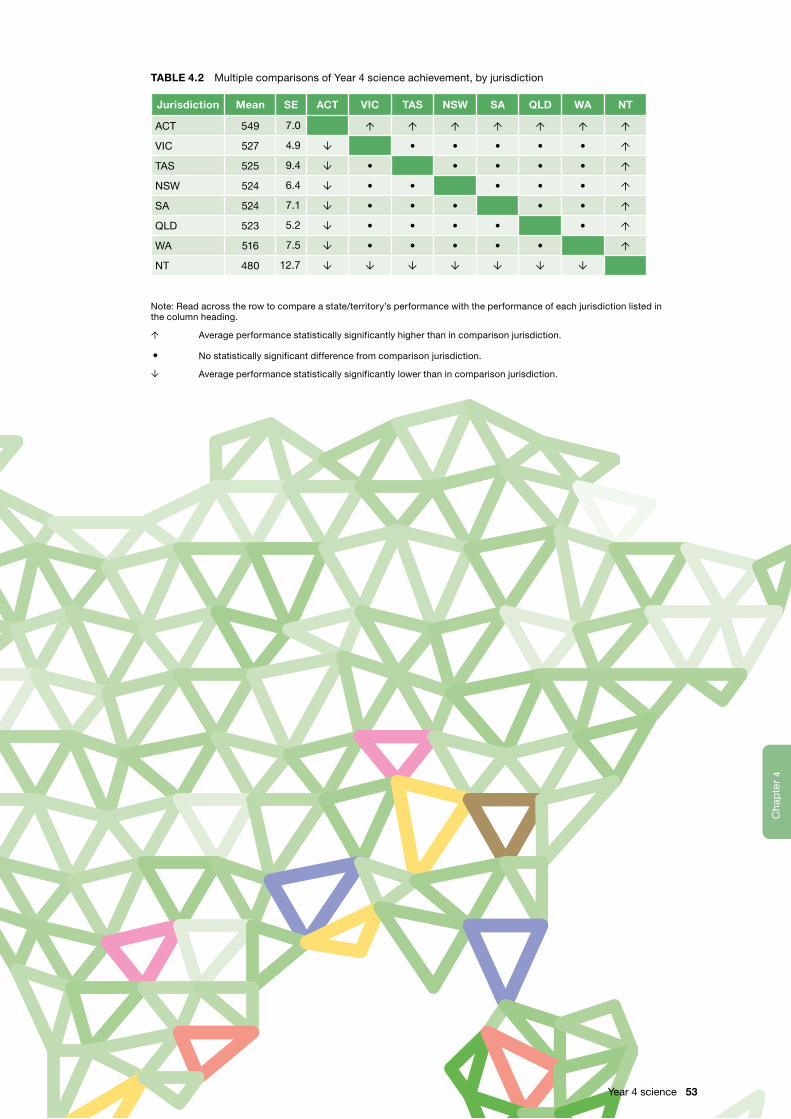
4C
hap
ter
4C
hapter
TABLE 4.2 Multiple comparisons of Year 4 science achievement, by jurisdiction
Jurisdiction Mean SE ACT VIC TAS NSW SA QLD WA NT
ACT 549 7.0 Ó Ó Ó Ó Ó Ó Ó
VIC 527 4.9 Ô • • • • • Ó
TAS 525 9.4 Ô • • • • • Ó
NSW 524 6.4 Ô • • • • • Ó
SA 524 7.1 Ô • • • • • Ó
QLD 523 5.2 Ô • • • • • Ó
WA 516 7.5 Ô • • • • • Ó
NT 480 12.7 Ô Ô Ô Ô Ô Ô Ô
Note: Read across the row to compare a state/territory’s performance with the performance of each jurisdiction listed in the column heading.
Ó Average performance statistically significantly higher than in comparison jurisdiction.
• No statistically significant difference from comparison jurisdiction.
Ô Average performance statistically significantly lower than in comparison jurisdiction.
Year 4 science 53
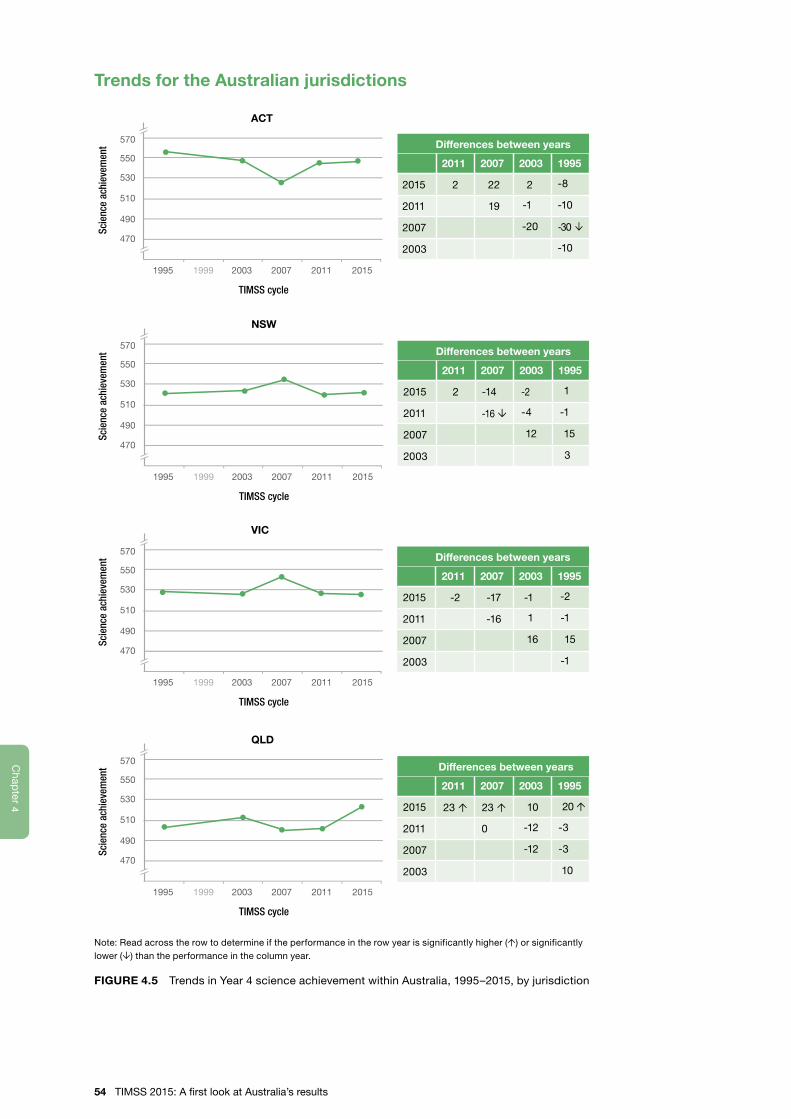
4C
hap
ter
4C
hapter
Trends for the Australian jurisdictions
1995 2003 2007 2011 2015
TIMSS cycle
1999
ACT
Scie
nce
achi
evem
ent
470
570
490
510
530
550Differences between years
2011 2007 2003 1995
2015 2 22 2 -8
2011 19 -1 -10
2007 -20 -30 Ô
2003 -10
1995 2003 2007 2011 2015
TIMSS cycle
1999
NSW
Scie
nce
achi
evem
ent
470
570
490
510
530
550Differences between years
2011 2007 2003 1995
2015 2 -14 -2 1
2011 -16 Ô -4 -1
2007 12 15
2003 3
1995 2003 2007 2011 2015
TIMSS cycle
1999
VIC
Scie
nce
achi
evem
ent
470
570
490
510
530
550Differences between years
2011 2007 2003 1995
2015 -2 -17 -1 -2
2011 -16 1 -1
2007 16 15
2003 -1
1995 2003 2007 2011 2015
TIMSS cycle
1999
QLD
Scie
nce
achi
evem
ent
470
570
490
510
530
550 Differences between years
2011 2007 2003 1995
2015 23 Ó 23 Ó 10 20 Ó
2011 0 -12 -3
2007 -12 -3
2003 10
Note: Read across the row to determine if the performance in the row year is significantly higher (Ó) or significantly lower (Ô) than the performance in the column year.
FIGURE 4.5 Trends in Year 4 science achievement within Australia, 1995–2015, by jurisdiction
54 TIMSS 2015: A first look at Australia’s results
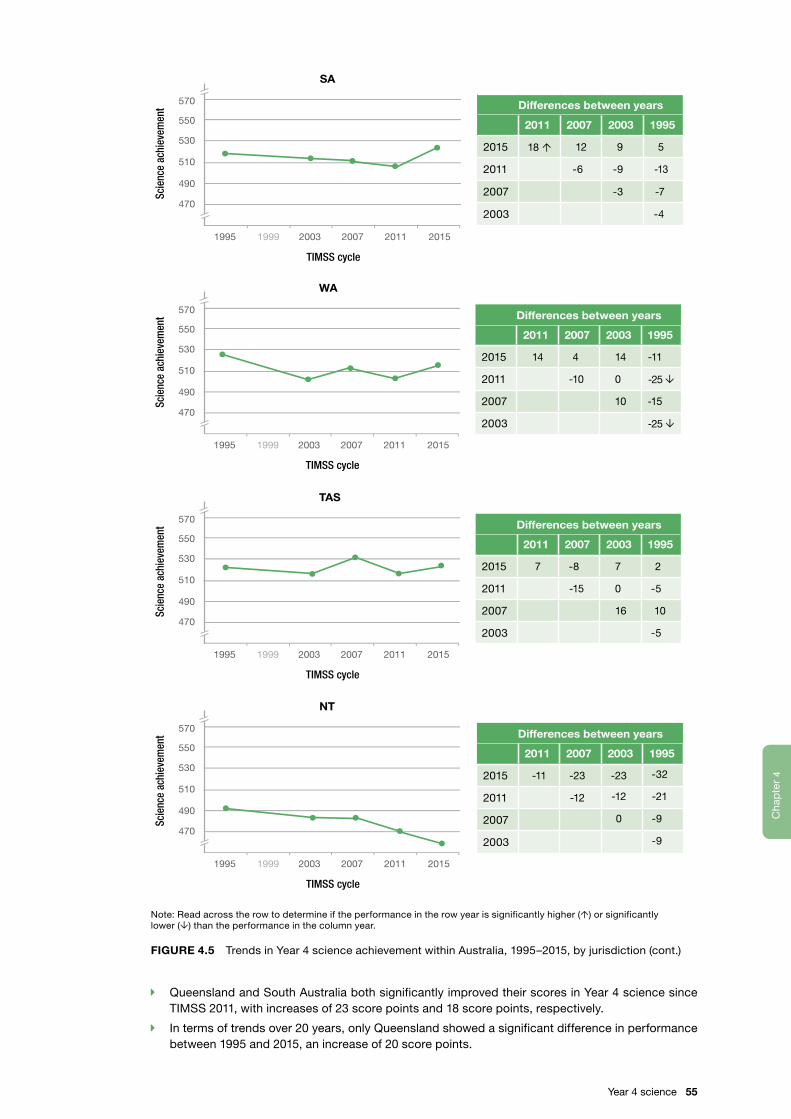
4C
hap
ter
4C
hapter
1995 2003 2007 2011 2015
TIMSS cycle
1999
SA
Scie
nce
achi
evem
ent
470
570
490
510
530
550
Differences between years
2011 2007 2003 1995
2015 18 Ó 12 9 5
2011 -6 -9 -13
2007 -3 -7
2003 -4
1995 2003 2007 2011 2015
TIMSS cycle
1999
WA
Scie
nce
achi
evem
ent
470
570
490
510
530
550Differences between years
2011 2007 2003 1995
2015 14 4 14 -11
2011 -10 0 -25 Ô
2007 10 -15
2003 -25 Ô
1995 2003 2007 2011 2015
TIMSS cycle
1999
TAS
Scie
nce
achi
evem
ent
470
570
490
510
530
550Differences between years
2011 2007 2003 1995
2015 7 -8 7 2
2011 -15 0 -5
2007 16 10
2003 -5
1995 2003 2007 2011 2015
TIMSS cycle
1999
NT
Scie
nce
achi
evem
ent
470
570
490
510
530
550Differences between years
2011 2007 2003 1995
2015 -11 -23 -23 -32
2011 -12 -12 -21
2007 0 -9
2003 -9
Note: Read across the row to determine if the performance in the row year is significantly higher (Ó) or significantly lower (Ô) than the performance in the column year.
FIGURE 4.5 Trends in Year 4 science achievement within Australia, 1995–2015, by jurisdiction (cont.)
Î Queensland and South Australia both significantly improved their scores in Year 4 science since TIMSS 2011, with increases of 23 score points and 18 score points, respectively.
Î In terms of trends over 20 years, only Queensland showed a significant difference in performance between 1995 and 2015, an increase of 20 score points.
Year 4 science 55
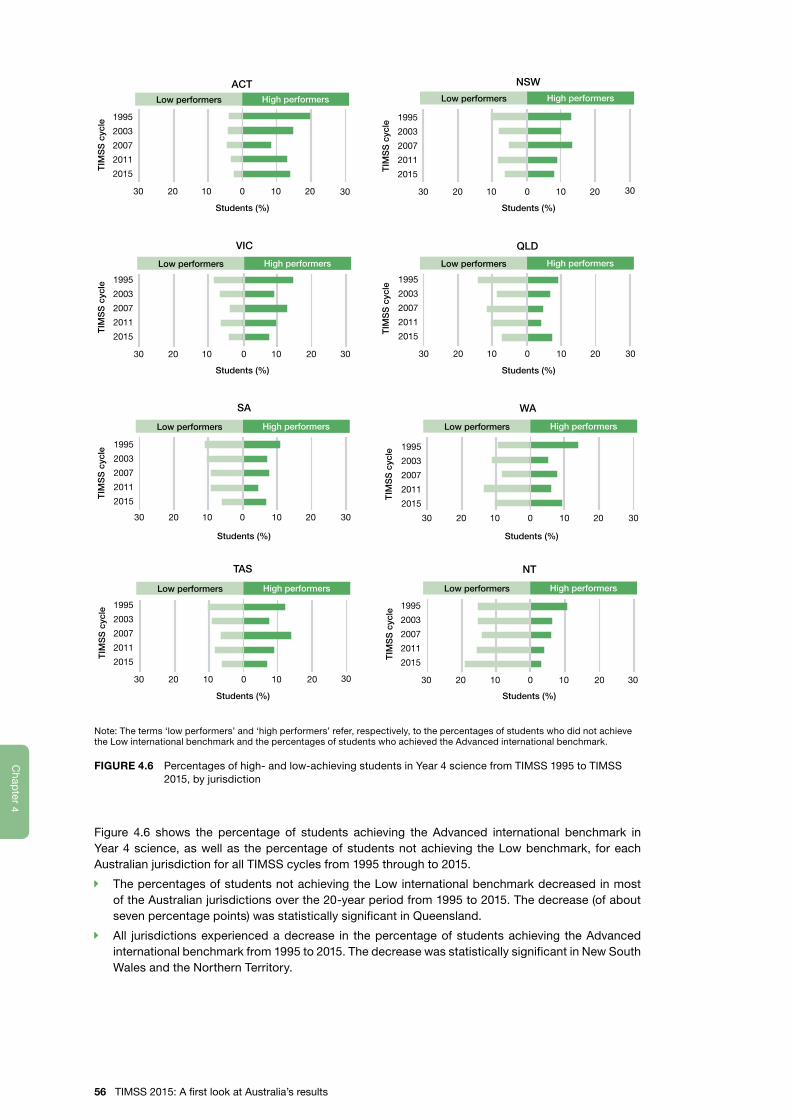
4C
hap
ter
4C
hapter
High performersLow performers
High performersLow performers High performersLow performers
High performersLow performers
High performersLow performers High performersLow performers
High performersLow performers High performersLow performers
TIM
SS
cyc
le
Students (%)
TIM
SS
cyc
le
Students (%)
0 10 20102030
1995
2003
2007
2011
2015
30
0 10 20102030
1995
2003
2007
2011
2015
30
VIC
NSW
QLD
SA WA
0 10 20102030
1995
2003
2007
2011
2015
30 0 10 20102030
1995
2003
2007
2011
2015
30
0 10 20102030
1995
2003
2007
2011
2015
30
0 10 20102030
1995
2003
2007
2011
2015
30 0 10 20102030
1995
2003
2007
2011
2015
30
TAS NT
0 10 20102030
1995
2003
2007
2011
2015
30
TIM
SS
cyc
le
Students (%)
TIM
SS
cyc
le
Students (%)
TIM
SS
cyc
le
Students (%)
TIM
SS
cyc
le
Students (%)
TIM
SS
cyc
le
Students (%)
TIM
SS
cyc
le
Students (%)
ACT
Note: The terms ‘low performers’ and ‘high performers’ refer, respectively, to the percentages of students who did not achieve the Low international benchmark and the percentages of students who achieved the Advanced international benchmark.
FIGURE 4.6 Percentages of high- and low-achieving students in Year 4 science from TIMSS 1995 to TIMSS 2015, by jurisdiction
Figure 4.6 shows the percentage of students achieving the Advanced international benchmark in Year 4 science, as well as the percentage of students not achieving the Low benchmark, for each Australian jurisdiction for all TIMSS cycles from 1995 through to 2015.
Î The percentages of students not achieving the Low international benchmark decreased in most of the Australian jurisdictions over the 20-year period from 1995 to 2015. The decrease (of about seven percentage points) was statistically significant in Queensland.
Î All jurisdictions experienced a decrease in the percentage of students achieving the Advanced international benchmark from 1995 to 2015. The decrease was statistically significant in New South Wales and the Northern Territory.
56 TIMSS 2015: A first look at Australia’s results

4C
hap
ter
4C
hapter
Australia’s science achievement for different demographic groups
Results for males and femalesPrevious TIMSS assessments have shown gender differences in science achievement at Year 4 to be small on average, although the situation varies considerably from country to country.
Female Male
Country % ofstudents
SEof %
Mean SE % ofstudents
SEof %
Mean SEDifference (absolute
value)SE
Saudi Arabia 49 1.0 431 5.3 51 1.0 352 7.6 79 9.0
Bahrain 50 0.8 478 3.0 50 0.8 439 3.5 39 4.0
Oman 50 0.7 447 3.4 50 0.7 415 3.6 32 3.1
Kuwait 51 2.1 352 7.6 49 2.1 322 7.6 30 9.1
Qatar 51 2.5 448 4.7 49 2.5 424 6.0 24 7.2
United Arab Emirates 48 2.2 459 4.4 52 2.2 444 4.0 14 6.4
Finland 48 0.8 560 2.3 52 0.8 548 2.9 12 2.5
Iran 49 1.1 427 5.2 51 1.1 415 5.6 11 7.4
Morocco 48 0.8 358 4.7 52 0.8 347 5.7 10 4.9
Bulgaria 49 0.8 540 6.3 51 0.8 532 5.9 8 2.9
Sweden 49 1.0 544 4.1 51 1.0 536 3.5 8 2.7
Indonesia 48 0.7 401 5.2 52 0.7 393 5.3 8 4.2
Kazakhstan 49 0.8 552 4.5 51 0.8 547 4.7 5 2.7
Georgia 49 0.9 453 3.9 51 0.9 449 4.6 4 4.1
New Zealand 49 0.7 507 3.2 51 0.7 504 3.0 3 3.1
Lithuania 50 0.9 529 2.9 50 0.9 526 3.1 3 3.4
Serbia 48 0.8 526 3.6 52 0.8 523 4.9 3 4.6
Canada 49 0.5 526 2.8 51 0.5 524 3.0 2 2.2
Belgium (Flemish) 50 0.9 512 2.6 50 0.9 511 2.6 2 2.4
Poland 50 0.8 548 2.5 50 0.8 546 3.0 1 2.8
Turkey 49 0.6 484 3.3 51 0.6 483 4.0 1 3.1
Netherlands 50 0.9 517 2.8 50 0.9 517 3.0 1 2.4
Australia 49 1.0 524 3.3 51 1.0 523 3.4 1 3.4
England 51 0.7 536 3.0 49 0.7 536 2.6 1 2.8
Norway (5) 49 0.9 538 3.1 51 0.9 537 3.1 1 3.2
Singapore 48 0.5 591 3.7 52 0.5 590 4.2 0 2.8
Russian Federation 49 0.9 567 3.1 51 0.9 567 3.7 0 2.7
France 49 0.7 487 3.1 51 0.7 487 2.9 0 2.4
Northern Ireland 50 1.1 520 3.0 50 1.1 520 2.8 0 3.7
Cyprus 49 0.7 481 2.8 51 0.7 481 2.9 0 2.6
Chile 49 1.7 477 3.0 51 1.7 478 3.4 1 3.3
Germany 48 0.7 527 2.7 52 0.7 529 2.6 2 2.3
Croatia 49 0.8 532 2.7 51 0.8 534 2.2 2 2.8
United States 51 0.6 544 2.4 49 0.6 548 2.5 4 2.0
Denmark 49 0.8 525 2.5 51 0.8 529 2.6 4 2.8
Japan 50 0.5 567 2.0 50 0.5 571 2.3 4 2.4
Ireland 47 1.5 526 2.9 53 1.5 531 2.9 5 3.4
Spain 49 0.9 515 2.9 51 0.9 521 2.9 6 2.7
Slovenia 49 0.8 539 2.4 51 0.8 546 3.1 7 2.7
Portugal 49 0.8 504 2.5 51 0.8 512 2.4 7 2.2
Hungary 49 0.9 538 3.5 51 0.9 546 3.9 8 3.1
Czech Republic 49 0.9 530 2.8 51 0.9 538 2.7 8 2.6
Slovak Republic 48 0.9 516 3.2 52 0.9 524 2.7 8 2.7
Chinese Taipei 49 0.6 551 2.2 51 0.6 560 2.4 9 2.9
Italy 49 0.7 512 3.1 51 0.7 521 2.8 9 2.5
Hong Kong 46 1.5 551 3.9 54 1.5 561 3.3 10 3.9
Korea 48 0.5 584 2.3 52 0.5 595 2.3 11 2.4
International average 49 0.1 508 0.5 51 0.1 504 0.6 0 20 40 60 8080 60 40 20
Femalesscorehigherthan
males
Malesscorehigherthan
females
Difference is statistically significant
Difference is not statistically significant
FIGURE 4.7 Sex differences in Year 4 science achievement, by country
Year 4 science 57
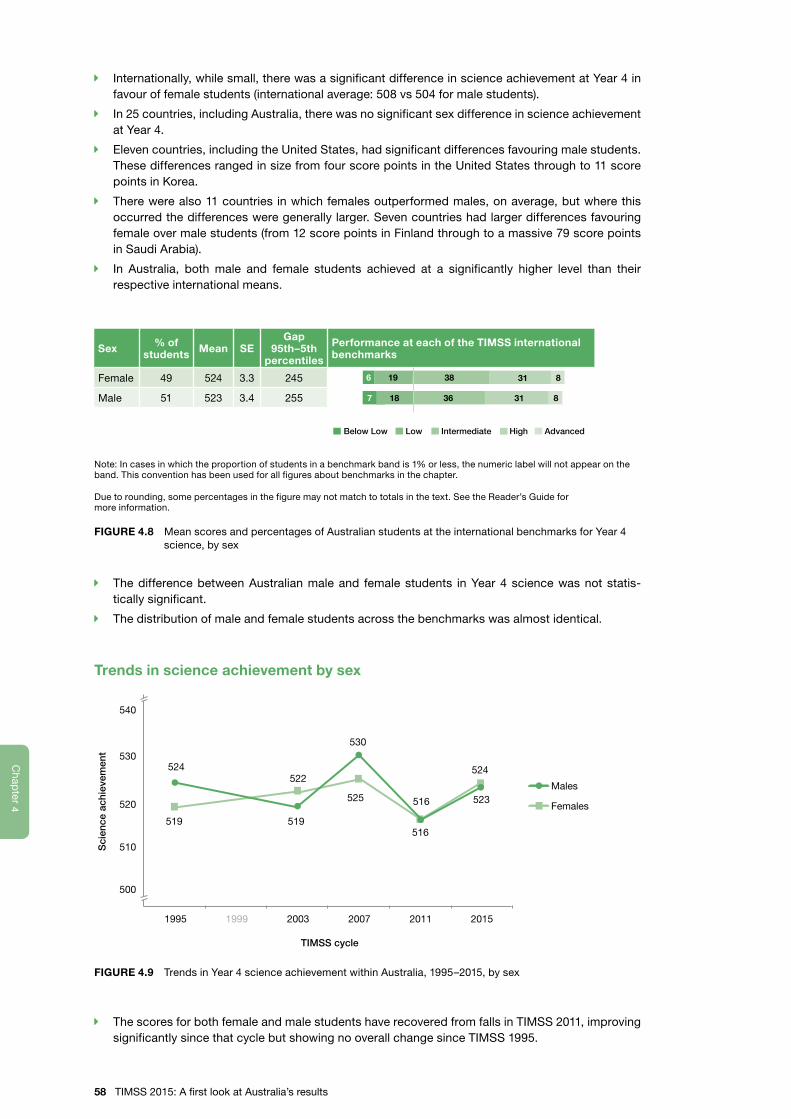
4C
hap
ter
4C
hapter
Î Internationally, while small, there was a significant difference in science achievement at Year 4 in favour of female students (international average: 508 vs 504 for male students).
Î In 25 countries, including Australia, there was no significant sex difference in science achievement at Year 4.
Î Eleven countries, including the United States, had significant differences favouring male students. These differences ranged in size from four score points in the United States through to 11 score points in Korea.
Î There were also 11 countries in which females outperformed males, on average, but where this occurred the differences were generally larger. Seven countries had larger differences favouring female over male students (from 12 score points in Finland through to a massive 79 score points in Saudi Arabia).
Î In Australia, both male and female students achieved at a significantly higher level than their respective international means.
Sex % of students Mean SE
Gap 95th–5th
percentiles
Performance at each of the TIMSS international benchmarks
Female 49 524 3.3 245
Male 51 523 3.4 255 31 836187
31 838196
Below Low Low Intermediate High Advanced
Note: In cases in which the proportion of students in a benchmark band is 1% or less, the numeric label will not appear on the band. This convention has been used for all figures about benchmarks in the chapter.
Due to rounding, some percentages in the figure may not match to totals in the text. See the Reader’s Guide for more information.
FIGURE 4.8 Mean scores and percentages of Australian students at the international benchmarks for Year 4 science, by sex
Î The difference between Australian male and female students in Year 4 science was not statis-tically significant.
Î The distribution of male and female students across the benchmarks was almost identical.
Trends in science achievement by sex
519
522
525 516
524524
519
530
516
523Males
Females
500
510
530
540
Sci
ence
ach
ieve
men
t
520
1995 1999 2003 2007 2011 2015
TIMSS cycle
FIGURE 4.9 Trends in Year 4 science achievement within Australia, 1995–2015, by sex
Î The scores for both female and male students have recovered from falls in TIMSS 2011, improving significantly since that cycle but showing no overall change since TIMSS 1995.
58 TIMSS 2015: A first look at Australia’s results
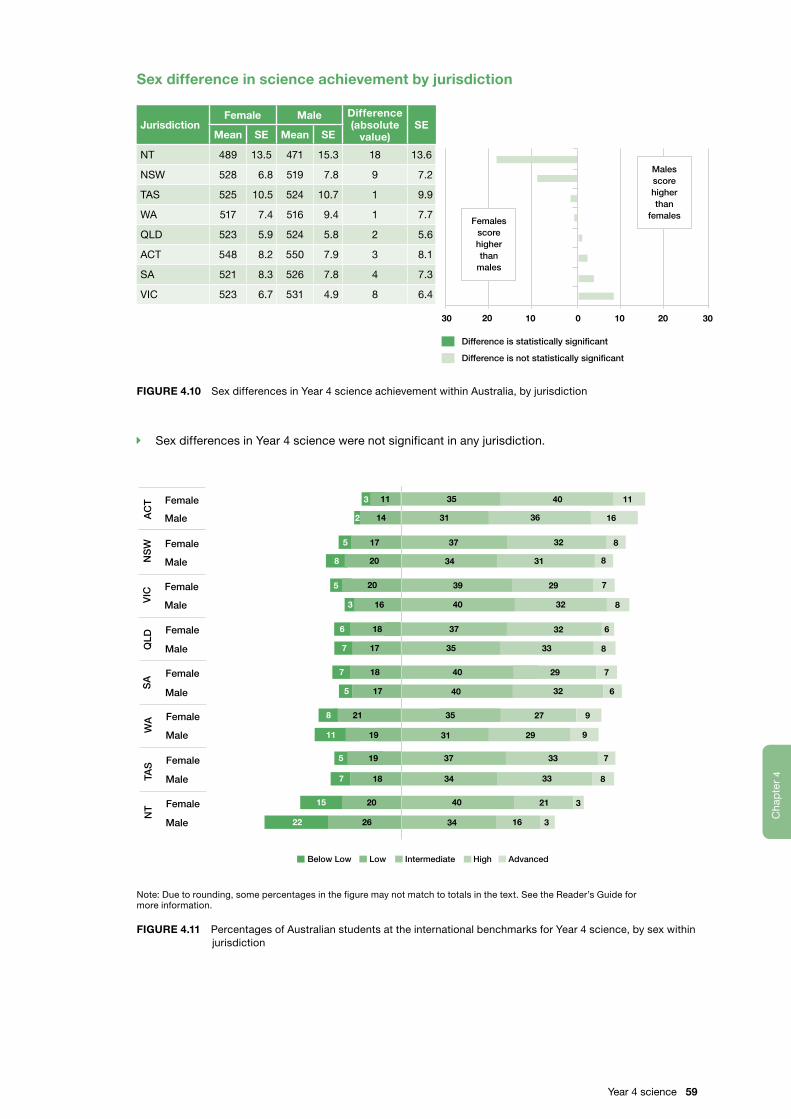
4C
hap
ter
4C
hapter
Sex difference in science achievement by jurisdiction
JurisdictionFemale Male Difference
(absolute value)
SEMean SE Mean SE
NT 489 13.5 471 15.3 18 13.6
NSW 528 6.8 519 7.8 9 7.2
TAS 525 10.5 524 10.7 1 9.9
WA 517 7.4 516 9.4 1 7.7
QLD 523 5.9 524 5.8 2 5.6
ACT 548 8.2 550 7.9 3 8.1
SA 521 8.3 526 7.8 4 7.3
VIC 523 6.7 531 4.9 8 6.4
30 10 20100 3020
Femalesscorehigherthan
males
Malesscorehigherthan
females
Difference is statistically significant
Difference is not statistically significant
FIGURE 4.10 Sex differences in Year 4 science achievement within Australia, by jurisdiction
Î Sex differences in Year 4 science were not significant in any jurisdiction.
40 1111 35
36 1631142
32 837175
31 834208
29 739205
32 840163
32 637186
33 835177
29 740187
32 640175
27 93521
29 9311911
33 737195
33 834187
40 212015
34 162622 3
3
Female
MaleAC
T
Female
MaleNS
W
Female
MaleVIC
Female
MaleQLD
Female
Male
SA
Female
MaleWA
Female
MaleTAS
Female
Male
NT
6
8
Below Low Low Intermediate High Advanced
3
Note: Due to rounding, some percentages in the figure may not match to totals in the text. See the Reader’s Guide for more information.
FIGURE 4.11 Percentages of Australian students at the international benchmarks for Year 4 science, by sex within jurisdiction
Year 4 science 59

4C
hap
ter
4C
hapter
Î In the Australian Capital Territory, 16 per cent of male students reached the Advanced benchmark compared to 11 per cent of female students; however, at the other end of achievement, 14 per cent of female students compared to 17 per cent of male students were at or below the Low benchmark.
Î Reflecting the previous finding of no sex differences at jurisdictional level, the percentages of male and female students at each benchmark were similar in most jurisdictions.
Î Of concern, as in Year 4 mathematics, are the 36 per cent of female students and 48 per cent of male students in the Northern Territory who failed to achieve the Intermediate benchmark. While this was much higher than in any other Australian jurisdiction, in Western Australia 29 per cent of females and 31 per cent of males did not achieve this minimum standard.
Results for books in the homeThis section presents Australian students’ science achievement according to the number of books in the home. For more information about this variable, please refer to the Reader’s Guide.
3538154
40 1629123
216393013
Below Low Low Intermediate High Advanced
8
Number of books in the home
% of students Mean SE
Gap 95th–5th
percentiles
Performance at each of the TIMSS international benchmarks
Many books 16 554 4.4 249
Average number of books 57 535 2.4 229
A few books 26 484 3.8 241
Note: In cases in which the proportion of students in a benchmark band is 1% or less, the numeric label will not appear on the band. This convention has been used for all figures about benchmarks in the chapter.
Due to rounding, some percentages in the figure may not match to totals in the text. See the Reader’s Guide for more information.
FIGURE 4.12 Mean scores and percentages of students at the international benchmarks for Year 4 science, by number of books in the home
Î The majority of Australian Year 4 students (57%) reported having an average number of books and only 16 per cent reported having many books at home.
Î Students who have many books in the home were found to have the highest levels of science achievement, scoring, on average, 19 score points higher than students with an average number of books in the home, and 70 score points higher than those who reported having a few books in the home.
Î Of those students who reported having many books in the home, 16 per cent achieved the Advanced benchmark. The proportion of students achieving this highest benchmark fell to eight per cent for students in the average number of books category and just two per cent of those with a few books in the home.
Î Forty-three per cent of the students who reported having a few books in the home did not achieve the Intermediate benchmark, with 30 per cent of these performing at the Low benchmark and a further 13 per cent falling below the Low benchmark.
Î As a comparison, of the students who reported having many books in the home, 12 per cent achieved the Low benchmark and just three per cent failed to achieve even this basic level.
60 TIMSS 2015: A first look at Australia’s results
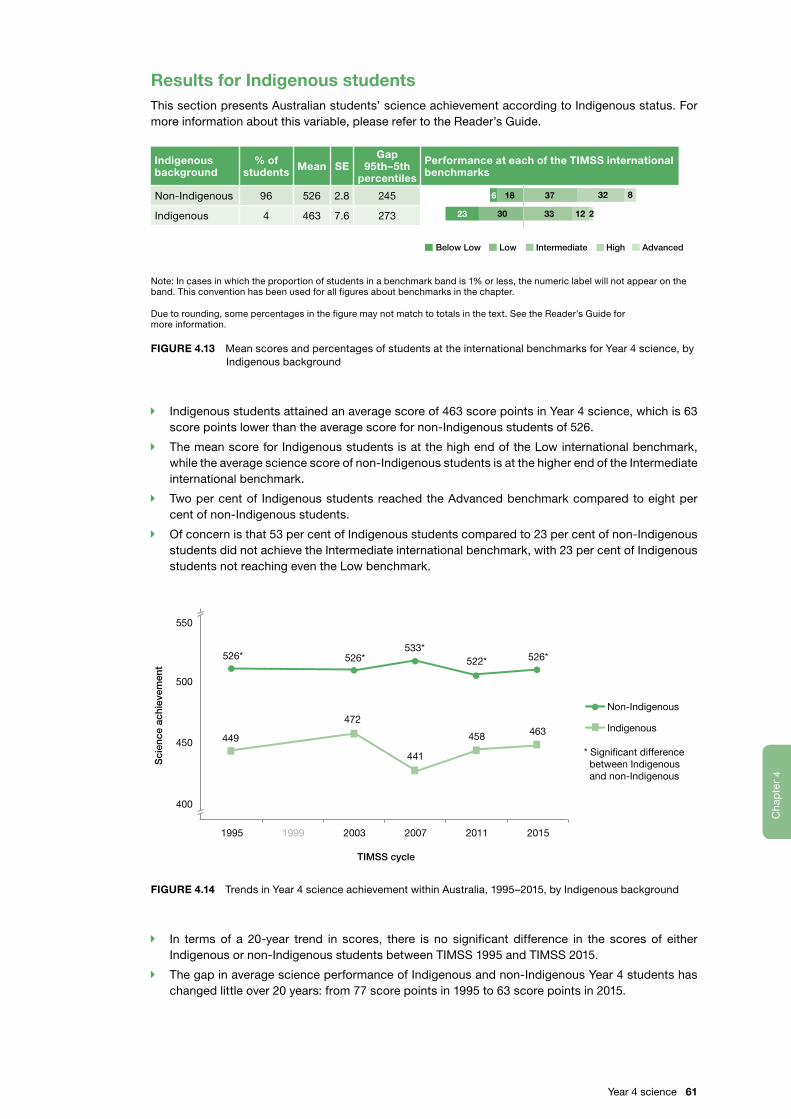
4C
hap
ter
4C
hapter
Results for Indigenous studentsThis section presents Australian students’ science achievement according to Indigenous status. For more information about this variable, please refer to the Reader’s Guide.
Indigenous background
% of students Mean SE
Gap 95th–5th
percentiles
Performance at each of the TIMSS international benchmarks
Non-Indigenous 96 526 2.8 245
Indigenous 4 463 7.6 273
3237186
212333023
Below Low Low Intermediate High Advanced
8
Note: In cases in which the proportion of students in a benchmark band is 1% or less, the numeric label will not appear on the band. This convention has been used for all figures about benchmarks in the chapter.
Due to rounding, some percentages in the figure may not match to totals in the text. See the Reader’s Guide for more information.
FIGURE 4.13 Mean scores and percentages of students at the international benchmarks for Year 4 science, by Indigenous background
Î Indigenous students attained an average score of 463 score points in Year 4 science, which is 63 score points lower than the average score for non-Indigenous students of 526.
Î The mean score for Indigenous students is at the high end of the Low international benchmark, while the average science score of non-Indigenous students is at the higher end of the Intermediate international benchmark.
Î Two per cent of Indigenous students reached the Advanced benchmark compared to eight per cent of non-Indigenous students.
Î Of concern is that 53 per cent of Indigenous students compared to 23 per cent of non-Indigenous students did not achieve the Intermediate international benchmark, with 23 per cent of Indigenous students not reaching even the Low benchmark.
Non-Indigenous
449
526*
441
522* 526*526*
472
533*
458 463
400
450
500
550
Indigenous
* Signi�cant difference between Indigenous and non-Indigenous
Sci
ence
ach
ieve
men
t
1995 1999 2003 2007 2011 2015
TIMSS cycle
FIGURE 4.14 Trends in Year 4 science achievement within Australia, 1995–2015, by Indigenous background
Î In terms of a 20-year trend in scores, there is no significant difference in the scores of either Indigenous or non-Indigenous students between TIMSS 1995 and TIMSS 2015.
Î The gap in average science performance of Indigenous and non-Indigenous Year 4 students has changed little over 20 years: from 77 score points in 1995 to 63 score points in 2015.
Year 4 science 61
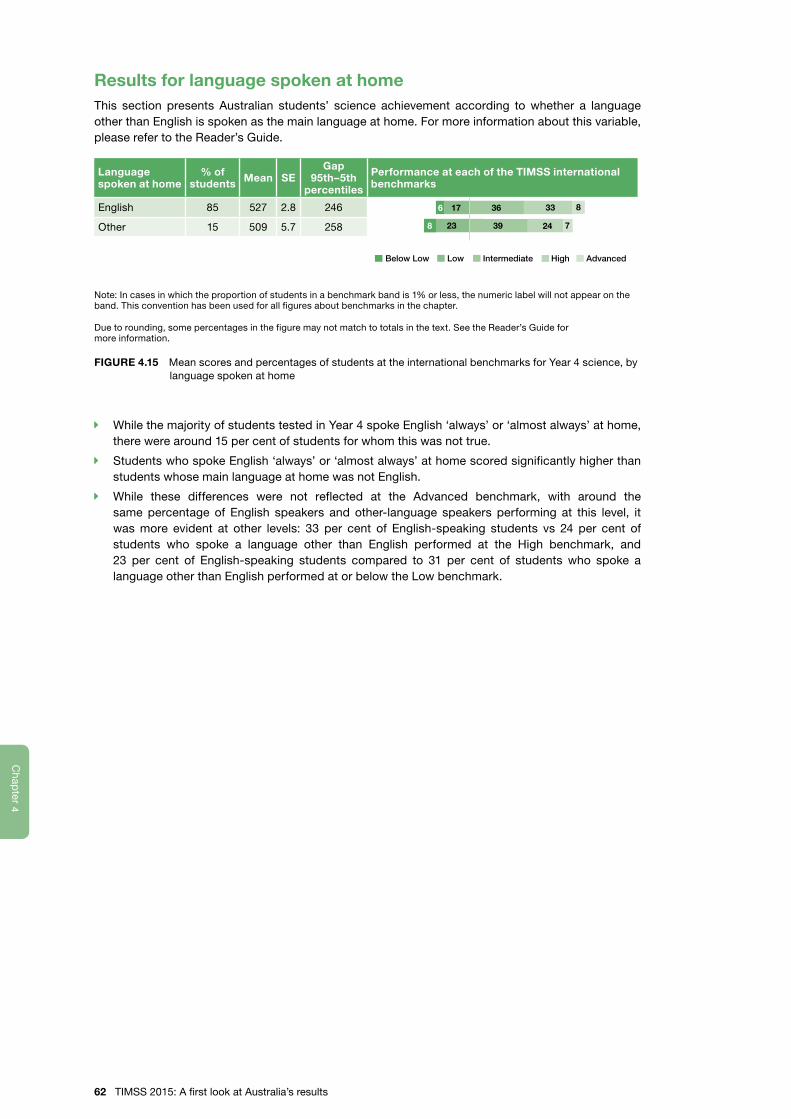
4C
hap
ter
4C
hapter
Results for language spoken at homeThis section presents Australian students’ science achievement according to whether a language other than English is spoken as the main language at home. For more information about this variable, please refer to the Reader’s Guide.
Language spoken at home
% of students Mean SE
Gap 95th–5th
percentiles
Performance at each of the TIMSS international benchmarks
English 85 527 2.8 246
Other 15 509 5.7 258
3336176
72439238
Below Low Low Intermediate High Advanced
8
Note: In cases in which the proportion of students in a benchmark band is 1% or less, the numeric label will not appear on the band. This convention has been used for all figures about benchmarks in the chapter.
Due to rounding, some percentages in the figure may not match to totals in the text. See the Reader’s Guide for more information.
FIGURE 4.15 Mean scores and percentages of students at the international benchmarks for Year 4 science, by language spoken at home
Î While the majority of students tested in Year 4 spoke English ‘always’ or ‘almost always’ at home, there were around 15 per cent of students for whom this was not true.
Î Students who spoke English ‘always’ or ‘almost always’ at home scored significantly higher than students whose main language at home was not English.
Î While these differences were not reflected at the Advanced benchmark, with around the same percentage of English speakers and other-language speakers performing at this level, it was more evident at other levels: 33 per cent of English-speaking students vs 24 per cent of students who spoke a language other than English performed at the High benchmark, and 23 per cent of English-speaking students compared to 31 per cent of students who spoke a language other than English performed at or below the Low benchmark.
62 TIMSS 2015: A first look at Australia’s results
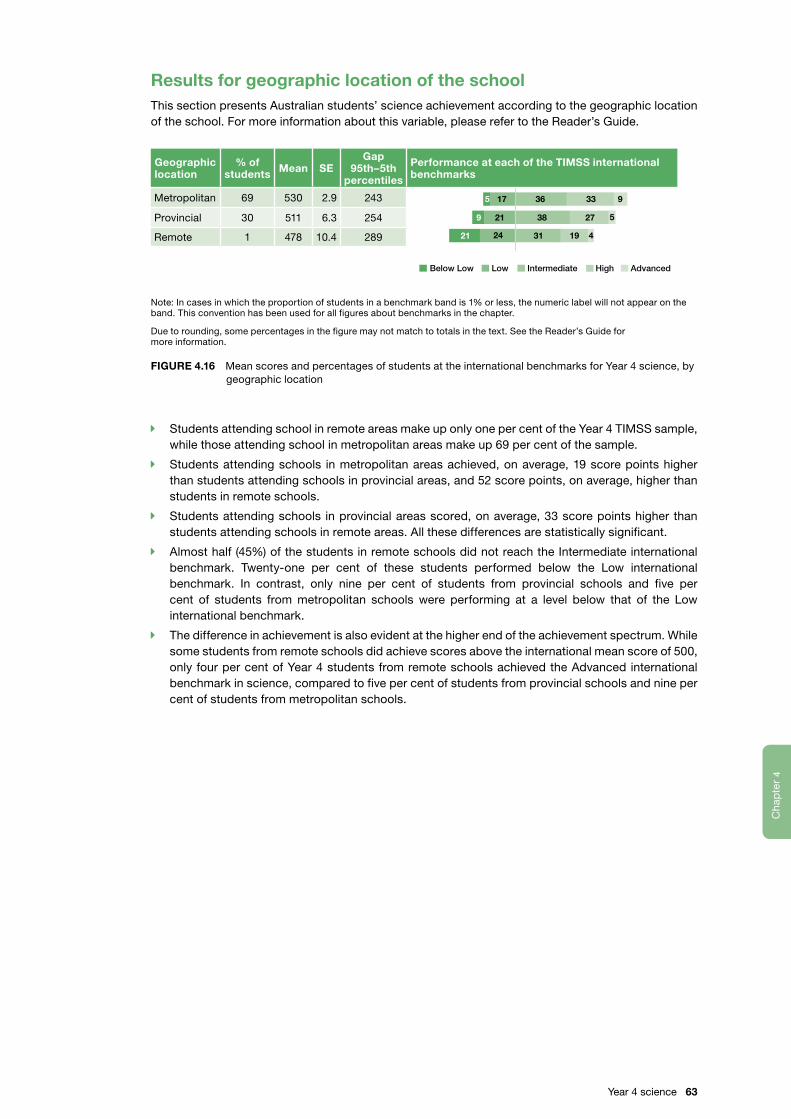
4C
hap
ter
4C
hapter
Results for geographic location of the schoolThis section presents Australian students’ science achievement according to the geographic location of the school. For more information about this variable, please refer to the Reader’s Guide.
Below Low Low Intermediate High Advanced
2738219
33 936175
419312421
5
Geographic location
% of students Mean SE
Gap 95th–5th
percentiles
Performance at each of the TIMSS international benchmarks
Metropolitan 69 530 2.9 243
Provincial 30 511 6.3 254
Remote 1 478 10.4 289
Note: In cases in which the proportion of students in a benchmark band is 1% or less, the numeric label will not appear on the band. This convention has been used for all figures about benchmarks in the chapter.
Due to rounding, some percentages in the figure may not match to totals in the text. See the Reader’s Guide for more information.
FIGURE 4.16 Mean scores and percentages of students at the international benchmarks for Year 4 science, by geographic location
Î Students attending school in remote areas make up only one per cent of the Year 4 TIMSS sample, while those attending school in metropolitan areas make up 69 per cent of the sample.
Î Students attending schools in metropolitan areas achieved, on average, 19 score points higher than students attending schools in provincial areas, and 52 score points, on average, higher than students in remote schools.
Î Students attending schools in provincial areas scored, on average, 33 score points higher than students attending schools in remote areas. All these differences are statistically significant.
Î Almost half (45%) of the students in remote schools did not reach the Intermediate international benchmark. Twenty-one per cent of these students performed below the Low international benchmark. In contrast, only nine per cent of students from provincial schools and five per cent of students from metropolitan schools were performing at a level below that of the Low international benchmark.
Î The difference in achievement is also evident at the higher end of the achievement spectrum. While some students from remote schools did achieve scores above the international mean score of 500, only four per cent of Year 4 students from remote schools achieved the Advanced international benchmark in science, compared to five per cent of students from provincial schools and nine per cent of students from metropolitan schools.
Year 4 science 63

5
Year 8 science 65
Chapter
Year 8 science
Australia’s Year 8 science results within the international contextFigure 5.1 (see page 66) shows the means, standard errors, gaps between the 5th and 95th percen-tiles and, to the right of the percentile gaps, the percentages of students in each country at the TIMSS benchmarks.
Î Singapore had the highest achievement in Year 8 science. Singapore’s score of 597 was significantly higher than those of all other countries, and it was followed by those for Japan (571) and Chinese Taipei (569), which were not significantly different to each other but were significantly higher than scores recorded by all other countries. In addition to these three high-performing countries, Korea (556) and Slovenia (551) also scored, on average, above the High international benchmark.
Î Australian Year 8 students’ average score of 512 score points in science was significantly higher than the scores for 20 other countries, such as Italy, Turkey and Malaysia, and places average achievement about halfway between the Intermediate and High benchmarks.
Î Australia was significantly outperformed by 14 countries, including Canada, the United States, Ireland and England, as well as the top five countries mentioned above, along with Hong Kong, the Russian Federation, Kazakhstan, Hungary and Sweden.
Î Canada, one of the higher-achieving countries, had the smallest gap between high and low achievers (228 score points), while Egypt had the largest gap, of 375 score points. Australia’s gap was about mid-range at 270 score points, similar to that of the United States and smaller than the gap in Singapore.
Î Singapore, in particular, had an impressive percentage of Year 8 students reaching the Advanced benchmark in science. Forty-two per cent of Year 8 Singaporean students achieved this standard. In Chinese Taipei more than one-quarter of students (27%), in Japan just under one-quarter of students (24%) and in Korea 19 per cent of students achieved this benchmark. Slovenia reported 17 per cent of students at the Advanced international benchmark.
Î In Australia, just seven per cent of Year 8 students reached the Advanced benchmark in science. The international median was also seven per cent of students attaining this level. Australia’s percentage of achievers at the Advanced benchmark was exceeded by New Zealand (10%), Sweden (10%), Ireland (10%), Hong Kong (12%), the United States (12%), Hungary (12%), Israel (12%), the Russian Federation (14%), England (14%) and Kazakhstan (15%).
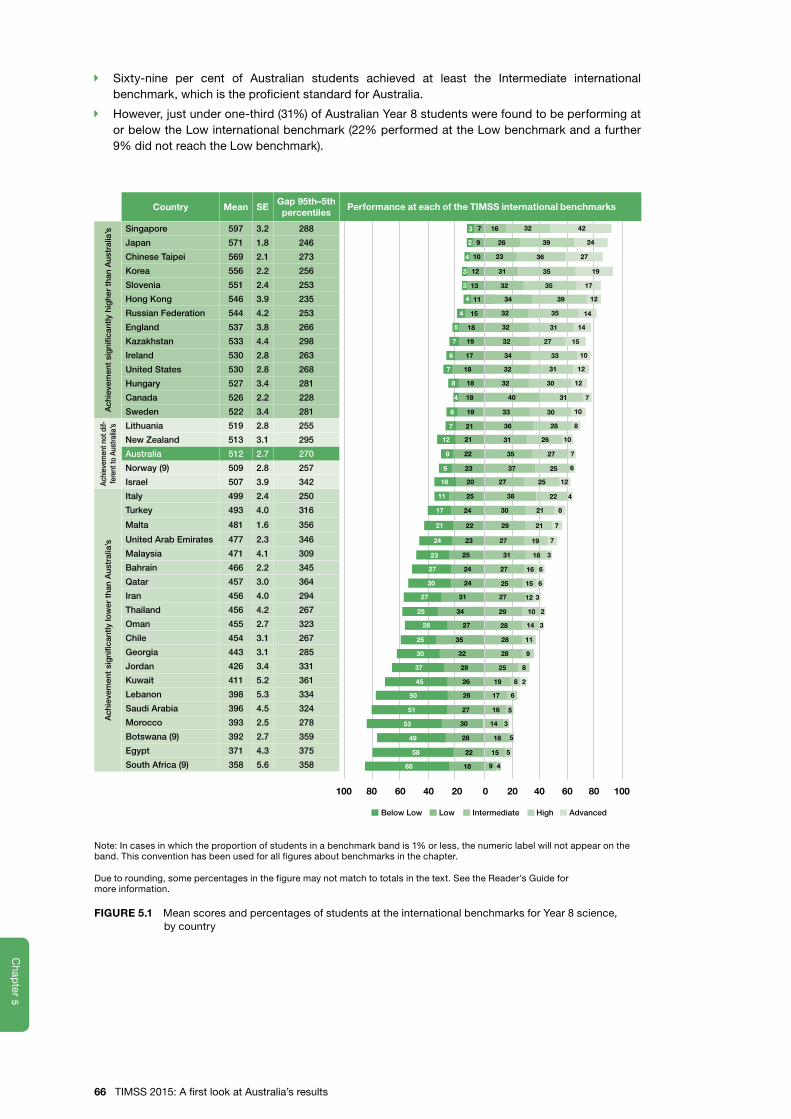
5C
hap
ter
5C
hapter
Î Sixty-nine per cent of Australian students achieved at least the Intermediate international benchmark, which is the proficient standard for Australia.
Î However, just under one-third (31%) of Australian Year 8 students were found to be performing at or below the Low international benchmark (22% performed at the Low benchmark and a further 9% did not reach the Low benchmark).
Country Mean SEGap 95th–5th percentiles
Ach
ieve
men
t si
gni
fican
tly h
ighe
r th
an A
ustr
alia
’s Singapore 597 3.2 288
Japan 571 1.8 246
Chinese Taipei 569 2.1 273
Korea 556 2.2 256
Slovenia 551 2.4 253
Hong Kong 546 3.9 235
Russian Federation 544 4.2 253
England 537 3.8 266
Kazakhstan 533 4.4 298
Ireland 530 2.8 263
United States 530 2.8 268
Hungary 527 3.4 281
Canada 526 2.2 228
Sweden 522 3.4 281
Achi
evem
ent n
ot d
if-fe
rent
to A
ustra
lia’s Lithuania 519 2.8 255
New Zealand 513 3.1 295
Australia 512 2.7 270
Norway (9) 509 2.8 257
Israel 507 3.9 342
Ach
ieve
men
t si
gni
fican
tly lo
wer
tha
n A
ustr
alia
’s
Italy 499 2.4 250
Turkey 493 4.0 316
Malta 481 1.6 356
United Arab Emirates 477 2.3 346
Malaysia 471 4.1 309
Bahrain 466 2.2 345
Qatar 457 3.0 364
Iran 456 4.0 294
Thailand 456 4.2 267
Oman 455 2.7 323
Chile 454 3.1 267
Georgia 443 3.1 285
Jordan 426 3.4 331
Kuwait 411 5.2 361
Lebanon 398 5.3 334
Saudi Arabia 396 4.5 324
Morocco 393 2.5 278
Botswana (9) 392 2.7 359
Egypt 371 4.3 375
South Africa (9) 358 5.6 358
0 20 40 60 80 100100 80 60 40 20
7 16 32 42
9 26
4 10 23
3 12 4231
13 32 35 17
11 34 39 12
15 32 35 14
18 32 31 14
19 32 27 15
17 34 33 10
7 18 32 31 12
8 18 32 30 12
4 18 40 31 7
19 33 30 10
7 21 36 28 8
12 21 31 26 10
22 35 27 7
23 37 25
16 20 27
6
17 24 30 21 8
21 22 29 21 7
24 23 27 19 7
11 25 38 22 4
23 25 31 18 3
27 24 27 16 6
30 24 25 15
27 31 27 12
25 34 29 10 2
28 27 28 14 3
25 35 28 11
30 32 28 9
29 25 8
45 26 19 8
50 26 617
51 27 16 5
53 30 14
49 28 18 5
58 22 15 5
68 18 49
3
4
37
9
8
6
7
9
5
4
39 24
36 27
35 19
3
6
2
3
25
2
3
12
Below Low Low Intermediate High Advanced
Performance at each of the TIMSS international benchmarks
Note: In cases in which the proportion of students in a benchmark band is 1% or less, the numeric label will not appear on the band. This convention has been used for all figures about benchmarks in the chapter.
Due to rounding, some percentages in the figure may not match to totals in the text. See the Reader’s Guide for more information.
FIGURE 5.1 Mean scores and percentages of students at the international benchmarks for Year 8 science, by country
66 TIMSS 2015: A first look at Australia’s results
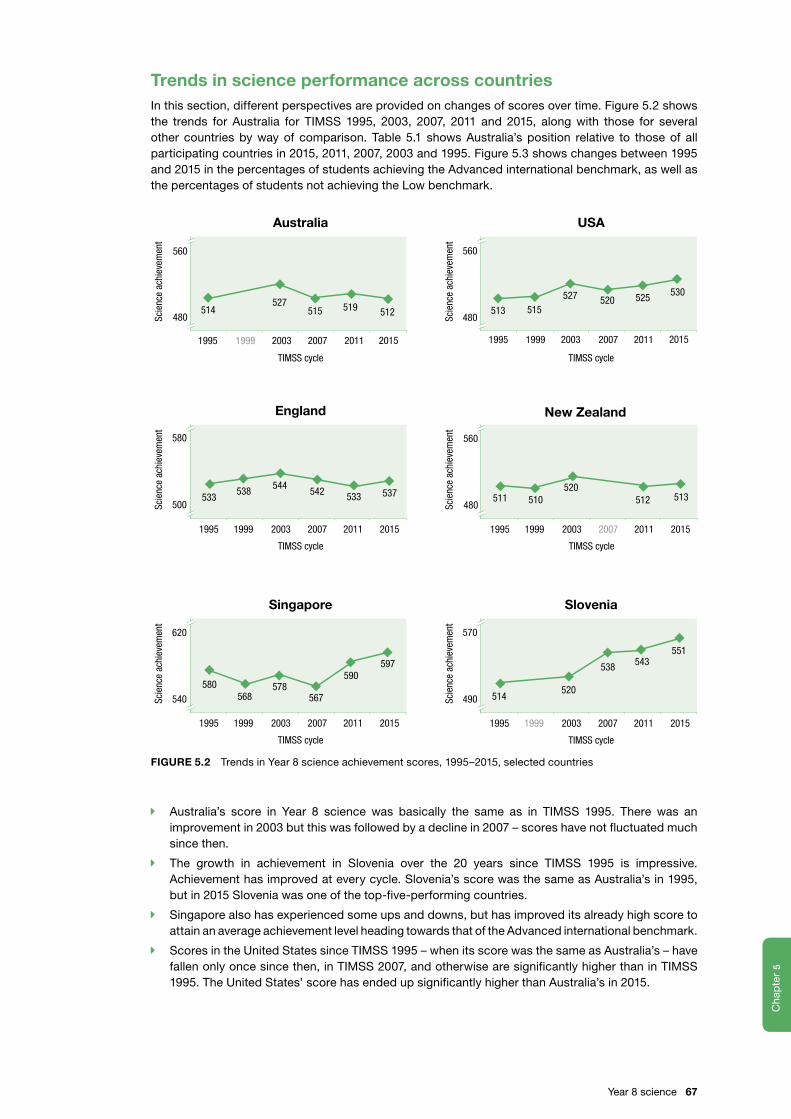
5C
hap
ter
5C
hapter
Trends in science performance across countriesIn this section, different perspectives are provided on changes of scores over time. Figure 5.2 shows the trends for Australia for TIMSS 1995, 2003, 2007, 2011 and 2015, along with those for several other countries by way of comparison. Table 5.1 shows Australia’s position relative to those of all participating countries in 2015, 2011, 2007, 2003 and 1995. Figure 5.3 shows changes between 1995 and 2015 in the percentages of students achieving the Advanced international benchmark, as well as the percentages of students not achieving the Low benchmark.
Scie
nce
achi
evem
ent
TIMSS cycle
Australia
Scie
nce
achi
evem
ent
TIMSS cycle
USA
Scie
nce
achi
evem
ent
TIMSS cycle
England
Scie
nce
achi
evem
ent
New Zealand
Scie
nce
achi
evem
ent
Singapore
Scie
nce
achi
evem
ent
Slovenia
540
560580
560560
TIMSS cycle
20112007200319991995 2015
480
20112007200319991995
480
20112007200319991995
500
20112007200319991995
480
620
490
570
2015 2015
2015
TIMSS cycle
20112007200319991995 2015
514527
515 519
533544
542 533
513
527 520 525
580 578567
590
511 510520
512
514
538
551
512
530
597
513
543
537
TIMSS cycle
20112007200319991995 2015
520
538
568
515
FIGURE 5.2 Trends in Year 8 science achievement scores, 1995–2015, selected countries
Î Australia’s score in Year 8 science was basically the same as in TIMSS 1995. There was an improvement in 2003 but this was followed by a decline in 2007 – scores have not fluctuated much since then.
Î The growth in achievement in Slovenia over the 20 years since TIMSS 1995 is impressive. Achievement has improved at every cycle. Slovenia’s score was the same as Australia’s in 1995, but in 2015 Slovenia was one of the top-five-performing countries.
Î Singapore also has experienced some ups and downs, but has improved its already high score to attain an average achievement level heading towards that of the Advanced international benchmark.
Î Scores in the United States since TIMSS 1995 – when its score was the same as Australia’s – have fallen only once since then, in TIMSS 2007, and otherwise are significantly higher than in TIMSS 1995. The United States’ score has ended up significantly higher than Australia’s in 2015.
Year 8 science 67

5C
hap
ter
5C
hapter
TABLE 5.1 Relative trends in Year 8 science achievement, by country
CountryPosition
relative to Australia 2015
Position relative to
Australia 2011
Position relative to
Australia 2007
Position relative to
Australia 2003
Position relative to
Australia 1995
Singapore Ó Ó Ó Ó Ó
Japan Ó Ó Ó Ó Ó
Chinese Taipei Ó Ó Ó Ó –
Korea Ó Ó Ó Ó Ó
Slovenia Ó Ó Ó • •
Hong Kong Ó Ó Ó Ó •
Russian Federation Ó Ó Ó Ô •
England Ó Ó Ó Ó Ó
Kazakhstan Ó Ô – – –
Ireland Ó – – – •
United States Ó • • • •
Hungary Ó • Ó Ó Ó
Canada Ó – – – –
Sweden Ó • • • Ó
Lithuania • • • • Ô
New Zealand • • – • •
Australia
Norway (9) • – – – –
Israel • • – – –
Italy Ô Ô Ô Ô –
Turkey Ô Ô – – –
Malta Ô – Ô – –
United Arab Emirates Ô Ô – – –
Malaysia Ô Ô Ô Ô –
Bahrain Ô Ô Ô Ô –
Qatar Ô Ô – – –
Iran Ô Ô Ô Ô Ô
Thailand Ô Ô Ô – –
Oman Ô Ô Ô – –
Chile Ô Ô – Ô –
Georgia Ô Ô Ô – –
Jordan Ô Ô Ô Ô –
Kuwait Ô – Ô – –
Lebanon Ô Ô Ô Ô –
Saudi Arabia Ô Ô – – –
Morocco Ô Ô – – –
Botswana (9) Ô Ô – – –
Egypt Ô – Ô Ô –
South Africa (9) Ô Ô – – –
Ó Score significantly higher than Australia’s.
Ô Score significantly lower than Australia’s.
• Score not significantly different to that of Australia.
– Did not participate in this cycle.
68 TIMSS 2015: A first look at Australia’s results
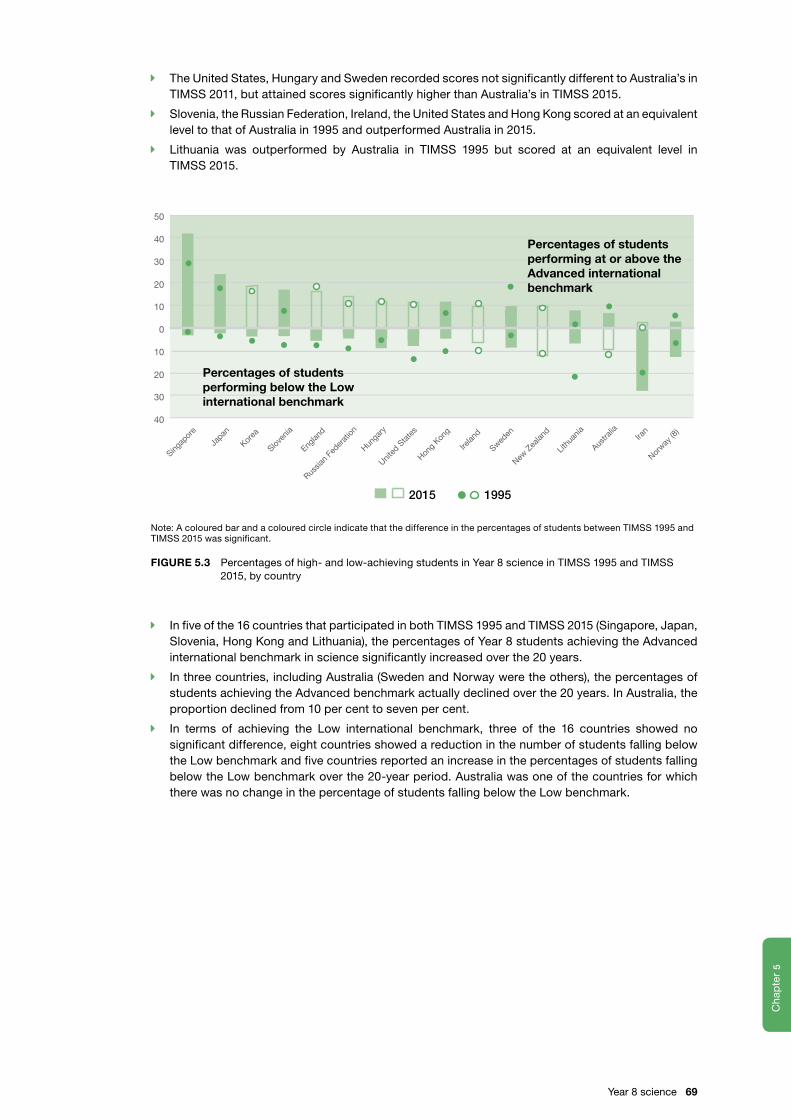
5C
hap
ter
5C
hapter
Î The United States, Hungary and Sweden recorded scores not significantly different to Australia’s in TIMSS 2011, but attained scores significantly higher than Australia’s in TIMSS 2015.
Î Slovenia, the Russian Federation, Ireland, the United States and Hong Kong scored at an equivalent level to that of Australia in 1995 and outperformed Australia in 2015.
Î Lithuania was outperformed by Australia in TIMSS 1995 but scored at an equivalent level in TIMSS 2015.
20
20
40
30
10
0
10
30
40
50
Percentages of students performing below the Low international benchmark
Percentages of students performing at or above theAdvanced international benchmark
Singap
ore
Korea
Japan
Hong
Kong
Russia
n Fe
derat
ion
United
Sta
tes
Lithu
ania
Sweden
Englan
d
Austra
lia
Irelan
d
New Z
ealan
d
2015 1995
Sloven
ia
Hunga
ryIra
n
Norway
(8)
Note: A coloured bar and a coloured circle indicate that the difference in the percentages of students between TIMSS 1995 and TIMSS 2015 was significant.
FIGURE 5.3 Percentages of high- and low-achieving students in Year 8 science in TIMSS 1995 and TIMSS 2015, by country
Î In five of the 16 countries that participated in both TIMSS 1995 and TIMSS 2015 (Singapore, Japan, Slovenia, Hong Kong and Lithuania), the percentages of Year 8 students achieving the Advanced international benchmark in science significantly increased over the 20 years.
Î In three countries, including Australia (Sweden and Norway were the others), the percentages of students achieving the Advanced benchmark actually declined over the 20 years. In Australia, the proportion declined from 10 per cent to seven per cent.
Î In terms of achieving the Low international benchmark, three of the 16 countries showed no significant difference, eight countries showed a reduction in the number of students falling below the Low benchmark and five countries reported an increase in the percentages of students falling below the Low benchmark over the 20-year period. Australia was one of the countries for which there was no change in the percentage of students falling below the Low benchmark.
Year 8 science 69
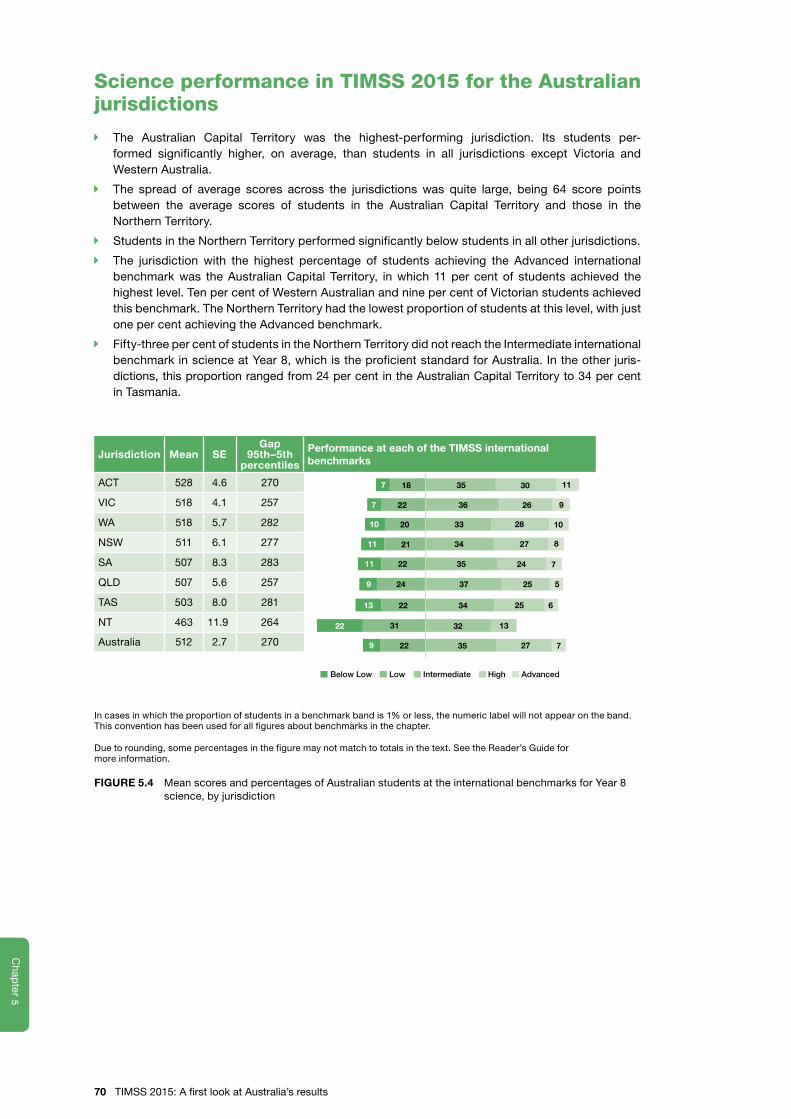
5C
hap
ter
5C
hapter
Science performance in TIMSS 2015 for the Australian jurisdictions
Î The Australian Capital Territory was the highest-performing jurisdiction. Its students per-formed significantly higher, on average, than students in all jurisdictions except Victoria and Western Australia.
Î The spread of average scores across the jurisdictions was quite large, being 64 score points between the average scores of students in the Australian Capital Territory and those in the Northern Territory.
Î Students in the Northern Territory performed significantly below students in all other jurisdictions.
Î The jurisdiction with the highest percentage of students achieving the Advanced international benchmark was the Australian Capital Territory, in which 11 per cent of students achieved the highest level. Ten per cent of Western Australian and nine per cent of Victorian students achieved this benchmark. The Northern Territory had the lowest proportion of students at this level, with just one per cent achieving the Advanced benchmark.
Î Fifty-three per cent of students in the Northern Territory did not reach the Intermediate international benchmark in science at Year 8, which is the proficient standard for Australia. In the other juris-dictions, this proportion ranged from 24 per cent in the Australian Capital Territory to 34 per cent in Tasmania.
Below Low Low Intermediate High Advanced
2810 24352211 7
25 537249
22 279
22
13 22 25 6
1331
35
32
34
27 8342111
33 102010
26 922 367
28
30 1118 357
7
Jurisdiction Mean SEGap
95th–5th percentiles
Performance at each of the TIMSS international benchmarks
ACT 528 4.6 270
VIC 518 4.1 257
WA 518 5.7 282
NSW 511 6.1 277
SA 507 8.3 283
QLD 507 5.6 257
TAS 503 8.0 281
NT 463 11.9 264
Australia 512 2.7 270
In cases in which the proportion of students in a benchmark band is 1% or less, the numeric label will not appear on the band. This convention has been used for all figures about benchmarks in the chapter.
Due to rounding, some percentages in the figure may not match to totals in the text. See the Reader’s Guide for more information.
FIGURE 5.4 Mean scores and percentages of Australian students at the international benchmarks for Year 8 science, by jurisdiction
70 TIMSS 2015: A first look at Australia’s results
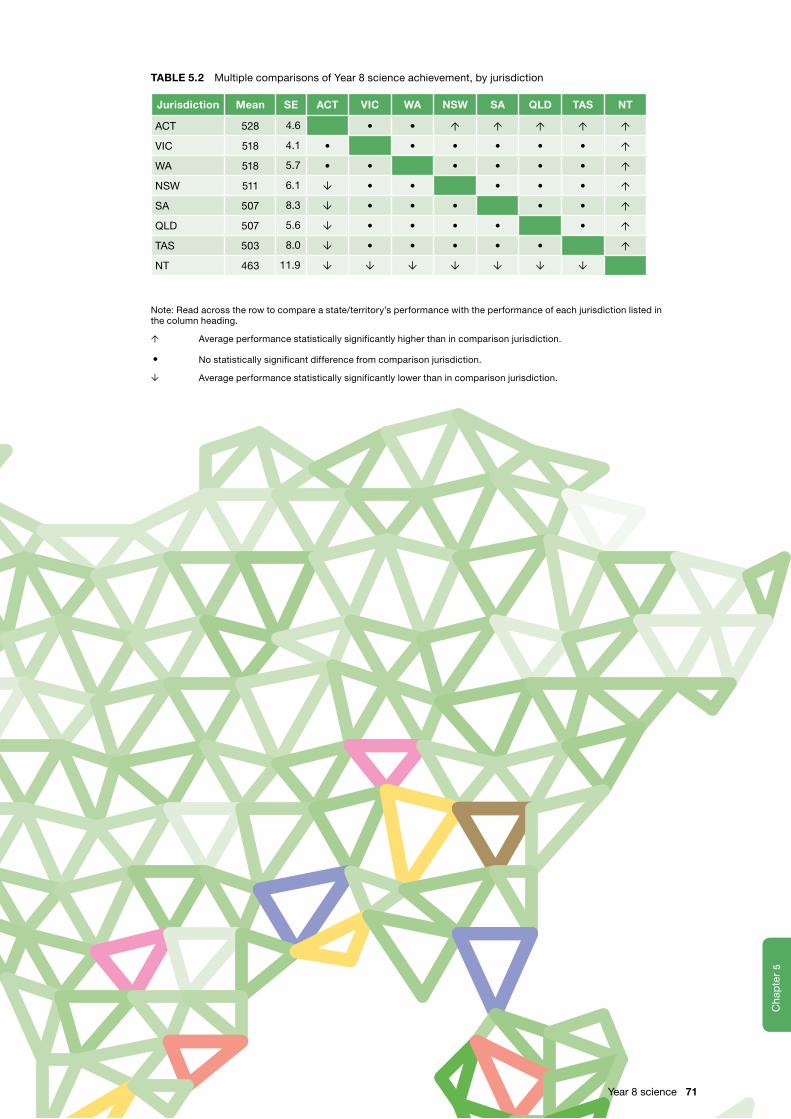
5C
hap
ter
5C
hapter
TABLE 5.2 Multiple comparisons of Year 8 science achievement, by jurisdiction
Jurisdiction Mean SE ACT VIC WA NSW SA QLD TAS NT
ACT 528 4.6 • • Ó Ó Ó Ó Ó
VIC 518 4.1 • • • • • • Ó
WA 518 5.7 • • • • • • Ó
NSW 511 6.1 Ô • • • • • Ó
SA 507 8.3 Ô • • • • • Ó
QLD 507 5.6 Ô • • • • • Ó
TAS 503 8.0 Ô • • • • • Ó
NT 463 11.9 Ô Ô Ô Ô Ô Ô Ô
Note: Read across the row to compare a state/territory’s performance with the performance of each jurisdiction listed in the column heading.
Ó Average performance statistically significantly higher than in comparison jurisdiction.
• No statistically significant difference from comparison jurisdiction.
Ô Average performance statistically significantly lower than in comparison jurisdiction.
Year 8 science 71
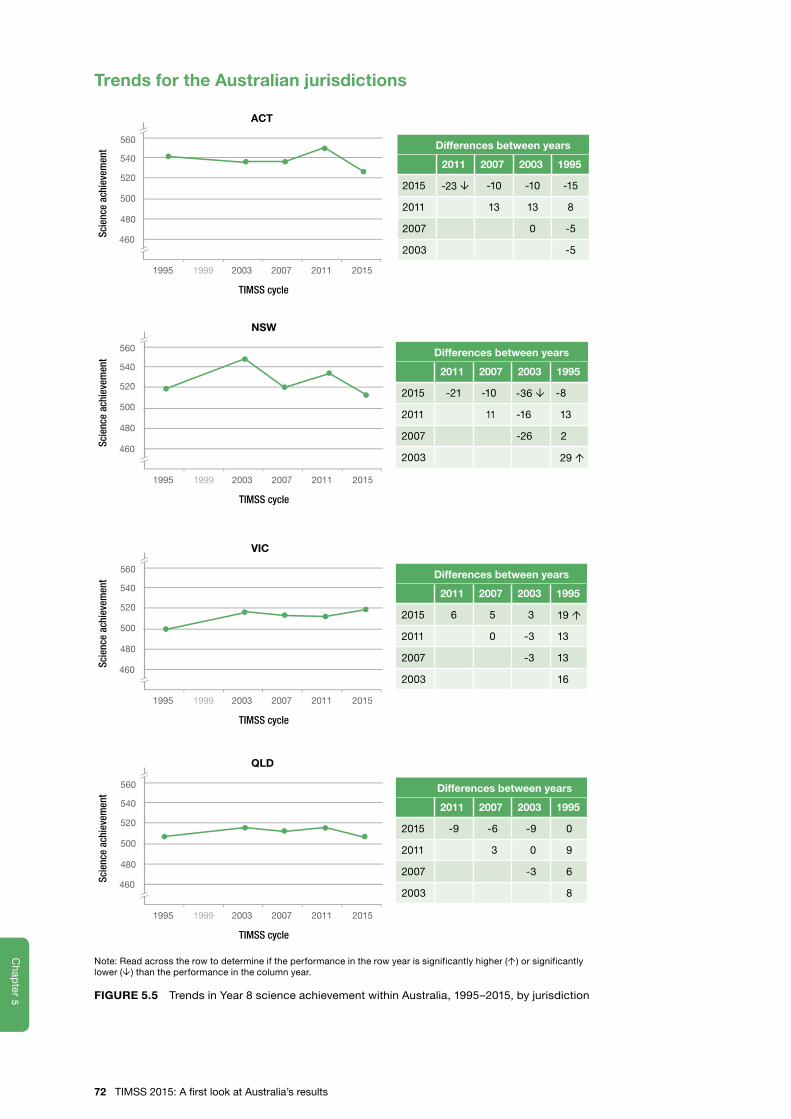
5C
hap
ter
5C
hapter
Trends for the Australian jurisdictions
1995 2003 2007 2011 2015
560
TIMSS cycle
1999
ACT
Scie
nce
achi
evem
ent
480
500
520
540
460
Differences between years
2011 2007 2003 1995
2015 -23 Ô -10 -10 -15
2011 13 13 8
2007 0 -5
2003 -5
560
480
500
520
540
1995 2003 2007 2011 2015
TIMSS cycle
1999
NSW
Scie
nce
achi
evem
ent
460
Differences between years
2011 2007 2003 1995
2015 -21 -10 -36 Ô -8
2011 11 -16 13
2007 -26 2
2003 29 Ó
560
1995 2003 2007 2011 2015
TIMSS cycle
1999
VIC
Scie
nce
achi
evem
ent
480
500
520
540
460
Differences between years
2011 2007 2003 1995
2015 6 5 3 19 Ó
2011 0 -3 13
2007 -3 13
2003 16
560
480
500
520
540
1995 2003 2007 2011 2015
TIMSS cycle
1999
QLD
Scie
nce
achi
evem
ent
460
Differences between years
2011 2007 2003 1995
2015 -9 -6 -9 0
2011 3 0 9
2007 -3 6
2003 8
Note: Read across the row to determine if the performance in the row year is significantly higher (Ó) or significantly lower (Ô) than the performance in the column year.
FIGURE 5.5 Trends in Year 8 science achievement within Australia, 1995–2015, by jurisdiction
72 TIMSS 2015: A first look at Australia’s results
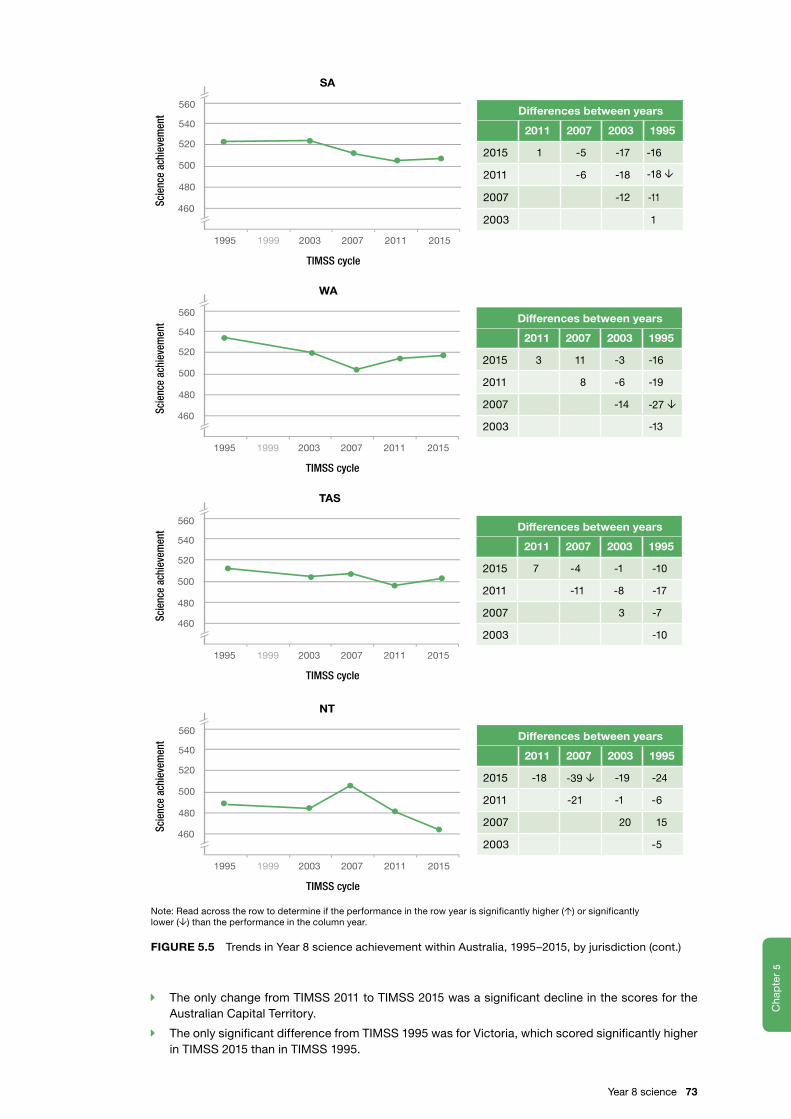
5C
hap
ter
5C
hapter
560
480
500
520
540
1995 2003 2007 2011 2015
TIMSS cycle
1999
SA
Scie
nce
achi
evem
ent
460
Differences between years
2011 2007 2003 1995
2015 1 -5 -17 -16
2011 -6 -18 -18 Ô
2007 -12 -11
2003 1
560
480
500
520
540
1995 2003 2007 2011 2015
TIMSS cycle
1999
WA
Scie
nce
achi
evem
ent
460
Differences between years
2011 2007 2003 1995
2015 3 11 -3 -16
2011 8 -6 -19
2007 -14 -27 Ô
2003 -13
560
480
500
520
540
1995 2003 2007 2011 2015
TIMSS cycle
1999
TAS
Scie
nce
achi
evem
ent
460
Differences between years
2011 2007 2003 1995
2015 7 -4 -1 -10
2011 -11 -8 -17
2007 3 -7
2003 -10
560
480
500
520
540
1995 2003 2007 2011 2015
TIMSS cycle
1999
NT
Scie
nce
achi
evem
ent
460
Differences between years
2011 2007 2003 1995
2015 -18 -39 Ô -19 -24
2011 -21 -1 -6
2007 20 15
2003 -5
Note: Read across the row to determine if the performance in the row year is significantly higher (Ó) or significantly lower (Ô) than the performance in the column year.
FIGURE 5.5 Trends in Year 8 science achievement within Australia, 1995–2015, by jurisdiction (cont.)
Î The only change from TIMSS 2011 to TIMSS 2015 was a significant decline in the scores for the Australian Capital Territory.
Î The only significant difference from TIMSS 1995 was for Victoria, which scored significantly higher in TIMSS 2015 than in TIMSS 1995.
Year 8 science 73
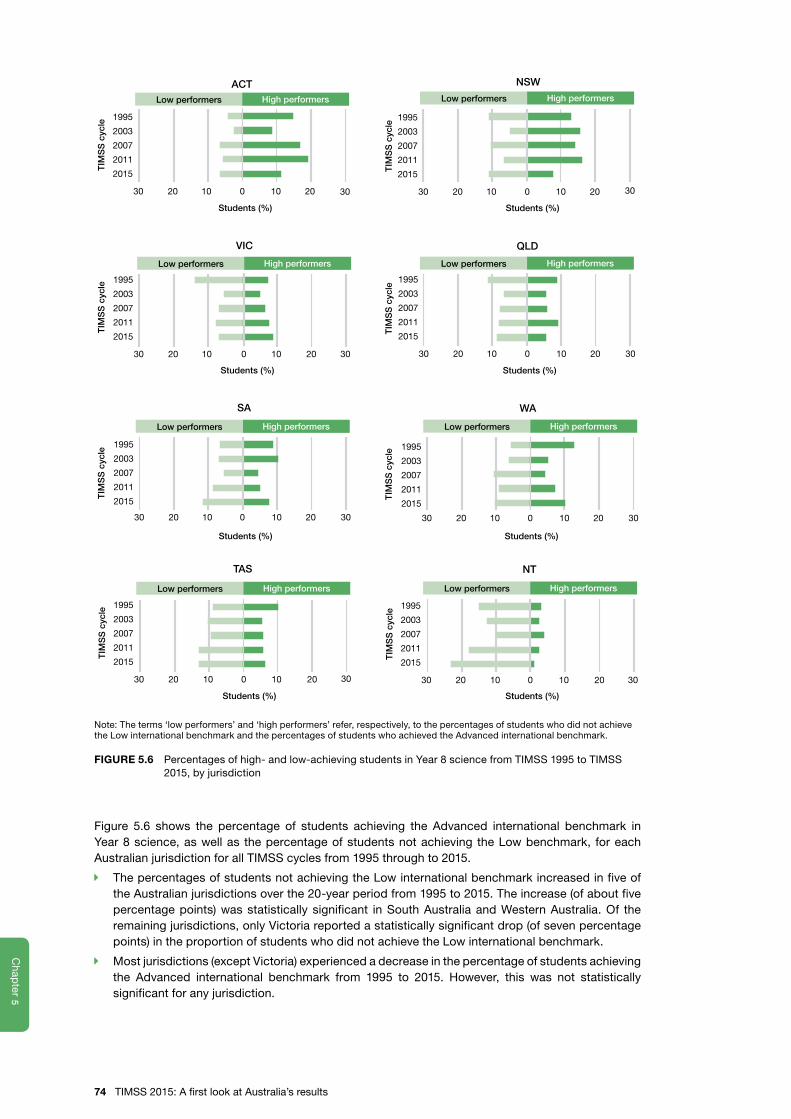
5C
hap
ter
5C
hapter
High performersLow performers
High performersLow performers High performersLow performers
High performersLow performers
High performersLow performers High performersLow performers
High performersLow performers High performersLow performers
TIM
SS
cyc
le
Students (%)
TIM
SS
cyc
le
Students (%)
0 10 20102030
1995
2003
2007
2011
2015
30
0 10 20102030
1995
2003
2007
2011
2015
30
VIC
NSW
QLD
SA WA
0 10 20102030
1995
2003
2007
2011
2015
30 0 10 20102030
1995
2003
2007
2011
2015
30
0 10 20102030
1995
2003
2007
2011
2015
30
0 10 20102030
1995
2003
2007
2011
2015
30 0 10 20102030
1995
2003
2007
2011
2015
30
TAS NT
0 10 20102030
1995
2003
2007
2011
2015
30
TIM
SS
cyc
le
Students (%)
TIM
SS
cyc
le
Students (%)
TIM
SS
cyc
le
Students (%)
TIM
SS
cyc
le
Students (%)
TIM
SS
cyc
le
Students (%)
TIM
SS
cyc
le
Students (%)
ACT
Note: The terms ‘low performers’ and ‘high performers’ refer, respectively, to the percentages of students who did not achieve the Low international benchmark and the percentages of students who achieved the Advanced international benchmark.
FIGURE 5.6 Percentages of high- and low-achieving students in Year 8 science from TIMSS 1995 to TIMSS 2015, by jurisdiction
Figure 5.6 shows the percentage of students achieving the Advanced international benchmark in Year 8 science, as well as the percentage of students not achieving the Low benchmark, for each Australian jurisdiction for all TIMSS cycles from 1995 through to 2015.
Î The percentages of students not achieving the Low international benchmark increased in five of the Australian jurisdictions over the 20-year period from 1995 to 2015. The increase (of about five percentage points) was statistically significant in South Australia and Western Australia. Of the remaining jurisdictions, only Victoria reported a statistically significant drop (of seven percentage points) in the proportion of students who did not achieve the Low international benchmark.
Î Most jurisdictions (except Victoria) experienced a decrease in the percentage of students achieving the Advanced international benchmark from 1995 to 2015. However, this was not statistically significant for any jurisdiction.
74 TIMSS 2015: A first look at Australia’s results
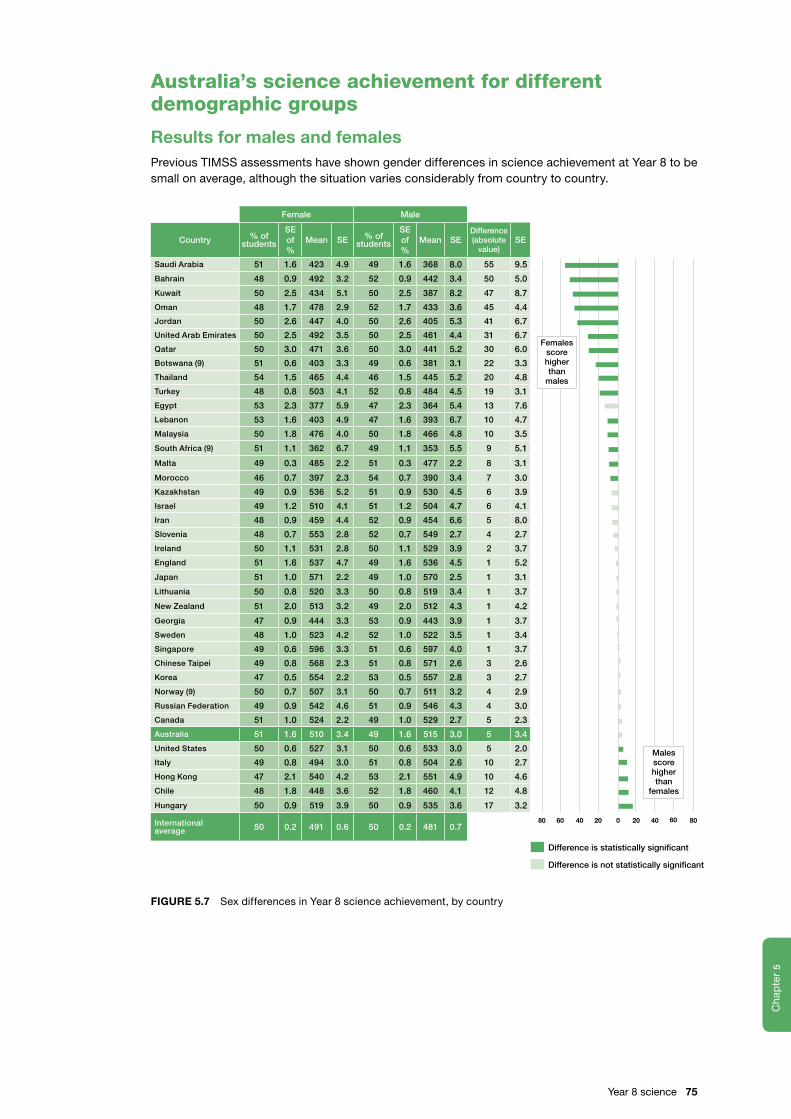
5C
hap
ter
5C
hapter
Australia’s science achievement for different demographic groups
Results for males and femalesPrevious TIMSS assessments have shown gender differences in science achievement at Year 8 to be small on average, although the situation varies considerably from country to country.
Female Male
Country % ofstudents
SEof %
Mean SE % ofstudents
SEof %
Mean SEDifference (absolute
value)SE
Saudi Arabia 51 1.6 423 4.9 49 1.6 368 8.0 55 9.5
Bahrain 48 0.9 492 3.2 52 0.9 442 3.4 50 5.0
Kuwait 50 2.5 434 5.1 50 2.5 387 8.2 47 8.7
Oman 48 1.7 478 2.9 52 1.7 433 3.6 45 4.4
Jordan 50 2.6 447 4.0 50 2.6 405 5.3 41 6.7
United Arab Emirates 50 2.5 492 3.5 50 2.5 461 4.4 31 6.7
Qatar 50 3.0 471 3.6 50 3.0 441 5.2 30 6.0
Botswana (9) 51 0.6 403 3.3 49 0.6 381 3.1 22 3.3
Thailand 54 1.5 465 4.4 46 1.5 445 5.2 20 4.8
Turkey 48 0.8 503 4.1 52 0.8 484 4.5 19 3.1
Egypt 53 2.3 377 5.9 47 2.3 364 5.4 13 7.6
Lebanon 53 1.6 403 4.9 47 1.6 393 6.7 10 4.7
Malaysia 50 1.8 476 4.0 50 1.8 466 4.8 10 3.5
South Africa (9) 51 1.1 362 6.7 49 1.1 353 5.5 9 5.1
Malta 49 0.3 485 2.2 51 0.3 477 2.2 8 3.1
Morocco 46 0.7 397 2.3 54 0.7 390 3.4 7 3.0
Kazakhstan 49 0.9 536 5.2 51 0.9 530 4.5 6 3.9
Israel 49 1.2 510 4.1 51 1.2 504 4.7 6 4.1
Iran 48 0.9 459 4.4 52 0.9 454 6.6 5 8.0
Slovenia 48 0.7 553 2.8 52 0.7 549 2.7 4 2.7
Ireland 50 1.1 531 2.8 50 1.1 529 3.9 2 3.7
England 51 1.6 537 4.7 49 1.6 536 4.5 1 5.2
Japan 51 1.0 571 2.2 49 1.0 570 2.5 1 3.1
Lithuania 50 0.8 520 3.3 50 0.8 519 3.4 1 3.7
New Zealand 51 2.0 513 3.2 49 2.0 512 4.3 1 4.2
Georgia 47 0.9 444 3.3 53 0.9 443 3.9 1 3.7
Sweden 48 1.0 523 4.2 52 1.0 522 3.5 1 3.4
Singapore 49 0.6 596 3.3 51 0.6 597 4.0 1 3.7
Chinese Taipei 49 0.8 568 2.3 51 0.8 571 2.6 3 2.6
Korea 47 0.5 554 2.2 53 0.5 557 2.8 3 2.7
Norway (9) 50 0.7 507 3.1 50 0.7 511 3.2 4 2.9
Russian Federation 49 0.9 542 4.6 51 0.9 546 4.3 4 3.0
Canada 51 1.0 524 2.2 49 1.0 529 2.7 5 2.3
Australia 51 1.6 510 3.4 49 1.6 515 3.0 5 3.4
United States 50 0.6 527 3.1 50 0.6 533 3.0 5 2.0
Italy 49 0.8 494 3.0 51 0.8 504 2.6 10 2.7
Hong Kong 47 2.1 540 4.2 53 2.1 551 4.9 10 4.6
Chile 48 1.8 448 3.6 52 1.8 460 4.1 12 4.8
Hungary 50 0.9 519 3.9 50 0.9 535 3.6 17 3.2
International average 50 0.2 491 0.6 50 0.2 481 0.7
0 20 40 60 8080 60 40 20
Difference is statistically significant
Difference is not statistically significant
Femalesscorehigherthan
males
Malesscorehigherthan
females
FIGURE 5.7 Sex differences in Year 8 science achievement, by country
Year 8 science 75
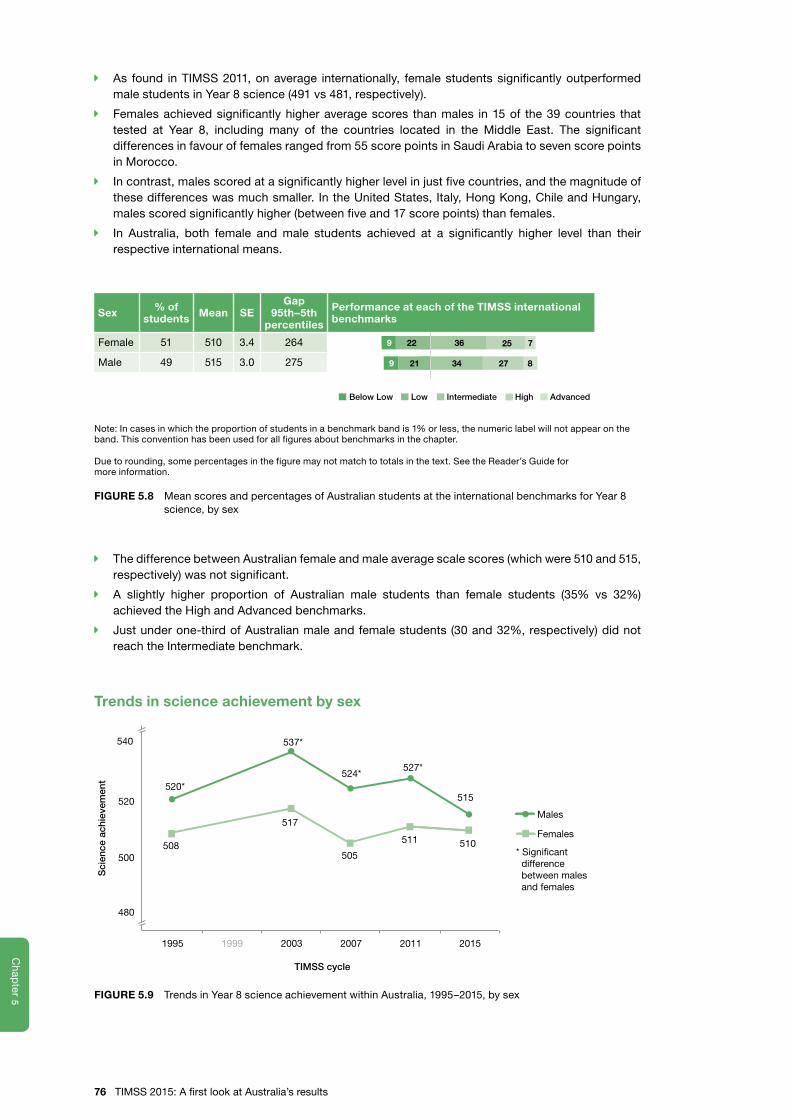
5C
hap
ter
5C
hapter
Î As found in TIMSS 2011, on average internationally, female students significantly outperformed male students in Year 8 science (491 vs 481, respectively).
Î Females achieved significantly higher average scores than males in 15 of the 39 countries that tested at Year 8, including many of the countries located in the Middle East. The significant differences in favour of females ranged from 55 score points in Saudi Arabia to seven score points in Morocco.
Î In contrast, males scored at a significantly higher level in just five countries, and the magnitude of these differences was much smaller. In the United States, Italy, Hong Kong, Chile and Hungary, males scored significantly higher (between five and 17 score points) than females.
Î In Australia, both female and male students achieved at a significantly higher level than their respective international means.
Sex % of students Mean SE
Gap 95th–5th
percentiles
Performance at each of the TIMSS international benchmarks
Female 51 510 3.4 264
Male 49 515 3.0 275
Below Low Low Intermediate High Advanced
27 834219
25 736229
Note: In cases in which the proportion of students in a benchmark band is 1% or less, the numeric label will not appear on the band. This convention has been used for all figures about benchmarks in the chapter.
Due to rounding, some percentages in the figure may not match to totals in the text. See the Reader’s Guide for more information.
FIGURE 5.8 Mean scores and percentages of Australian students at the international benchmarks for Year 8 science, by sex
Î The difference between Australian female and male average scale scores (which were 510 and 515, respectively) was not significant.
Î A slightly higher proportion of Australian male students than female students (35% vs 32%) achieved the High and Advanced benchmarks.
Î Just under one-third of Australian male and female students (30 and 32%, respectively) did not reach the Intermediate benchmark.
Trends in science achievement by sex
508
537*
505
527*
515520*
517
524*
511 510
480
500
520
540
1995 1999 2003 2007 2011 2015
Sci
ence
ach
ieve
men
t
Males
Females
TIMSS cycle
* Signi�cant difference between males and females
FIGURE 5.9 Trends in Year 8 science achievement within Australia, 1995–2015, by sex
76 TIMSS 2015: A first look at Australia’s results
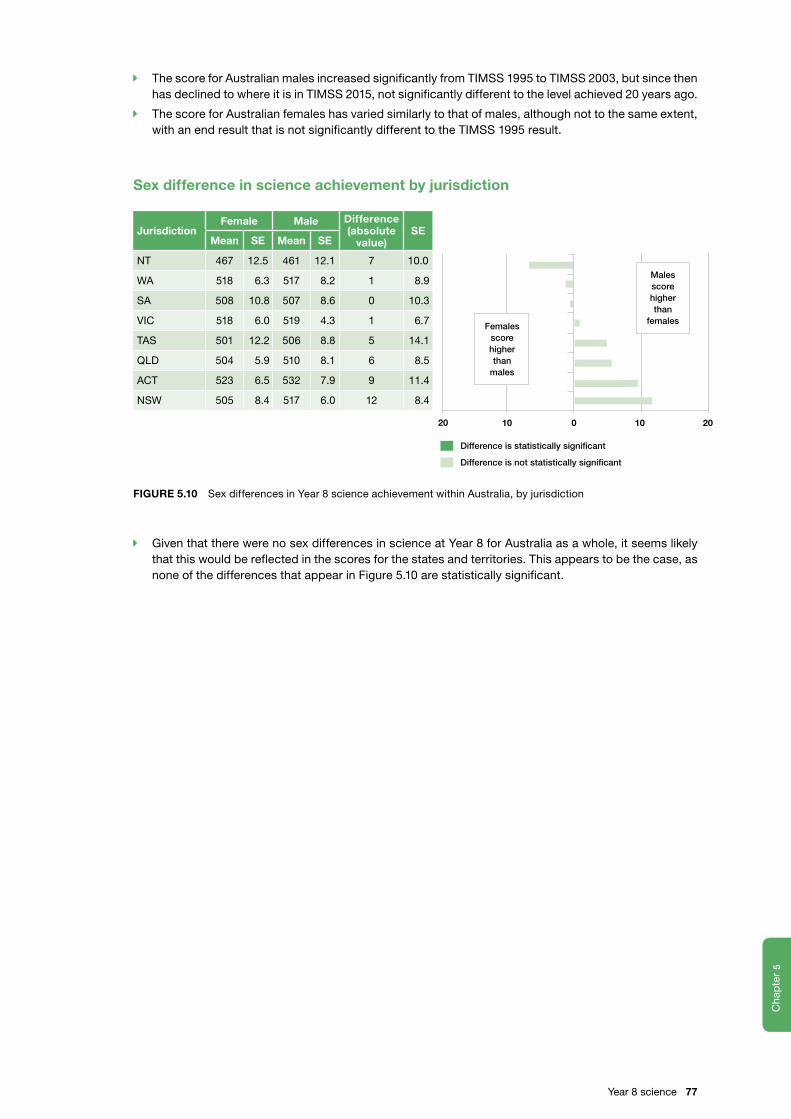
5C
hap
ter
5C
hapter
Î The score for Australian males increased significantly from TIMSS 1995 to TIMSS 2003, but since then has declined to where it is in TIMSS 2015, not significantly different to the level achieved 20 years ago.
Î The score for Australian females has varied similarly to that of males, although not to the same extent, with an end result that is not significantly different to the TIMSS 1995 result.
Sex difference in science achievement by jurisdiction
JurisdictionFemale Male Difference
(absolute value)
SEMean SE Mean SE
NT 467 12.5 461 12.1 7 10.0
WA 518 6.3 517 8.2 1 8.9
SA 508 10.8 507 8.6 0 10.3
VIC 518 6.0 519 4.3 1 6.7
TAS 501 12.2 506 8.8 5 14.1
QLD 504 5.9 510 8.1 6 8.5
ACT 523 6.5 532 7.9 9 11.4
NSW 505 8.4 517 6.0 12 8.4
10 2010020
Femalesscorehigherthan
males
Malesscorehigherthan
females
Difference is statistically significant
Difference is not statistically significant
FIGURE 5.10 Sex differences in Year 8 science achievement within Australia, by jurisdiction
Î Given that there were no sex differences in science at Year 8 for Australia as a whole, it seems likely that this would be reflected in the scores for the states and territories. This appears to be the case, as none of the differences that appear in Figure 5.10 are statistically significant.
Year 8 science 77
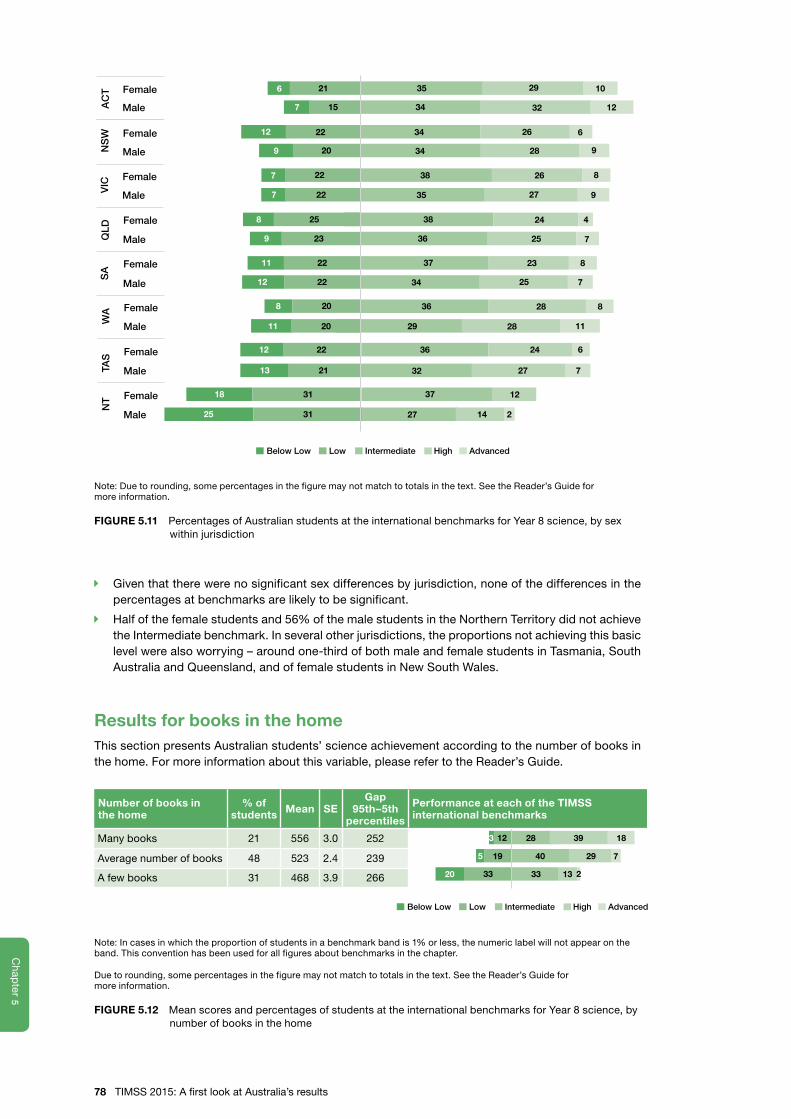
5C
hap
ter
5C
hapter
29 1021 35
32 1234157
26 6342212
28 934209
26 838227
27 935227
24 43825
25 736239
23 8372211
25 7342212
28 836208
28 11292011
24 6362212
27 7322113
37 123118
27 143125 2
Female
MaleAC
T
Female
MaleNS
W
Female
MaleVIC
Female
MaleQLD
Female
Male
SA
Female
MaleWA
Female
MaleTAS
Female
Male
NT
8
Below Low Low Intermediate High Advanced
6
Note: Due to rounding, some percentages in the figure may not match to totals in the text. See the Reader’s Guide for more information.
FIGURE 5.11 Percentages of Australian students at the international benchmarks for Year 8 science, by sex within jurisdiction
Î Given that there were no significant sex differences by jurisdiction, none of the differences in the percentages at benchmarks are likely to be significant.
Î Half of the female students and 56% of the male students in the Northern Territory did not achieve the Intermediate benchmark. In several other jurisdictions, the proportions not achieving this basic level were also worrying – around one-third of both male and female students in Tasmania, South Australia and Queensland, and of female students in New South Wales.
Results for books in the homeThis section presents Australian students’ science achievement according to the number of books in the home. For more information about this variable, please refer to the Reader’s Guide.
2940195
39 1828123
213333320
Below Low Low Intermediate High Advanced
7
Number of books in the home
% of students Mean SE
Gap 95th–5th
percentiles
Performance at each of the TIMSS international benchmarks
Many books 21 556 3.0 252
Average number of books 48 523 2.4 239
A few books 31 468 3.9 266
Note: In cases in which the proportion of students in a benchmark band is 1% or less, the numeric label will not appear on the band. This convention has been used for all figures about benchmarks in the chapter.
Due to rounding, some percentages in the figure may not match to totals in the text. See the Reader’s Guide for more information.
FIGURE 5.12 Mean scores and percentages of students at the international benchmarks for Year 8 science, by number of books in the home
78 TIMSS 2015: A first look at Australia’s results
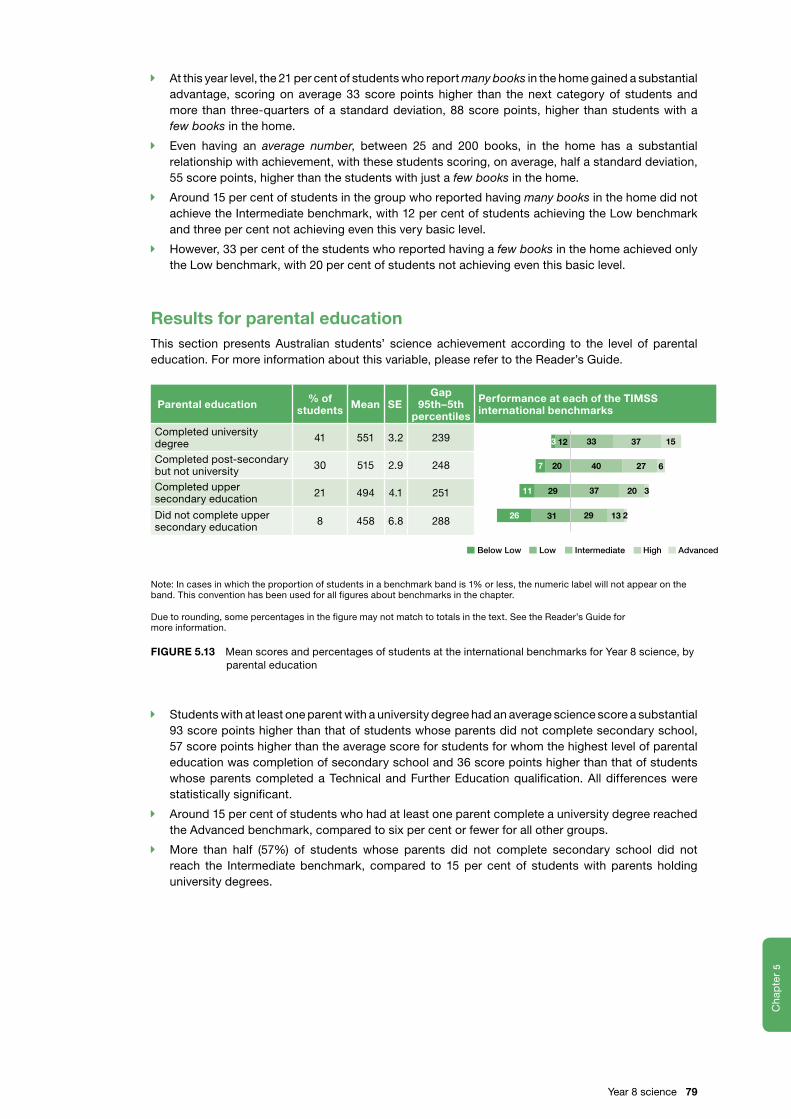
5C
hap
ter
5C
hapter
Î At this year level, the 21 per cent of students who report many books in the home gained a substantial advantage, scoring on average 33 score points higher than the next category of students and more than three-quarters of a standard deviation, 88 score points, higher than students with a few books in the home.
Î Even having an average number, between 25 and 200 books, in the home has a substantial relationship with achievement, with these students scoring, on average, half a standard deviation, 55 score points, higher than the students with just a few books in the home.
Î Around 15 per cent of students in the group who reported having many books in the home did not achieve the Intermediate benchmark, with 12 per cent of students achieving the Low benchmark and three per cent not achieving even this very basic level.
Î However, 33 per cent of the students who reported having a few books in the home achieved only the Low benchmark, with 20 per cent of students not achieving even this basic level.
Results for parental educationThis section presents Australian students’ science achievement according to the level of parental education. For more information about this variable, please refer to the Reader’s Guide.
Parental education % of students Mean SE
Gap 95th–5th
percentiles
Performance at each of the TIMSS international benchmarks
Completed university degree 41 551 3.2 239
Completed post-secondary but not university 30 515 2.9 248
Completed upper secondary education 21 494 4.1 251
Did not complete upper secondary education 8 458 6.8 288 3126 13
29 37 20 311
Below Low Low Intermediate High Advanced
20 40 27 67
3312 37 153
29 2
Note: In cases in which the proportion of students in a benchmark band is 1% or less, the numeric label will not appear on the band. This convention has been used for all figures about benchmarks in the chapter.
Due to rounding, some percentages in the figure may not match to totals in the text. See the Reader’s Guide for more information.
FIGURE 5.13 Mean scores and percentages of students at the international benchmarks for Year 8 science, by parental education
Î Students with at least one parent with a university degree had an average science score a substantial 93 score points higher than that of students whose parents did not complete secondary school, 57 score points higher than the average score for students for whom the highest level of parental education was completion of secondary school and 36 score points higher than that of students whose parents completed a Technical and Further Education qualification. All differences were statistically significant.
Î Around 15 per cent of students who had at least one parent complete a university degree reached the Advanced benchmark, compared to six per cent or fewer for all other groups.
Î More than half (57%) of students whose parents did not complete secondary school did not reach the Intermediate benchmark, compared to 15 per cent of students with parents holding university degrees.
Year 8 science 79
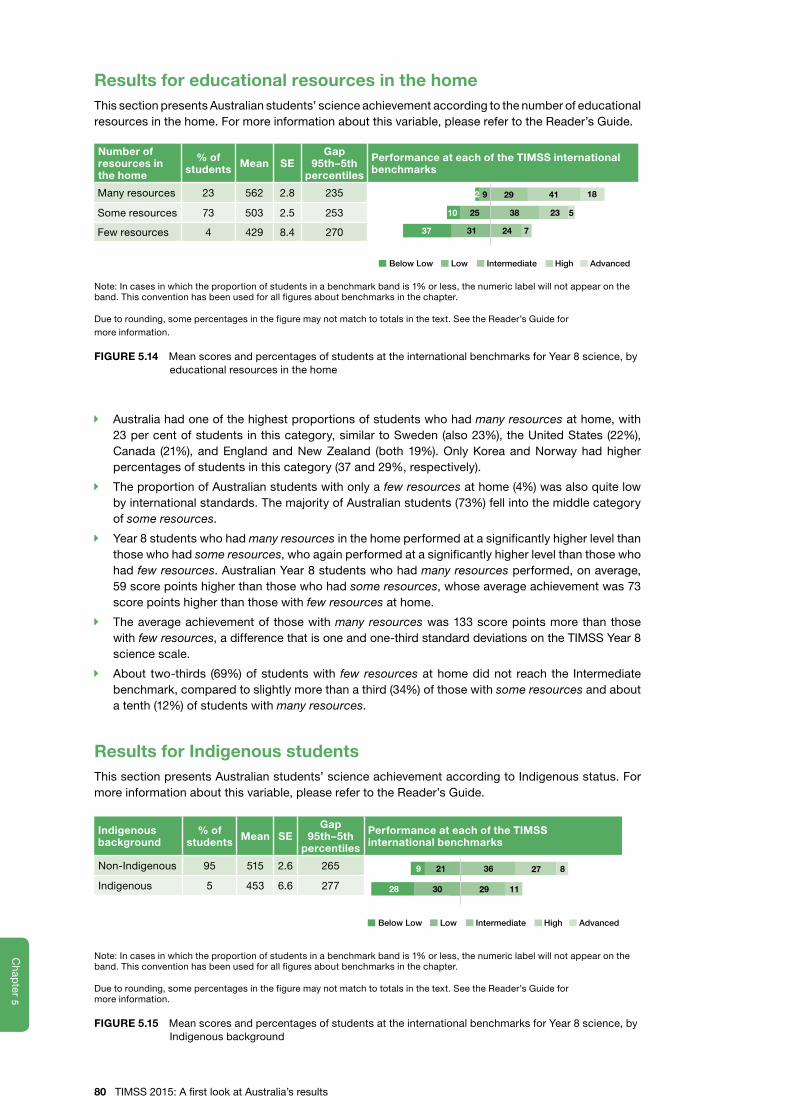
5C
hap
ter
5C
hapter
Results for educational resources in the homeThis section presents Australian students’ science achievement according to the number of educational resources in the home. For more information about this variable, please refer to the Reader’s Guide.
23382510
41 182992
7243137
Below Low Low Intermediate High Advanced
5
Number of resources in the home
% of students Mean SE
Gap 95th–5th
percentiles
Performance at each of the TIMSS international benchmarks
Many resources 23 562 2.8 235
Some resources 73 503 2.5 253
Few resources 4 429 8.4 270
Note: In cases in which the proportion of students in a benchmark band is 1% or less, the numeric label will not appear on the band. This convention has been used for all figures about benchmarks in the chapter.
Due to rounding, some percentages in the figure may not match to totals in the text. See the Reader’s Guide for more information.
FIGURE 5.14 Mean scores and percentages of students at the international benchmarks for Year 8 science, by educational resources in the home
Î Australia had one of the highest proportions of students who had many resources at home, with 23 per cent of students in this category, similar to Sweden (also 23%), the United States (22%), Canada (21%), and England and New Zealand (both 19%). Only Korea and Norway had higher percentages of students in this category (37 and 29%, respectively).
Î The proportion of Australian students with only a few resources at home (4%) was also quite low by international standards. The majority of Australian students (73%) fell into the middle category of some resources.
Î Year 8 students who had many resources in the home performed at a significantly higher level than those who had some resources, who again performed at a significantly higher level than those who had few resources. Australian Year 8 students who had many resources performed, on average, 59 score points higher than those who had some resources, whose average achievement was 73 score points higher than those with few resources at home.
Î The average achievement of those with many resources was 133 score points more than those with few resources, a difference that is one and one-third standard deviations on the TIMSS Year 8 science scale.
Î About two-thirds (69%) of students with few resources at home did not reach the Intermediate benchmark, compared to slightly more than a third (34%) of those with some resources and about a tenth (12%) of students with many resources.
Results for Indigenous studentsThis section presents Australian students’ science achievement according to Indigenous status. For more information about this variable, please refer to the Reader’s Guide.
Indigenous background
% of students Mean SE
Gap 95th–5th
percentiles
Performance at each of the TIMSS international benchmarks
Non-Indigenous 95 515 2.6 265
Indigenous 5 453 6.6 277
Below Low Low Intermediate High Advanced
11293028
27 836219
Note: In cases in which the proportion of students in a benchmark band is 1% or less, the numeric label will not appear on the band. This convention has been used for all figures about benchmarks in the chapter.
Due to rounding, some percentages in the figure may not match to totals in the text. See the Reader’s Guide for more information.
FIGURE 5.15 Mean scores and percentages of students at the international benchmarks for Year 8 science, by Indigenous background
80 TIMSS 2015: A first look at Australia’s results

5C
hap
ter
5C
hapter
Î At Year 8 in science, Indigenous students achieved an average score of 453, which is 62 score points less than the average score for non-Indigenous students of 515 score points.
Î Year 8 Australian Indigenous students’ average science score was also significantly lower than the international scale average of 500 points.
Î One per cent of Indigenous students achieved the Advanced benchmark, compared to eight per cent of non-Indigenous students.
Î At the other end of the achievement spectrum, 28 per cent of Year 8 Indigenous students did not reach the Low benchmark, compared to nine per cent of non-Indigenous students, while a total of 58 per cent of Indigenous students and 30 per cent of non-Indigenous students did not achieve the Intermediate benchmark.
439
530*
447
524* 515*517*
458
519*
459453
Non-Indigenous
400
500
550
1995 1999 2003 2007 2011 2015
Sci
ence
ach
ieve
men
t
Indigenous
TIMSS cycle
* Signi�cant difference between Indigenous and non-Indigenous
450
FIGURE 5.16 Trends in Year 8 science achievement within Australia, 1995–2015, by Indigenous background
Î The only significant difference in scores between any TIMSS cycle is that non-Indigenous students’ scores have declined significantly between TIMSS 2003 and TIMSS 2015.
Î The difference between Indigenous and non-Indigenous students is significant, as it has been in each year of testing, and has not decreased measurably over 20 years.
Results for language spoken at homeThis section presents Australian students’ science achievement according to whether a language other than English is spoken as the main language at home. For more information about this variable, please refer to the Reader’s Guide.
Language spoken at home
% of students Mean SE
Gap 95th–5th
percentiles
Performance at each of the TIMSS international benchmarks
English 93 514 2.4 263
Other 7 498 8.6 317
2636228
925252218
Below Low Low Intermediate High Advanced
7
Note: In cases in which the proportion of students in a benchmark band is 1% or less, the numeric label will not appear on the band. This convention has been used for all figures about benchmarks in the chapter.
Due to rounding, some percentages in the figure may not match to totals in the text. See the Reader’s Guide for more information.
FIGURE 5.17 Mean scores and percentages of students at the international benchmarks for Year 8 science, by language spoken at home
Year 8 science 81
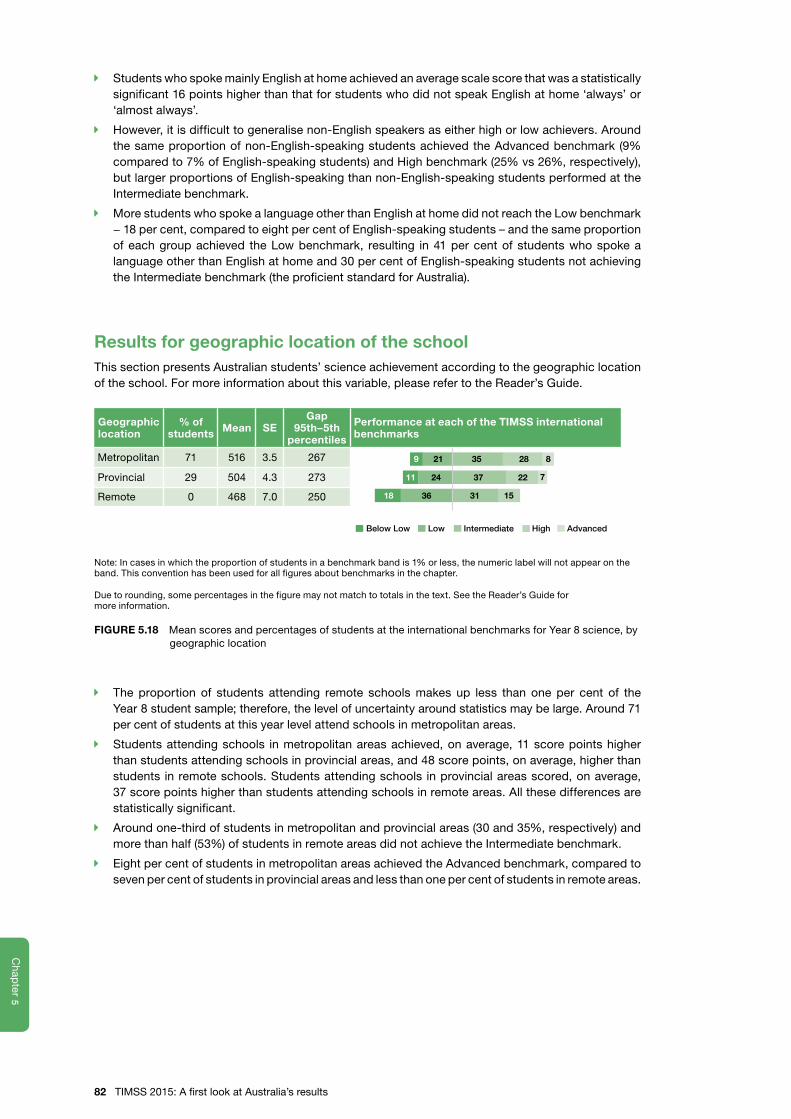
<Chapter Num
ber>C
hap
ter
5C
hapter
Î Students who spoke mainly English at home achieved an average scale score that was a statistically significant 16 points higher than that for students who did not speak English at home ‘always’ or ‘almost always’.
Î However, it is difficult to generalise non-English speakers as either high or low achievers. Around the same proportion of non-English-speaking students achieved the Advanced benchmark (9% compared to 7% of English-speaking students) and High benchmark (25% vs 26%, respectively), but larger proportions of English-speaking than non-English-speaking students performed at the Intermediate benchmark.
Î More students who spoke a language other than English at home did not reach the Low benchmark − 18 per cent, compared to eight per cent of English-speaking students – and the same proportion of each group achieved the Low benchmark, resulting in 41 per cent of students who spoke a language other than English at home and 30 per cent of English-speaking students not achieving the Intermediate benchmark (the proficient standard for Australia).
Results for geographic location of the schoolThis section presents Australian students’ science achievement according to the geographic location of the school. For more information about this variable, please refer to the Reader’s Guide.
Below Low Low Intermediate High Advanced
22372411
28 835219
15313618
7
Geographic location
% of students Mean SE
Gap 95th–5th
percentiles
Performance at each of the TIMSS international benchmarks
Metropolitan 71 516 3.5 267
Provincial 29 504 4.3 273
Remote 0 468 7.0 250
Note: In cases in which the proportion of students in a benchmark band is 1% or less, the numeric label will not appear on the band. This convention has been used for all figures about benchmarks in the chapter.
Due to rounding, some percentages in the figure may not match to totals in the text. See the Reader’s Guide for more information.
FIGURE 5.18 Mean scores and percentages of students at the international benchmarks for Year 8 science, by geographic location
Î The proportion of students attending remote schools makes up less than one per cent of the Year 8 student sample; therefore, the level of uncertainty around statistics may be large. Around 71 per cent of students at this year level attend schools in metropolitan areas.
Î Students attending schools in metropolitan areas achieved, on average, 11 score points higher than students attending schools in provincial areas, and 48 score points, on average, higher than students in remote schools. Students attending schools in provincial areas scored, on average, 37 score points higher than students attending schools in remote areas. All these differences are statistically significant.
Î Around one-third of students in metropolitan and provincial areas (30 and 35%, respectively) and more than half (53%) of students in remote areas did not achieve the Intermediate benchmark.
Î Eight per cent of students in metropolitan areas achieved the Advanced benchmark, compared to seven per cent of students in provincial areas and less than one per cent of students in remote areas.
82 TIMSS 2015: A first look at Australia’s results
TIM
SS
2015
Su
e Th
om
son N
icole W
ernert E
lizab
eth O’G
rady S
ima R
od
rigu
es
acer.edu.au