
Timothy Papandreou - Director de Planeación Estratégica y Política Pública. SFMTA.
57
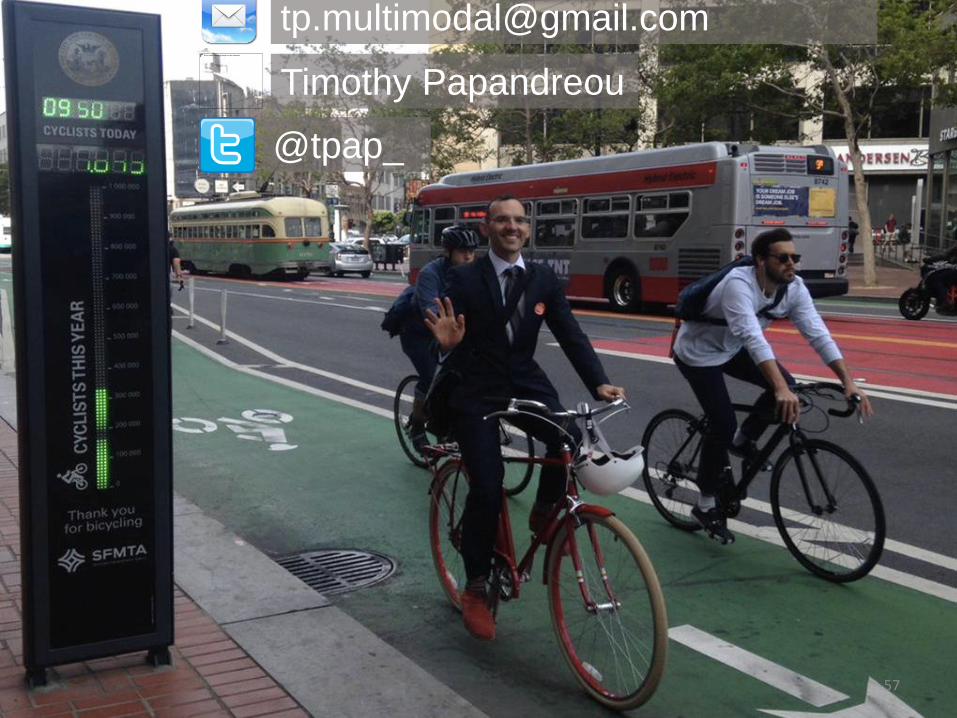
San Francisco Transport Strategy Timothy Papandreou Director- Strategic Planning & Policy @tpap_
-
Upload
observatic-externado -
Category
Education
-
view
17 -
download
1
Transcript of Timothy Papandreou - Director de Planeación Estratégica y Política Pública. SFMTA.
San Francisco Transport Strategy
Timothy Papandreou Director- Strategic Planning & Policy
@tpap_
Focus on People
All-in-one Agency
Citizen led process
Designed by Timothy Papandreou 2012
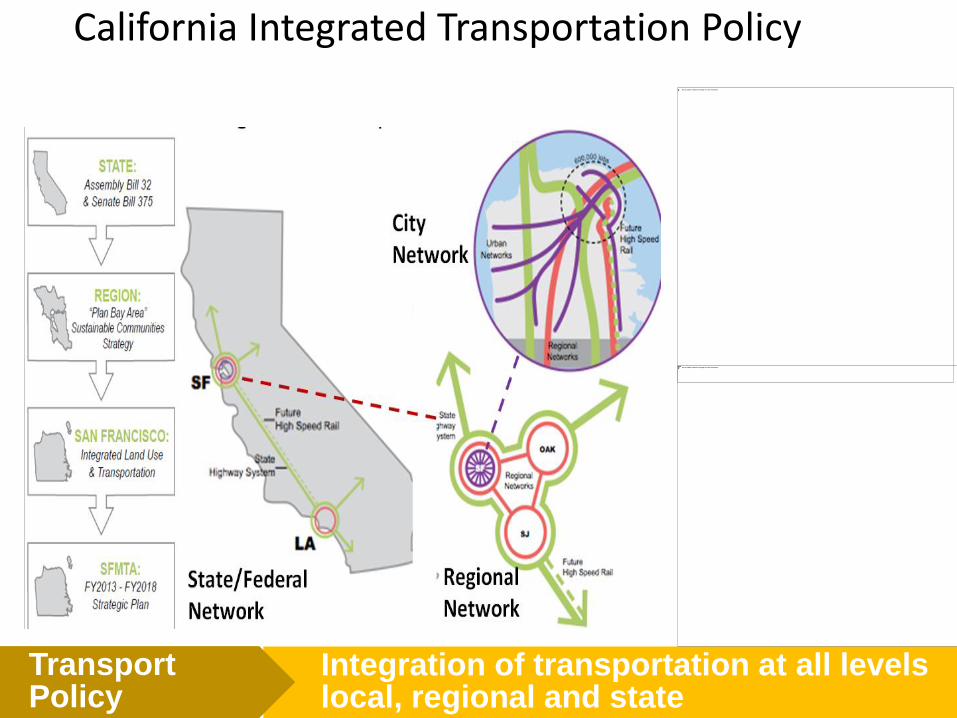
3Integration of transportation at all levelslocal, regional and state
Transport Policy
California Integrated Transportation Policy
25% of all trips by Public Transit. System is overwhelmed Bicycling potential to relieve peak load while adding capacity
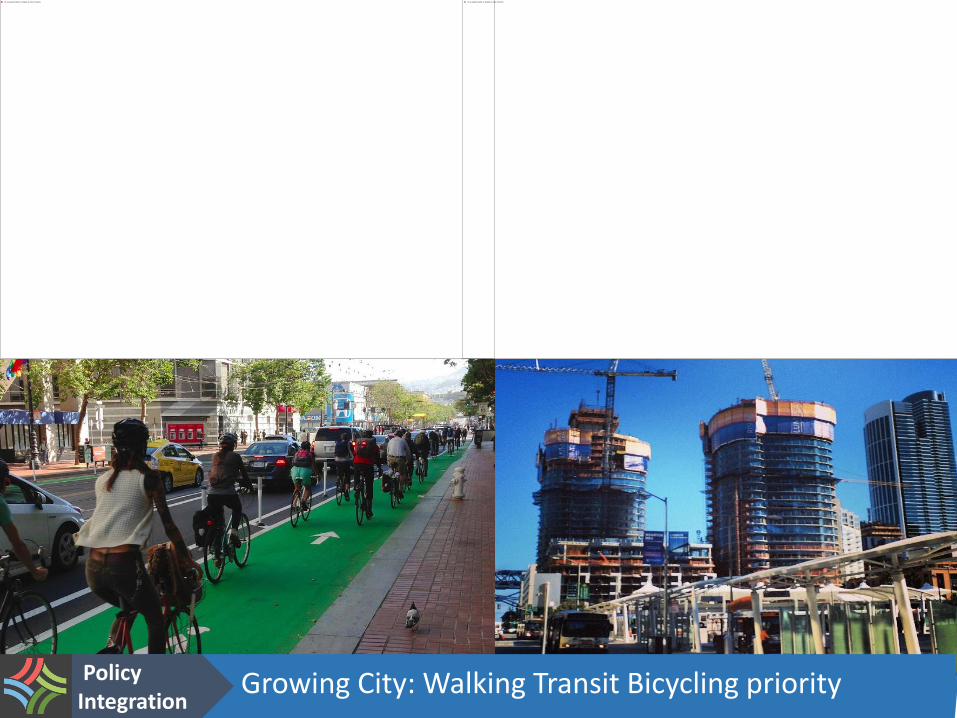
4Policy
IntegrationGrowing City: Walking Transit Bicycling priority
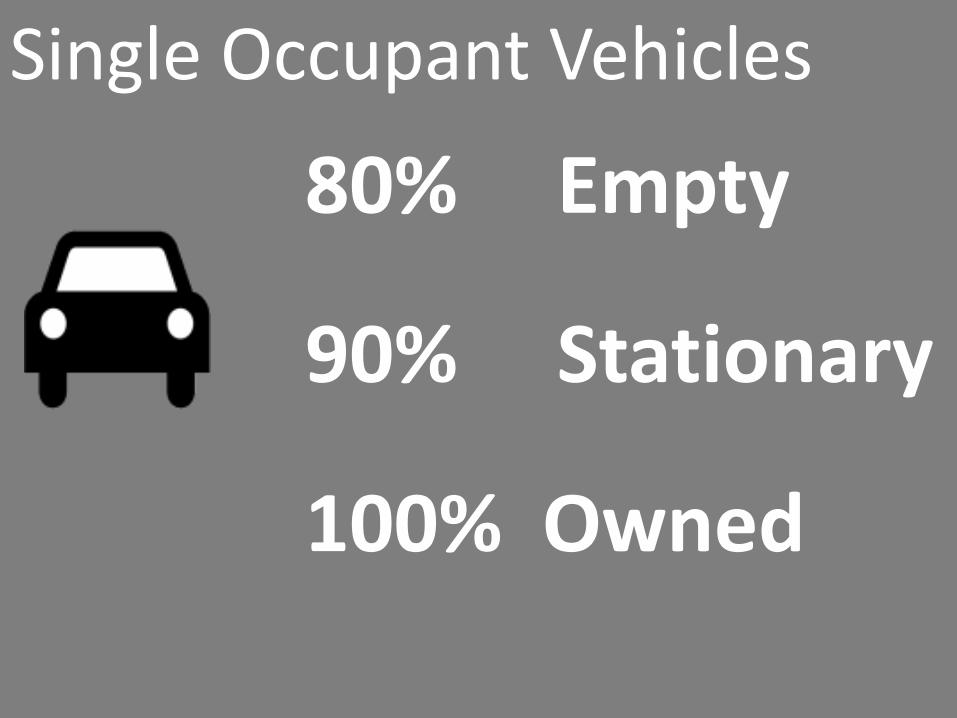
80% Empty
90% Stationary
100% Owned
Single Occupant Vehicles
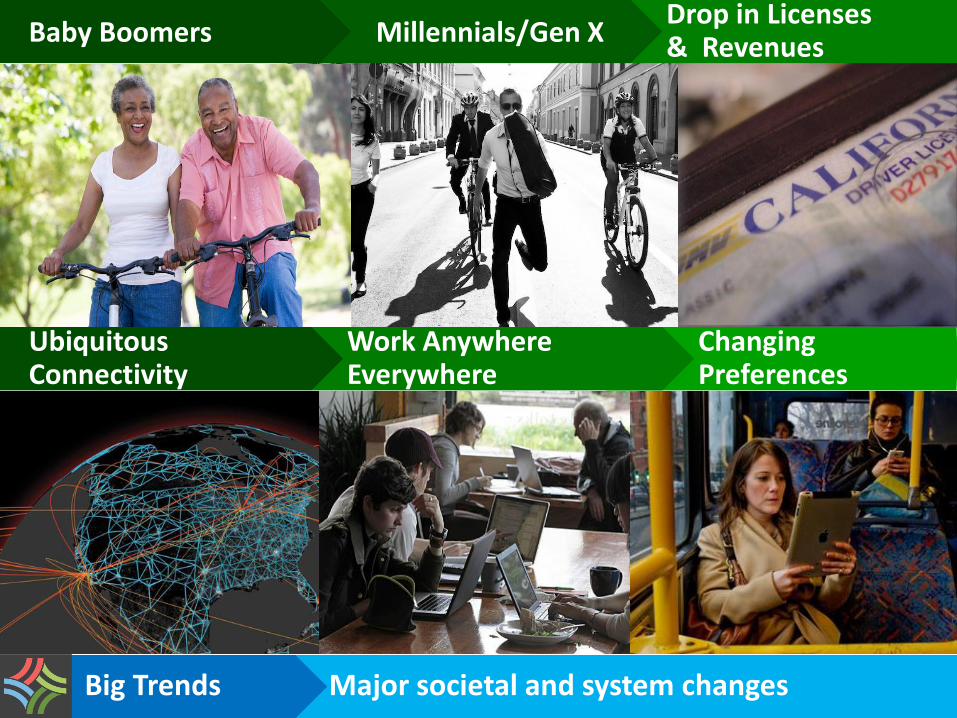
Major societal and system changes Big Trends
Changing Preferences
Drop in Licenses & RevenuesMillennials/Gen XBaby Boomers
Work Anywhere Everywhere
Ubiquitous Connectivity
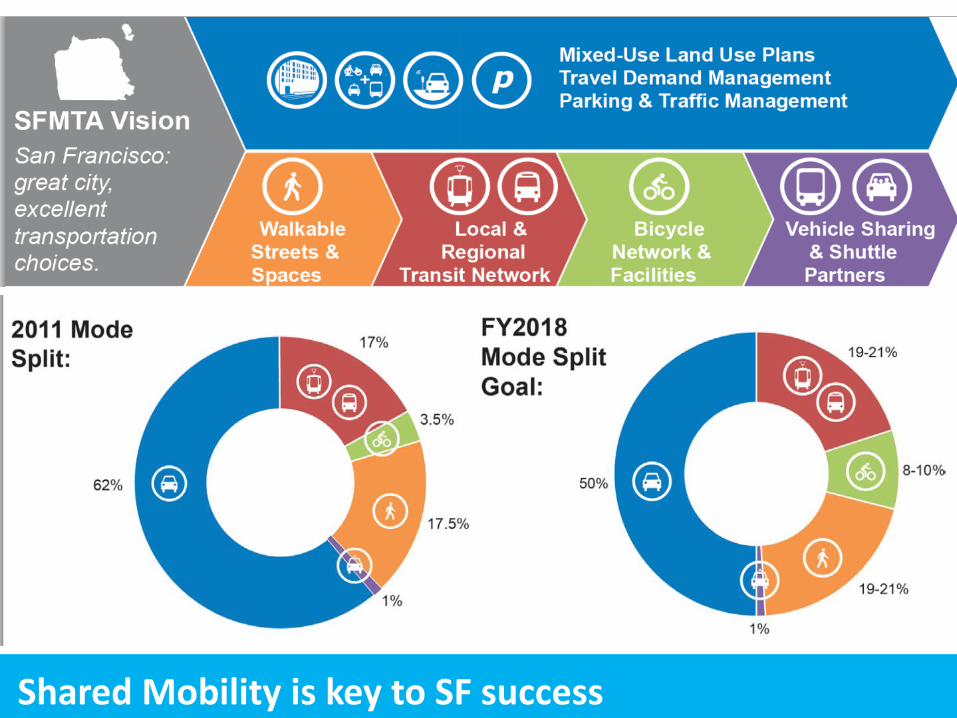
7Shared Mobility is key to SF success
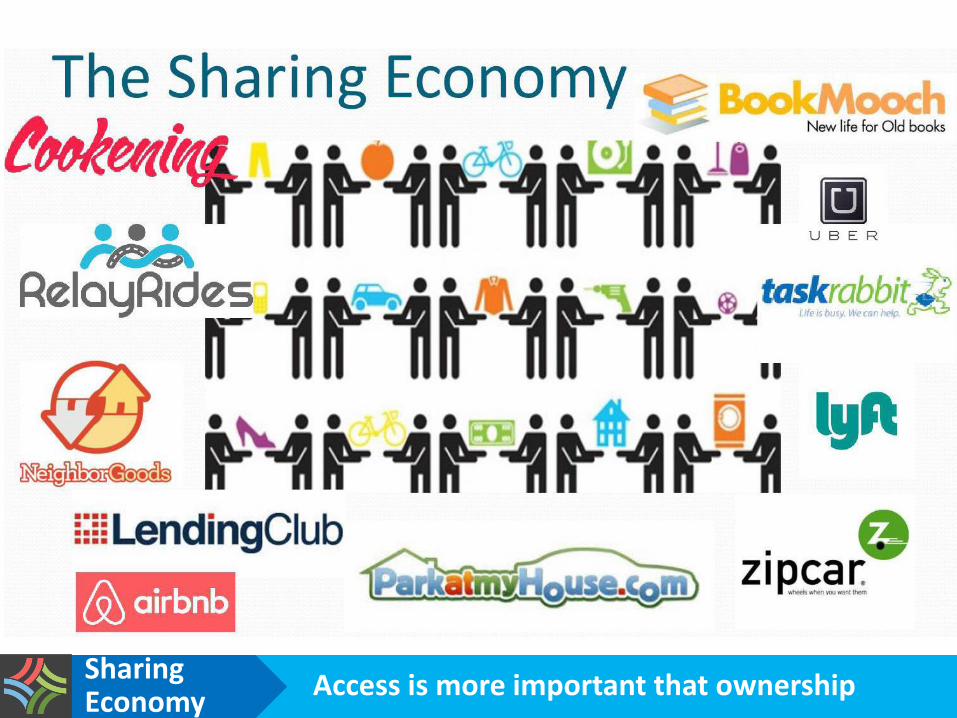
Access is more important that ownershipSharing Economy
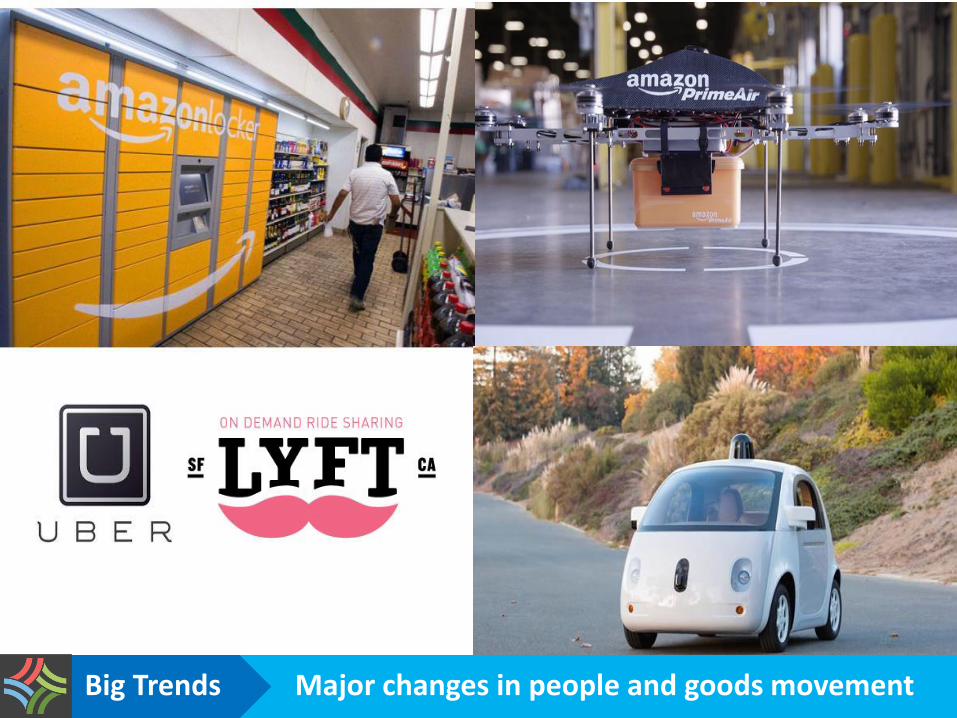
Major changes in people and goods movementBig Trends
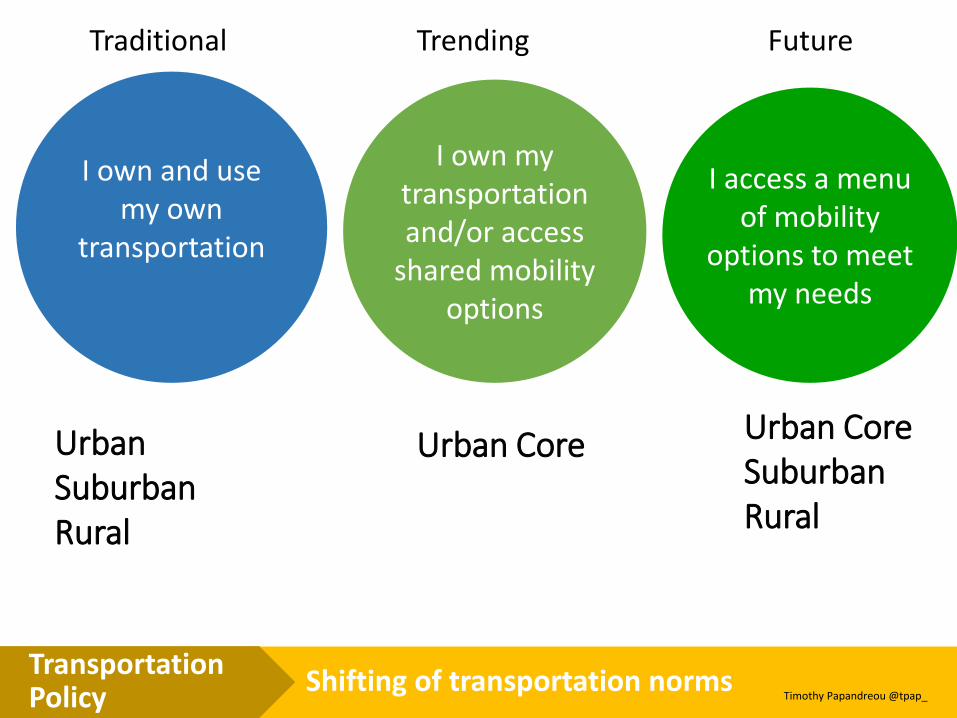
10Shifting of transportation normsTransportation Policy
I own and use my own
transportation
I own my transportation and/or access
shared mobility options
I access a menu of mobility
options to meet my needs
Traditional Trending Future
Urban Core SuburbanRural
UrbanSuburbanRural
Urban Core
Timothy Papandreou @tpap_
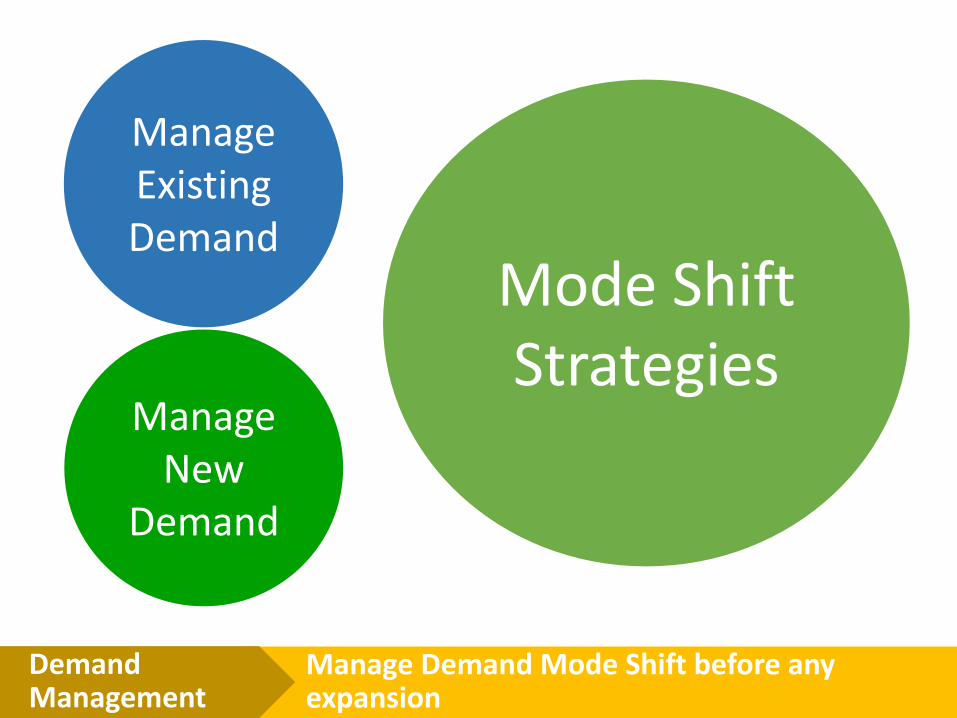
11Manage Demand Mode Shift before any expansion
Demand Management
Manage Existing Demand
Mode ShiftStrategies
Manage New
Demand
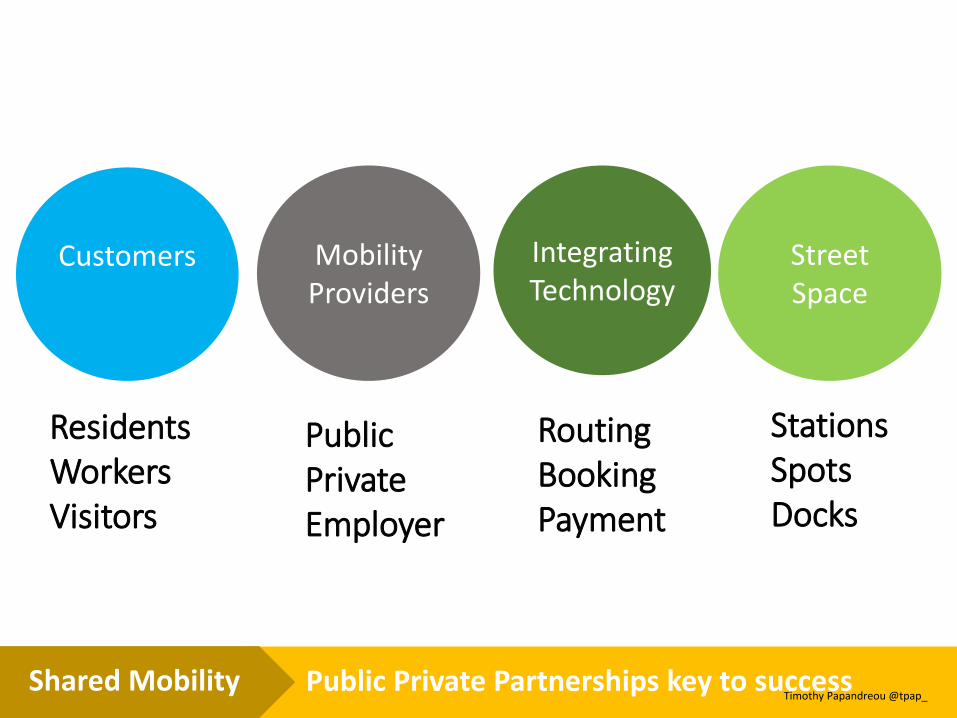
12Public Private Partnerships key to successShared Mobility
Customers Mobility Providers
Integrating Technology
Timothy Papandreou @tpap_
ResidentsWorkersVisitors
Public PrivateEmployer
RoutingBookingPayment
Street Space
StationsSpotsDocks
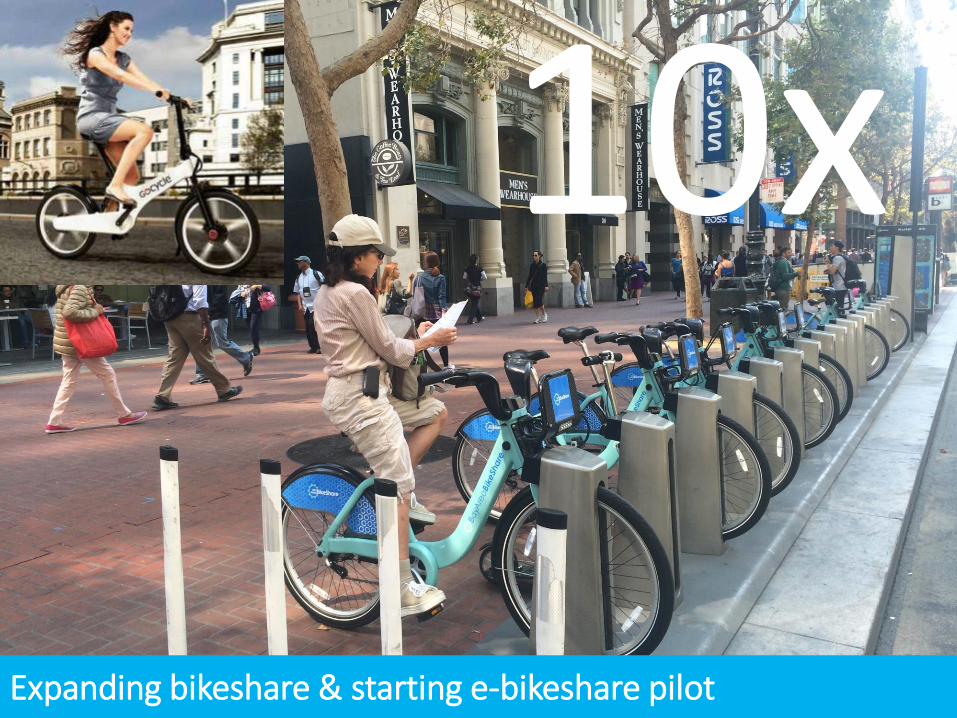
10x
Expanding bikeshare & starting e-bikeshare pilot
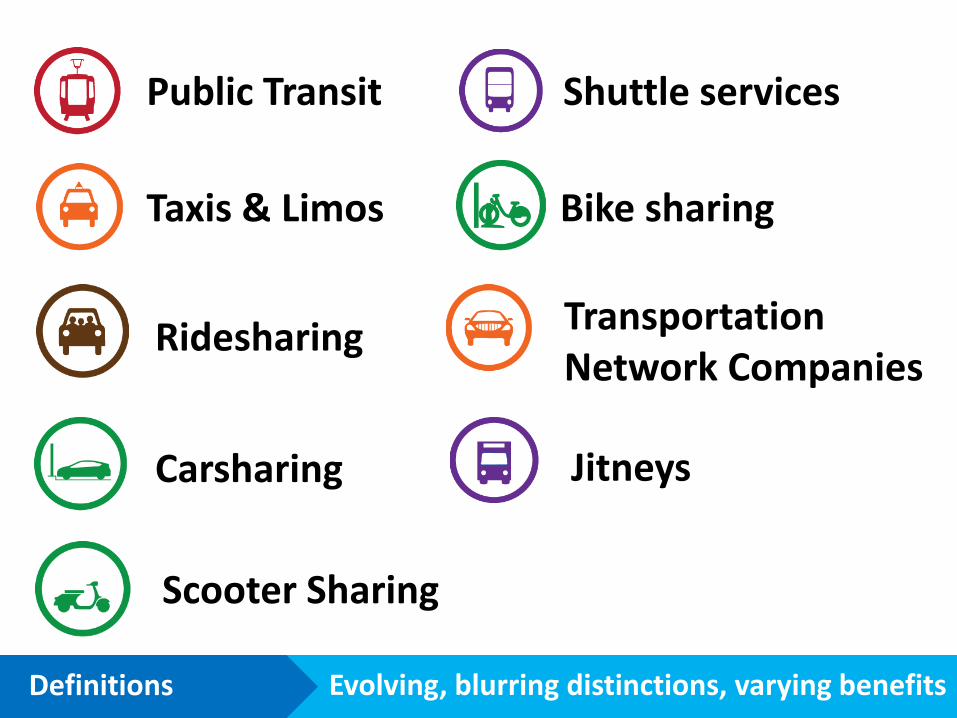
Evolving, blurring distinctions, varying benefits Definitions
Public Transit
Taxis & Limos
Ridesharing
Carsharing
Scooter Sharing
Jitneys
Shuttle services
Bike sharing
Transportation Network Companies
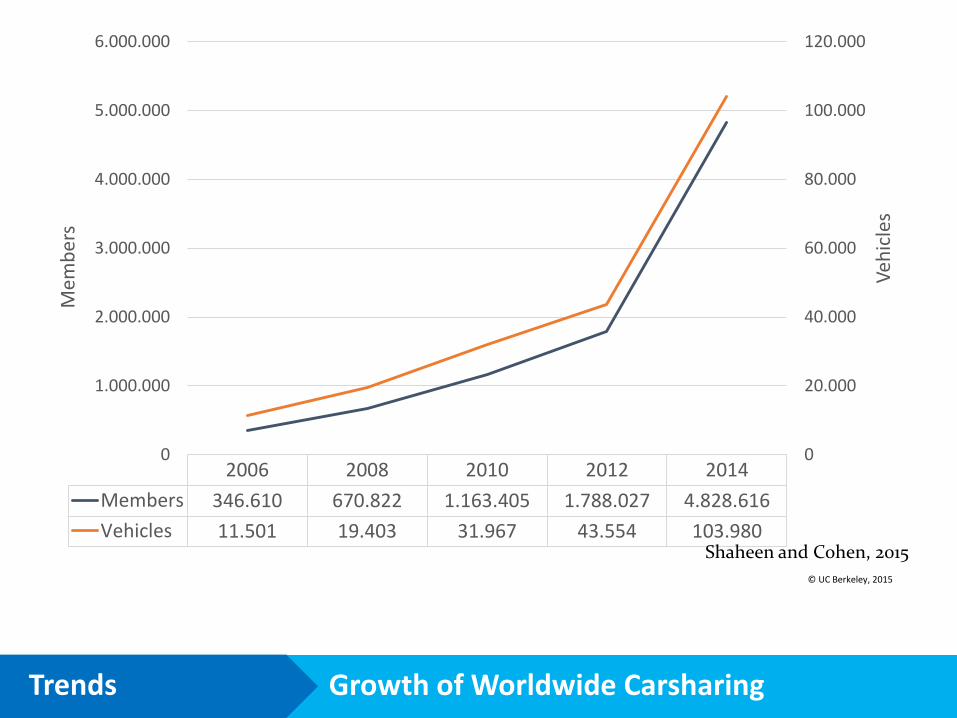
2006 2008 2010 2012 2014
Members 346.610 670.822 1.163.405 1.788.027 4.828.616
Vehicles 11.501 19.403 31.967 43.554 103.980
0
20.000
40.000
60.000
80.000
100.000
120.000
0
1.000.000
2.000.000
3.000.000
4.000.000
5.000.000
6.000.000
Veh
icle
s
Mem
ber
s
Shaheen and Cohen, 2015
© UC Berkeley, 2015
Growth of Worldwide CarsharingTrends
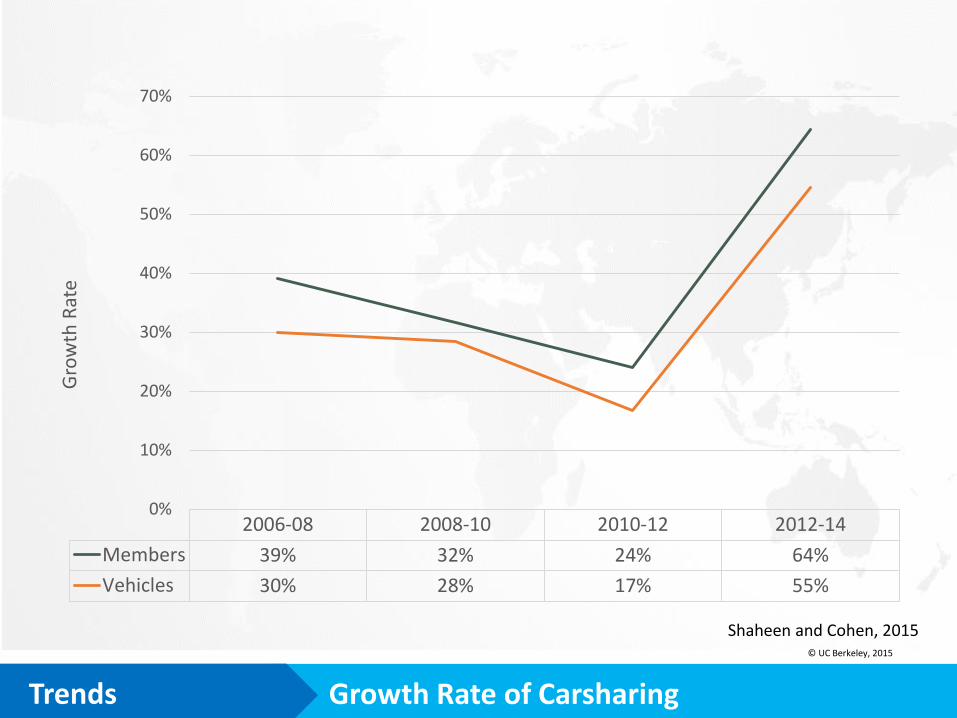
2006-08 2008-10 2010-12 2012-14
Members 39% 32% 24% 64%
Vehicles 30% 28% 17% 55%
0%
10%
20%
30%
40%
50%
60%
70%
Gro
wth
Rat
e
Shaheen and Cohen, 2015© UC Berkeley, 2015
Growth Rate of CarsharingTrends
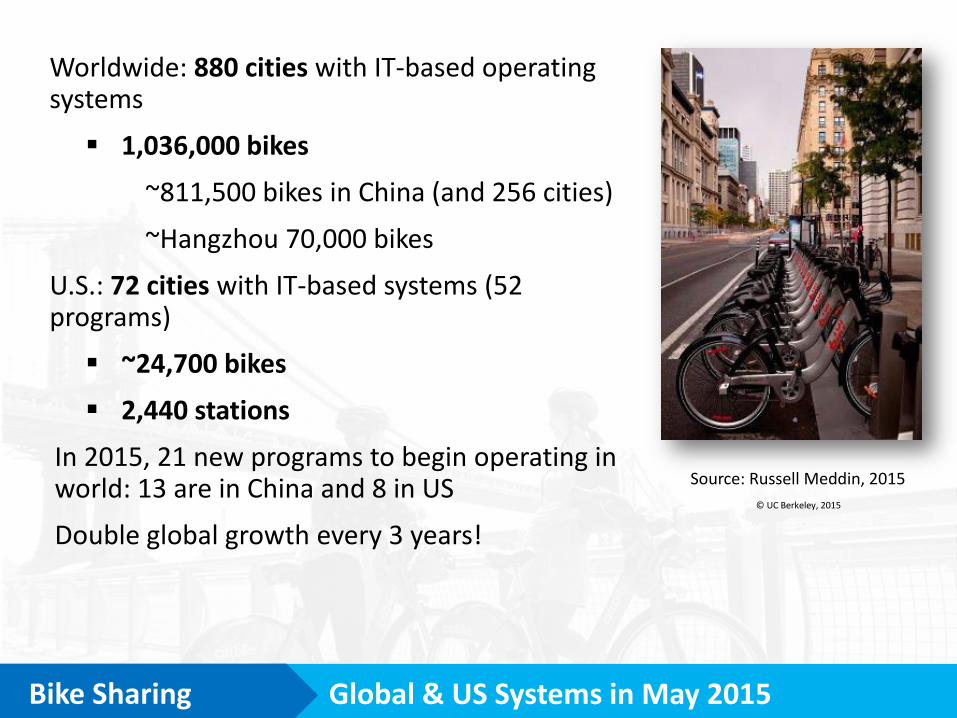
Worldwide: 880 cities with IT-based operating systems
1,036,000 bikes
~811,500 bikes in China (and 256 cities)
~Hangzhou 70,000 bikes
U.S.: 72 cities with IT-based systems (52 programs)
~24,700 bikes
2,440 stations
In 2015, 21 new programs to begin operating in world: 13 are in China and 8 in US
Double global growth every 3 years!© UC Berkeley, 2015
Source: Russell Meddin, 2015
Global & US Systems in May 2015 Bike Sharing
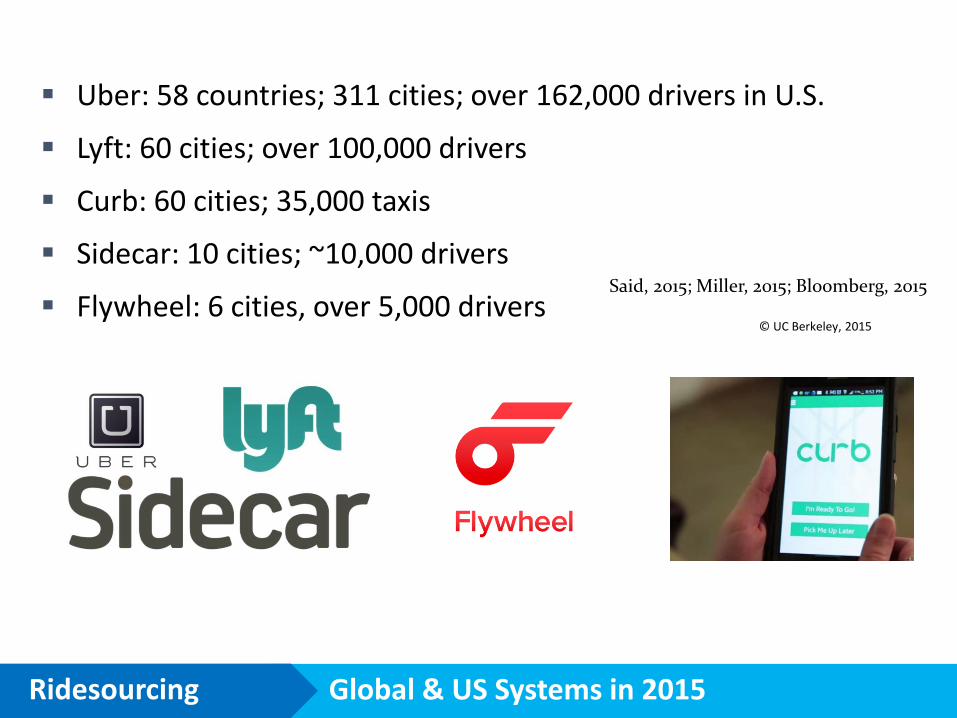
Said, 2015; Miller, 2015; Bloomberg, 2015
© UC Berkeley, 2015
Uber: 58 countries; 311 cities; over 162,000 drivers in U.S.
Lyft: 60 cities; over 100,000 drivers
Curb: 60 cities; 35,000 taxis
Sidecar: 10 cities; ~10,000 drivers
Flywheel: 6 cities, over 5,000 drivers
Global & US Systems in 2015 Ridesourcing
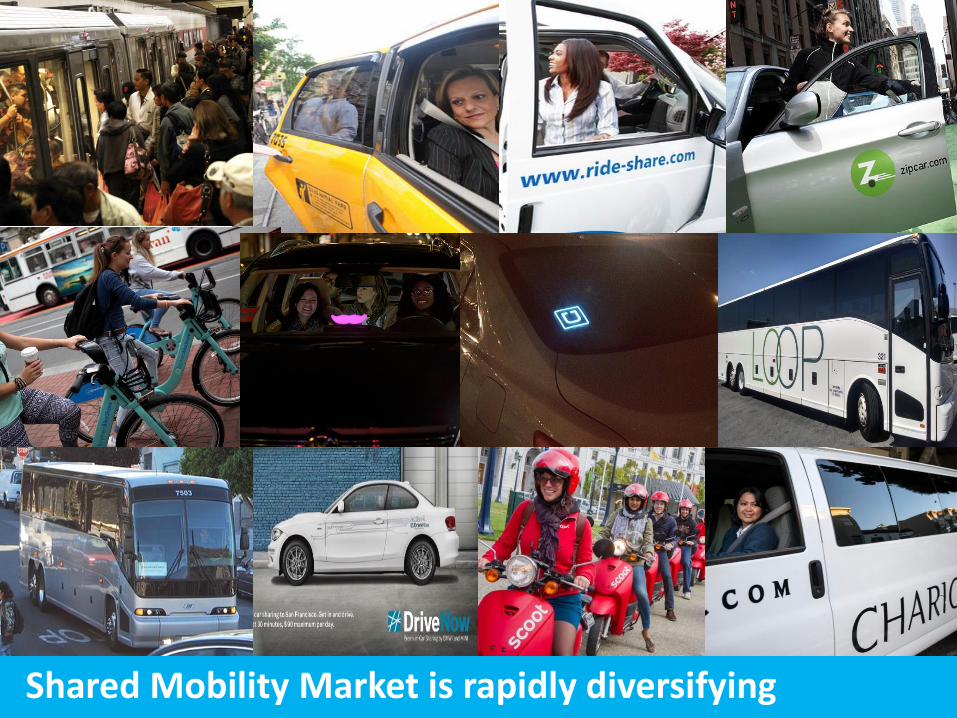
@NACTO #NACTO14 @tpap_Shared Mobility Market is rapidly diversifying
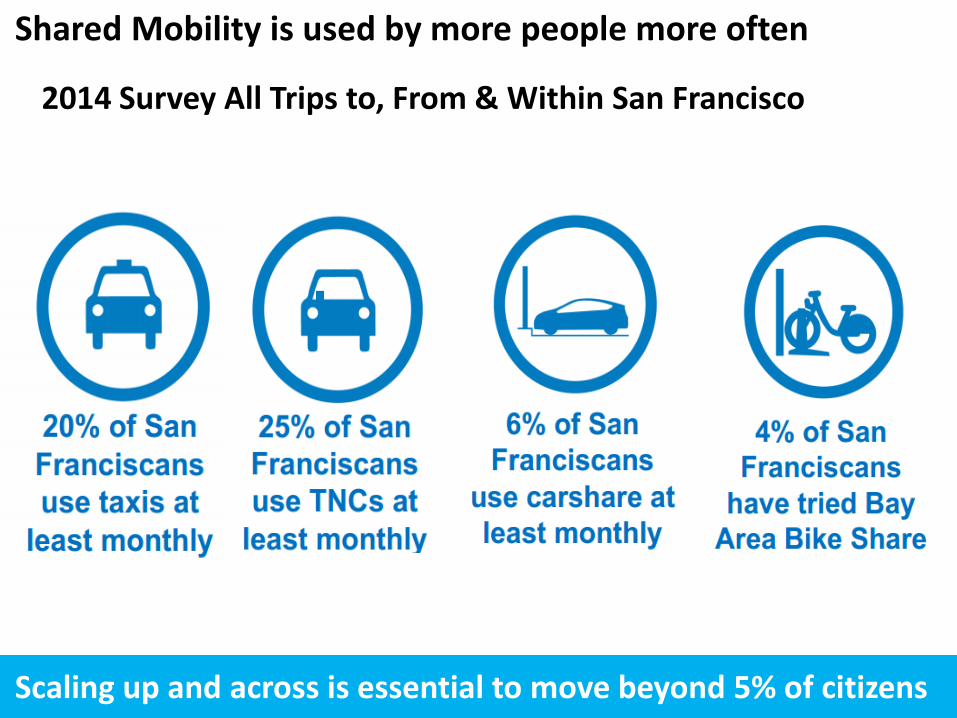
Shared Mobility is used by more people more often
2014 Survey All Trips to, From & Within San Francisco
Scaling up and across is essential to move beyond 5% of citizens
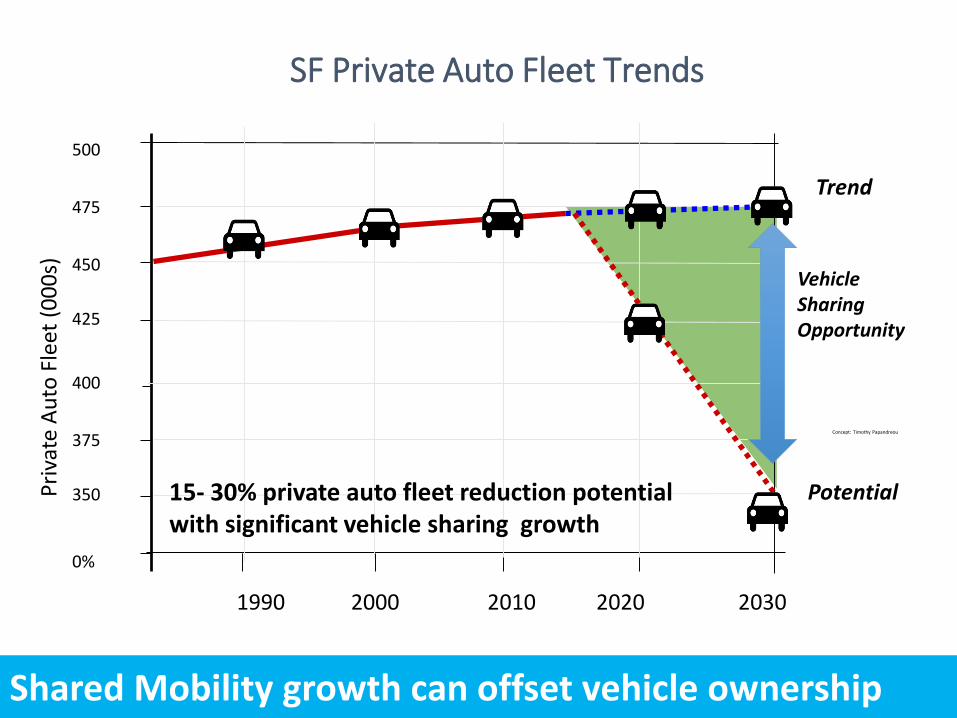
SF Private Auto Fleet Trends
1990 2000 2010 2020 2030
500
475
450
425
400
375
350
0%
Pri
vate
Au
to F
leet
(0
00
s)
15- 30% private auto fleet reduction potential with significant vehicle sharing growth
Trend
Potential
Vehicle Sharing Opportunity
Growth will need to be offset by vehicle sharing
Concept: Timothy Papandreou
Shared Mobility growth can offset vehicle ownership
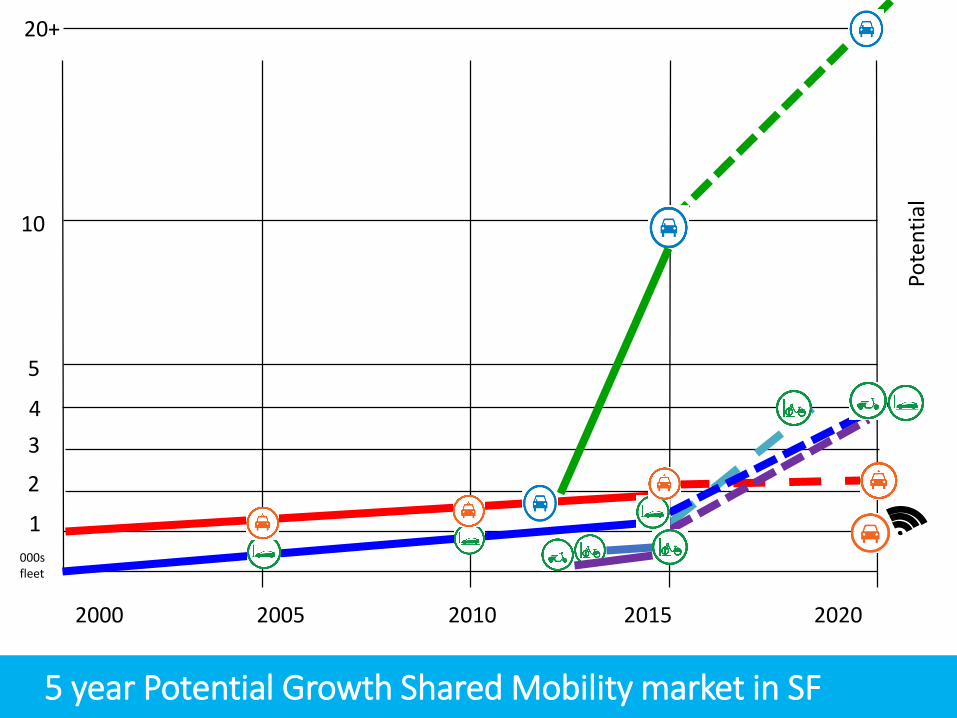
5 year Potential Growth Shared Mobility market in SF
20152005 20102000 2020
1
2
3
4
5
20+
000sfleet
Pote
nti
al
10
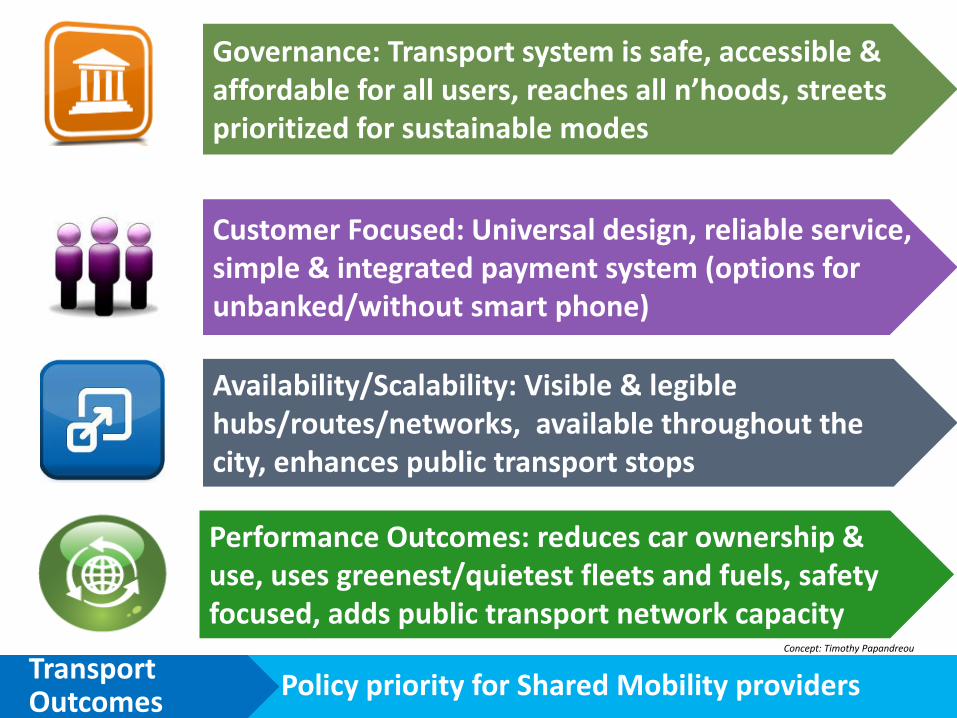
Customer Focused: Universal design, reliable service, simple & integrated payment system (options for unbanked/without smart phone)
Availability/Scalability: Visible & legible hubs/routes/networks, available throughout the city, enhances public transport stops
Governance: Transport system is safe, accessible & affordable for all users, reaches all n’hoods, streets prioritized for sustainable modes
Performance Outcomes: reduces car ownership & use, uses greenest/quietest fleets and fuels, safety focused, adds public transport network capacity
Policy priority for Shared Mobility providersTransport Outcomes
Concept: Timothy Papandreou
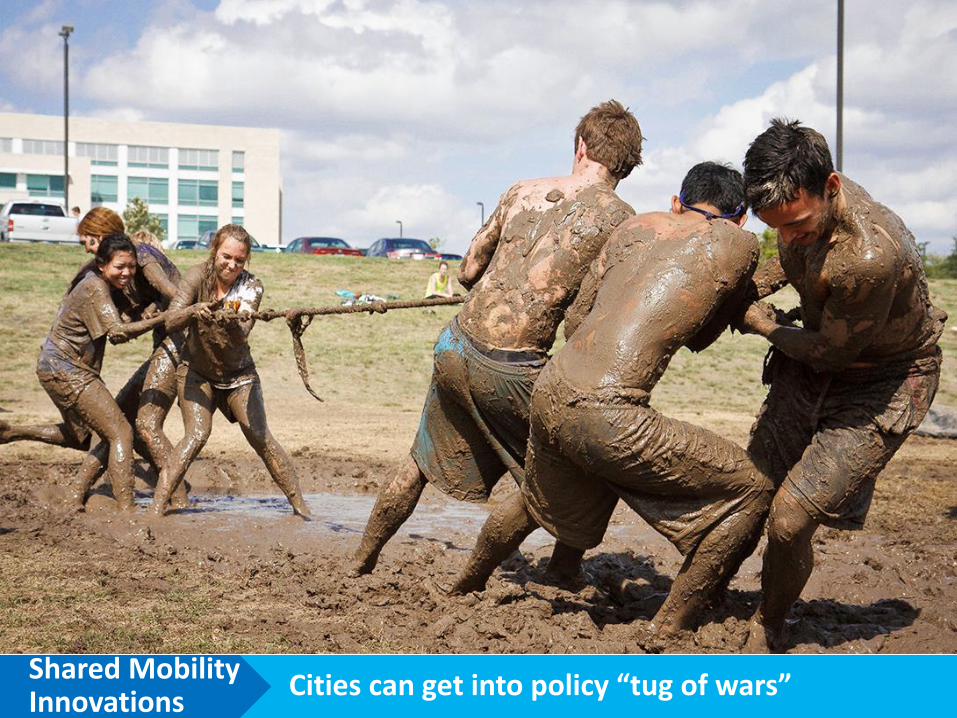
Cities can get into policy “tug of wars”Shared Mobility Innovations
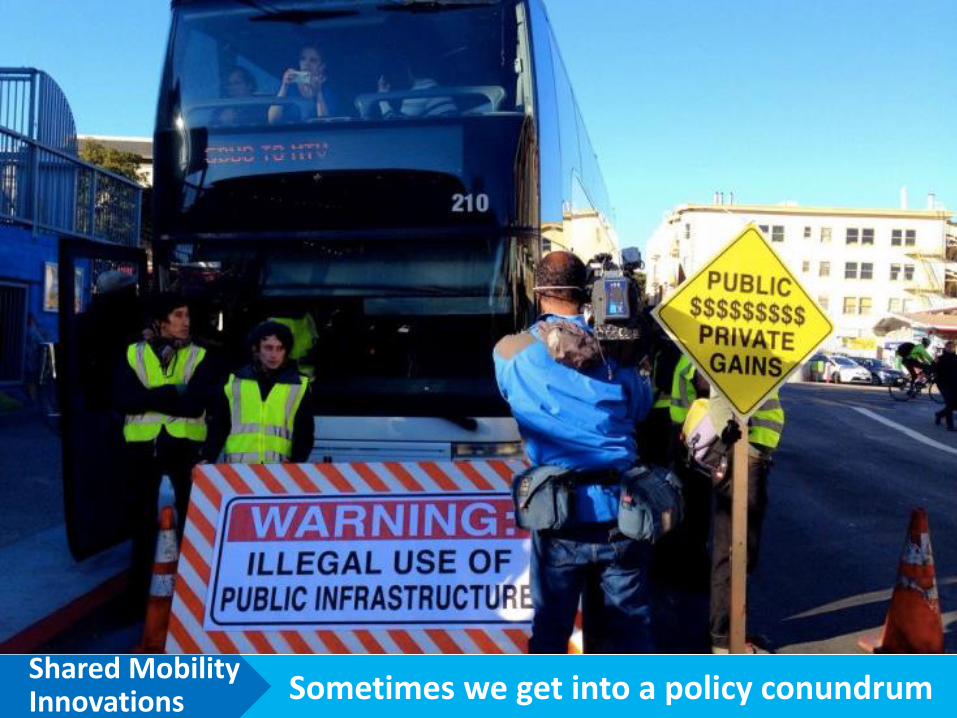
Sometimes we get into a policy conundrumShared Mobility Innovations
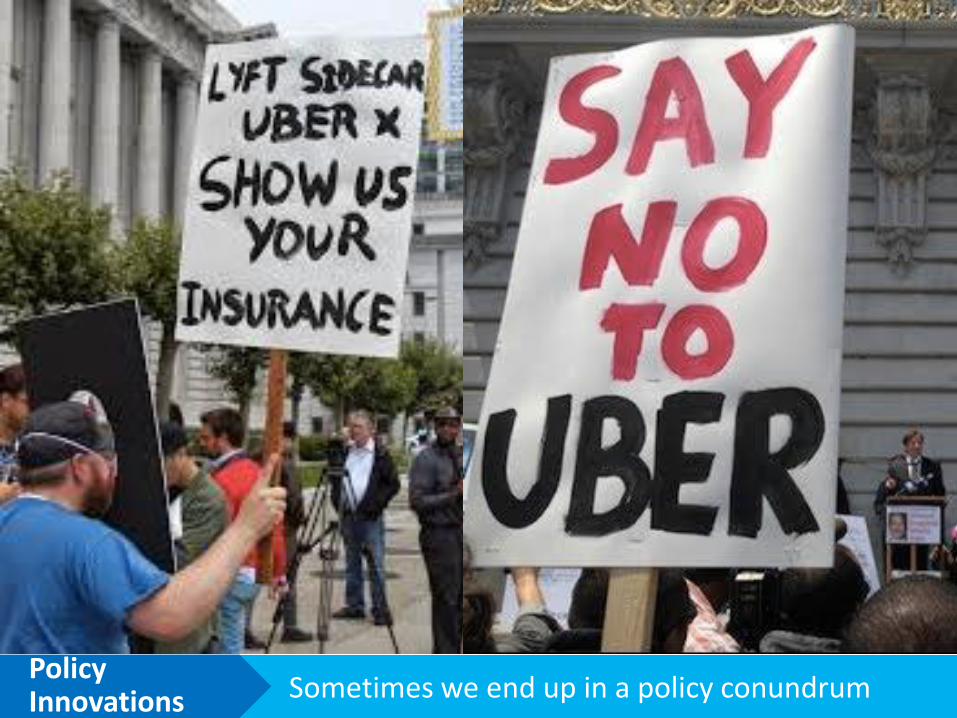
Sometimes we end up in a policy conundrumPolicy Innovations
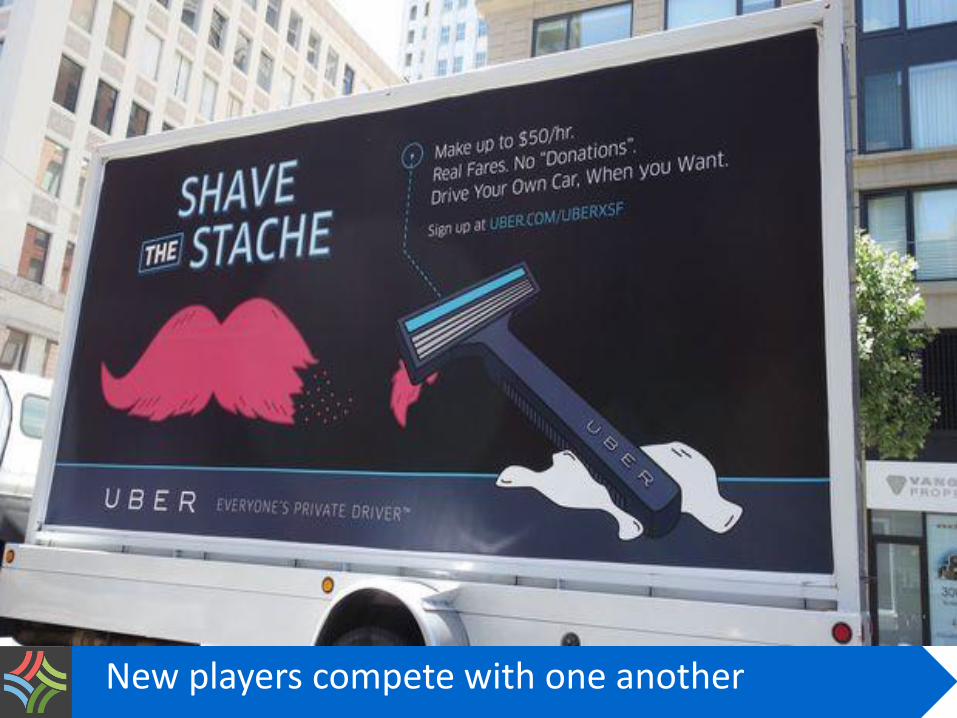
New players compete with one another
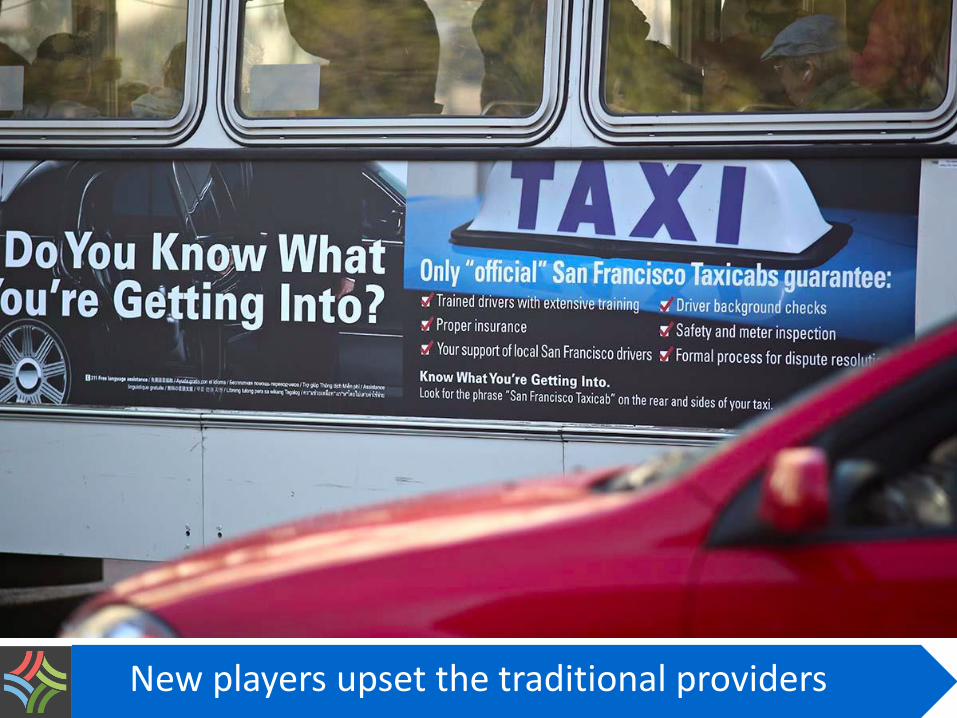
New players upset the traditional providers
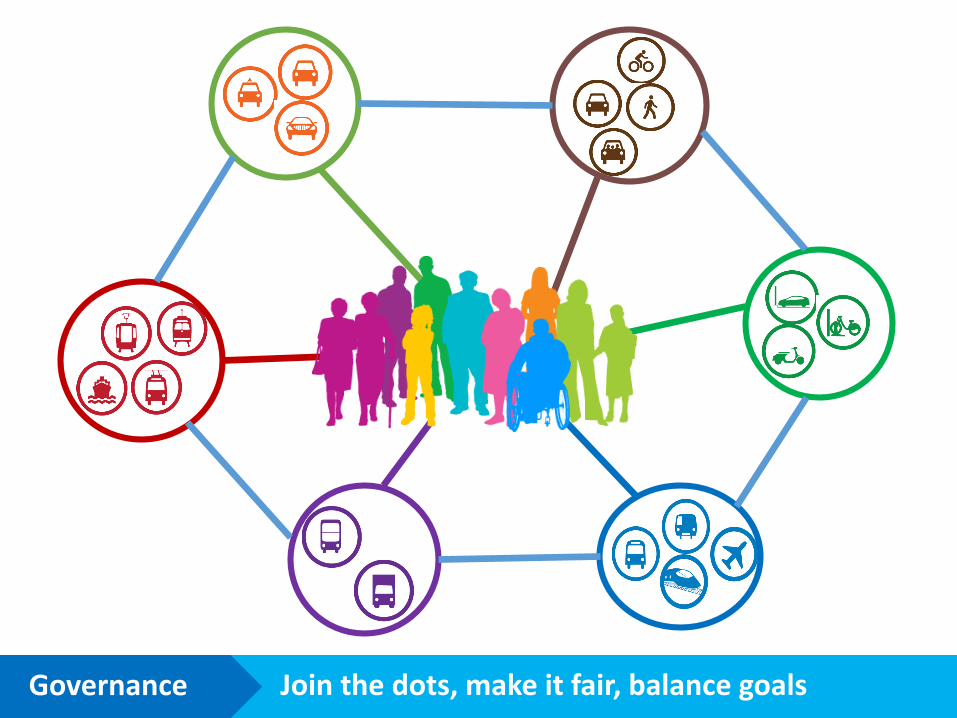
Join the dots, make it fair, balance goalsGovernance
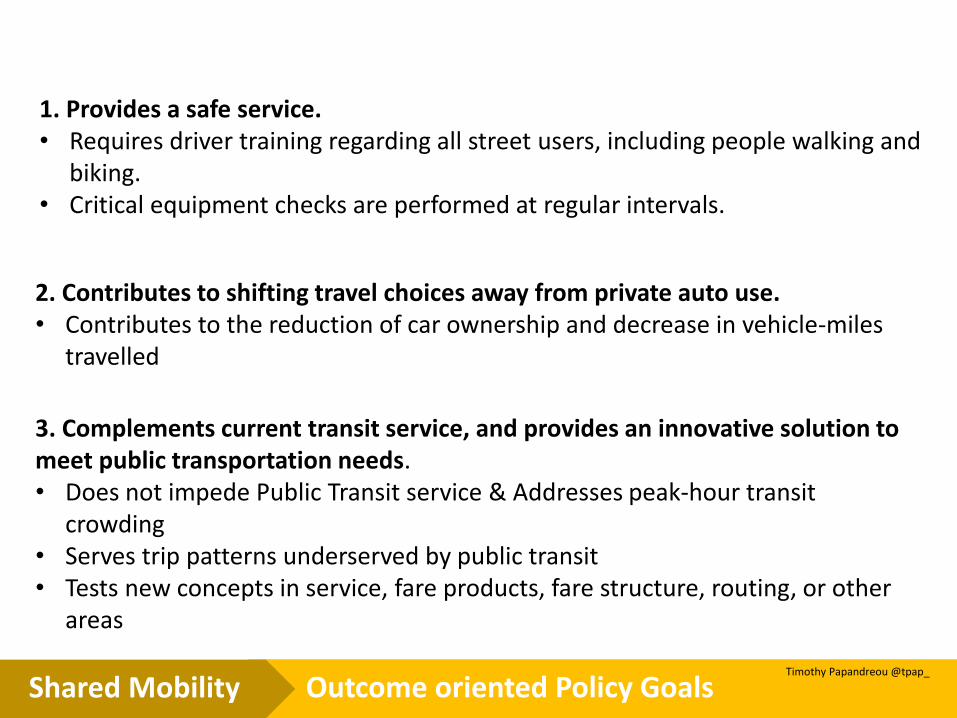
3. Complements current transit service, and provides an innovative solution to meet public transportation needs. • Does not impede Public Transit service & Addresses peak-hour transit
crowding • Serves trip patterns underserved by public transit • Tests new concepts in service, fare products, fare structure, routing, or other
areas
2. Contributes to shifting travel choices away from private auto use.• Contributes to the reduction of car ownership and decrease in vehicle-miles
travelled
1. Provides a safe service. • Requires driver training regarding all street users, including people walking and
biking. • Critical equipment checks are performed at regular intervals.
30Outcome oriented Policy GoalsShared MobilityTimothy Papandreou @tpap_
31Outcome oriented Policy GoalsShared MobilityTimothy Papandreou @tpap_
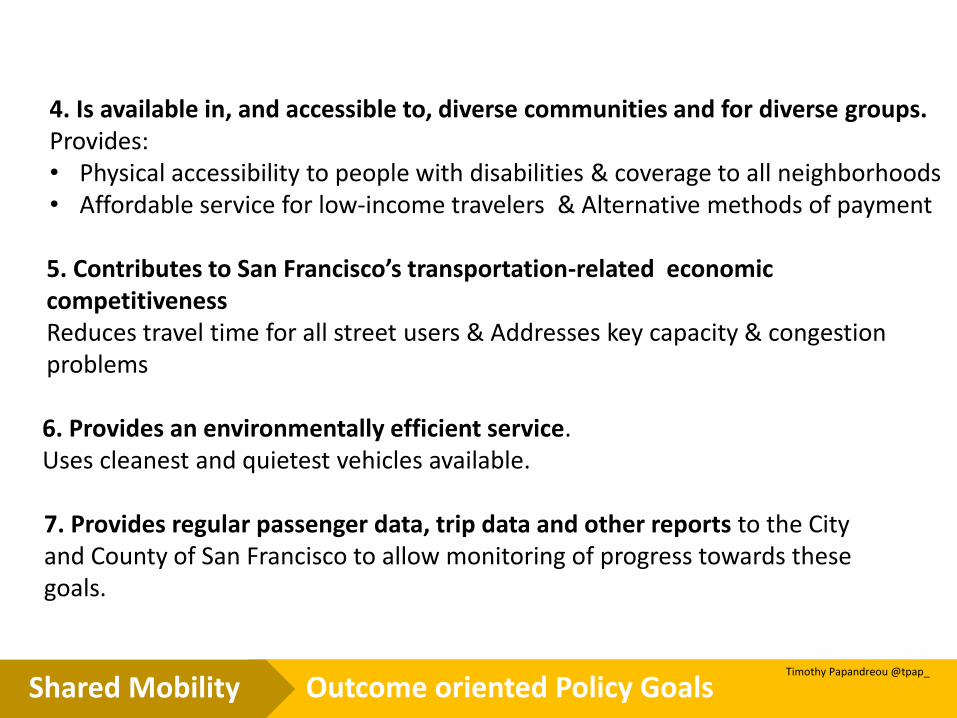
6. Provides an environmentally efficient service. Uses cleanest and quietest vehicles available.
4. Is available in, and accessible to, diverse communities and for diverse groups. Provides: • Physical accessibility to people with disabilities & coverage to all neighborhoods • Affordable service for low-income travelers & Alternative methods of payment
5. Contributes to San Francisco’s transportation-related economic competitivenessReduces travel time for all street users & Addresses key capacity & congestion problems
7. Provides regular passenger data, trip data and other reports to the City and County of San Francisco to allow monitoring of progress towards these goals.
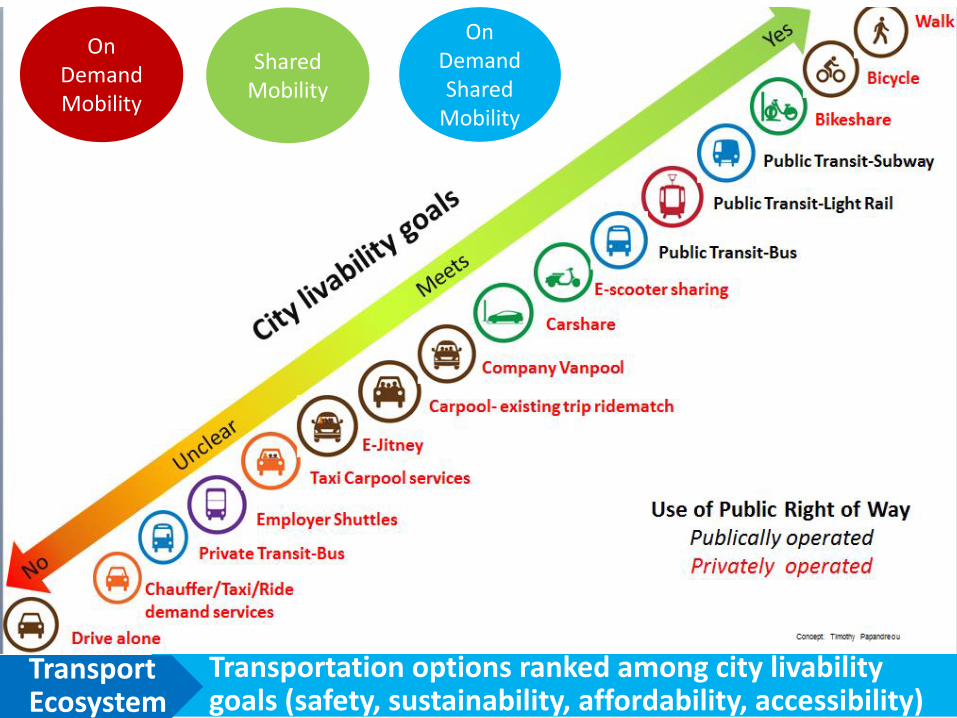
Transportation options ranked among city livability goals (safety, sustainability, affordability, accessibility)
Transport Ecosystem
On Demand Mobility
Shared Mobility
On Demand Shared
Mobility
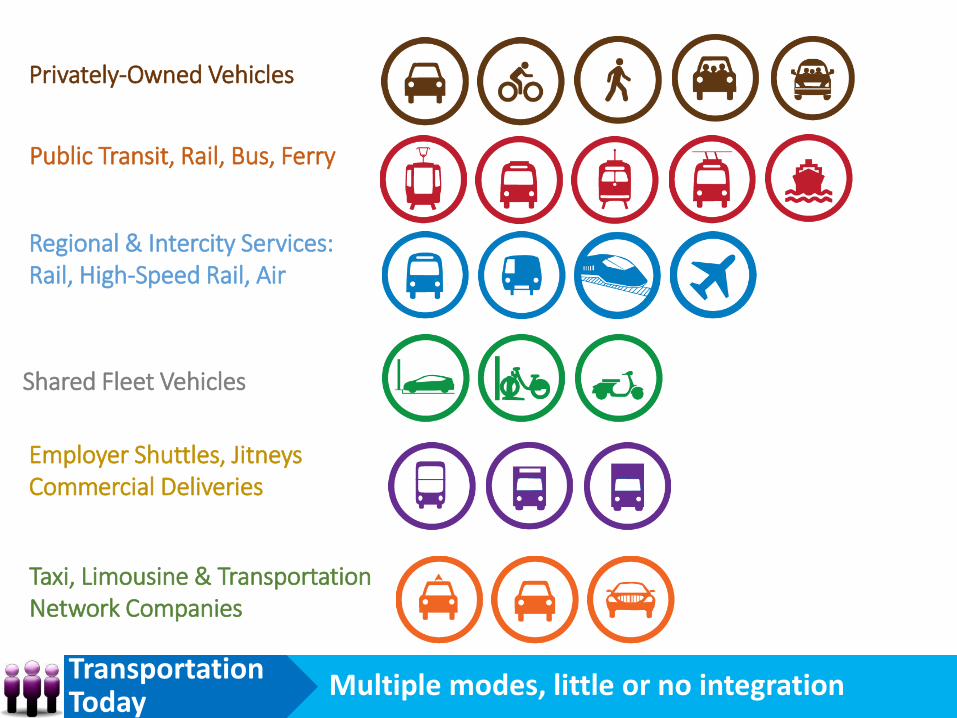
Multiple modes, little or no integrationTransportation Today
Taxi, Limousine & Transportation Network Companies
Public Transit, Rail, Bus, Ferry
Shared Fleet Vehicles
Employer Shuttles, Jitneys Commercial Deliveries
Regional & Intercity Services: Rail, High-Speed Rail, Air
Privately-Owned Vehicles
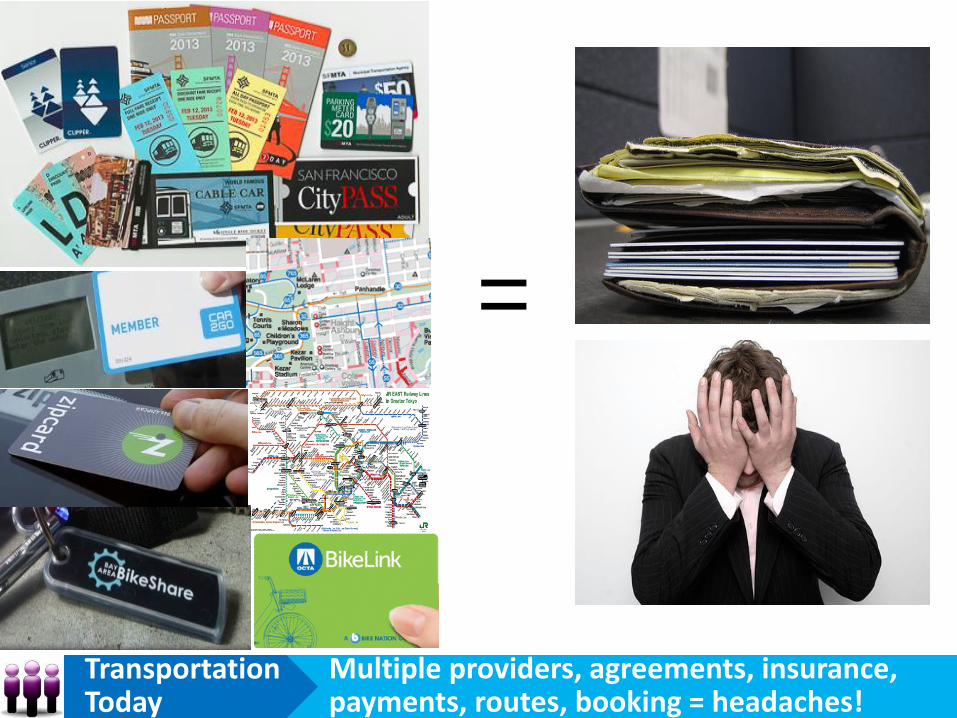
34Multiple providers, agreements, insurance, payments, routes, booking = headaches!
Transportation Today
=
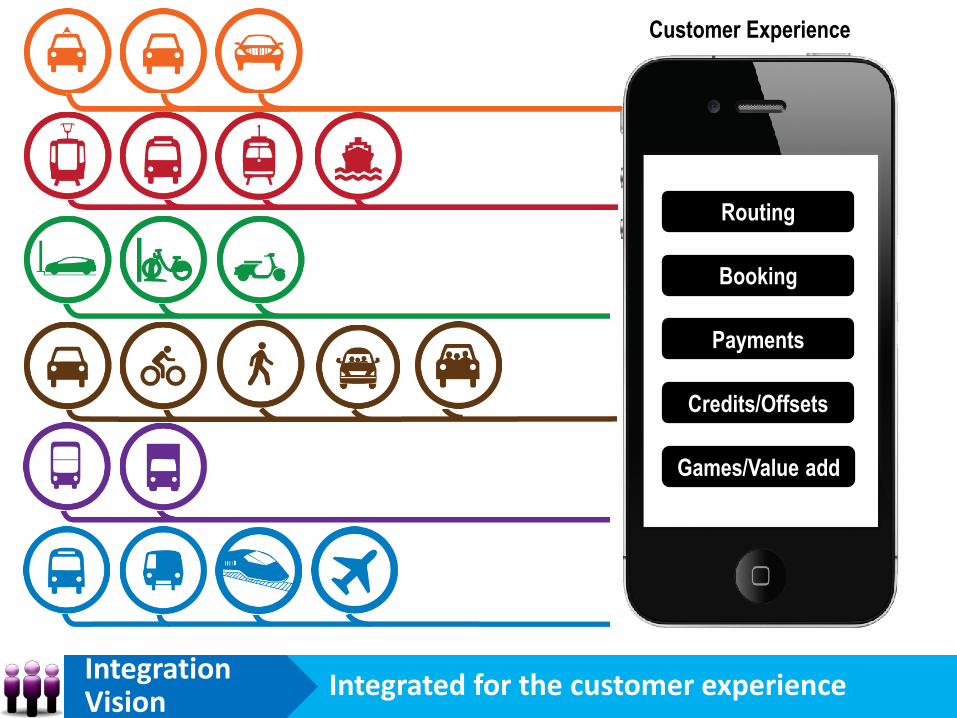
Customer Experience
Routing
Booking
Payments
Credits/Offsets
Games/Value add
Integrated for the customer experienceIntegration Vision
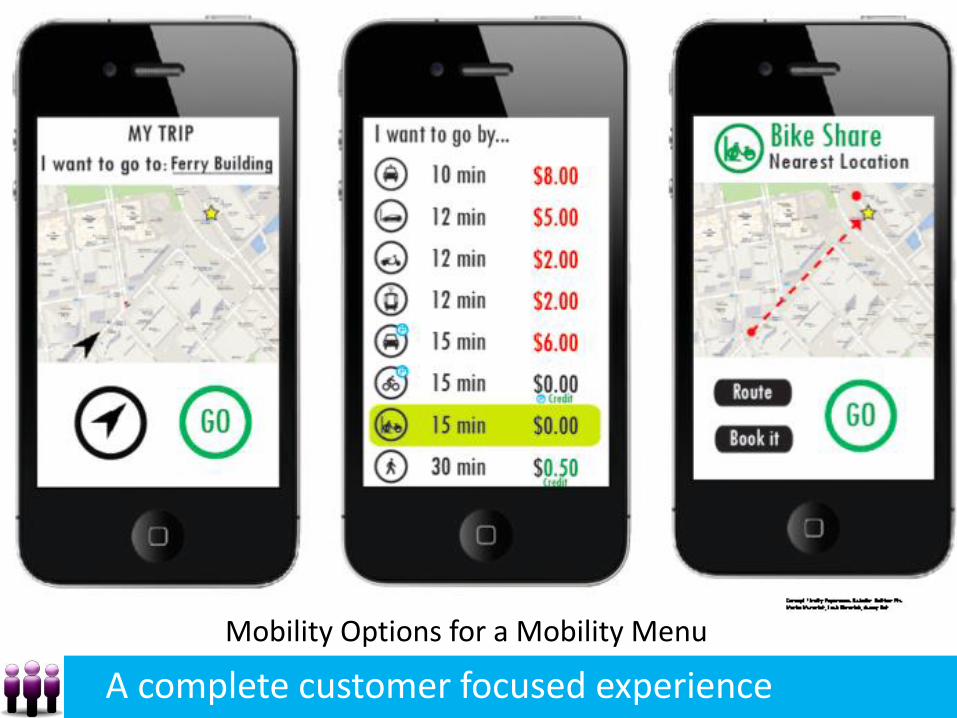
A complete customer focused experience
Mobility Options for a Mobility Menu
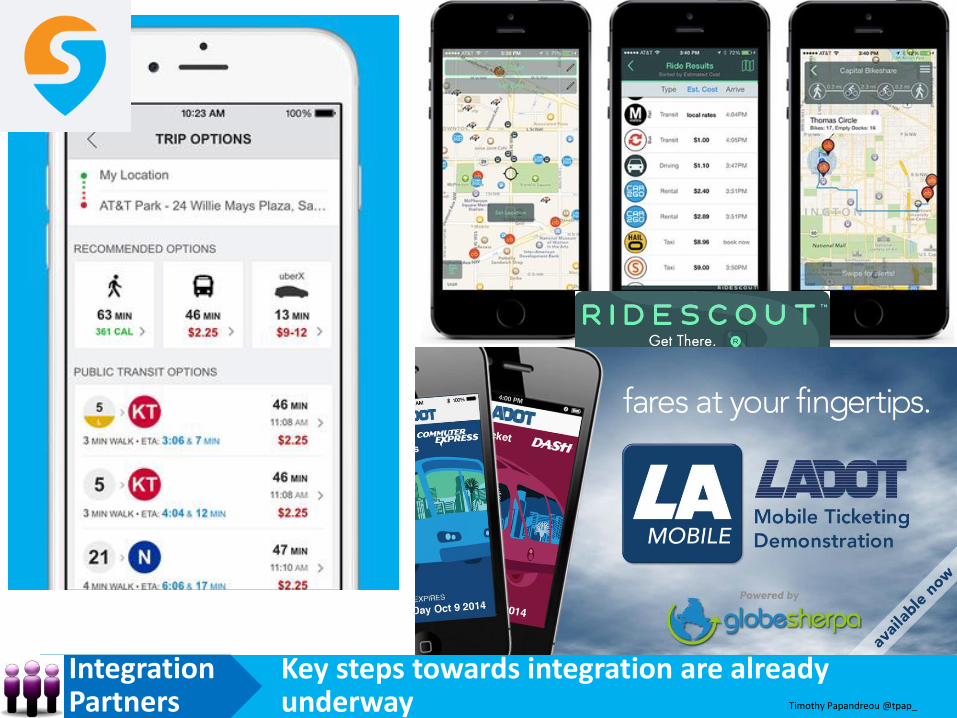
Key steps towards integration are already underway
Integration Partners Timothy Papandreou @tpap_
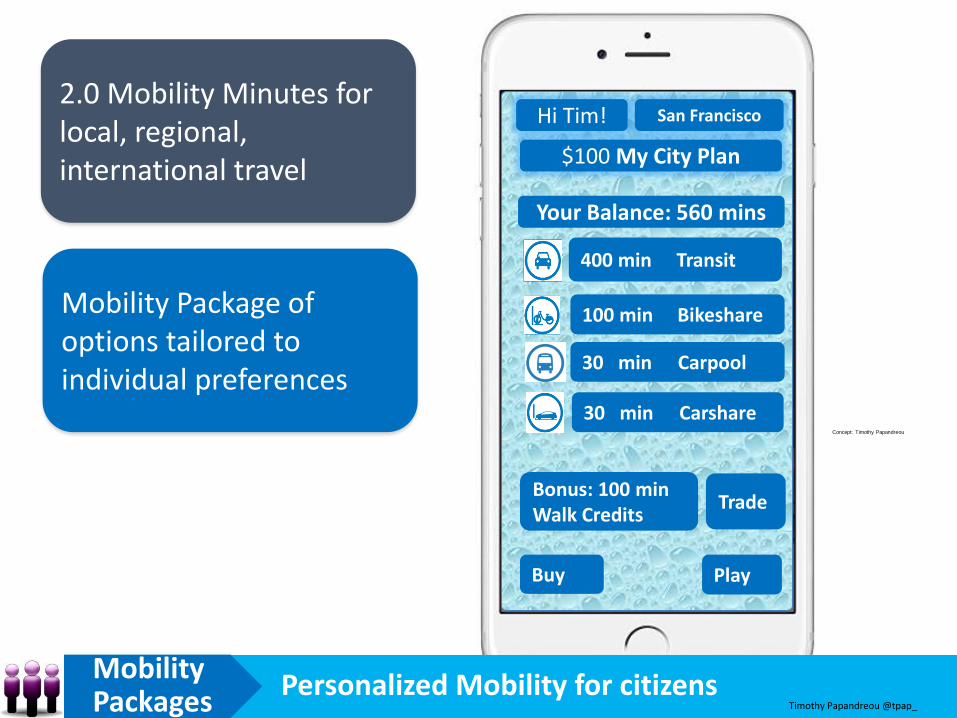
2.0 Mobility Minutes for local, regional, international travel
Concept: Timothy Papandreou
Hi Tim!
$100 My City Plan
Your Balance: 560 mins
30 min Carshare
30 min Carpool
400 min Transit
100 min Bikeshare
Bonus: 100 min Walk Credits
Buy
Trade
Play
Mobility Package of options tailored to individual preferences
San Francisco
Personalized Mobility for citizensMobility Packages Timothy Papandreou @tpap_
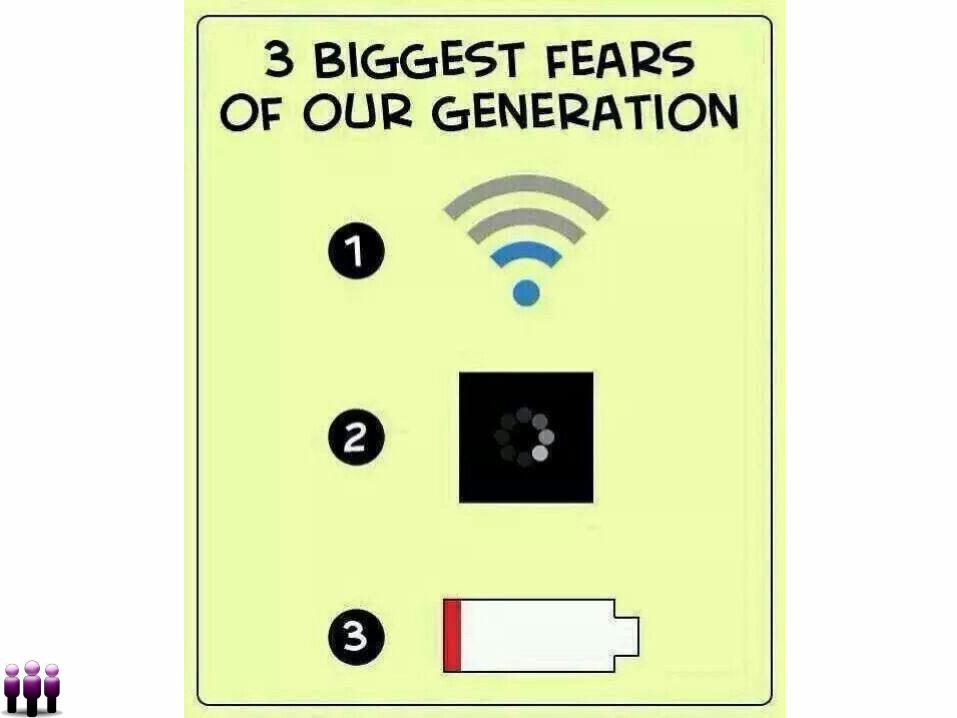
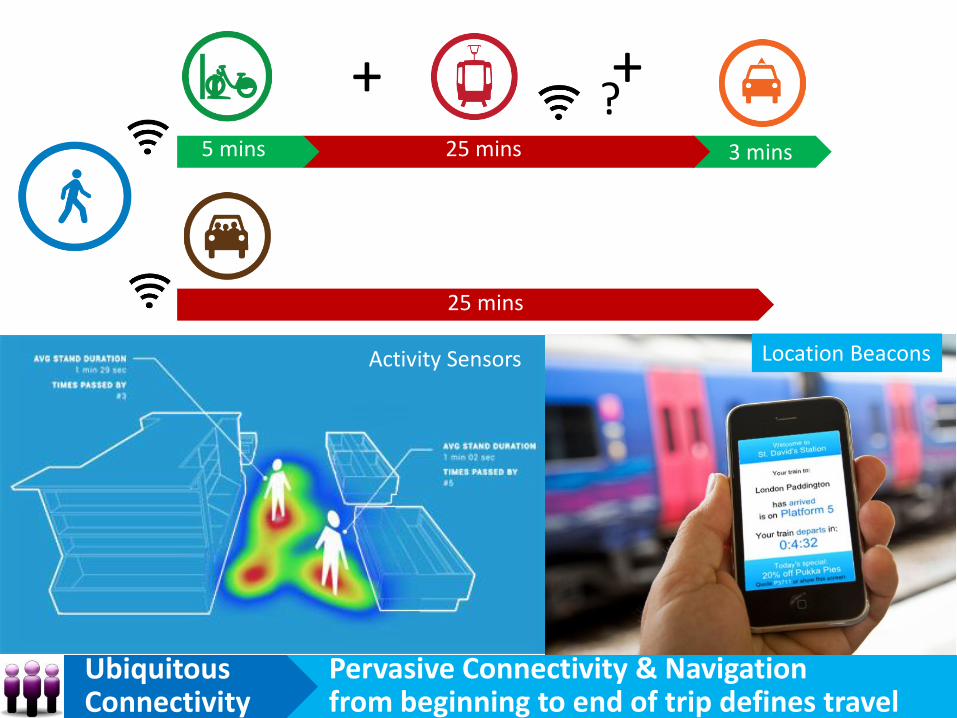
Pervasive Connectivity & Navigationfrom beginning to end of trip defines travel
Ubiquitous Connectivity
Concept: Timothy Papandreou
Activity Sensors Location Beacons
+ +5 mins 25 mins 3 mins
25 mins
?
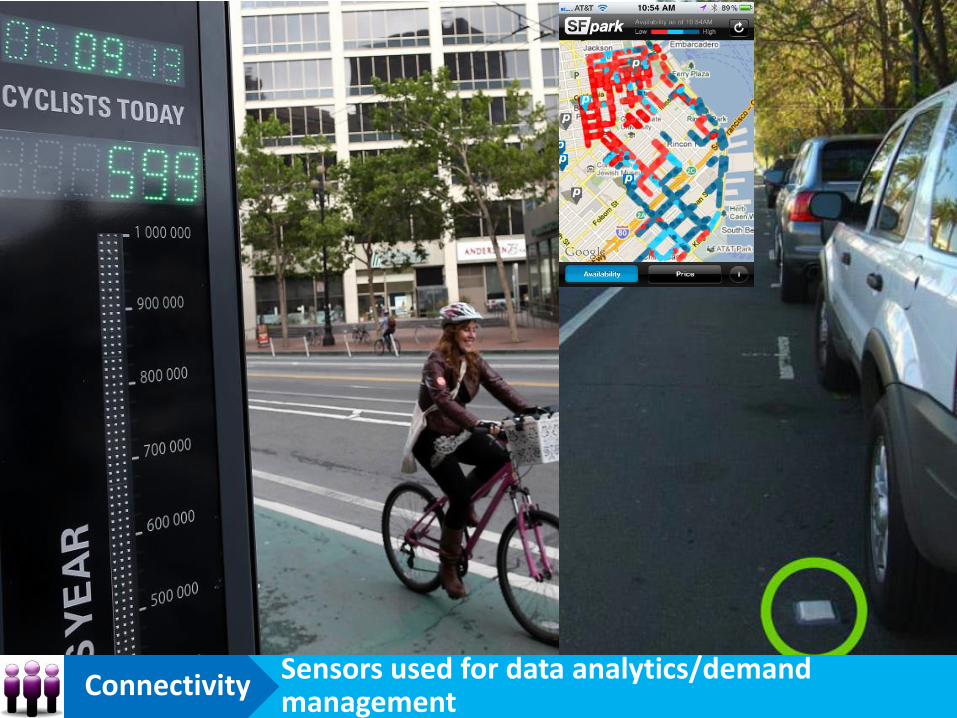
Sensors used for data analytics/demand management
Connectivity
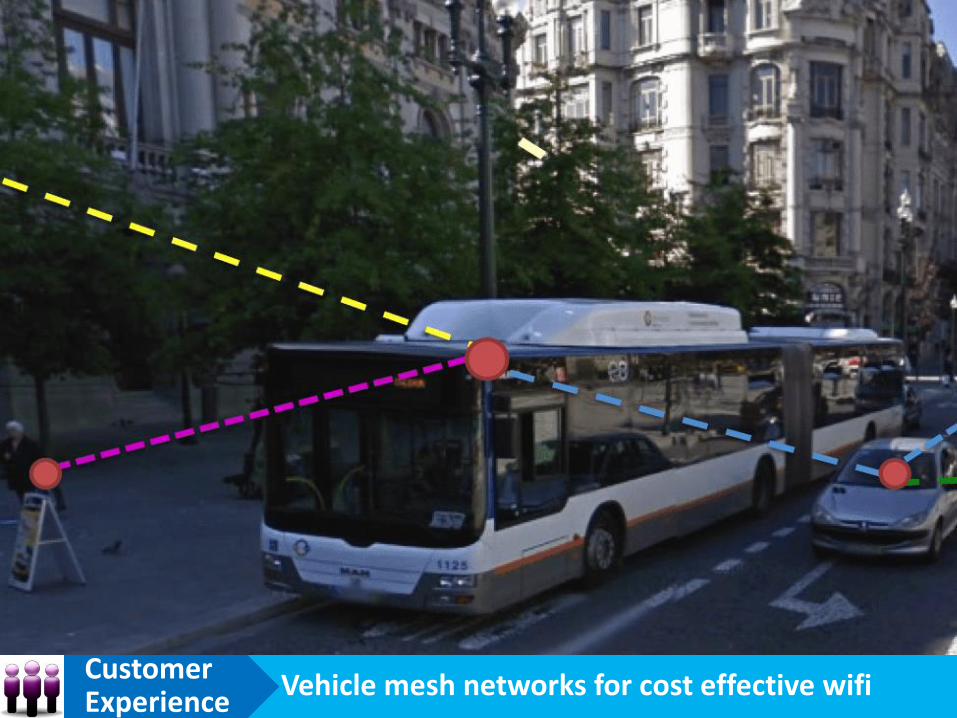
Vehicle mesh networks for cost effective wifiCustomer Experience
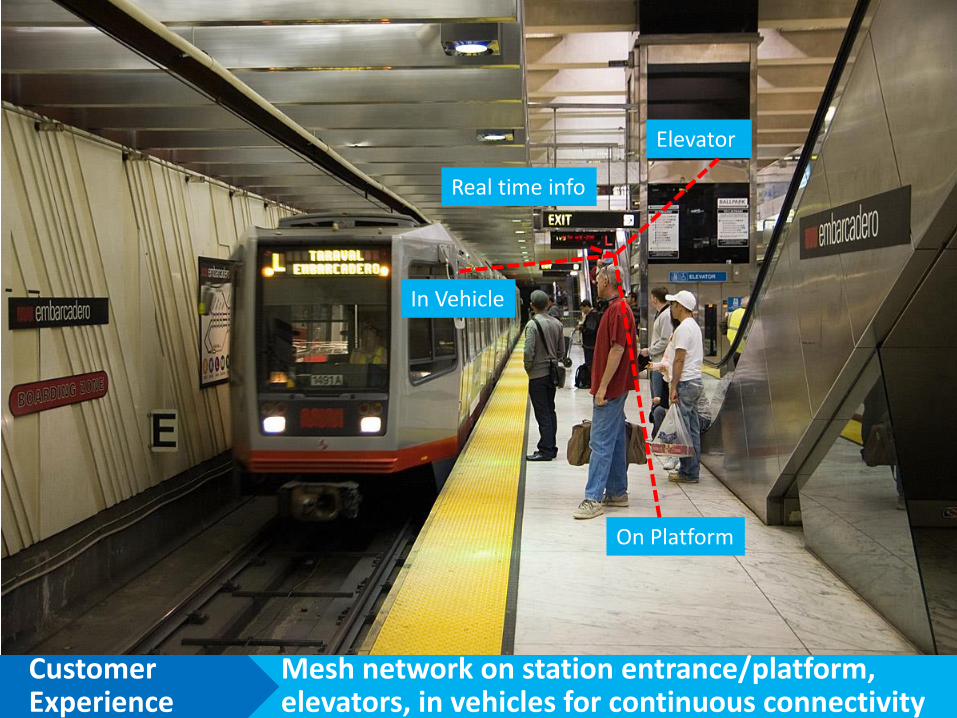
Mesh network on station entrance/platform, elevators, in vehicles for continuous connectivity
Customer Experience
On Platform
In Vehicle
Elevator
Real time info
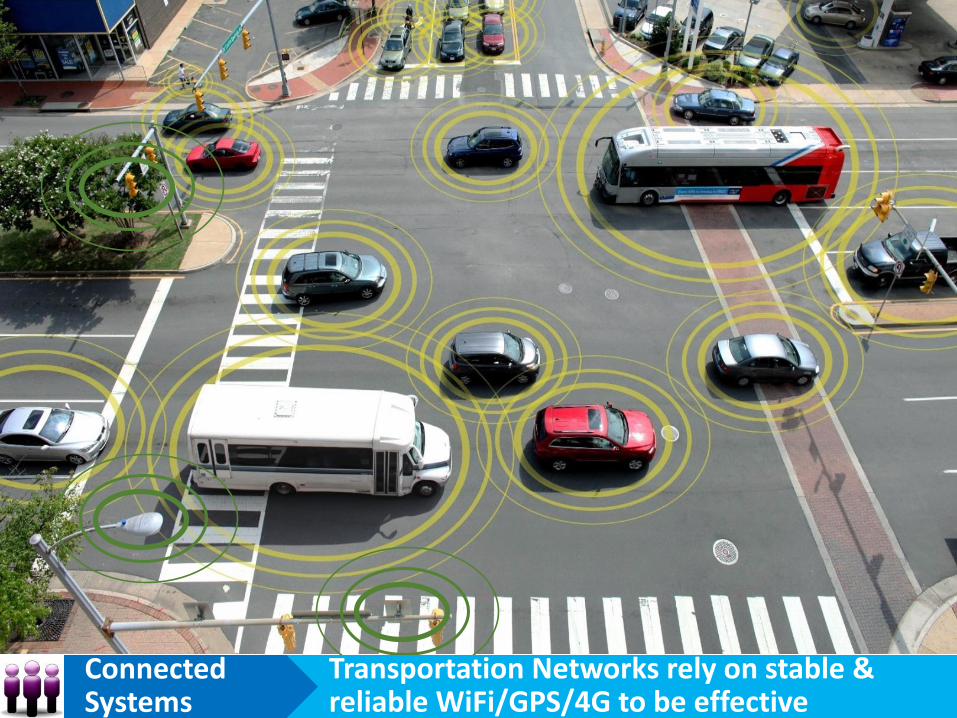
Transportation Networks rely on stable & reliable WiFi/GPS/4G to be effective
Connected Systems
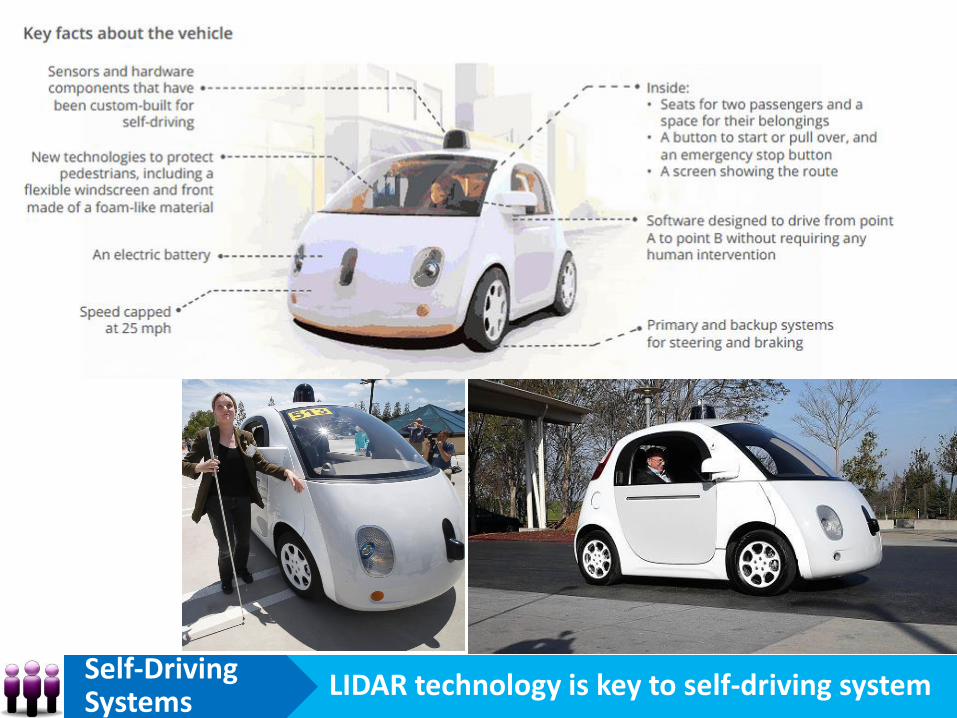
LIDAR technology is key to self-driving systemSelf-Driving Systems
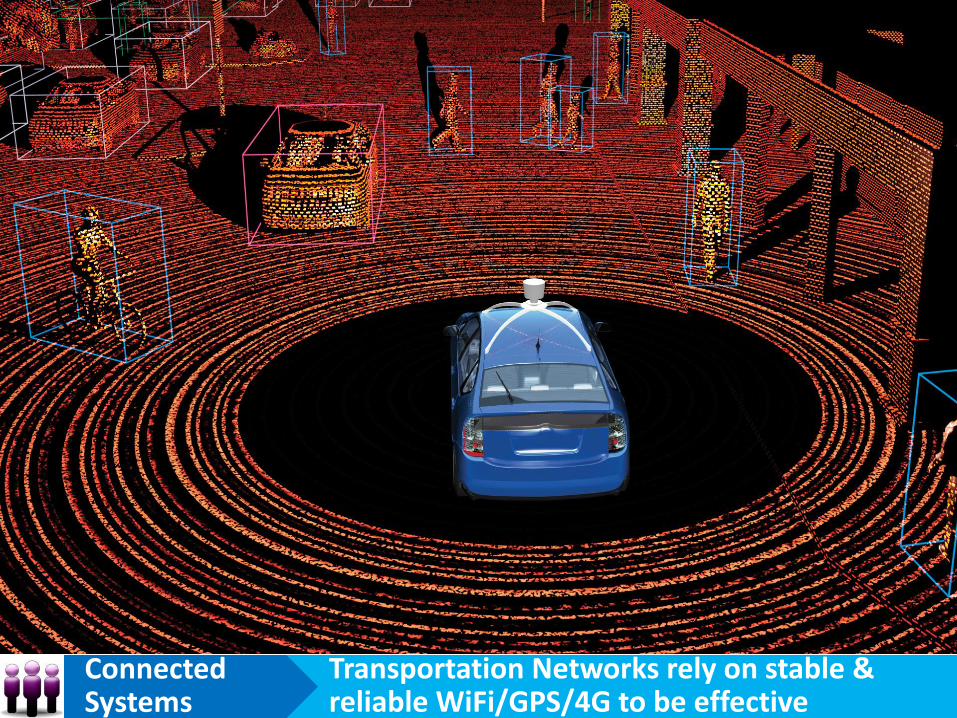
Transportation Networks rely on stable & reliable WiFi/GPS/4G to be effective
Connected Systems
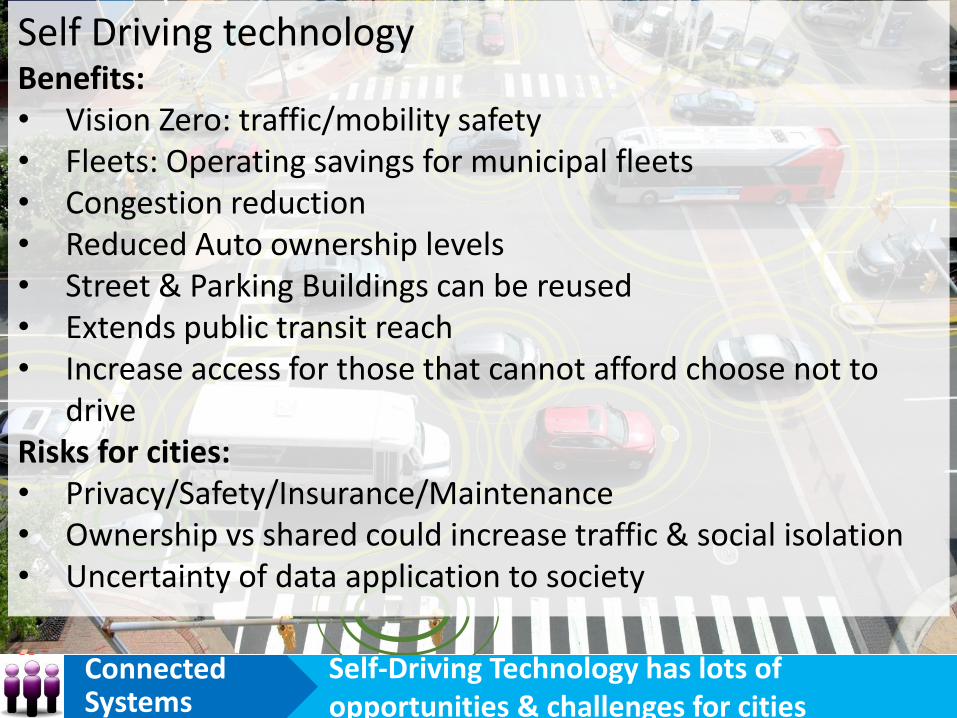
Self-Driving Technology has lots of opportunities & challenges for cities
Connected Systems
Self Driving technology Benefits:• Vision Zero: traffic/mobility safety• Fleets: Operating savings for municipal fleets• Congestion reduction• Reduced Auto ownership levels• Street & Parking Buildings can be reused• Extends public transit reach • Increase access for those that cannot afford choose not to
drive Risks for cities:• Privacy/Safety/Insurance/Maintenance• Ownership vs shared could increase traffic & social isolation• Uncertainty of data application to society
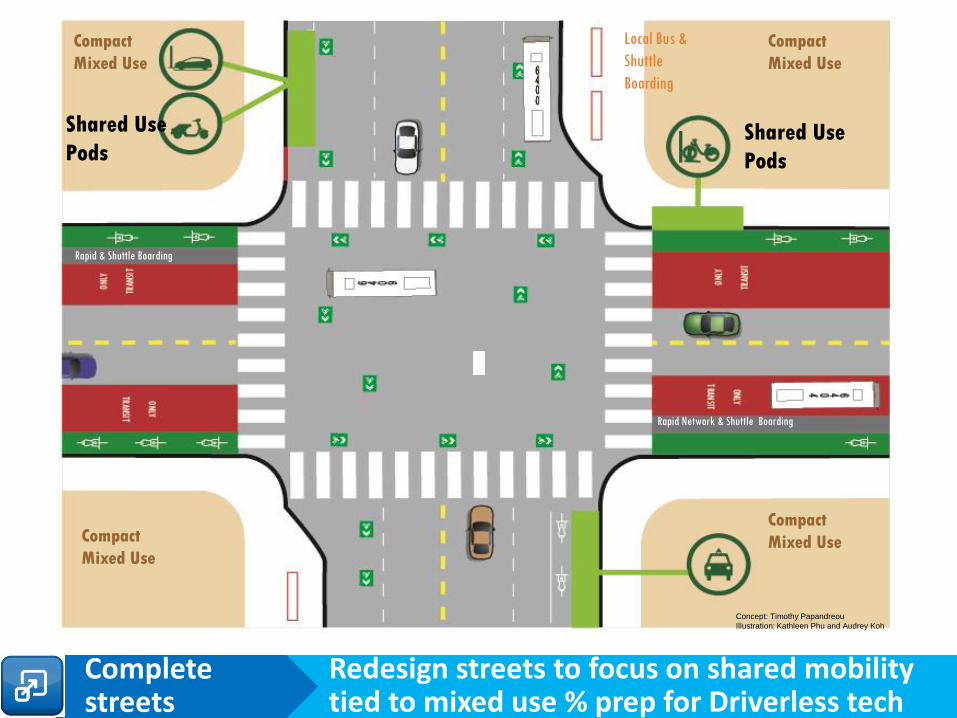
Rapid & Shuttle Boarding
Rapid Network & Shuttle Boarding
Redesign streets to focus on shared mobility tied to mixed use % prep for Driverless tech
Complete streets
Shared Use
PodsShared Use
Pods
Local Bus &
Shuttle
Boarding
Compact
Mixed Use
Compact
Mixed Use
Compact
Mixed Use
Compact
Mixed Use
Concept: Timothy Papandreou
Illustration: Kathleen Phu and Audrey Koh
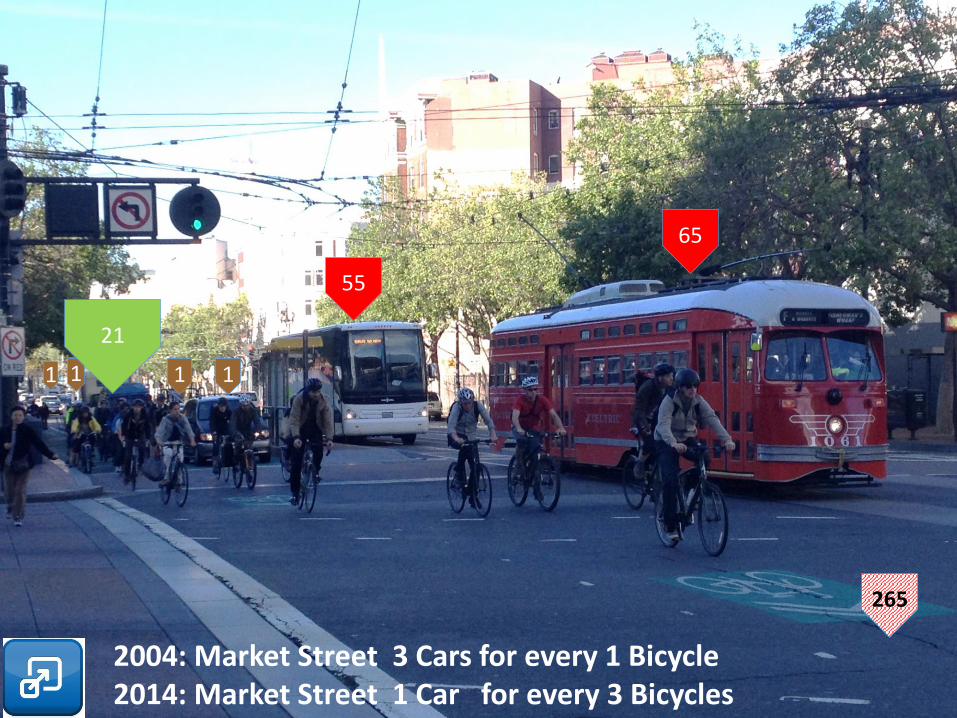
11 1 1
21
55
65
2004: Market Street 3 Cars for every 1 Bicycle 2014: Market Street 1 Car for every 3 Bicycles
265
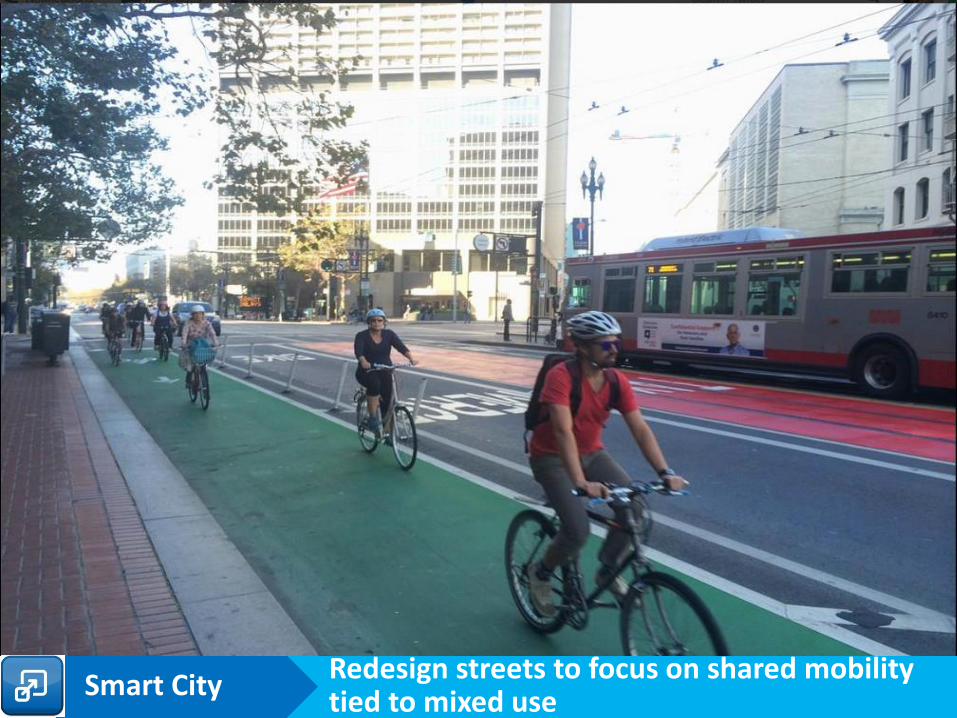
Redesign streets to focus on shared mobility tied to mixed use
Smart City
Redesign streets to focus on shared mobility tied to mixed use
Smart City
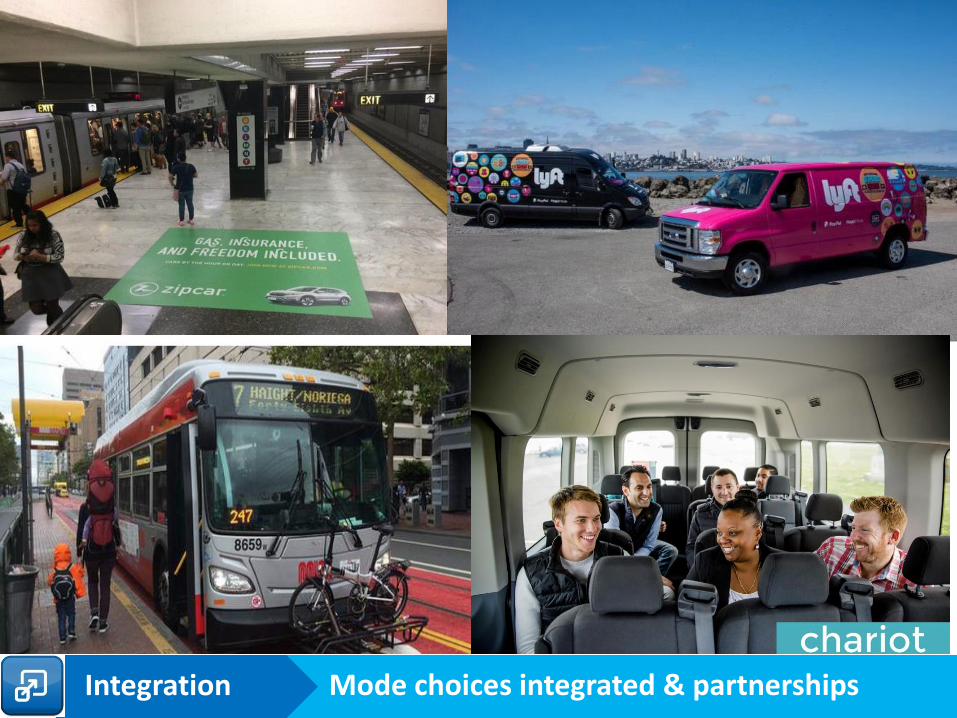
Mode choices integrated & partnershipsIntegration
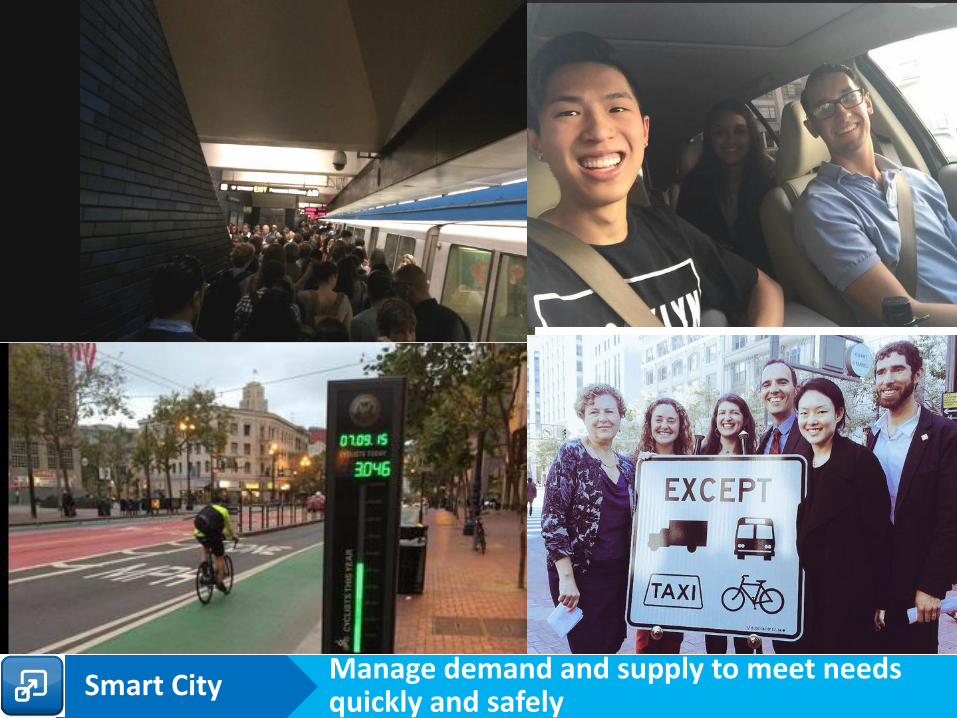
Manage demand and supply to meet needs quickly and safely
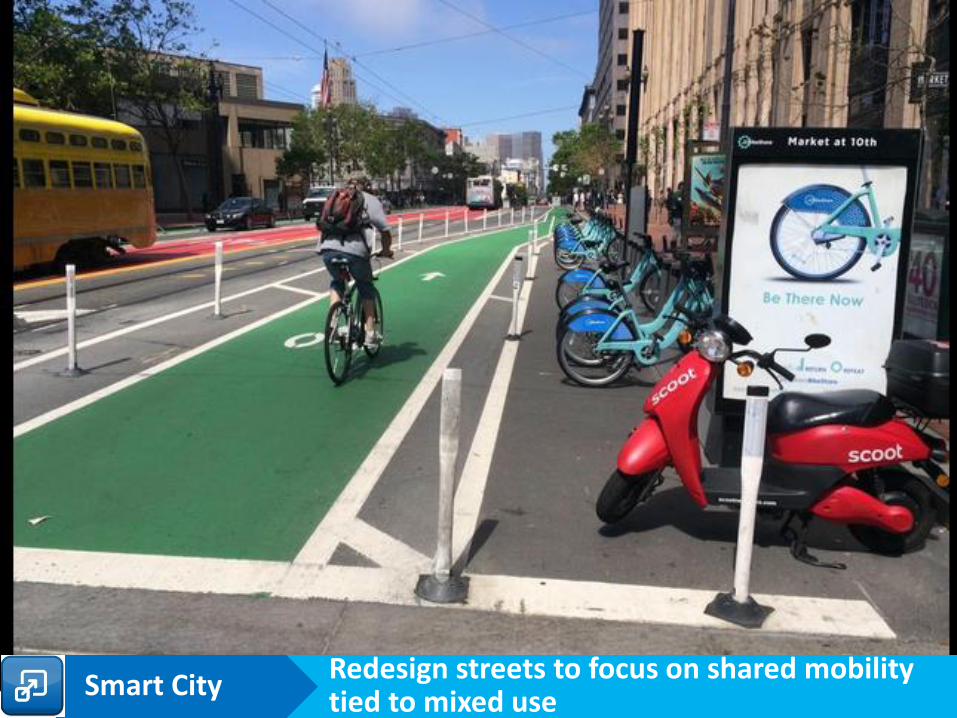
Smart City
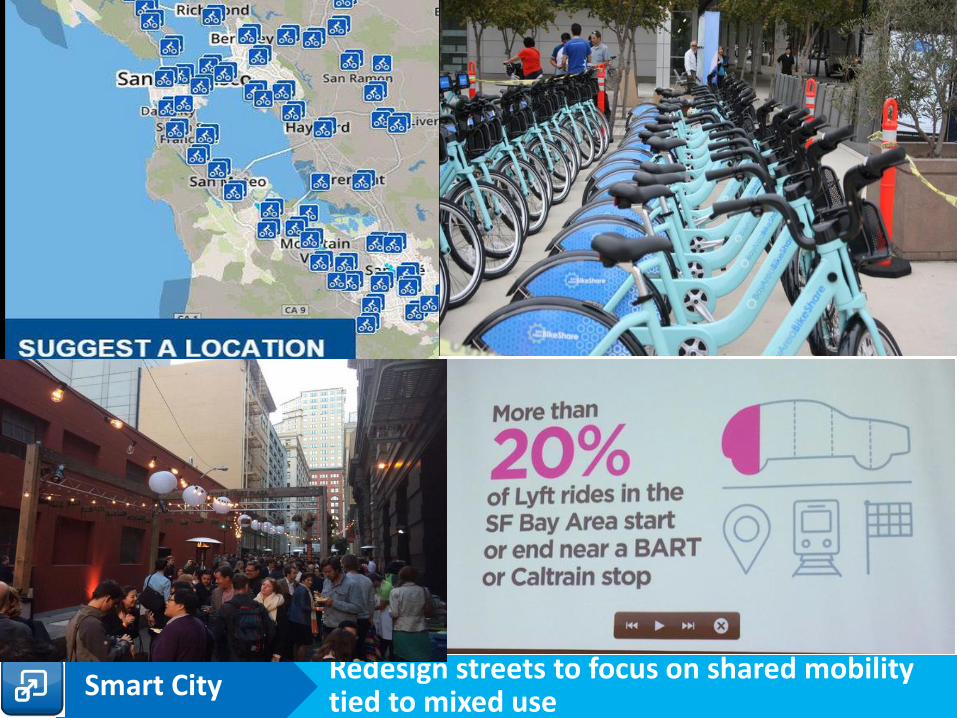
Redesign streets to focus on shared mobility tied to mixed use
Smart City
55
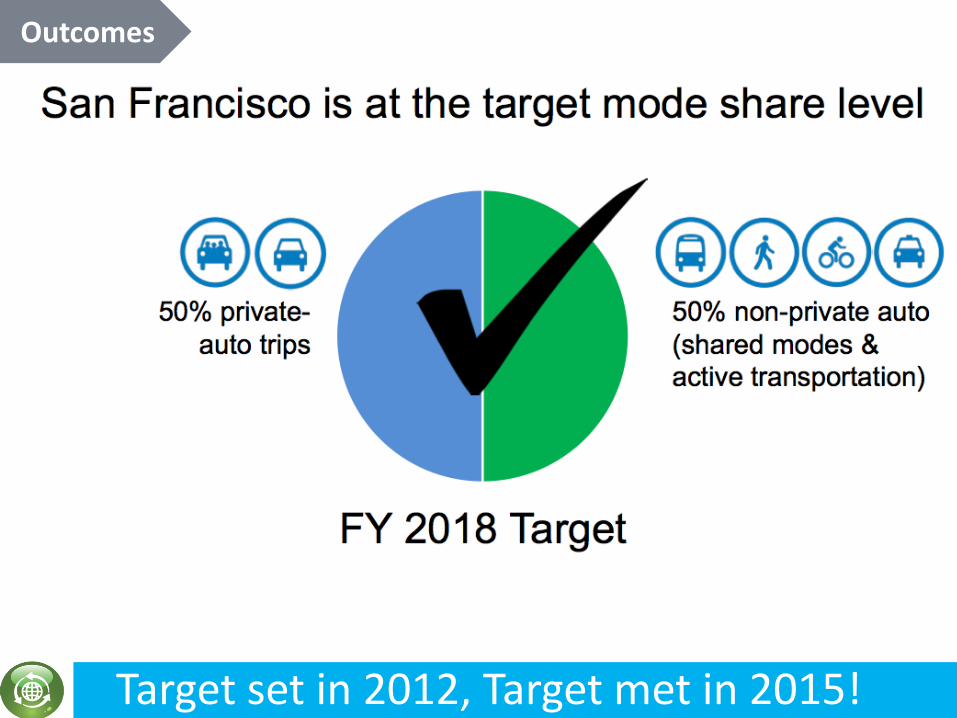
Outcomes
Target set in 2012, Target met in 2015!
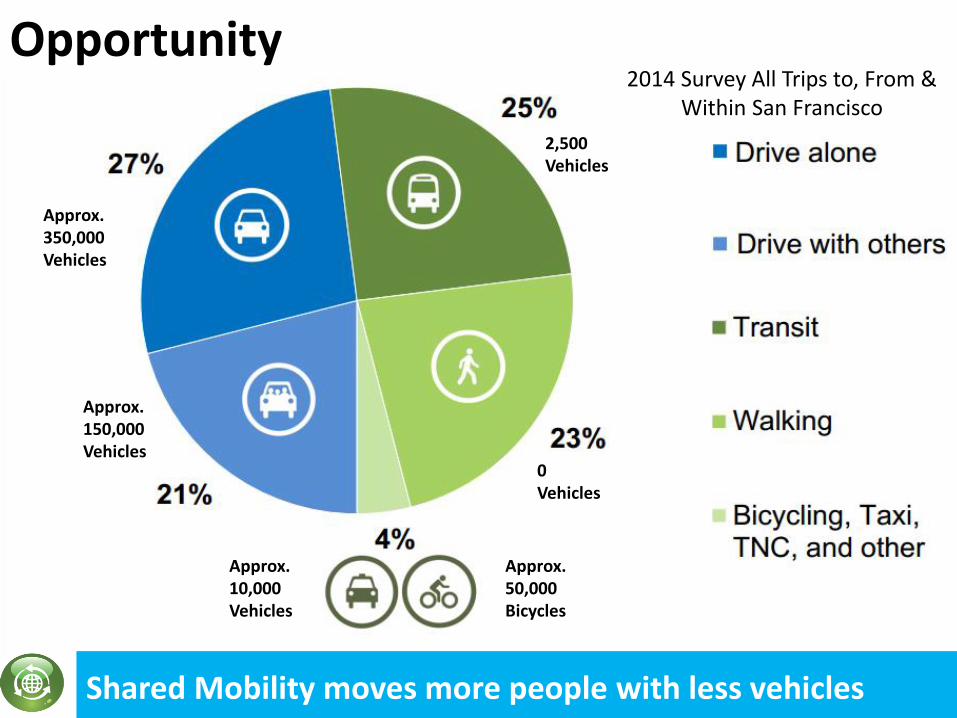
Opportunity
2,500 Vehicles
Approx. 350,000 Vehicles
Approx. 150,000 Vehicles
Approx. 10,000 Vehicles
0 Vehicles
Shared Mobility moves more people with less vehicles
Approx. 50,000 Bicycles
2014 Survey All Trips to, From & Within San Francisco