Time-varying market price of risk in the CAPM - EconStor
22
econstor Make Your Publications Visible. A Service of zbw Leibniz-Informationszentrum Wirtschaft Leibniz Information Centre for Economics Hafner, Christian M.; Herwartz, Helmut Working Paper Time-varying market price of risk in the CAPM: Approaches, empirical evidence and implications SFB 373 Discussion Paper, No. 1999,22 Provided in Cooperation with: Collaborative Research Center 373: Quantification and Simulation of Economic Processes, Humboldt University Berlin Suggested Citation: Hafner, Christian M.; Herwartz, Helmut (1999) : Time-varying market price of risk in the CAPM: Approaches, empirical evidence and implications, SFB 373 Discussion Paper, No. 1999,22, Humboldt University of Berlin, Interdisciplinary Research Project 373: Quantification and Simulation of Economic Processes, Berlin, http://nbn-resolving.de/urn:nbn:de:kobv:11-10056148 This Version is available at: http://hdl.handle.net/10419/61747 Standard-Nutzungsbedingungen: Die Dokumente auf EconStor dürfen zu eigenen wissenschaftlichen Zwecken und zum Privatgebrauch gespeichert und kopiert werden. Sie dürfen die Dokumente nicht für öffentliche oder kommerzielle Zwecke vervielfältigen, öffentlich ausstellen, öffentlich zugänglich machen, vertreiben oder anderweitig nutzen. Sofern die Verfasser die Dokumente unter Open-Content-Lizenzen (insbesondere CC-Lizenzen) zur Verfügung gestellt haben sollten, gelten abweichend von diesen Nutzungsbedingungen die in der dort genannten Lizenz gewährten Nutzungsrechte. Terms of use: Documents in EconStor may be saved and copied for your personal and scholarly purposes. You are not to copy documents for public or commercial purposes, to exhibit the documents publicly, to make them publicly available on the internet, or to distribute or otherwise use the documents in public. If the documents have been made available under an Open Content Licence (especially Creative Commons Licences), you may exercise further usage rights as specified in the indicated licence. www.econstor.eu
Transcript of Time-varying market price of risk in the CAPM - EconStor

econstorMake Your Publications Visible.
A Service of
zbwLeibniz-InformationszentrumWirtschaftLeibniz Information Centrefor Economics
Hafner, Christian M.; Herwartz, Helmut
Working Paper
Time-varying market price of risk in the CAPM:Approaches, empirical evidence and implications
SFB 373 Discussion Paper, No. 1999,22
Provided in Cooperation with:Collaborative Research Center 373: Quantification and Simulation ofEconomic Processes, Humboldt University Berlin
Suggested Citation: Hafner, Christian M.; Herwartz, Helmut (1999) : Time-varying market priceof risk in the CAPM: Approaches, empirical evidence and implications, SFB 373 DiscussionPaper, No. 1999,22, Humboldt University of Berlin, Interdisciplinary Research Project 373:Quantification and Simulation of Economic Processes, Berlin,http://nbn-resolving.de/urn:nbn:de:kobv:11-10056148
This Version is available at:http://hdl.handle.net/10419/61747
Standard-Nutzungsbedingungen:
Die Dokumente auf EconStor dürfen zu eigenen wissenschaftlichenZwecken und zum Privatgebrauch gespeichert und kopiert werden.
Sie dürfen die Dokumente nicht für öffentliche oder kommerzielleZwecke vervielfältigen, öffentlich ausstellen, öffentlich zugänglichmachen, vertreiben oder anderweitig nutzen.
Sofern die Verfasser die Dokumente unter Open-Content-Lizenzen(insbesondere CC-Lizenzen) zur Verfügung gestellt haben sollten,gelten abweichend von diesen Nutzungsbedingungen die in der dortgenannten Lizenz gewährten Nutzungsrechte.
Terms of use:
Documents in EconStor may be saved and copied for yourpersonal and scholarly purposes.
You are not to copy documents for public or commercialpurposes, to exhibit the documents publicly, to make thempublicly available on the internet, or to distribute or otherwiseuse the documents in public.
If the documents have been made available under an OpenContent Licence (especially Creative Commons Licences), youmay exercise further usage rights as specified in the indicatedlicence.
www.econstor.eu

Time�Varying Market Price of Risk in the CAPM �
Approaches� Empirical Evidence and Implications
Christian M� Hafner Helmut Herwartz �
January ����
Abstract
Time�varying risk premia traditionally have been associated with the empirical
fact that conditional second moments are time�varying� This paper additionally
examines another possible source for time�varying risk premia� namely the market
price of risk �lambda�� For utility functions that do not imply constant risk aversion
measures� the market price of risk will in general change over time� We provide em�
pirical evidence for the German stock market in a bivariate GARCH�M framework
using alternative speci�cations for lambda� The results indicate that a model with
lambda being a function of typical volatility measures performs best for most series�
To facilitate the interpretation of the results� we plot impulse response functions of
the risk premia�
Keywords� Market price of risk� Multivariate GARCH�Models� impulse response analysis�
CAPM
�Institut f�ur Statistik und �Okonometrie and Sonderforschungsbereich ���� Wirtschaftswis�
senschaftliche Fakult�at� Humboldt�Universit�at zu Berlin� Spandauer Str� �� D����� Berlin� Germany�
e�mail hafner�wiwi�hu�berlin�de or helmut�wiwi�hu�berlin�de� Financial support by the Deutsche
Forschungsgemeinschaft and helpful comments of an anonymous referee are gratefully acknowledged�
�

� Introduction
For at least a decade now� there have been no doubts about the empirical evidence for time�
varying risk premia of �nancial assets� So far� this stylized fact was mainly attributed to
the time�varying behavior of conditional second moments� For example� Engle� Lilien and
Robins ���� establish a link between the risk premium and the ARCH�type volatility�
the so�called ARCH�M model� For the capital asset pricing model �CAPM�� Bollerslev�
Engle and Wooldridge ���� introduce time�varying covariances to obtain time�varying
betas and thus time�varying risk premia using multivariate generalized ARCH �GARCH�
models� The increasing experience with multivariate GARCH models over past years has
led to more adequate volatility speci�cations �Hafner and Herwartz� ���a�� However� to
obtain a feasible econometric model in the CAPM� a typical assumption is that the market
price of risk� the so�called lambda� is constant over time� In this paper� we argue that this
assumption may be too restrictive� There are two scenarios for which the market price of
risk is time�varying� First� for utility functions that imply both absolute and relative risk
aversion to be dependent on the return� market price of risk is in general a function of
the conditional �rst and second moment of the return� Second� if the utility function has
parameters that are time�varying and determine the degree of risk aversion� We provide
examples for both scenarios�
We give empirical evidence of time�varying market price of risk for the German stock
market� To this end� we use a multivariate GARCH framework as in Bollerslev� Engle�
and Wooldridge ���� and Hafner and Herwartz ����a�� For lambda� we employ various
speci�cations� The result of the empirical part is that for the majority of analyzed series
a model for which lambda depends on lagged squared innovations outperforms models
with constant lambda� This suggests that there is a link between the market price of
risk and typical volatility measures� The parameter estimates imply a positive relation
between lambda and lagged squared innovations� The interpretation is that for large
lagged innovations� not only volatility increases� but also lambda� Thus� there is a double
e ect on the risk premium� the one stemming from volatility� the other from a time�varying
lambda�
In order to analyze the consequences for the risk premium� we further suggest an
impulse response methodology as in Hafner and Herwartz ����b�� For the preferred
speci�cation of lambda� the risk premium is a simple linear function of volatility and lagged
squared innovation� Thus� impulse response analysis can be performed by computing
conditional expectations of the risk premium�
�
� The CAPM with Time�varying Market Price of
Risk
In the standard CAPM framework with riskfree rate rf � n risky assets with price vector
St � �S��t� � � � � Sn�t�� and the vector of gross returns rt � �r��t� � � � � rn�t�
�� with ri�t �
Si�t�Si�t��� the basic equilibrium equation is
Et���rt � rf�t� � ��twt��� ���
In ���� �t is the covariance matrix of the risky assets at time t conditional on the infor�
mation set available at time t � �� �t��� and wt is the weight vector of the assets in the
market portfolio at time t� The parameter � is the aggregated coe�cient of risk aversion
and is sometimes referred to as lambda� the market price of risk� For the assumptions
underlying the CAPM� the individual expected utilities are functions only of the mean
and variance of the returns� Thus� the expected utility E�U�rm�t�� of the representative
agent can be denoted by v��t� ��m�t� and in equilibrium
� � ���v����m�t
�v���t�
By denoting �t � Et���r�
twt��� and ��m�t � w�
t���twt�� the conditional mean and
conditional variance of the market portfolio� respectively� we can speci�cally write from
��� for the market portfolio
Et���rm�t � rf�t� � ���m�t ���
and by substituting for � in ���
Et���rt � rf�t� � �tEt���rm�t � rf�t� ���
with the vector �t � �twt�����m�t� This is the well known market beta form of the CAPM�
which is due to Sharpe ������ and Lintner ������� It remains valid when we assume � to be
a time�varying function of the past� �t� because it obviously cancels out in the derivation
of ���� see also Gouri�eroux ����� p� ��� However� the correct assumption concerning
� remains an important issue when estimating ���� because the expected market return
is not observed� In the literature� one traditionally assumed that � is constant� It is well
known that this can be justi�ed in the following cases�
�� The representative agent has constant relative risk aversion and logarithmic returns
are normally distributed�
�� The representative agent has constant absolute risk aversion and gross returns are
normally distributed�
One can imagine� however� that in more general situations the risk aversion parameter �
is not constant but a function of the past� We give two examples of such situations�
�

�� The utility function of the representative agent is of the form
U�rm�t� � �rm�t � exp��rm�t��
For � � �� we obtain the special case of exponential utility� i�e� constant absolute
risk aversion� and for � � the linear utility� i�e� risk neutrality� For the case of
conditionally normally distributed returns� N��t� ��m�t�� we obtain
E�U�rm�t�� � ��t � exp���t � �����m�t�
and
�t � ��v����m�t
�v���t�
�
� exp��t � �����m�t� � �
Here� �t is a function of the past through the conditional moments �t and ��m�t�
�� The utility function of the representative agent is of the power form� say� with time
dependent relative risk aversion at�
Ut�rm�t� �r��atm�t � �
�� at
where at is a function of the past� This can be motivated� for example� by habit
persistence� For at � �� logarithmic utility is obtained as a special case�
In general� the aggregated risk aversion parameter �t will therefore be time�varying and
this should be taken into account when specifying the econometric model of the CAPM�
An econometric speci�cation of the CAPM augmented by an intercept term is given
for asset i as
ri�t � � � Et���rf�t� � �i�tEt���rm�t � rf�t� � i�t ���
with the asset�s �beta� �i�t � �im�t���m�t measuring the undiversi�able risk associated with
a speci�c asset� The inclusion of � in ��� does not follow from the CAPM� hence� standard
speci�cation tests of the CAPM amount to test against whiteness of estimated residuals
and against H� � � � �� Note that in the form ��� the model cannot be estimated because
both conditional expectations on the right hand side are unobserved� For the riskfree rate
we can assume Et���rf�t� � rf�t��� but for Et���rm�t � rf�t� we have to resort to the form
��� by specifying � and ��m�t�
Time varying variances and covariances may be introduced assuming the bivariate
error sequence t � �i�t� m�t�� to exhibit conditional heteroskedasticity� i�e�
�t � E�t�
tj�t��� �
�� ��i�t �im�t
�im�t ��m�t
�A �
As a parametric speci�cation of �t one may adopt a multivariate GARCH�type model�
This turned out to be useful in many previous empirical studies of multivariate �nancial
time series�
�

With the above considerations� the market�price of risk given in ��� can be written as
�t �Et���rm�t�� rf�t��
��m�t
���
and is assumed here to be time�varying� as motivated above� This contrasts previous
speci�cations of �t being constant over time as in Bollerslev� Engle and Wooldridge ����
and Hafner and Herwartz ����a�� We will suggest some speci�cations for �t in Section
��
De�ning the bivariate excess return series yt � �ri�t � rf�t��� rm�t � rf�t���� one obtains
the bivariate model
yt � � � �t
�� �im�t
��m�t
�A� t� ���
which can be interpreted as a GARCH�M model �Engle� Lilien� Robins� ��� with time�
varying coe�cient�
Instead of estimating the CAPM by means of a set of bivariate equations one may
regard a system of �seemingly unrelated� equations collecting ri�t � rf�t��� i � �� � � � � n
and rm�t� rf�t�� as a competing econometric device� From such a system representation a
unique estimate of �t could be obtained� With respect to estimation e�ciency� however�
a simultaneous estimation is not expected to improve the set of equations form in ����
Note that the error terms in t are supposed to capture unsystematic risk which should
hardly show any correlation pattern across assets and thus we refrained from performing
a system estimation �see e�g� Judge et al�� ��� Chapter ����
Due to the complicated iterative procedure neccessary to estimate ��� one may also
regard the system estimation of the CAPM with time varying coe�cients to be unfeasible
in practice� To address the issue of estimating the market�s �t we provide a brief illustra�
tion of estimated �t processes stemming from investigations of di erent assets using ���
within the discussion of our estimation results�
Candidate parametric models for �t and �quasi��maximum�likelihood estimation �QML�
of the model in ��� will be outlined in the next section�
� Bivariate GARCH�typeModels � Speci�cation and
Estimation
The generalization of univariate �G�ARCH�type models of conditional heteroskedasticity
�see Engle� ���� and Bollerslev� ���� to the bivariate case is more or less straightforward�
The two�dimensional random vector t � �i�t� m�t�� may be written as
t � ����t �t ��
�

where �t denotes an i�i�d� random vector with mean zero and covariance matrix equal to
the bivariate identity matrix �I��� Conditional on �t��� the elements of �t are completely
determined by their own history �t�i� i � �� � � � � p� and lagged observations t�i� i �
�� � � � � q� The so�called vec�speci�cation of the multivariate GARCH�p� q� model provides
the dynamics of the elements of the lower fraction of �t� i�e� vech��t��
vech��t� � c �qX
i��
Aivech�t�i�
t�i� �pXi��
Givech��t�i�� ��
In ��� Ai and Gi denote �� � �� matrices� Additionally� � parameters in the vector
c account for time invariant variance components� Since QML estimation of GARCH�
type models involves non�linear optimization routines one may imagine that even for the
multivariate GARCH����� model the vec�speci�cation easily becomes intractable� The
dimension of the relevant parameter space may be reduced e�g� by assuming the matrices
Ai and Gi to be diagonal as adopted e�g� by Bollerslev� Engle� and Wooldridge ���� such
that the �k� l��element in �t depends linearly on the respective elements of the matrices
t�i�
t�i and �t�i� However� the diagonal vec�model a�priori excludes possibly important
cross dynamics relating one variable�s conditional volatility on lagged innovations observed
for another variable� A more general structure allowing for interdependence is given by
the so�called BEKK�model �Baba� Engle� Kraft and Kroner� ������
�t � C �
�C� �KXk��
qXi��
A�
kit�i�
t�iAki �KXk��
pXi��
G�
ki�t�iGki� ���
where C� is an upper triangular matrix and Aki and Gki are � � � parameter matrices�
Even in the case K � �� the model in ��� relates each element of �t to all elements in
t�i�
t�i and �t�i� Note that ��� ensures �t to be positive de�nite without imposing further
parameter restrictions� Engle and Kroner ������ discuss the BEKK�model in detail� For
the present analysis we take K � � and concentrate on the GARCH����� model� In
this case the assumption that the upper left elements of A�� and G�� are greater than
zero is su�cient for the model parameters to be identi�ed� As in Hafner and Herwartz
����a� we adopt extensions of the symmetric GARCH�models given above in order to
allow the potential of a larger impact of bad news �negative lagged innovations� compared
with good news �positive lagged innovations� on volatility� This empirical phenomenon
is known since Black ����� and is frequently called �leverage e ect�� It may be regarded
as a stylized fact of conditional variances of risky assets� A comprehensive list of the
variance speci�cations under study reads as follows�
M�� �t � C �
�C� � A�
��t���
t��A�� �G�
���t��G�� ����
M�� �t � C �
�C� � A�
��t���
t��A�� � A�
��t���
t��A��I���t���� �G�
���t��G�� ����
M�� �t � C �
�C� � A�
��t���
t��A�� � A�
��t���
t��A��I���t���� �G�
���t��G�� ����
M�� �t � C �
�C� � A�
��t���
t��A��
� A�
��t���
t��A��I���t���� � A�
��t���
t��A��I���t���� �G�
���t��G�� ����
�
In ���� to ����� I��� denotes the indicator function� Note that these models may be
regarded as natural extensions of the univariate threshold GARCH�model introduced
by Glosten� Jagannathan and Runkle ������ and Zakoian ������� However� one may
think of other devices to take asymmetry into account� For example� Braun� Nelson and
Sunier ������ introduce the bivariate exponential GARCH�model� Engle and Ng ������
provide an empirical comparison of the GARCH and exponential GARCH model in the
univariate case� They conclude that empirically both the threshold and the exponential
GARCH applied to a Japanese stock index series perform similarly� that the EGARCH
model however tends to overweigh the impact of large innovations on volatility� due to
the exponential increase of the news impact curve� Also� an impulse response analysis of
volatility is easier to do for the additive TGARCH than for the multiplicative EGARCH
model� Since news might occur in the system through each of the components of t and
thus of �t simultaneously or separately� we distinguish models M� to M� as asymmetric
counterparts of the symmetric speci�cation M��
Engle and Kroner ������ state that for each BEKK model there is a unique equivalent
vec�representation� Thus� when discussing the properties of M� to M�� we can also
consider the equivalent vec�speci�cation by de�ning c� � �C� � C���vec�I��� A
�
� � �A�� �
A����� A�
� � �A�� � A����� A�
� � �A�� � A����� and G�
� � �G�� � G����� After eliminating
from c�� A�
�� A�
�� A�
�� and G�
� those rows and columns that are super�uous due to the
symmetry of covariances� one obtains the matrices c� A�� A�� A�� and G� as in ��� This
transformation is notationally more convenient and is consistent with the next section
where we discuss impulse response functions only for the vec�speci�cation� The following
proposition provides a result for the covariance stationarity of the model M�� The result
applies immediately to M�� M� and M� by setting the corresponding matrices A� and or
A� to zero�
Proposition � Assume that both components of the error �t have a symmetric density
around zero� Then the process t is covariance stationary if and only if all eigenvalues of
A� � A��� � A��� �G� ����
have moduli less than one� For the implied unconditional covariance matrix �� one obtains
vech��� � E�vech�t�
t�� � �I� � A� � A���� A����G����c� ����
Proof� Hafner and Herwartz �����a��
The elements of the parameter matrices in ���� to ���� and the additional parameters
in ��� are conveniently estimated by numerical procedures� Within this study we used
the BHHH�algorithm as described e�g� in Judge et al� ���� to maximize the quasi
log�likelihood function derived under the assumption of normally distributed innovations
�
�t� Under normality� the contribution of an observation
t � yt � � � �t
�� �im�t
��m�t
�A
to the joint log�likelihood of a sample with T observations �logL �PT
t�� lt� is obtained
as�
lt � � ln������
�ln j�tj �
�
��t�
��t t� ����
Although consistency of the QML�estimation has not been proven yet for the multivariate
case we conjecture such a result along the lines given in Bollerslev and Wooldridge ������
and Lumsdaine ������ for the univariate case�
� Speci�cations of the Market Price of Risk and Em�
pirical Results
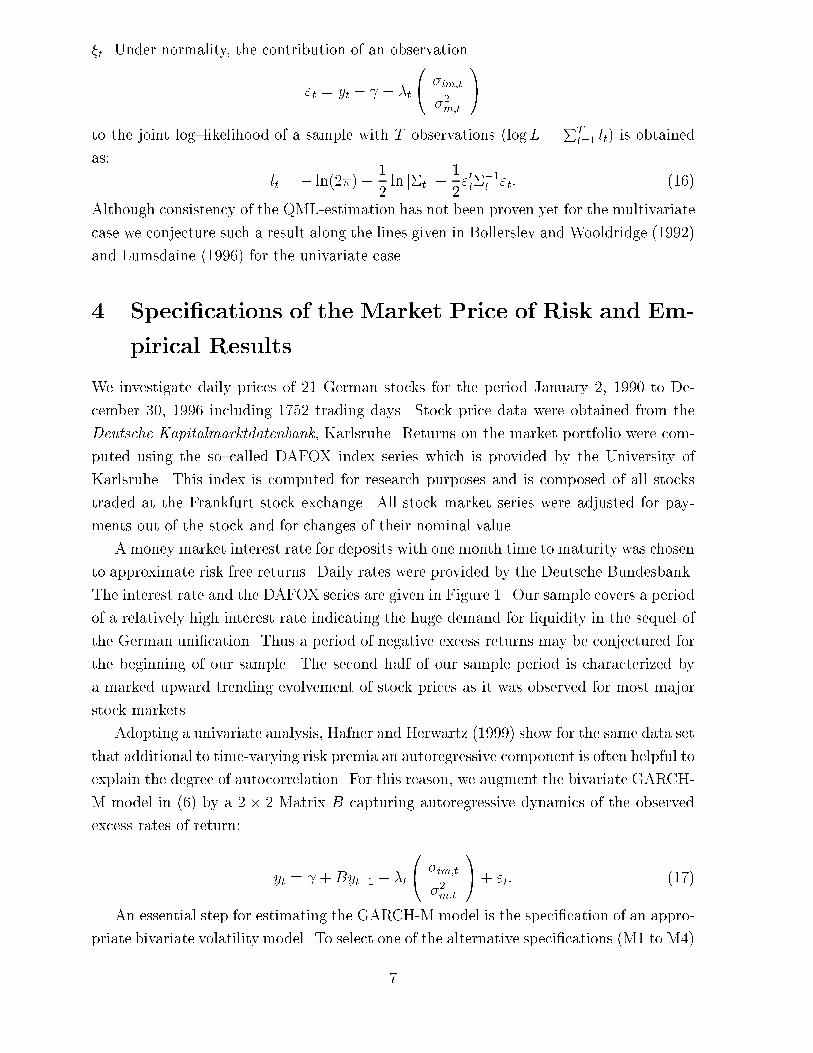
We investigate daily prices of �� German stocks for the period January �� ���� to De�
cember ��� ���� including ��� trading days� Stock price data were obtained from the
Deutsche Kapitalmarktdatenbank� Karlsruhe� Returns on the market portfolio were com�
puted using the so�called DAFOX index series which is provided by the University of
Karlsruhe� This index is computed for research purposes and is composed of all stocks
traded at the Frankfurt stock exchange� All stock market series were adjusted for pay�
ments out of the stock and for changes of their nominal value�
A money market interest rate for deposits with one month time to maturity was chosen
to approximate risk free returns� Daily rates were provided by the Deutsche Bundesbank�
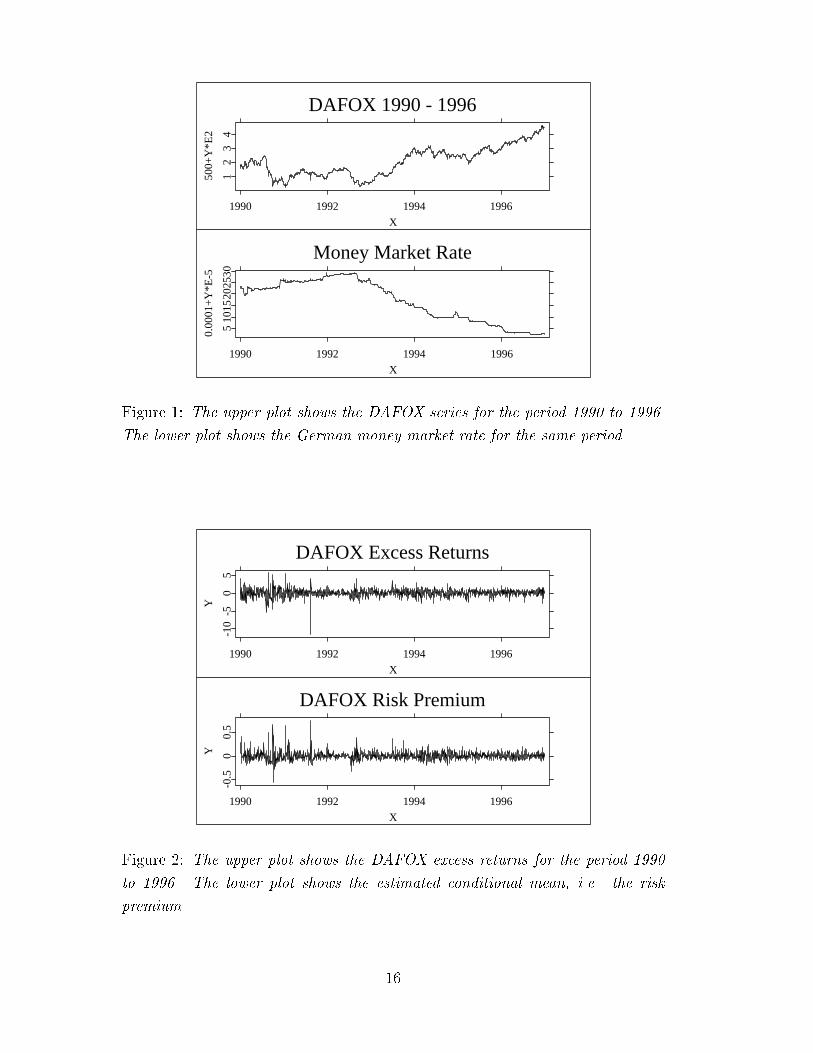
The interest rate and the DAFOX series are given in Figure �� Our sample covers a period
of a relatively high interest rate indicating the huge demand for liquidity in the sequel of
the German uni�cation� Thus a period of negative excess returns may be conjectured for
the beginning of our sample� The second half of our sample period is characterized by
a marked upward trending evolvement of stock prices as it was observed for most major
stock markets�
Adopting a univariate analysis� Hafner and Herwartz ������ show for the same data set
that additional to time�varying risk premia an autoregressive component is often helpful to
explain the degree of autocorrelation� For this reason� we augment the bivariate GARCH�
M model in ��� by a � � � Matrix B capturing autoregressive dynamics of the observed
excess rates of return�
yt � � �Byt�� � �t
�� �im�t
��m�t
�A� t� ���
An essential step for estimating the GARCH�M model is the speci�cation of an appro�
priate bivariate volatility model� To select one of the alternative speci�cations �M� to M��

listed in Section � we estimated the GARCH�M model in ��� assuming � to be constant
with all competing volatility models� Numerical procedures written in GAUSS ��� were
used to perform QML estimation of ���� The resulting values of the log�likelihood func�
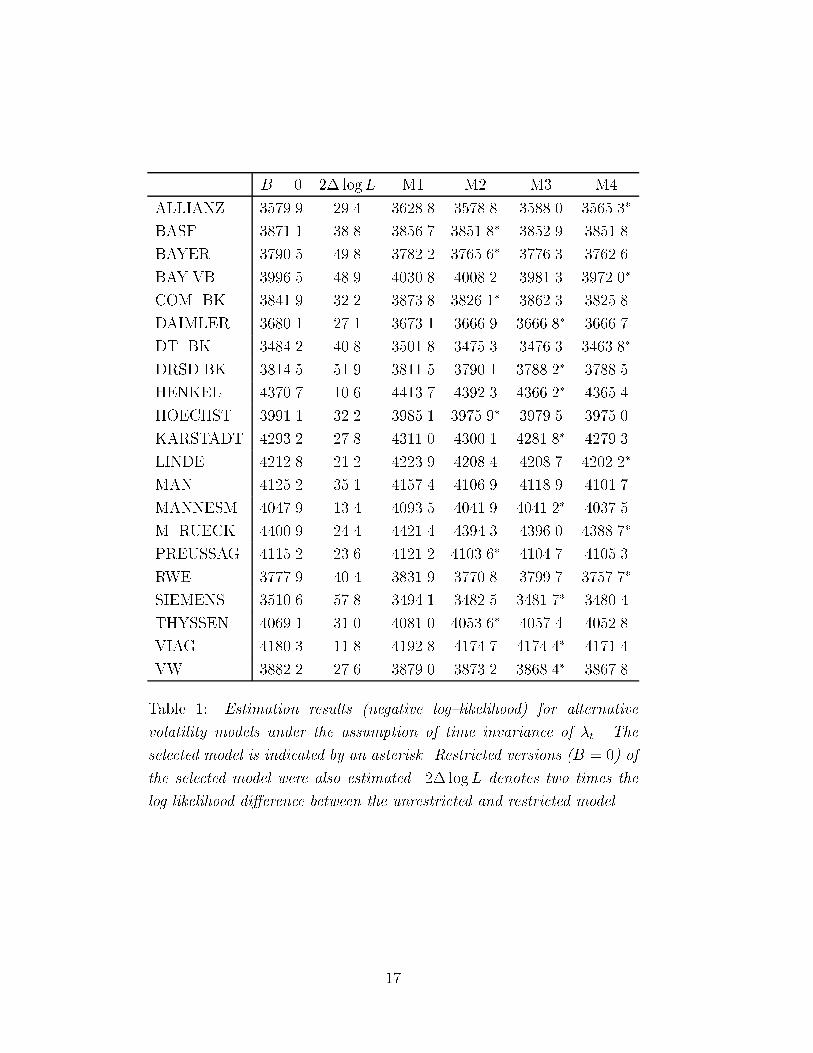
tion are provided in Table �� Note that the most general model �M�� has � �� additional
parameters relative to M� and M� �M��� Without relying too much on formal tests we
selected M� as a convenient volatility model for a given series in question if the value of
its log�likelihood exceeded the respective measure of M� and M� by at least ��� points�
The symmetric model �M�� is clearly rejected for almost all series under study relative
to the remaining speci�cations� Since M� and M� are comprised by the same number
of model parameters� the choice between these models was determined by comparing the
respective maximum values of the log�likelihood function� In Table � selected variance
speci�cations are indicated with an asterisk� To provide some insight into the relevance of
autocorrelation for the series under study� the �rst column of Table � provides the values
of the log�likelihood obtained if the matrix B in ��� is restricted to be a zero matrix� The
log�likelihood values of the restricted model may be directly compared with the selected
speci�cation of a GARCH�M model including B� Neglecting autocorrelation involves a
loss measured by means of the log�likelihood which is signi�cant at all conventional levels
for almost all series under study�
To allow for time dependence of �t we adopted the following parametric speci�cations�
L�� �t � � � ���m�t
L�� �t � � � ��m�t����
�m�t
L�� �t � � � ��m�t����
�m�t��
L�� �t � � � �jm�t��j
L�� �t � � � ���m�tI��m�t�����
L�� �t � � � ��m�t����
�m�tI��m�t�����
L� �t � � � ��m�t����
�m�t��I��m�t�����
L� �t � � � �jm�t��jI��m�t�����
L�� �t � � � ���m�tI��m�t����� � ��
�m�tI��m�t�����
L��� �t � � � ��m�t����
�m�tI��m�t����� � �
�m�t����
�m�tI��m�t�����
L��� �t � � � ��m�t����
�m�t��I��m�t����� � �
�m�t����
�m�t��I��m�t�����
L��� �t � � � �jm�t��jI��m�t����� � �jm�t��jI��m�t�����
All speci�cations under study relate �t to the history of the return process� �t��� For
none of the models we imposed a positivity constraint� so negative estimates of �t may
be interpreted as evidence against the CAPM� We will come back to this issue in Sec�
tion �� The model L� �L�� states �t to be a linear function in the conditional variance
�absolute lagged return� of the market portfolio� In model L�� �t is related to lagged
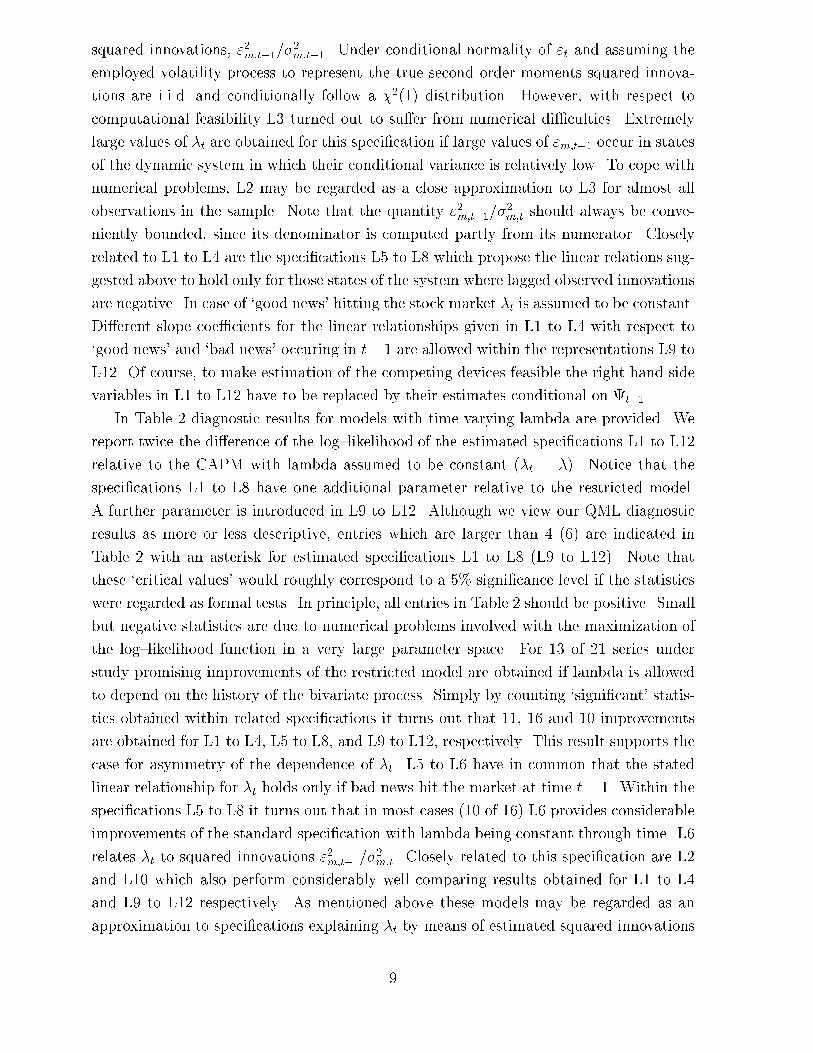
squared innovations� �m�t�����m�t��� Under conditional normality of t and assuming the
employed volatility process to represent the true second order moments squared innova�
tions are i�i�d� and conditionally follow a ����� distribution� However� with respect to
computational feasibility L� turned out to su er from numerical di�culties� Extremely
large values of �t are obtained for this speci�cation if large values of m�t�� occur in states
of the dynamic system in which their conditional variance is relatively low� To cope with
numerical problems� L� may be regarded as a close approximation to L� for almost all
observations in the sample� Note that the quantity �m�t�����m�t should always be conve�
niently bounded� since its denominator is computed partly from its numerator� Closely
related to L� to L� are the speci�cations L� to L which propose the linear relations sug�
gested above to hold only for those states of the system where lagged observed innovations
are negative� In case of �good news� hitting the stock market �t is assumed to be constant�
Di erent slope coe�cients for the linear relationships given in L� to L� with respect to
�good news� and �bad news� occuring in t� � are allowed within the representations L� to
L��� Of course� to make estimation of the competing devices feasible the right hand side
variables in L� to L�� have to be replaced by their estimates conditional on �t���
In Table � diagnostic results for models with time varying lambda are provided� We
report twice the di erence of the log�likelihood of the estimated speci�cations L� to L��
relative to the CAPM with lambda assumed to be constant ��t � ��� Notice that the
speci�cations L� to L have one additional parameter relative to the restricted model�
A further parameter is introduced in L� to L��� Although we view our QML diagnostic
results as more or less descriptive� entries which are larger than � ��� are indicated in
Table � with an asterisk for estimated speci�cations L� to L �L� to L���� Note that
these �critical values� would roughly correspond to a �! signi�cance level if the statistics
were regarded as formal tests� In principle� all entries in Table � should be positive� Small
but negative statistics are due to numerical problems involved with the maximization of
the log�likelihood function in a very large parameter space� For �� of �� series under
study promising improvements of the restricted model are obtained if lambda is allowed
to depend on the history of the bivariate process� Simply by counting �signi�cant� statis�
tics obtained within related speci�cations it turns out that ��� �� and �� improvements
are obtained for L� to L�� L� to L� and L� to L��� respectively� This result supports the
case for asymmetry of the dependence of �t� L� to L� have in common that the stated
linear relationship for �t holds only if bad news hit the market at time t� �� Within the
speci�cations L� to L it turns out that in most cases ��� of ��� L� provides considerable
improvements of the standard speci�cation with lambda being constant through time� L�
relates �t to squared innovations �m�t�����m�t� Closely related to this speci�cation are L�
and L�� which also perform considerably well comparing results obtained for L� to L�
and L� to L�� respectively� As mentioned above these models may be regarded as an
approximation to speci�cations explaining �t by means of estimated squared innovations
�

�m�t�����m�t��� Assuming �t to be linear in ��m�t�� or jm�t��j amounts to minor improve�
ments of the restricted model relative to the assumption of linearity in lagged squared
innovations�
� Impulse Response Analysis of the Risk Premium
For the models suggested in the previous section for the market price of risk� we can now
proceed to investigate the impact of independent innovations on the risk premium� In
general� we will distinguish two di erent sources of innovations� asset speci�c and market
innovations� They are represented by the stochastically independent innovations �i�t and
�m�t in model ��� Economically� this independence can be justi�ed if the weight of each
asset in the market portfolio is negligibly small� Recall that our series that represents the
market portfolio� the DAFOX� covers all traded assets at the Frankfurt stock exchange� so
that a potential dependence of asset speci�c and market innovations is reduced as much
as possible�
In our general framework� the risk premium consists of two time varying components�
the volatility part and the price of risk part� It is thus not ex ante clear how the product
of both components reacts to positive or negative innovations� In fact� it may be that
volatility increases for large innovations �as is the case in our GARCH framework� but
that the price of risk decreases� In this case it depends on the magnitude of both e ects
to evaluate whether the risk premium increases or decreases� On the other hand� it may
be that for large innovations also the price of risk increases� which would imply an even
stronger increase of the risk premium�
A particularly simple form for the risk premium is obtained for the model �L���
�t � � � ��m�t����
�m�t�
since then we have for the risk premium
pt �� Et���rm�t�� rf�t�� � �t��m�t � ��
�m�t � �
�m�t��� ���
We de�ne the impulse response function for the risk premium as
Pk��t� � E�pt�k j �t��t� ����
for k � �� �� � � � and �t � ��i�t� �m�t�� the independent innovations to the system as given
in ��� Thanks to the independence of the components of �t� one may consider arbitrary
shock scenarios� An alternative� due to Gallant� Rossi and Tauchen ������� lets shocks
occur in the conditionally dependent t� Since GARCH models are linear in �t � a related
approach considers the derivatives of volatility forecasts with respect to squared t� as in
Baillie� Bollerslev and Mikkelsen ������ for univariate ARCH����type processes�
��

In a multivariate framework� however� considering shocks in t involves the additional
task to determine realistic scenarios that take into account the contemporaneous correla�
tion of the variables� It may be useful to emphasize that we do not have this problem for
our impulse response function� For instance� one innovation may be restricted to zero to
analyze a nonzero innovation in the other component�
Koop� Pesaran and Potter ������ use Monte Carlo techniques to generate the distri�
bution of impulse reponses conditional on initial conditions� an initial shock� intermediate
innovations and the model parameters� all of which can be regarded as random variables�
This approach may provide valuable structural insights into the process dynamics if the
conditional moments can not be determined analytically�
Unlike Gallant� Rossi and Tauchen ������ and Koop� Pesaran and Potter ������� we
do not include a baseline function in ����� so our impulse response function for the risk
premium will approach the unconditional risk premium rather than zero� provided that
pt is stationary�
For the risk premium in ���� we obtain
Pk��t� � �E���m�t�k j �t��t� � �E�
�m�t�k�� j �t��t�
� �E���m�t�k j �t��t� � �E��
�m�t�k�� j �t��t�
� �Vm�k��t� � �Vm�k����t� ����
where Vk��t� � E���m�t�k j �t��t� denotes the volatility impulse response function as
introduced by Hafner and Herwartz ����b�� As condition on �t we consider the steady
state� i�e� �t � �� This is not a crucial restriction� because varying the state of �t only
a ects the level of Pk interpreted as a function of �t� but not its typical shape� We see that
the impulse response function for the risk premium for this particular model �L�� is just a
linear combination of volatility impulse response functions� These are nonlinear functions
of �t� but they can be calculated analytically� For example� for the vec�GARCH�����
model� we have
V���t� � c� A�vech������t�
�
t����� �G�vech����
and� for k � ��
Vk��t� � c� �A� �G��Vk����t��
In the limit� Pk��t� approaches the unconditional risk premium� which is for model L�
the rescaled unconditional market variance ��m�
limk��
Pk��t� � � � � ����m�
For the case � � � � �� the impulse response for the risk premium converges to zero�
This case could be interpreted as unconditional risk neutrality� whereas conditionally the
representative agent may still reveal risk aversion or risk loving behavior� depending on
the sign of � and �� and on the evolution of Vm�k��t��
��

When we are interested in impulse response functions for the threshold models �L��
and �L���� we have to make an assumption concerning the symmetry of the distribution
of �t� For the symmetric case� we obtain for �L��
Pk��t� � �Vm�k��t� � �
�Vm�k����t��
and for �L���
Pk��t� � �Vm�k��t� � � � �
�Vm�k����t��
The estimated impulse response functions for the bivariate series ALLIANZ�DAFOX
and DAIMLER�DAFOX are given in Figure �� There are two independent innovations in
the vector �t and we choose an isolated point of view by restricting one at time t to be
zero� the other to vary� The left axes show in the panels on the left �i�t� i�e� an innovation
to the asset� in the panels on the right they represent an innovation to the market� �m�t�
The functions are plotted for �fty time periods�
First� notice that the unconditional lambda for ALLIANZ is negative� which in the
light of the CAPM appears very unusual� because it would imply risk loving behavior�
In fact� this may even be viewed as an inconsistency with the standard CAPM model�
Negative lambdas were found for the majority of analyzed series� However� recall from
Figure � that the beginning of the time period� ���� until ����� was characterized by the
e ects of the German uni�cation� rising interest rates and stagnating stock prices� For
the end of the sample period� lambdas are predominantly positive� so one should consider
longer samples to infer against the CAPM�
For ALLIANZ� both plots show a similar pattern� the risk premium tends to decrease
when the innovations are negative� while it remains at about the same level for positive
innovations� This asymmetry arises from the threshold GARCH speci�cation for volatility�
because for ALLIANZ we have chosen the double asymmetric speci�cation M�� For
the chosen model L�� the parameter estimates are such that � is negative with larger
absolute value than �� which is positive� Since there is high persistence in volatility �the
eigenvalues of the matrix A� � A��� � A��� � G� in ���� are close to one� volatility is
slowly changing over time and we see from ���� that the function will behave similarly to
the corresponding volatility impulse response� but with negative sign�
For DAIMLER �lower plots�� the unconditional lambda is positive and the risk pre�
mium impulse responses thus display a pattern similar to volatility impulse responses�
The function for the asset�speci�c innovation increases at the �rst periods� since we re�
stricted the second component in �t �i�e� the market innovation� to be zero� thus volatility
is underestimated� The variation in the response functions to asset�speci�c news is less
than the variation caused by market�speci�c news� but the persistence is higher� Note also
that the preferred volatility speci�cation was double�asymmetric �M�� for ALLIANZ and
market�innovation asymmetric �M�� for DAIMLER� This is the reason for the ALLIANZ
functions to be both asymmetric� whereas for DAIMLER only the response to market
��
innovations is asymmetric� The asymmetry is caused by the volatility leverage e ect�
Obviously there are inverse e ects for the risk premium depending on the lambdas� when
lambdas are positive� the risk premium behaves similar to volatility� so there is the usual
leverage e ect also for the risk premium� When lambda is negative� signs revert and risk
premia decrease strongly for negative innovations�
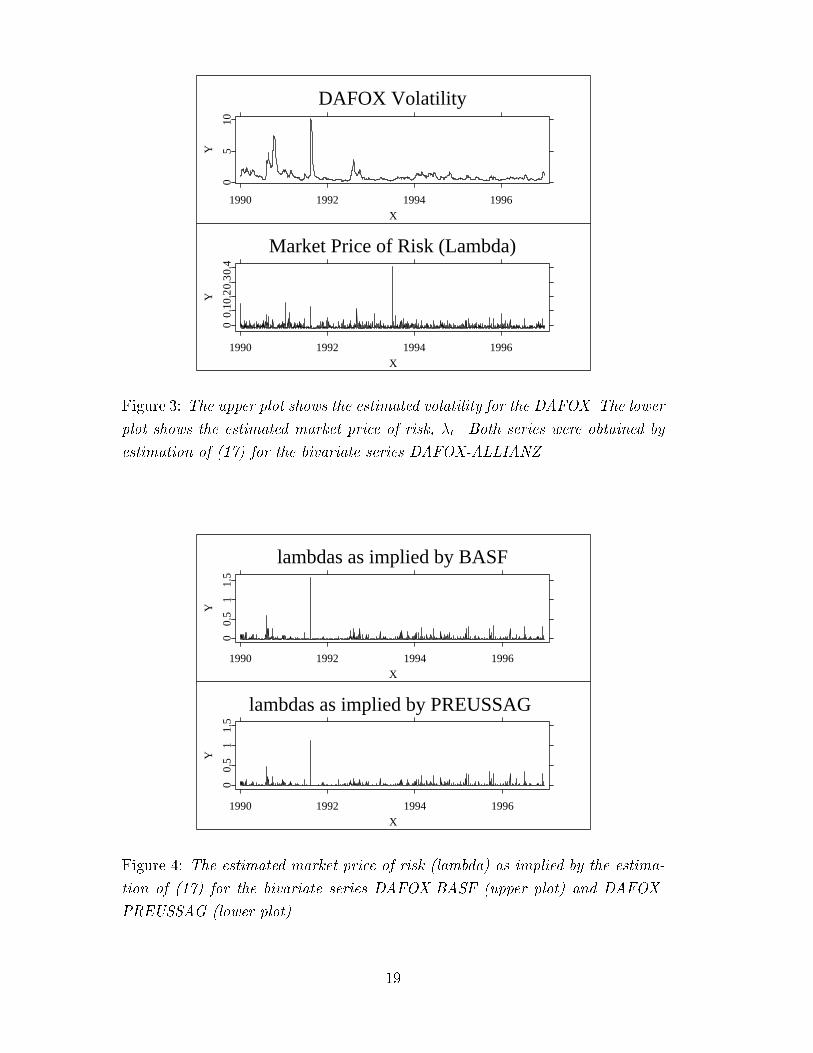
In the light of the CAPM� we would expect to obtain estimated lambdas that are the
same� or at least very similar� for all series� To give an example� we plotted the estimated
lambda series for BASF� PREUSSAG �Figure �� and ALLIANZ �Figure ��� For BASF
and PREUSSAG� the lambdas look very similar� but for ALLIANZ it somewhat di ers�
In particular� the large peaks occur at di erent times� For BASF PREUSSAG the largest
peak goes along with a large increase in volatility �upper panel of Figure ��� whereas for
ALLIANZ the largest peak occurs in a low�volatility state� This may also be explained
by the inverse relation of risk premia and volatility for ALLIANZ�
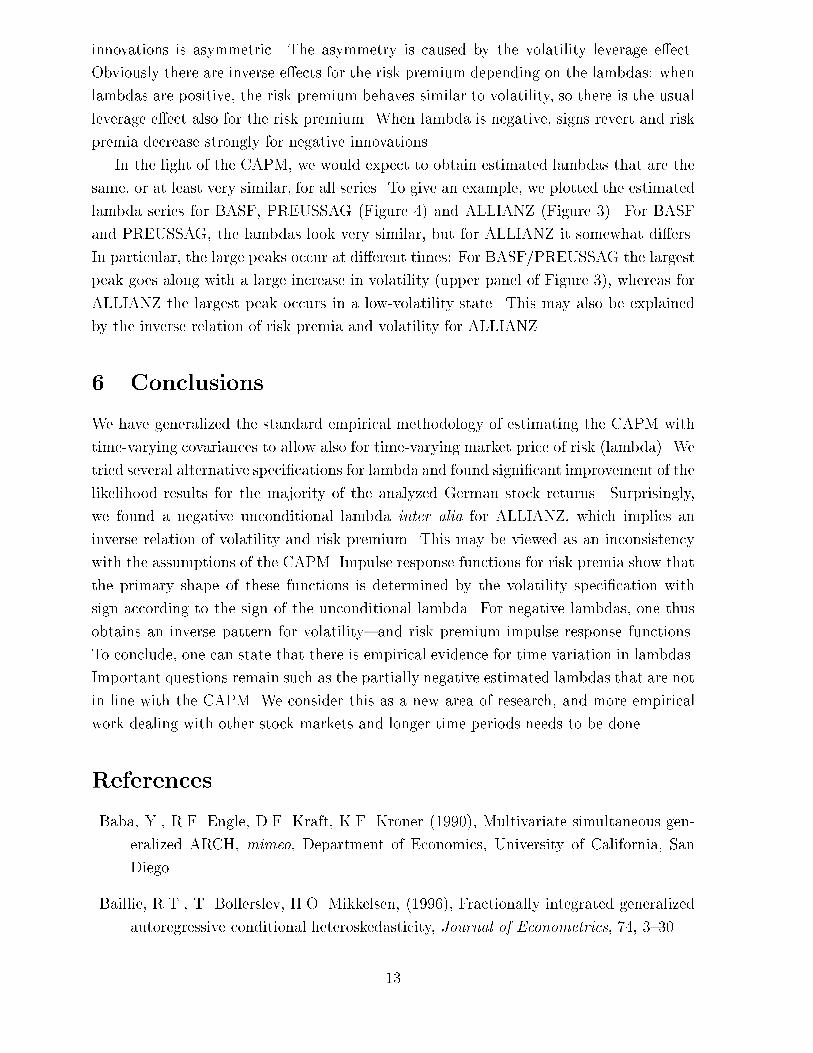
� Conclusions
We have generalized the standard empirical methodology of estimating the CAPM with
time�varying covariances to allow also for time�varying market price of risk �lambda�� We
tried several alternative speci�cations for lambda and found signi�cant improvement of the
likelihood results for the majority of the analyzed German stock returns� Surprisingly�
we found a negative unconditional lambda inter alia for ALLIANZ� which implies an
inverse relation of volatility and risk premium� This may be viewed as an inconsistency
with the assumptions of the CAPM� Impulse response functions for risk premia show that
the primary shape of these functions is determined by the volatility speci�cation with
sign according to the sign of the unconditional lambda� For negative lambdas� one thus
obtains an inverse pattern for volatility� and risk premium impulse response functions�
To conclude� one can state that there is empirical evidence for time variation in lambdas�
Important questions remain such as the partially negative estimated lambdas that are not
in line with the CAPM� We consider this as a new area of research� and more empirical
work dealing with other stock markets and longer time periods needs to be done�
References
Baba� Y�� R�F� Engle� D�F� Kraft� K�F� Kroner ������� Multivariate simultaneous gen�
eralized ARCH� mimeo� Department of Economics� University of California� San
Diego�
Baillie� R�T�� T� Bollerslev� H�O� Mikkelsen� ������� Fractionally integrated generalized
autoregressive conditional heteroskedasticity� Journal of Econometrics� �� �����
��

Black� F� ������ Studies in stock price volatility changes� Proceedings of the �� Meet�
ing of the Business and Economics Statistics Section� American Statistical Associ�
ation� �����
Bollerslev� T� ������ Generalized autoregressive conditional heteroskedasticity� Journal
of Econometrics� ��� ������
Bollerslev� T�� R�F� Engle� J�M� Wooldridge ����� A capital asset pricing model with
time varying covariances� Journal of Political Economy� ��� ��������
Bollerslev� T�� J�M� Wooldridge ������� Quasi�maximum likelihood estimation and in�
ference in dynamic models with time�varying covariances� Econometric Reviews� ���
�������
Braun� P�A�� D�B� Nelson� A�M� Sunier ������� Good News� Bad News� Volatility� and
Betas� Journal of Finance� ��� ���������
Engle� R� ������ Autoregressive conditional heteroskedasticity with estimates of the
variance of U�K� in�ation� Econometrica� ��� ������
Engle� R�F�� K�F� Kroner ������� Multivariate simultaneous generalized ARCH� Econo�
metric Theory� ��� ��������
Engle� R�F�� D�M� Lilien� R�P� Robins ����� Estimating time varying risk premia in
the term structure� The ARCH�M model� Econometrica� ��� �������
Engle� R�F�� V�K� Ng ������� Measuring and testing the impact of news on volatility�
Journal of Finance� �� ������
Gallant� A�R�� P�E� Rossi� G� Tauchen ������� Nonlinear dynamic structures� Economet�
rica� ��� �����
Glosten� L�R�� R� Jagannathan� D�E� Runkle ������� On the relation between the ex�
pected value and the volatility of the nominal excess return on stocks� Journal of
Finance� �� �������
Gouri�eroux� C� ������ ARCH Models and Financial Applications� Springer Series in
Statistics� Springer Verlag� New York�
Hafner� C�M�� H� Herwartz ����a�� Structural analysis of portfolio risk using beta im�
pulse response functions� Statistica Neerlandica� ��� ��������
Hafner� C�M�� H� Herwartz ����b�� Volatility impulse response functions for multivariate
GARCH models� CORE Discussion Paper ��� Louvain�la�Neuve�
��
Hafner� C�M�� H� Herwartz ������� Testing for linear autoregressive dynamics under
heteroskedasticity� SFB �� Discussion Paper� Humboldt�Universit"at zu Berlin�
Judge� G�G�� R�C� Hill� W�E� Gri�ths� H� L"utkepohl� T�C� Lee ����� Introduction to
the Theory and Practice of Econometrics� Wiley� New York�
Koop� G�� M�H� Pesaran� S�M� Potter ������� Impulse response analysis in nonlinear
multivariate models�� Journal of Econometrics� �� �������
Lintner� J� ������� The valuation of risk assets and the selection of risky investments in
stock portfolios and capital budgets� Review of Economis and Statistics� �� �����
Lumsdaine� R�L� ������� Consistency and asymptotic normality of the quasi maximum
likelihood estimator in IGARCH����� and covariance stationary GARCH����� mod�
els� Econometrica� ��� �������
Sharpe� W�F� ������� Capital asset prices� A theory of market equilibrium under condi�
tions of risk� Journal of Finance� ��� ��������
Zakoian� J�M� ������� Threshold Heteroskedastic Functions� Journal of Economic Dy�
namics and Control �� ��������
��
DAFOX 1990 - 1996
1990 1992 1994 1996
X1
23
4
500+
Y*E
2
Money Market Rate
1990 1992 1994 1996
X
510
1520
2530
0.00
01+
Y*E
-5
Figure �� The upper plot shows the DAFOX series for the period ���� to ����
The lower plot shows the German money market rate for the same period�
DAFOX Excess Returns
1990 1992 1994 1996
X
-10
-50
5
Y
DAFOX Risk Premium
1990 1992 1994 1996
X
-0.5
00.
5
Y
Figure �� The upper plot shows the DAFOX excess returns for the period ����
to ���� The lower plot shows the estimated conditional mean� i�e� the risk
premium�
��
B � � �# logL M� M� M� M�
ALLIANZ ����� ���� ���� ��� ���� �������
BASF ���� �� ���� ����� ����� ����
BAYER ����� ��� ���� ������ ���� �����
BAY�VB ������ ��� ����� ����� ����� ������
COM� BK� ����� ���� ��� ������ ����� ����
DAIMLER ����� ��� ����� ������ ������ �����
DT� BK� ����� ��� ����� ����� ����� ������
DRSD�BK� ����� ���� ����� ����� ���� ���
HENKEL ���� ���� ����� ������ ������� ������
HOECHST ������ ���� ����� ������ ����� �����
KARSTADT ������ �� ������ ������ ����� �����
LINDE ����� ���� ������ ����� ���� �������
MAN ������ ���� ����� ������ ����� �����
MANNESM ����� ���� ������ ������ ������� �����
M� RUECK� ������ ���� ������ ������ ������ ����
PREUSSAG ������ ���� ������ ������� ����� ������
RWE ��� ���� ����� ��� ���� ����
SIEMENS ������ �� ������ ����� ����� �����
THYSSEN ������ ���� ����� ������� ����� �����
VIAG ����� ��� ����� ���� ������ �����
VW ���� ��� ���� ���� ����� ���
Table �� Estimation results �negative log�likelihood� for alternative
volatility models under the assumption of time invariance of �t� The
selected model is indicated by an asterisk� Restricted versions �B � �� of
the selected model were also estimated� �# logL denotes two times the
log likelihood di erence between the unrestricted and restricted model�
�

�logL
L�
L
L�
L�
L�
L
L�
L
L�
L��
L��
L�
ALLIANZ
�� ���
����
���
����
�
����
����
����
��
����
����
����
���
BASF
����
����
�����
����
���
��
�����
���
���
����
�����
����
���
BAYER
�� ��
����
���
����
����
����
����
����
��
����
��
����
���
BAY�VB�
�����
�����
����
���
�� �
�� �
� ��
���
���
�� �
���
������
���
COM�BK�
� ��
����
����
����
����
����
����
����
� �
��
���
����
��
DAIMLER
� �
��
����
����
���
���
�� ��
�����
��
����
�� ��
����
����
DT�BK�
�� ��
�����
���
����
����
���
���
�����
�����
����
���
���
��
DRSD�BK�
���
���
���
���
�
����
�����
���
���
����
�� �
����
�� �
HENKEL
�� �
�����
���
����
����
�����
��
���
���
����
���
����
��
HOECHST
������
����
���
��
����
���
����
�����
����
����
����
���
���
KARSTADT
���
���
����
����
����
��
��
�
���
��
����
����
����
LINDE
���
�� �
����
����
���
��
���
��
� �
��
���
��
�� �
MAN
������
�����
����
����
�� �
��
���
����
���
����
��
� �
�� �
MANNESM
�����
����
���
����
���
�����
����
��
��
�����
���
����
���
M�RUECK�
���
����
����
���
����
����
����
����
����
����
��
���
����
PREUSSAG
�����
���
����
���
����
��
����
���
����
���
��
����
�� �
RWE
������
�����
����
����
�
���
����
��
��� �
����
���
���
����
SIEMENS
�����
��
���
����
��
����
����
���
�
����
����
���
���
THYSSEN
�����
��
�
���
����
�����
��
�����
��
�����
����
�� �
���
VIAG
������
�����
���
���
����
�� �
��� �
����
�����
���
����
���
���
VW
� ��
���
����
���
����
����
���
���
���
����
����
��
����
Table�Estimationresultsforalternativespeci�cationsof�t�EntriesforL�toL��indicatetwicethedi�erenceofthe
log�likelihoodfunctionfortherespectivemodelwithtimedependent�t
relativetothe�best�speci�cationassuming�t
���
�
DAFOX Volatility
1990 1992 1994 1996
X0
510
Y
Market Price of Risk (Lambda)
1990 1992 1994 1996
X
00.
10.2
0.30
.4
Y
Figure �� The upper plot shows the estimated volatility for the DAFOX� The lower
plot shows the estimated market price of risk� �t� Both series were obtained by
estimation of ��� for the bivariate series DAFOX�ALLIANZ �
lambdas as implied by BASF
1990 1992 1994 1996
X
00.
51
1.5
Y
lambdas as implied by PREUSSAG
1990 1992 1994 1996
X
00.
51
1.5
Y
Figure �� The estimated market price of risk �lambda� as implied by the estima�
tion of ��� for the bivariate series DAFOX�BASF �upper plot� and DAFOX�
PREUSSAG �lower plot��
��

k�i�t �m�t k
�m�t�i�tkk
Figure �� Estimates of the impulse response functions Pk��t� as de�ned in ���� for the risk
premium ��t��m�t� based on the bivariate GARCH�M model ALLIANZ�DAFOX �upper panel�
model L�� and DAIMLER�DAFOX �lower panel� model L�� The independent innovations are
asset speci�c �left panels� and innovations to the DAFOX� The right axes indicate the evolution
over time up to �� periods� The scale of all ordinates is E����
��