Time Use for Sleeping in Relation to Waking Activities · Time Use for Sleeping in Relation to...
42
Time Use for Sleeping in Relation to Waking Activities David F. Dinges, Kenneth M. Fomberstein, Jeffrey H. William, Farid M. Razavi Department of Psychiatry University of Pennsylvania School of Medicine Philadelphia, Pennsylvania Corresponding Author : David F. Dinges, Ph.D. Professor and Chief Division of Sleep and Chronobiology Director, Unit for Experimental Psychiatry Department of Psychiatry University of Pennsylvania School of Medicine 1013 Blockley Hall 423 Guardian Drive Philadelphia, PA 19104-6021 USA Phone (215) 898-9949 Fax (215) 573-6410 e-mail: [email protected]
Transcript of Time Use for Sleeping in Relation to Waking Activities · Time Use for Sleeping in Relation to...

Time Use for Sleeping in Relation to Waking Activities
David F. Dinges, Kenneth M. Fomberstein, Jeffrey H. William, Farid M. Razavi
Department of Psychiatry University of Pennsylvania School of Medicine
Philadelphia, Pennsylvania Corresponding Author: David F. Dinges, Ph.D. Professor and Chief Division of Sleep and Chronobiology Director, Unit for Experimental Psychiatry Department of Psychiatry University of Pennsylvania School of Medicine 1013 Blockley Hall 423 Guardian Drive Philadelphia, PA 19104-6021 USA Phone (215) 898-9949 Fax (215) 573-6410 e-mail: [email protected]

Time Use for Sleeping 2
Abstract
Study Objectives: Evaluate the relationships between sleep time and 16 categories of
waking activities from the American Time Use Survey (ATUS) database to determine
which activities have a reciprocal relationship to sleep time, and which do not.
Design: Cross sectional survey data.
Setting: NA
Participants: A nationally representative U.S. sample of people 15 years and older,
from the 2003 American Time Use Survey. N = 20720.
Interventions: NA
Measurements: A 20-minute telephone interview in which participants were asked
about the activities they engaged in going back 24 hours. Responses were codified
using the 3-tiered ATUS activity classification system. The survey was sponsored by the
Bureau of Labor Statistics and was conducted by the U.S. Census Bureau. Analyses
primarily focused on people who worked weekdays.
Results: Sleep time declined with age, to a low at age 45-54 years, when work time
and pay were high. Only five of seventeen waking activity categories were related to
sleep time—in order of influence: (1) work and work-related activities; (2) time for
traveling; (3) socializing, relaxing and leisure time; (4) household activities; (5) time
spent on caring for household members. As these activities increased, sleep time
decreased (adjusted r2 = 0.464). These relationships were found for both women and
men, despite substantial sex differences in time spent at work, on household activities
and care of household members, in leisure time, sleeping, eating and drinking, and pay.

Time Use for Sleeping 3
Conclusion: Work time and travel time, and to a lesser extent, domestic chores and
leisure time, are the primary activities working adults appear to exchange for sleep time.
Key words: time use, sleep, work, travel, commute, household, leisure, child care

Time Use for Sleeping 4
Introduction
Biomedical and behavioral research has increasingly demonstrated that the daily
need for and timing of sleep is critical for the integrity of waking alertness and cognitive
functions1 and very likely for the maintenance of health2. Although human sleep need is
instantiated in brain mechanisms and our daily sleep-wake cycle is regulated
neurobiologically by a circadian clock,3 which has its origins in Earth’s fundamental
orbital rotation on its axis, modern humans frequently alter the timing and duration of
sleep in exchange for other activities. This appears to be especially the case in current
industrialized societies, where the biological imperative for sleep can be in opposition to
the cultural imperative for wakefulness.4 We theorize that in modern industrialized
societies, where there are extensive options and demands on the use of time both day
and night, sleep is perceived as a flexible commodity, and sleep time is traded for other
activities considered more imperative or of greater value.
Despite the importance of understanding how sleep timing can be influenced by
waking activities, there have been few systematic investigations of possible reciprocal
relationships between sleep time and waking time for specific types of activity. It has
been shown in a time use study that unmarried individuals and those with less than a
college education are significantly more likely to sleep a short amount or a long amount
compared to married people and college-educated people.5 Short sleeping and long
sleeping (i.e., sleep durations below 7 hours and above 8 hours, respectively) have
been found to be associated with increased mortality6 and a greater risk of coronary
heart disease and mortality7in epidemiological studies. Sleep quality—especially
sleeplessness (insomnia)—has also been found to associated with increased risk of
Time Use for Sleeping 5
cardiovascular morbidity and mortality.8-10 The increased prevalence of obesity in
American society is a growing health risk that is associated with sleep duration among
adult Americans. As with morbidity and mortality, both shorter sleep durations (<7.5h)
and longer durations (>8h) have been associated with larger body mass, suggesting
that sleep restriction could be contributing to the increased prevalence of obesity in
American society.6,11,12 These findings raise the possibility that restriction and extension
of sleep time may be contributing to the current obesity epidemic in the U.S.
Whether or not life-style mediated alterations of sleep duration are involved in
obesity and mortality, there is relatively strong evidence that sleep restriction is a major
contributor to errors, accidents and accidental death, especially in transportation
modes.13-17 Concern that inadequate sleep time was leading to chronic sleep restriction
and its resulting performance deficits (and therefore to increased risks of crashes) has
become a major issue in the U.S. relative to proscriptive work rules and fatigue
management, and it has prompted the National Transportation Safety Board to
repeatedly call for updated hours-of-service regulations in all modes of transportation.18
The source of concern about rest times stems from recent studies showing that chronic
restriction of sleep to 7 hours or less a day consistently resulted in impairments of
attention and psychomotor responses, and these impairments accumulated across
consecutive days of sleep restriction to very severe levels.19-21 Analyses of the
relationships between work hours and sleep hours could help inform the public policy
debate about how to ensure workers in regulated industries obtain adequate sleep.
We used the American Time Use Survey (ATUS)22 to evaluate the relationship
between sleep time, work time and various other waking behaviors, to provide insights

Time Use for Sleeping 6
into the aforementioned public health and public safety issues. Specifically, we used the
ATUS database to evaluate precisely which activities have a reciprocal relationship to
sleep time, and which do not.
Methods and Procedures
American Time Use Survey. The ATUS database for the year 2003 was used to
conduct the investigation. “ATUS is a federally administered, continuous survey on time
use in the United States. The goal of the survey is to measure how people divide their
time among life’s activities. ATUS interviews randomly selected individuals from a
subset of the households that complete their eighth and final month interviews for the
Current Population Survey (CPS). ATUS respondents are interviewed only one time
about how they spent their time on the previous day, where they were, and whom they
were with. The survey is sponsored by the Bureau of Labor Statistics and is conducted
by the U.S. Census Bureau. The major purpose of ATUS is to develop nationally
representative estimates of how people spend their time…. In addition to collecting data
about what people did on the day before the interview, ATUS collects information about
where and with whom each activity occurred, and whether the activities were done for
one’s job or business. Demographic information—including sex, race, age, educational
attainment, occupation, income, marital status, and the presence of children in the
household—also is available for each respondent. Although some of these variables are
updated during the ATUS interview, most of this information comes from earlier CPS
interviews, as the ATUS sample is drawn from a subset of households that completed
the CPS.”22,23

Time Use for Sleeping 7
ATUS is a telephone survey in which people are interviewed one time for 15-20
minutes on a pre-selected day (days are selected to ensure that the survey captures
activities every day in the year). Subjects’ participation in the 2003 survey that we used
was voluntary, and they were compensated $40 for completing the survey. ATUS
covers all residents living in households in the United States who are at least 15 years
of age, with the exception of active military personnel and people residing in institutions
such as nursing homes and prisons. The survey was conducted by the U.S. Census
Bureau for the Department of Labor’s Bureau of Labor Statistics. Section 9 of Title 13,
United States Code, ensures that all information about obtained via ATUS strictly
maintains the confidential of the respondents and their households. The U.S. Office of
Management and Budget (OMB) approved the survey.23
The ATUS sample was drawn from the CPS, which is composed of the
approximately 105 million households in the United States and the civilian, non-
institutional population residing in those households. The ATUS sample was a stratified,
three-stage sample. In the first stage of selection, the CPS over-sample in the less-
populous States was reduced. In the second stage of selection, households were
stratified based on the following characteristics: the race/ethnicity of the householder,
the presence and age of children, and the number of adults in adults-only households.
In the third stage of selection, an eligible person from each household selected in the
second stage was randomly selected to be the designated person for ATUS. In 2003,
3,375 households leaving the CPS sample were selected for the ATUS sample each
month (approximately 40,500 households). The ATUS overall response rate averaged
57 percent in 2003. The database analyzed contained 20720 respondents. Full details
Time Use for Sleeping 8
of the sampling methodology and data categorizing are publicly available at the ATUS
website.22, 23
All ATUS interviews were conducted from the U.S. Census Bureau’s telephone
center at the National Processing Center in Jeffersonville, IN. The interviewers
attempted calls in four call blocks throughout the day and were required to make at least
one call in each call block until contact was made with each household. The call blocks
were 09:00 to 11:59, 12:00 to 16:59; 17:00 to 20:59, and 21:00 to 00:00. Calls were not
made between the hours of 00:00 and 08:59. The center used an automated call
scheduler, which tells the interviewers when each household should be called. Once a
household was contacted and the designated person agreed to complete the interview,
the interviewer conducted the interview using computer-assisted telephone interviewing
(CATI).23 When contacted by phone, respondents were asked about the activities they
engaged in going back 24 hours. Responses were codified using the ATUS coding
lexicon, or activity classification system, which is a three-tiered system, with 17 major,
or first-tier, categories, each having two additional levels of detail (tiers). Each third-tier
activity category also contained a list of examples of activities that fall into that
category.24
Codification of activity in ATUS. The 17 different broad categories of activity
codified from ATUS are listed below, along with the second-tier activities. As examples,
third-tier activities are only provided for “sleeping” and “sleeplessness.” Coders at the
telephone center assigned a six-digit classification code to each diary activity reported
by a respondent. The first two digits represented the major activity category; the next

Time Use for Sleeping 9
two digits the second-tier level of detail; and the final two digits represent the third, most
detailed level of activity.23 For example, the ATUS code for “sleeping” is 01.01.01.
1st tier: 01 Personal Care. 2nd tier: 01 Sleeping (3rd tier: 01 Sleeping [sleeping,
falling asleep, dozing off, napping, getting up, waking up, dreaming, cat napping, getting
some shut-eye, dozing]; 02 Sleeplessness [insomnia, tossing and turning, lying awake,
counting sheep]; 99 Sleeping [not elsewhere classified]); 02 Grooming; 03 Health-
related Self Care; 04 Personal Activities; 05 Personal Care Emergencies; 99 Personal
Care not elsewhere classified.
02 Household Activities. 01 Housework; 02 Food and Drink Preparation,
Presentation, and Clean-up; 03 Interior Maintenance, Repair, and Decoration; 04
Exterior Maintenance, Repair, and Decoration; 05 Lawn, Garden, and Houseplants; 06
Animals and Pets; 07 Vehicles; 08 Appliances and Tools; 09 Household Management;
99 Household Activities not elsewhere classified.
03 Caring For and Helping Household Members. 01 Caring For and Helping
Household Children; 02 Activities Related to household Children's Education; 03
Activities Related to household Children's Health; 04 Caring For Household Adults; 05
Helping Household Adults; 99 Caring For and Helping household Members not
elsewhere classified.
04 Caring For and Helping Nonhousehold Members. 01 Caring For and Helping
Nonhousehold Children; 02 Activities Related to Nonhousehold Children's Education; 03
Activities Related to Nonhousehold Children's Health; 04 Caring For Nonhousehold
Adults; 05 Helping Nonhousehold Adults; 99 Caring For and Helping Nonhousehold
Members not elsewhere classified.

Time Use for Sleeping 10
05 Working and Work-Related Activities. 01 Working; 02 Work-Related Activities;
03 Other Income-generating Activities; 04 Job Search and Interviewing; 99 Work and
Work-Related Activities not elsewhere classified.
06 Education. 01 Taking Class; 02 Extracurricular School Activities—Except
Sports; 03 Research/Homework; 04 Registration/Administrative activities; 99 Education
not elsewhere classified.
07 Consumer Purchases. 01 Shopping—Store, Telephone, Internet; 02
Researching Purchases; 03 Security Procedures Related to Consumer Purchases; 99
Consumer Purchases not elsewhere classified.
08 Professional and Personal Care Services. 01 Childcare Services; 02 Financial
Services and Banking; 03 Legal Services; 04 Medical and Care Services; 05 Personal
Care Services; 06 Real Estate; 07 Veterinary Services; 08 Security Procedures Related
to Professional/Personal Services; 99 Professional and Personal Services not
elsewhere classified.
09 Household Services. 01 Household Services (not done by self); 02 Home
Maintenance, Repair, Decoration, and Construction (not done by self); 03 Pet Services
(not done by self, not vet); 04 Lawn and Garden Services (not done by self); 05 Vehicle
Maintenance and Repair Services (not done by self); 99 Household Services not
elsewhere classified.
10 Government Services and Civic Obligations. 01 Using Government Services;
02 Civic Obligations and Participation; 03 Waiting Associated with Government Services
or Civic Obligations; 04 Security Procedures Related to Government Services/Civic
Obligations; 99 Government Services not elsewhere classified.

Time Use for Sleeping 11
11 Eating and Drinking. 01 Eating and Drinking; 99 Eating and Drinking not
elsewhere classified.
12 Socializing, Relaxing, and Leisure. 01 Socializing and Communicating; 02
Attending or Hosting Social Events; 03 Relaxing and Leisure; 04 Arts and Entertainment
other than sports; 05 Waiting Associated with Socializing, Relaxing, and Leisure; 99
Socializing, Relaxing, and Leisure not elsewhere classified.
13 Sports, Exercise, and Recreation. 01 Participating in Sports, Exercise, or
Recreation; 02 Attending Sporting/Recreational Events; 03 Waiting Associated with
Sports, Exercise, and Recreation; 04 Security Procedures Related to Sports, Exercise,
and Recreation; 99 Sports, Exercise, and Recreation not elsewhere classified
14 Religious and Spiritual Activities. 01 Religious/Spiritual Practices; 99 Religious
and Spiritual Activities not elsewhere classified.
15 Volunteer Activities. 01 Administrative and Support Activities; 02 Social
Service and Care Activities (Except Medical); 03 Indoor and Outdoor Maintenance,
Building, and Clean-up Activities; 04 Participating in Performance and Cultural
Activities; 05 Attending Meetings, Conferences, and Training; 06 Public Health and
Safety Activities; 99 Volunteer Activities not elsewhere classified.
16 Telephone Calls. 01 Telephone Calls; 99 Telephone Calls not elsewhere
classified.
17 Traveling. 01 Travel Related to Personal Care; 02 Travel Related to
Household Activities; 03 Travel Related to Caring For and Helping household Members;
04 Travel Related to Caring For and Helping Nonhousehold Members; 05 Travel
Related to Work; 06 Travel Related to Education; 07 Travel Related to Consumer

Time Use for Sleeping 12
Purchases; 08 Travel Related to Using Professional and Personal Care Services; 09
Travel Related to Using Household Services; 10 Travel Related to Using Government
Services and Civic Obligations; 11 Travel Related to Eating and Drinking; 12 Travel
Related to Socializing, Relaxing, and Leisure; 13 Travel Related to Sports, Exercise,
and Recreation; 14 Travel Related to Religious/Spiritual Activities; 15 Travel Related to
Volunteer Activities; 16 Travel Related to Telephone Calls; 17 Security Procedures
Related to Traveling; 99 Traveling not elsewhere classified.
Results
Data analyses focused on the relationships between sleep and various waking
activities.
Sleep time in relation to age and sex. Sleep time (01.01.01) was first evaluated
for its relationship to age in both males and females. Age data were binned into 5-year
and 10-year blocks starting at age 15 years and continuing to a category for ages 65
and higher. Figure 1 displays the mean sleep times for 20684 respondents (11650
females and 9034 males) by age category. Sleep time declined from adolescence (15-
19 years) to ages 45-54 years then increased again. Teenage (15-19 year old) girls
slept somewhat less than boys, but sleep time for men was less than women by an
average of 10 minutes per day between the ages of 20 and 64 years (Table 1).
Insert Figure 1 here
Since work-related activities were among the factors hypothesized to be most
reciprocally related to sleep time, analyses were confined to the 5406 people who were
25-64 years of age, and who worked during weekdays for fiscal compensation.1 In this
1 We precluded ages 15-24 years and 65 years or older from these analyses in order to focus analyses on working adults.

Time Use for Sleeping 13
cohort men also slept a daily average of 10 minutes less than women (p = 0.0005). As
seen in Table 1, men’s work and work-related activities (05.01+02.all)2 averaged 8.40
hours (SD = 2.83h), which was 1 hour and 3 minutes more than women (p = 0.0001),
who worked 7.36 hours (SD = 2.76h). In contrast, proportionally more women (83.1%)
than men (62.5%) worked on household activities (02.all.all),3 and among those who
did, women worked an average of 24 minutes longer per day more than men
(p=0.0001). Similarly, proportionally more women (42.4%) than men (30.9%) cared for
household members (03.all.all), and among those who did, women did so an average of
24 minutes more than men (p=0.0001).
Although women slept an average of 10 minutes more than men, men spent an
average of 20 minutes more a day socializing, relaxing and doing leisure activity than
did women (p = 0.0001), and an average of 5 minutes more a day eating and drinking
(p = 0.004). Table 1 displays these differences.
Insert Table 1 here
Sleep and work time. Figure 2 displays mean sleep time (01.01.01) and mean
work time (05.01+02.all) across age categories for the 7637 people who reported
working. Within each age category, average work time was plotted as a function of
average sleep time for each of seven sleep time bins (<5h, 5.5h±0.5h, 6.5h±0.5h,
7.5h±0.5h, 8.5h±0.5h, 9.5h±0.5h, ≥10h). Figure 3 shows these plots along with the r2
value from the linear regression fit to the data points within each age category. It is clear
that at every age, the less time devoted to sleep, the more time devoted to work. Figure
2Tier 1 = category 05 (Working and Work-related Activities); tier 2 = categories 01 (working) and 02 (work-related activities); tier 3 = all categories) 3Tier 1 = category 02 (Household Actvities); tier 2 = all categories; tier 3 = all categories.

Time Use for Sleeping 14
4 presents the relationship between average work time and average sleep bin for all
4749 respondents between the ages 25-64 years who worked on weekdays. With each
1-hour reduction in sleep time, work time increased by 28.96 minutes. Results for
women and men are also shown separately. While both groups showed the relationship
of reduced sleep and increased work time, the effect was somewhat more pronounced
among men. These data included n=110 interviewees who reported sleeplessness
(01.01.02). When these subjects were removed, there was no change in the reciprocal
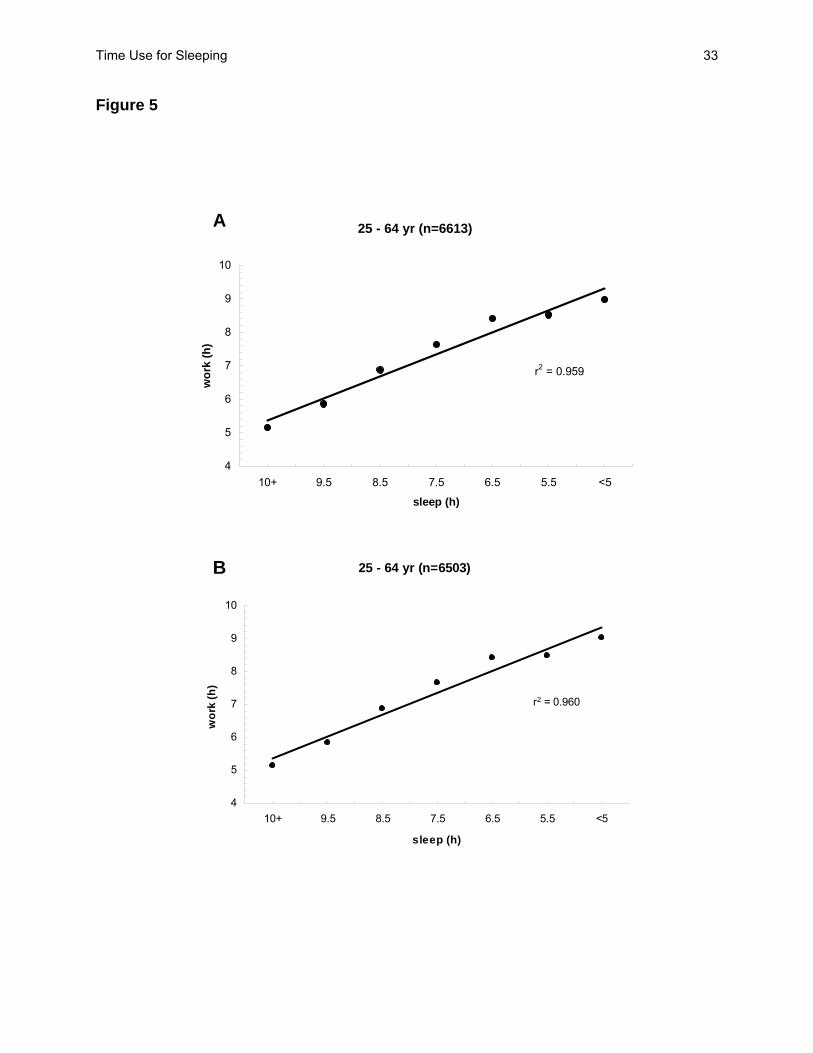
relationship between time spent working and time spent sleeping (Figure 5).
Insert Figures 2, 3, 4, 5 here
Sleep time and weekly income. Figure 6 shows the mean income for 11934
respondents (6226 females and 5608 males) by age category. Income increases
steadily from adolescence to ages 45-54 years, then decreases. The pattern is evident
in both men and women, despite men being paid much more per week than women.
The profile in Figure 6 looks like the inverse of the relationship between sleep time and
age category (Figure 1), despite the latter being confined to only those interviewees
who reported being paid. Not surprisingly, weekly pay increased with work hours—
especially in women—but this relationship did not hold for smaller percentage of men
working less than 6.5 hours (Figure 7).
The relationship between weekly pay and sleep time bin was also linear across
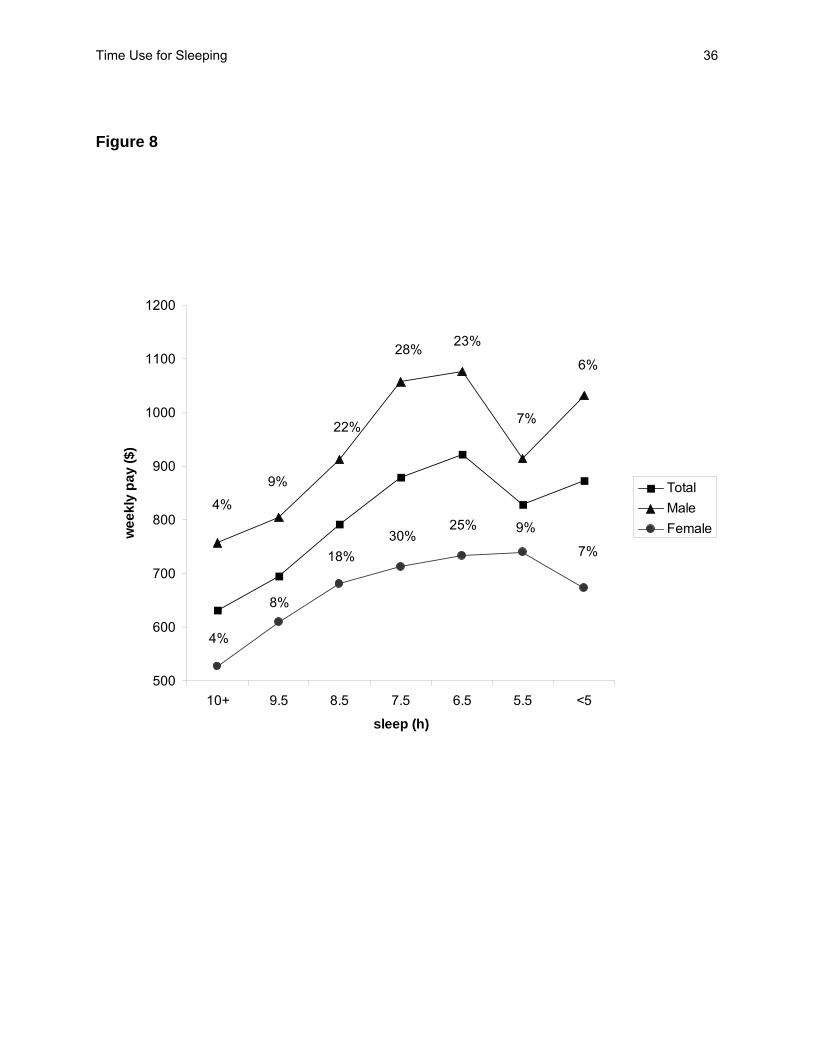
sleep times—only in this case, as sleep decreased, pay increased (Figure 8). For each
1-hour decrease in sleep time, weekly pay increased by $40. However, when sleep time
was below 6.5 hours, pay ceased to increase.
Insert Figures 6, 7, 8 here

Time Use for Sleeping 15
Sleep time and travel time. The relationship between mean traveling time
(17.all.all) and mean sleep time (by bin) is shown in Figure 9 for weekday workers aged
25-64 years. As sleep time decreased, travel time increased, with no differences evident
between women and men. Figure 10 shows this reciprocal relationship is near-linear
across sleep time bins. Thus, for each 1-hour decrease in sleep time, time spent on
travel increased by 9.84 minutes.
Since the traveling category includes all types of travel, the analyses were
confined to commute time (Figure 11). The same linear relationship was observed—
commute time increased as sleep time decreased, such that for each 1-hour decrease
in sleep time, commute time increased by 2.69 minutes.
Insert Figures 9, 10, 11 here
Sleep time and social/leisure time. The relationship between socializing,
relaxing and leisure time (12.all.all) and sleep time (01.01.01) is shown in Figure 12.
Although leisure time increased as sleep time decreased, this was only the case when
sleeping time was below 7.5 hours, which involved 31% of the 4363 weekday workers
aged 25-64 years. Thus, for each 1-hour decrease in sleep time, time spent socializing,
relaxing and at leisure increased by 7.77 minutes.
Insert Figure 12 here
Sleep time and other activities at home. Household activities (02.all.all), and
caring for and helping household members (03.all.all)—two activity categories in which
women spend more time than men (Table 1)—showed no systematic relationship to
sleep time (01.01.01), as seen in Figures 13 and 14. In general, time for these activities
Time Use for Sleeping 16
increased only when sleep time was below 5 hours and this represented less than 7%
of respondents.
All remaining11 ATUS tier 1 activity categories showed no systematic relationship to
sleep time in adult weekday workers. These categories were: caring for and helping
non-household members (04.all.all); education (06.all.all); consumer purchases
(07.all.all); professional and personal care services (08.all.all); household services
(09.all.all); government services and civic obligations (10.all.all); eating and drinking
(11.01.all); sports, exercise, recreation (13.01.all); religious and spiritual activities (14.
all.all); volunteer activities (15.all.all); telephone calls (16.all.all).
Insert Figures 13 and 14 here
Modeling sleep time. Stepwise regression was used to construct models of
sleep time for weekday workers aged 25-64 years. Data were analyzed without being
binned for sleep time category. A model involving 2875 respondents and accounting for
35.6% of the variance in sleep time was comprised of work time, travel time, leisure
time, household activities time, and weekly pay (adjusted r2 = 0.356). A second model
involving 1192 respondents and accounting for 46.4% of the variance in sleep time was
comprised of work time, travel time, household activities time, leisure time, time spent
caring for other household members, and age (adjusted r2 = 0.464). Consistent with
binned data shown in Figures 4, 5, 8, 9, 10, and 11, in all stepwise regression models,
standardized beta coefficients for activity predictors were negative (i.e., more time in
each activity was associated with less sleep time), Standardized beta coefficients for
model 2 were: work time (-0.847), travel time (-0.513), household activities time
(-0.479), leisure time (-0.509), and time spent caring for other household members

Time Use for Sleeping 17
(-0.411). Age also had a negative, albeit quite modest, standardized beta coefficient
(-0.087), indicating that older age was associated with less sleep time, consistent with
Figure 1.
None of the other dozen ATUS time use categories were associated
systematically with sleep time in weekday workers.
Discussion
We used the American Time Use Survey 2003 database to evaluate the theory
that sleep time is perceived as a flexible temporal commodity that can be traded for
waking activities considered either more imperative or of greater value. We opted to
address these issues primarily among survey respondents who were engaged in
weekday work schedules.
Across the age span from 15 to 65+ years, sleep time reached a minimum at age
45-54 years (Figure 1), which was also a period of greater work time (Figure 2) and
higher pay (Figure 6). More than any other factor, time used for work and work-related
activities (ATUS tier 1 category 5) was consistently associated with sleep time (ATUS
category 01.01.01), such that work time increased as sleep time declined. This
fundamental linear relationship was found at all ages (Figure 3), and for both sexes
(Figure 4). Not surprisingly, weekly pay increased both with increased work time (Figure
7) and with decreased sleep time (Figure 8). Collectively, these findings suggest that it
is the economic incentive of work time that may play a key role in reducing sleep time.
Time for traveling (ATUS tier 1 category 17) was second only to work time in
regression modeling of sleep time. While work time was hypothesized to have a
negative relationship to sleep time, we did not anticipate the importance of trave time as

Time Use for Sleeping 18
a possible negative influence on sleep time. Traveling time did not vary by sex (Figure
9), but it had a clearly negative linear association with sleep time for the entire travel
category (Figure 10) and for commute time only (Figure 11). Traveling time included
travel for virtually any reason. Continued growth of travel by land, sea and air; declining
capacities of roadways, runways and railways; and urban sprawl are likely some of the
factors that have contributed to increased travel time.
Three other ATUS tier 1 categories were partially associated with sleep time.
Socializing, relaxing and leisure time (ATUS tier 1 category 12) was negatively related
to sleep time, but this relationship was primarily evident for sleep time less than 7.5
hours (Figure 12); for each 1-hour decrease in sleep time, time spent socializing,
relaxing and at leisure increased by 7.77 minutes. Similar results were obtained for
household activities (ATUS tier 1 category 2)—which included housework; food and
drink preparation and clean-up; interior and exterior maintenance; lawn, garden, and
houseplants; animals and pets; vehicles; appliances and tools; and household
management. The relationship to sleep time was negative for sleep time less than 6.5
hours (Figure 13). Time spent on caring for household members (ATUS tier 1 category
3) was negatively related to sleep time only for sleep below 5 hours (Figure 14).
Remarkably, none of the other 11 ATUS tier 1 categories were systematically
related to sleep time in employed adults with weekday jobs. This may have to do the
relative temporal infrequency or lower duration of time people devoted to these other
categories. That is, more focused analyses on people who reported activities that were
less frequent (e.g., volunteer activities; consumer purchases; religious and spiritual
activities), may reveal reciprocal relationships between these activities and sleep time.

Time Use for Sleeping 19
Whatever the reasons, these 11 other ATUS activity categories were inconsequential in
the larger cohort compared to the five factors most associated with reduced sleep time,
which were work time, travel time, household activities time, leisure time, and time spent
caring for other household members—in that order of influence.
Despite substantial sex differences in time use for sleep, work, household
activities, care of household members, leisure time, time for eating and drinking (Table
1), and pay (Figures 6-8), the relationships between the five key categories of time use
described above and sleep time were relatively equivalent between adult weekday-
employed women and men, resulting in sex playing little to no appreciable role in
predictive modeling. Men worked on the job an average of 63 minutes more a day than
women, but women spent an average of 48 minutes a day more than men on household
duties and care of household members (and proportionally more women than men
reported these activities). Men had an average of 20 minutes more a day for socializing,
relaxing and leisure than women, while women had an average of 10 minutes more
sleep time a day than men. The fact that women and men between the ages of 25 and
64 years differed in time spent on activities that were negatively associated with sleep
time, suggests that men and women exchange sleep time somewhat differently for
waking activities deemed imperative or of value.
This study has a number of limitations. The values for sleep time may
overestimate actual sleep obtained by respondents because the ATUS Activity Lexicon
2003 permitted codification as sleep of words that reflected transition states (e.g., falling
asleep, dozing off, getting up, waking up).

Time Use for Sleeping 20
The inherently cross-sectional nature of the data limits conclusions of causality.
We cannot be certain that sleep time is reduced deliberately to increase work time or
income. It is possible that survey respondents were reporting the sleep as a reflection of
their biological sleep need (as represented by a normal distribution), and that the
increased time we observed for work, travel and other activities was purely at their
discretion (i.e., all waking activities are equally valued). We doubt this interpretation is
correct because of the relatively few waking activities that were reciprocally related to
sleep time, and because there is ample evidence that people can and do engage in
lifestyles that result in sleep restriction and its adverse consequences for
neurobehavioral functions, safety and health.6-17
The findings of the current study point to work time, travel time, domestic chores
(household activities and caring for household members) and leisure as the primary
activities exchanged for sleep time. A regression model established that these factors
accounted for 46.4 percent of the variance in sleep time in weekday-working adults.
Considerably more research is required to identify how these and other factors influence
sleep timing, duration, and quality. It is especially important to determine at what point
the exchanges people make between sleep time and time for other activities can result
in adverse consequences for health and safety.

Time Use for Sleeping 21
Acknowledgment
Supported by NIH NR04281.

Time Use for Sleeping 22
References
1. Durmer, J.S., Dinges, D.F. (2005) Neurocognitive consequences of sleep
deprivation. Seminars in Neurology, 25(1):117-129.
2. Everson, C.A. (2005) Clinical assessment of blood leukocytes, serum cytokines, and
serum immunoglobulins as responses to sleep deprivation in laboratory rats.
American Journal of Physiology-Regulatory Integrative and Comparative Physiology
289 (4): R1054-R1063.
3. Saper, C.B., Scammell, T.E., Lu, J. (2005) Hypothalamic regulation of sleep and
circadian rhythms. Nature 437 (7063):1257-1263.
4. Foster, R.G., Wulff, K. (2005) The rhythm of rest and excess. Nature Reviews
Neuroscience 6 (5): 407-414.
5. Hale, L. (2005) Who has time to sleep? Journal of Public Health 27 (2): 205-211.
6. Kripke, D.F., Garfinkel, L. , Wingard, D.L., Klauber, M.R., Marler, M.R. (2002) Mortality
associated with sleep duration and insomnia. Archives of General Psychiatry, 59:131-
136.
7. Ayas, N.T., White, D.P., Manson, J.E., et al. (2003) A prospective study of sleep
duration and coronary heart disease in women. Archives of Internal Medicine 163:205-
209.
8. Eaker, E.D., Pinsky, J., Castelli, W.P. (1992) Myocardial-infarction and coronary death
among women: Psychosocial predictors from a 20-year follow-up of women in the
Framingham-study. American J Epidemiology 135 (8): 854-864.
Time Use for Sleeping 23
9. Hasler, G., Buysse, D.J., Klaghofer, R., et al. (2004) The association between short
sleep duration and obesity in young adults: a 13-year prospective study. Sleep
27(4):661-666.
10. Newman, A.B., Spiekerman, C.F., Enright, P., et al. (2000) Daytime sleepiness
predicts mortality and cardiovascular disease in older adults. J American Geriatric
Society 48 (2): 115-123.
11. Schwartz, S.W., Cornoni-Huntley, J., Cole, S.R., et al. (1998) Are sleep complaints an
independent risk factor for myocardial infarction? Annals of Epidemiology 8(6): 384-
392.
12. Taheri, S., Lin, L., Austin, D., Young, T., Mignot, E. (2004) Short sleep duration is
associated with reduced leptin, elevated ghrelin, and increased body mass index.
PLoS Medicine 1(3):e62.
13. Dinges, D.F. (1995) An overview of sleepiness and accidents. Journal of Sleep
Research 4 (2):4-11.
14. Stutts, J.C., Wilkins, J.W., Osberg, J.S., et al. Driver risk factors for sleep-related
crashes. Accident Analysis and Prevention 35(3): 321-331.
15. Barger, L.K., Cade, B.E., Ayas, N.T., et al. (2005) Extended work shifts and the risk of
motor vehicle crashes among interns. New England Journal of Medicine 352(2): 125-
134.
16. Suzuki, K., Ohida,T., Kaneita, Y., et al. (2005) Daytime sleepiness, sleep habits and
occupational accidents among hospital nurses. Journal of Advanced Nursing 52 (4):
445-453.

Time Use for Sleeping 24
17. Walsh, J.W., Dement, W.C., Dinges, D.F. (2005) Sleep Medicine, Public Policy and
Public Health. In: Kryger, M.H., Roth, T., Dement, W.C. (Eds.) Principles and Practice
of Sleep Medicine (4th edition), W.B. Saunders, Philadelphia, PA, pp. 648-656.
18. http://www.ntsb.gov/
19. Dinges, D.F., Pack, F., Williams, K., Gillen, K.A., Powell, J.W., Ott, G.E., Aptowicz, C.,
Pack, A.I. (1997) Cumulative sleepiness, mood disturbance, and psychomotor
vigilance performance decrements during a week of sleep restricted to 4-5 hours per
night. Sleep 20(4):267-277.
20. Van Dongen, H.P.A., Maislin, G., Mullington, J.M., Dinges, D.F. (2003b) The
cumulative cost of additional wakefulness: dose-response effects on neurobehavioral
functions and sleep physiology from chronic sleep restriction and total sleep
deprivation. Sleep 26(2):117-126.
21. Belenky, G., Wesensten, N.J., Thorne, D.R., Thomas, M.L., Sing, H.C., Redmond,
D.P., Russo, M.B., Balkin, T.J.. (2003) Patterns of performance degradation and
restoration during sleep restriction and subsequent recovery: A sleep dose-response
study. Journal of Sleep Research 12(1):1-12.
22. http://www.bls.gov/tus/home.htm
23. American Time Use Survey User’s Guide (2004) Bureau of Labor Statistics and U.S.
Census Bureau.
24. American Time Use Survey Activity Lexicon, November 2004. (2003) This document is
the activity classification scheme (including examples) used to code activities collected
during the American Time Use Survey into time-use categories. Bureau of Labor
Statistics. See http://www.bls.gov/tus/lexiconwex2003.pdf

Time Use for Sleeping 25
Table 1. Activities of employed women and men between the ages of 25 and 64 years,
who worked on weekdays.
Women Men Activities n mean* SD n mean SD Difference P
Sleep1 2648 7.68 1.67 2758 7.51 1.67 0h 10min 0.0005
Work2 2651 7.35 2.76 2764 8.40 2.83 1h 03min 0.0001
Household activities3 2202 1.63 1.51 1728 1.23 1.32 0h 24min 0.0001
Care for household members4 1123 1.55 1.48 853 1.15 1.19 0h 24min 0.0001
Socializing, relaxing, leisure5 2429 2.69 1.80 2564 3.02 1.98 0h 20min 0.0001
Eating and drinking6 2414 1.06 0.70 2589 1.14 0.69 0h 5min 0.004
*hours 1Tier codes: 01.01.all 2Tier codes: 05.01+02.all 3Tier codes: 02.all.all 4Tier codes: 03.all.all 5Tier codes: 12.all.all 6Tier codes: 11.01.all

Time Use for Sleeping 26
Figure Captions
Figure 1. Mean sleep time (01.01.01) as a function of age group for 11650 females, 9034
males, and the total (20684) who reported sleep.
Figure 2. Mean sleep time (01.01.01) and mean work time (05.01+02.all) across age
category for the 7637 people who reported working.
Figure 3. Mean work time (05.01+02.all) plotted relative to mean sleep time (01.01.01)
bin within each age category for the 7339 people who reported work time and sleep
time within each of the six age categories ≥20 years. Average sleep time was derived
for seven sleep time bins (<5h, 5.5h±0.5h, 6.5h±0.5h, 7.5h±0.5h, 8.5h±0.5h, 9.5h±0.5h,
≥10h). The r2 value on each graph was derived from a linear regression fit to the data
points within each age category.
Figure 4. Relationship between average work time and average sleep time bin for all
4749 people between the ages 25-64 years who worked on weekdays, as well as
separately for the 2323 women and 2426 men who made up this total. Percentages
indicate the proportion of men and women who contributed to each point. Linear
regression on the total sample yielded y = 0.4827x (r2 = 0.959). Thus, for 1-hour
decrease in sleep time, work time increased by 28.96 minutes.
Figure 5. Relationship between average work time and average sleep time bin for all
6613 subjects between the ages 25-64 years who reported working (graph A), and for
all subjects excluding the n=110 who reported sleeplessness (graph B) as identified by
01.01.02. The exclusion of the latter had no appreciable effect on the relationship.
Figure 6. Mean pay per week as a function of age group for 6226 females, 5608 males,
and the total (11834) who reported sleep.

Time Use for Sleeping 27
Figure 7. Weekly pay as a function of work time bins for 4141 weekday workers.
Percentages indicate the proportion of men (n=2053) and women (n=2088) who
contributed to each point. Linear regression on the total sample yielded y = 65.412x (r2 =
0.903). Thus, for each 1-hour increase in work time, weekly pay increased by $65. A
subgroup of 14% males, who had higher pay for fewer work hours, did not fit this
inverse relationship.
Figure 8. Mean weekly pay as a function of sleep time bins for 4134 weekday workers.
Percentages indicate the proportion of men (n=2048) and women (n=2086) who
contributed to each point. Linear regression on the total sample yielded y = 40.157x (r2 =
0.677). Thus, for each 1-hour decrease in sleep time, weekly pay increased by $40.
However, when sleep time was below 6 hours, pay ceased to increase.
Figure 9. Mean travel time (17.all.all) relative to mean sleep time (01.01.01) bin for
4647 people who worked weekdays (n=2376 men; n=2271 women). There were no
differences between women and men.
Figure 10. Mean travel time (17.all.all) relative to mean sleep time (01.01.01) bin for
4647 people who worked weekdays. Linear regression on the total sample yielded y =
0.164x (r2 = 0.923). Thus, for each 1-hour decrease in sleep time, time spent on travel
increased by 9.84 minutes.
Figure 11. Mean commute time related to work (17.05.all) relative to mean sleep time
(01.01.01) bin for 4179 people who worked weekdays. Linear regression on the total
sample yielded y = 0.0449x (r2 = 0.883). Thus, for each 1-hour decrease in sleep time,
commute time increased by 2.69 minutes.

Time Use for Sleeping 28
Figure 12. Relationship between mean time spent socializing, relaxing and at leisure
(12.all.all), and sleep time (01.01.01) for 4363 weekday workers aged 25-64 years.
Although leisure time increased as sleep time decreased, this was only the case when
sleep time dropped below 7 hours, which involved 31% of subjects. Linear regression
on the total sample yielded y = 0.1296x (r2 = 0.824). Thus, for each 1-hour decrease in
sleep time, time spent socializing, relaxing and at leisure increased by 7.77 minutes.
Figure 13. Relationship between mean time spent on household activities (02.all.all)
and sleep time (01.01.01) for 3534 weekday workers aged 25-64 years. Percentages
indicate the proportion of men (n=1558) and women (n=1976) who contributed to each
point. Although household activity time increased as sleep time decreased, this was
only the case when sleep time dropped below 6 hours in women (11%) and below 5
hours in men (5%).
Figure 14. Relationship between mean time spent on caring for household members
(03.all.all) and sleep time (01.01.01) for 1974 weekday workers aged 25-64 years.
Percentages indicate the proportion of men (n=852) and women (n=1122) who
contributed to each point. Although time spent caring for household members time
increased as sleep time decreased, this was only the case when sleep time dropped
below 5 hours (5% women, 6% men).

Time Use for Sleeping 29
Figure 1
8
8.3
8.6
8.9
9.2
9.5
9.8
15-19 20-24 25-34 35-44 45-54 55-64 65+
age (yr)
tota
l sle
ep ti
me
(h)
TotalMaleFemale

Time Use for Sleeping 30
Figure 2
5
6
7
8
9
10
15-19 20-24 25-34 35-44 45-54 55-64 65+
age (yr)
hour
s sleep
work

Time Use for Sleeping 31
Figure 3
20 - 24yr (n = 412)
r2 = 0.888
4
5
6
7
8
9
10
10+ 9.5 8.5 7.5 6.5 5.5 <5
total sleep time (h)
tota
l wor
k tim
e (h
)
25 - 34yr (n = 1552)
r2 = 0.907
4
5
6
7
8
9
10
10+ 9.5 8.5 7.5 6.5 5.5 <5
total sleep time (h)
tota
l wor
k tim
e (h
)
35 - 44yr (n = 2193)
r2 = 0.954
4
5
6
7
8
9
10
10+ 9.5 8.5 7.5 6.5 5.5 <5
total sleep time (h)
tota
l wor
k tim
e (h
)
45-54yr (n = 1842)
r2 = 0.946
4
5
6
7
8
9
10
10+ 9.5 8.5 7.5 6.5 5.5 <5
total sleep time (h)
tota
l wor
k tim
e (h
)
55-64yr (n = 1026)
r2 = 0.941
4
5
6
7
8
9
10
10+ 9.5 8.5 7.5 6.5 5.5 <5
total sleep time (h)
tota
l wor
k tim
e (h
)
65+yr (n = 314)
r2 = 0.951
4
5
6
7
8
9
10
10+ 9.5 8.5 7.5 6.5 5.5 <5
total sleep time (h)
tota
l wor
k tim
e (h
)

Time Use for Sleeping 32
Figure 4
25 - 64 yr
28%
23%
8%
6%
22%
8%
5%
25%9%
7%
30%
18%
7% 4%
6
7
8
9
10
10+ 9.5 8.5 7.5 6.5 5.5 <5
sleep (h)
wor
k (h
) TotalMaleFemale
Time Use for Sleeping 33
Figure 5
25 - 64 yr (n=6613)
r2 = 0.959
4
5
6
7
8
9
10
10+ 9.5 8.5 7.5 6.5 5.5 <5
sleep (h)
wor
k (h
)
25 - 64 yr (n=6503)
r2 = 0.960
4
5
6
7
8
9
10
10+ 9.5 8.5 7.5 6.5 5.5 <5
sleep (h)
wor
k (h
)
A
B

Time Use for Sleeping 34
Figure 6
0
200
400
600
800
1000
1200
15-19 20-24 25-34 35-44 45-54 55-64 65+
age (yr)
aver
age
pay
per w
eek
($)
TotalMaleFemale

Time Use for Sleeping 35
Figure 7
7%
2%5%
18%
27%
17%24%
13% 5%
9% 25%25%
11%
12%
400
500
600
700
800
900
1000
1100
1200
<5 5.5 6.5 7.5 8.5 9.5 10+
work (h)
wee
kly
pay
($)
TotalMaleFemale
Time Use for Sleeping 36
Figure 8
6%
7%
23%28%
22%
9%
4%
7%
9%25%30%
18%
8%
4%
500
600
700
800
900
1000
1100
1200
10+ 9.5 8.5 7.5 6.5 5.5 <5
sleep (h)
wee
kly
pay
($)
TotalMaleFemale

Time Use for Sleeping 37
Figure 9
25 - 64 yr (n=4647)
0.5
1
1.5
2
2.5
10+ 9.5 8.5 7.5 6.5 5.5 <5
sleep (h)
tota
l tra
vel t
ime
(h)
TotalMaleFemale

Time Use for Sleeping 38
Figure 10
25 - 64 yr (n = 4647)
r2 = 0.923
0.5
1
1.5
2
2.5
10+ 9.5 8.5 7.5 6.5 5.5 <5
sleep (h)
tota
l tra
vel t
ime
(h)

Time Use for Sleeping 39
Figure 11
25 - 64 yr (n=4179)
r2 = 0.883
0.4
0.6
0.8
1
10+ 9.5 8.5 7.5 6.5 5.5 <5
sleep (h)
com
mut
e tim
e (h
)

Time Use for Sleeping 40
Figure 12
25-64 yr
6% 8% 25% 30%
20%7%
4%
1.5
2
2.5
3
3.5
4
10+ 9.5 8.5 7.5 6.5 5.5 <5
sleep (h)
leis
ure
time
(h)

Time Use for Sleeping 41
Figure 13
25 - 64 yr
28%22%5%
6%
24%9%
5%
26%9%
7%
31% 17%
7%
4%
0.5
1
1.5
2
2.5
10+ 9.5 8.5 7.5 6.5 5.5 <5
sleep (h)
hous
ehol
d ac
tiviti
es (h
)
TotalMaleFemale

Time Use for Sleeping 42
Figure 14
25-64 yr
6%7%27%26%7%
4%24%
5%
8%18%31%24%9%5%
0
0.5
1
1.5
2
2.5
3
10+ 9.5 8.5 7.5 6.5 5.5 <5
sleep (h)
carin
g tim
e fo
r hou
seho
ld m
embe
rs (h
)
TotalMaleFemale