Time-to-Event Predictive Modeling for Chronic Conditions ... · EHR data analysis to support...
7
14 1541-1672/14/$31.00 © 2014 IEEE IEEE INTELLIGENT SYSTEMS Published by the IEEE Computer Society Time-to-Event Predictive Modeling for Chronic Conditions Using Electronic Health Records Yu-Kai Lin, Hsinchun Chen, and Randall A. Brown, University of Arizona Shu-Hsing Li, National Taiwan University Hung-Jen Yang, Min-Sheng General Hospital An electronic health records-based time- to-event model identifies clinically validated risk factors associated with chronic care. Experiments suggest that EHR-based predictive modeling can effectively support decision making for chronic care patients. chronic illness and the escalating cost of chronic care, the need to facilitate clinical decision making for chronic care has never been higher. However, existing healthcare systems are oriented toward acute problems and are inadequate in managing chronic conditions. To enable effective chronic care, it is critical to be able to capture and rep- resent a patient's disease progression pattern over time so that timely and personalized in- terventions can be made. Electronic health records (EHRs) are a re- liable source of longitudinal observations for monitoring the progression of chronic condi- tions in clinical practice. Recent years have seen surging interests in EHR data analytics for clinical decision support and knowledge discovery. Although significant progress has been made to move the current practice in this direction, prognostic modeling frame- works and tools tailored for longitudinal EHR data analysis to support chronic care management remain inadequate. Time-to-event modeling (also known as survival analysis) is a statistical technique for representing and predicting the length of time to an event occurrence based on an individual’s traits. 1,2 Time-to-event analy- sis considers not only whether an event will occur, but also the length of time to its oc- currence. We use the phrase “time-to-event analysis” instead of “survival analysis” be- cause it’s more descriptive of the method and because survival isn’t our focus. Indeed, caring for patients with chronic conditions involves a wide array of events other than O ne hundred and forty-one million Americans—almost half the US pop- ulation—were living with one or more chronic conditions in 2010, and the patient population is expected to increase at a speed of more than 10 mil- lion new cases per decade. Given the increasing number people of living with SMART AND CONNECTED HEALTH
Transcript of Time-to-Event Predictive Modeling for Chronic Conditions ... · EHR data analysis to support...
14 1541-1672/14/$31.00 © 2014 IEEE IEEE INTELLIGENT SYSTEMSPublished by the IEEE Computer Society
Time-to-Event Predictive Modeling for Chronic Conditions Using Electronic Health RecordsYu-Kai Lin, Hsinchun Chen, and Randall A. Brown, University of Arizona
Shu-Hsing Li, National Taiwan University
Hung-Jen Yang, Min-Sheng General Hospital
An electronic health
records-based time-
to-event model
identifies clinically
validated risk
factors associated
with chronic care.
Experiments suggest
that EHR-based
predictive modeling
can effectively
support decision
making for chronic
care patients.
chronic illness and the escalating cost of chronic care, the need to facilitate clinical decision making for chronic care has never been higher. However, existing healthcare systems are oriented toward acute problems and are inadequate in managing chronic conditions. To enable effective chronic care, it is critical to be able to capture and rep-resent a patient's disease progression pattern over time so that timely and personalized in-terventions can be made.
Electronic health records (EHRs) are a re-liable source of longitudinal observations for monitoring the progression of chronic condi-tions in clinical practice. Recent years have seen surging interests in EHR data analytics for clinical decision support and knowledge discovery. Although significant progress has
been made to move the current practice in this direction, prognostic modeling frame-works and tools tailored for longitudinal EHR data analysis to support chronic care management remain inadequate.
Time-to-event modeling (also known as survival analysis) is a statistical technique for representing and predicting the length of time to an event occurrence based on an individual’s traits.1,2 Time-to-event analy-sis considers not only whether an event will occur, but also the length of time to its oc-currence. We use the phrase “time-to-event analysis” instead of “survival analysis” be-cause it’s more descriptive of the method and because survival isn’t our focus. Indeed, caring for patients with chronic conditions involves a wide array of events other than
One hundred and forty-one million Americans—almost half the US pop-
ulation—were living with one or more chronic conditions in 2010, and
the patient population is expected to increase at a speed of more than 10 mil-
lion new cases per decade. Given the increasing number people of living with
S m a r t a n d C o n n e C t e d H e a l t H
IS-29-03-Lin.indd 14 7/21/14 11:01 AM
MAY/JuNE 2014 www.computer.org/intelligent 15
mortality. For instance, hospitaliza-tion and the development of severe complications are critically important events in chronic care. These events indicate the severity of a patient’s con-dition and how well the condition has been managed. Time-to-event analy-sis could inform physicians about a patient’s chronic condition and help the physician anticipate complica-tions and plan interventions to reduce the patient’s risk of an event.
We offer a general framework of time-to-event predictive modeling for chronic conditions based on EHRs. The proposed framework addresses various challenges in constructing a predictive model from EHRs and en-ables the collection of a rich set of clinically meaningful features. Fur-thermore, the integration of data ab-straction techniques in our modeling framework demonstrates improved accuracy in time-to-event predictions.
Developing Models for Chronic CareMany studies of prognostic modeling are conducted in the context of pro-spective cohort studies, in which in-vestigators routinely follow up with patients.3 (See the related sidebar for further research in this area.) In this case, standard statistical methods for data analytics exist. These methods, however, can’t be directly applied to EHR data, especially when we’re ana-lyzing the progression of chronic dis-eases. One challenge is the irregularly spaced data in EHRs. Many statistical methods require balanced panel data and/or equidistant time series to ana-lyze temporal phenomena. Although such data are typically available for prospective cohort studies, in most other clinical scenarios and in EHRs, patients typically visit hospitals irreg-ularly.4 That is, they don’t visit hospi-tals routinely, and the interval between clinical visits is an arbitrary length of
time. In addition, missing values are a prevailing phenomenon in EHR data. Patients normally don’t take all tests and examinations when they visit hos-pitals. Often, we only observe some phenotype information from patients in each of their visits, resulting in miss-ing values for the others. Finally, EHR data are inherently highly dimensional and spread across multiple aspects of healthcare. Not all the collected data are important or relevant. Features need to be carefully selected or con-structed before data analysis to achieve the best predictive performance.
Our time-to-event modeling frame-work differs from prior predictive mod-eling studies in three ways:
•We emphasize the use of large-scale, observational EHR data for chronic disease time-to-event predictive modeling.
•We formulate an innovative guide-line-based feature selection ap-proach to capture a wide array of clinically meaningful factors in our models. This approach is consis-tent with the spirit and practice of evidence-based medicine and en-ables a clinically rigorous selection of features.
•We integrate data abstraction tech-niques into our modeling procedure to reduce data dimensionality and enhance prediction accuracy. Al-though data abstraction is a com-mon procedure in modern medical informatics research, to our knowl-edge it hasn’t been used in time-to-event modeling.
We chose diabetes as our research case. According to the World Health Organization, the worldwide popula-tion of diabetic patients is projected to grow from 171 million in 2000 to 366 million in 2030. This study investigates the event of diabetes-induced hospital-ization, which is a strong indicator that
the diabetic patient’s health is being poorly managed. In our time-to-event models, we estimate and predict the length of time from the onset diagnosis of diabetes to the first diabetes-related hospitalization. Through the proposed analytical framework, we aim to iden-tify the factors associated with the progression of diabetes and predict in-dividual patient's long-term risk to dia-betes-induced hospitalization.
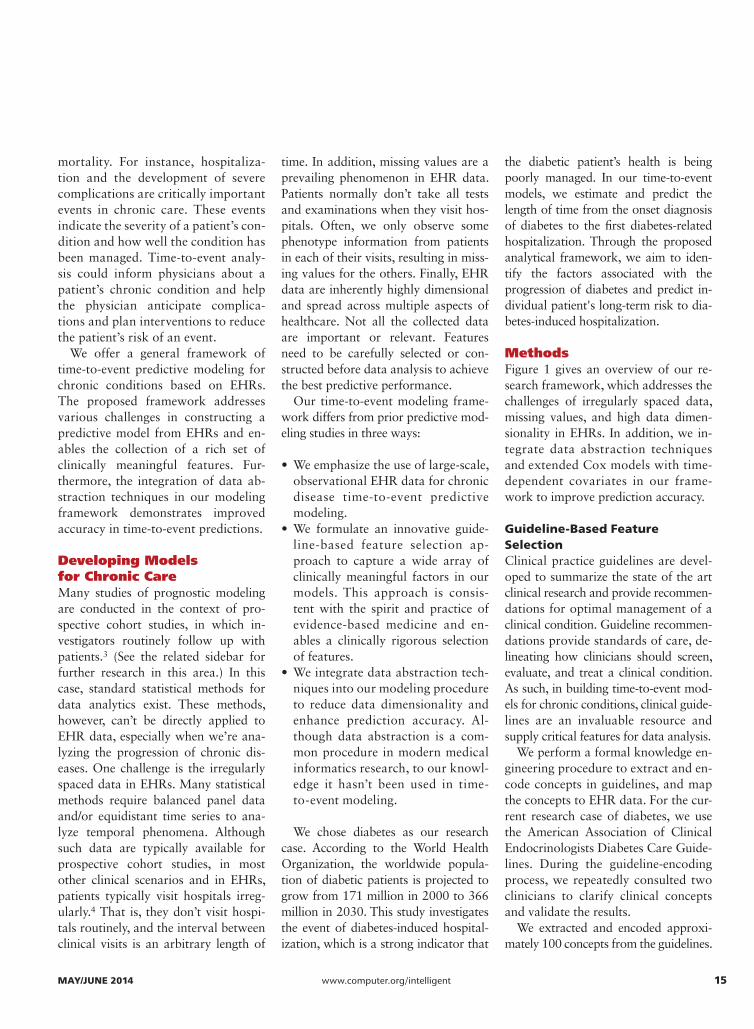
MethodsFigure 1 gives an overview of our re-search framework, which addresses the challenges of irregularly spaced data, missing values, and high data dimen-sionality in EHRs. In addition, we in-tegrate data abstraction techniques and extended Cox models with time- dependent covariates in our frame-work to improve prediction accuracy.
Guideline-Based Feature SelectionClinical practice guidelines are devel-oped to summarize the state of the art clinical research and provide recommen-dations for optimal management of a clinical condition. Guideline recommen-dations provide standards of care, de-lineating how clinicians should screen, evaluate, and treat a clinical condition. As such, in building time-to-event mod-els for chronic conditions, clinical guide-lines are an invaluable resource and supply critical features for data analysis.
We perform a formal knowledge en-gineering procedure to extract and en-code concepts in guidelines, and map the concepts to EHR data. For the cur-rent research case of diabetes, we use the American Association of Clinical Endocrinologists Diabetes Care Guide-lines. During the guideline-encoding process, we repeatedly consulted two clinicians to clarify clinical concepts and validate the results.
We extracted and encoded approxi-mately 100 concepts from the guidelines.
IS-29-03-Lin.indd 15 7/21/14 11:01 AM

16 www.computer.org/intelligent IEEE INTELLIGENT SYSTEMS
S m a r t a n d C o n n e C t e d H e a l t H
Studies of prognostic modeling prevail in the medicine and health informatics domains. Table A summarizes the areas and methods used in select work on chronic
conditions.As Table A shows, multiple methods can be used in prog-
nostic modeling. The Cox model is the most commonly used statistical method in these studies, but it was often applied on cohort databases in which patient data were purposely collected for research. As such, missing values and irregu-larly spaced observations are often not major issues in these databases. However, this isn’t the case in EHRs, as noted in the main article.
When missing values are a concern, data imputation is often considered. Aditya Khosla and his colleagues compared several single imputation methods, such as column mean and linear regression.2 These methods are naïve and prone to bias be-cause they neglect the variance in the data- generation process.
Table A also indicates that prior studies of clinical pre-dictive modeling, especially in conventional medical re-search, typically focus on a limited number of features. These features are selected only when clinical evidence supports their causal relations with the event or outcome variable. This evidence-based feature selection approach is well- received because it’s in line with the philosophy of evidence-based medicine. However, the resulting feature
set is very confined, typically about a dozen features. To date, it remains unclear how to extend this evidence-based approach to select a larger number of features that remain clinically justifiable.
References 1. M.B. Sesen et al., “Survival Prediction and Treatment
Recommendation with Bayesian Techniques in Lung Cancer,” AMIA Annual Symp. Proc., vol. 2012, 2012, pp. 838–847.
2. A. Khosla et al., “An Integrated Machine Learning Approach to Stroke Prediction,” Proc. 16th ACM SIGKDD Int’l Conf. Knowledge Discovery and Data Mining, 2010, pp. 183–191.
3. D.R. Cox, “Regression Models and Life-Tables,” J. Royal Statistical Soc. Series B (Methodological), vol. 34, no. 2, 1972, pp. 187–220.
4. J. Hippisley-Cox et al., “Predicting Risk of Type 2 Diabetes in England and Wales: Prospective Derivation and Validation of QDScore,” British Medical J., vol. 338, 2009; http://dx.doi.org/10.1136/bmj.b880.
5. B.H. Cho et al., “Application of Irregular and Unbalanced Data to Predict Diabetic Nephropathy Using Visualization and Feature Selection Methods,” Artificial Intelligence in Medicine, vol. 42, no. 1, 2008, pp. 37–53.
6. J. Hippisley-Cox et al., “Predicting Cardiovascular Risk in England and Wales: Prospective Derivation and Validation of QRISK2,” British Medical J., vol. 336, no. 7659, 2008, pp. 1475–1482.
related Work in Prognostic modeling
Table A. Summary of related prior studies.
Study Event/outcomeData source
Feature selection
No. of features
Modeling technique Address missing values
M. Berkan Sesen and colleagues1
Lung cancer one-year survival
CD EB 9 NB, BN No. Use complete data
Aditya Khosla and colleagues2
Stroke risk in 5 years CD SMLB 200 Cox model,3 SVM
Yes. By single imputation methods
Julia Hippisley-Cox and colleagues4
Risk of type II diabetes in 10 years
CD EB 10 Cox model Yes. By multiple imputation
Baek Hwan Cho and colleagues5
Onset of diabetic nephropathy
EHRs SMLB 184 LR, SVM Yes. By temporal abstraction
Julia Hippisley-Cox and colleagues6
Risk of cardiovascular diseases in 10 years
CD EB 14 Cox model No. Use complete data
BN = Bayesian network; CD = cohort database; EB = evidence-based; EHR = electronic health record; LR = logistic regression; NB = naïve Bayes; SMLB = statistical or machine-learning based; and SVM = support vector machine.
Figure 1. Research framework. The five-component time-to-event framework addresses the issues of irregularly spaced data, missing values, and high data dimensionality in electronic health records (EHRs).
Guideline-basedvariable selection
Temporalregularization
Data abstraction
Conceptabstraction
Temporalabstraction
Multipleimputation
Extended Coxmodels
IS-29-03-Lin.indd 16 7/21/14 11:01 AM

S m a r t a n d C o n n e C t e d H e a l t H
MAY/JuNE 2014 www.computer.org/intelligent 17
The list of concepts covers evaluations, diagnoses, and treatments for diabetes as well as various diabetic complica-tions, including cardiovascular diseases, diabetic nephropathy, retinopathy, neuropathy, and peripheral diseases. We then mapped these concepts to the corresponding items in EHRs, resulting in about 400 International Classification of Diseases (ICD)-9 di-agnostic codes, 150 treatments, and 20 lab tests and physical evaluations.
Temporal RegularizationIrregularly spaced data often cause difficulties for temporal data analysis. One way to address this problem is to construct equidistant temporal grids from observations. This temporal reg-ularization approach is common in studies that have unequally spaced time series observations. Following this approach, we divide a patient’s history into monthly intervals. If there are multiple observations for the same feature in an interval, we take their average as a representative value for the feature in that interval. If there’s no observation in an interval, we con-sider it as a missing value and address it through multiple imputation.
Data AbstractionThe essence of data abstraction is to sup-press details and highlight higher-order
meanings, which makes it particularly salient to complex problem solving. Generally, data abstraction encom-passes concept and temporal abstrac-tion. Figure 2 illustrates the two types.
In concept abstraction, each raw datum is independently mapped to a generalized concept. We map ICD-9 diagnosis codes to higher-order cat-egories in the Clinical Classifications Software (CCS), and represent medi-cations by their family names. After this concept abstraction procedure, we reduce diagnosis features to 41 CCS categories, and treatment features to 11 treatment families. In temporal abstraction, numerical time-series in-formation is represented by symbolic codes to reflect temporal states (such as high, medium, or low) and trends (such as decrease or increase). We per-form both state and trend abstraction for our numerical features. We per-form state abstraction by discretizing values into three bins (high, medium, and low), each with the same number of observations. Our trend abstraction is either upward or downward, de-pending on whether an observed value is followed by a greater or lesser value.
Table 1 summarizes our final fea-ture set with four major feature cat-egories. The base features are gender, age, and other common lab or physi-cal tests. The next two categories—
concept abstracted diagnosis features (DX features) and concept abstracted treatment features (TX features)—are binary variables that take the value 0 before the first appearance of the diag-nosis/treatment and the value 1 thereaf-ter. Finally, the temporal abstracted base features encode the states and trends of the lab/physical test results over time.
Multiple ImputationMultiple imputation is an effective technique for missing data process-ing and enables a less-biased data analysis than single imputation methods (for example, filling in the column mean). It achieves this by re-flecting the uncertainly of the missing values in multiple imputed datasets. Specifically, we generate five imputed datasets from the original dataset. In each imputed dataset, a missing value is filled in by a plausible value ran-domly sampled from a conditional distribution of the observables. The uncertainty of a missing value is rep-resented by its multiple realizations in different imputed datasets.
We execute our multiple imputa-tion procedure using the Amelia II pro-gram.5 Amelia II makes inferences on the missing values using an expectation- maximization algorithm combined with a bootstrapping procedure. Com-pared to other alternative multiple
Diabetes mellitus withoutcomplication (CCS 49)
24900 25000 25001 (ICD-9)
79022 79029 7915 7916 79021
HbA1c
Trend
Status
Decrease
Low
Low
Increase
Medium
Medium
High
High
Time
V4585 V5391 V6546
7902
(a) (b)
Figure 2. Two types of data abstraction: (a) concept abstraction and (b) temporal abstraction. CCS stands for Clinical Classifications Software and ICD stands for International Classification of Diseases.
IS-29-03-Lin.indd 17 7/21/14 11:01 AM

18 www.computer.org/intelligent IEEE INTELLIGENT SYSTEMS
S m a r t a n d C o n n e C t e d H e a l t H
imputation programs, Amelia II is sim-pler, faster, and produces more robust results that are similar to more sophis-ticated programs that rely on Markov chain Monte Carlo simulations. We build models and make time-to-event predictions on each of the imputed datasets separately. The reported ex-perimental results are the averaged performance over the five datasets.
Extended Cox ModelThe Cox proportional hazards model is a popular tool for time-to-event analy-sis.1 The Cox model makes the propor-tional hazards assumption. An extended Cox model allows covariates to be time-dependent, which alleviates the poten-tial issue of nonproportional hazards and enables a more flexible modeling
framework.2 The extended Cox model is given by
h t t h t X X ti ii
P
j jj
P
( , ( )) ( ) exp ( )X = +
= =∑ ∑0
1 1
1 2
β δ
,
where h(t, X(t)) is the hazard value at time t, h0(t) is an arbitrary base-line hazard function, and X is a covariate matrix containing P1 time-independent covariates and P2 time-dependent covariates. One of the advantages of Cox models in survival and time-to-event analysis is that we don’t need to specify the baseline hazard function h0(t).
Given the constraint on time-invari-ant covariates, the regular Cox model typically estimates time to event based on information solely from the initial
observations. However, chronic con-ditions persist and evolve over time. When the research interest is the pro-gression of chronic conditions, initial observations alone are often insuffi-cient to construct a robust and accu-rate time-to-event model. In contrast, the extended Cox model allows HbA1c, creatinine, and other physio-logical features to vary with time. For similar reasons, we chose the extended Cox model rather than other popular machine-learning algorithms, such as support vector machines or decision trees, because these algorithms don’t have an elegant approach to deal with data censoring and can’t incorpo-rate time-varying covariates. Finally, we don’t consider other parametric time-to-event models, such as the ac-celerated failure time models because they require making additional distri-butional assumptions on the baseline hazard h0(t).
We construct three time-dependent Cox models. The baseline model uses only the base features, which include essential phenotype information on a patient’s demographic background and values of key tests (see Table 1). The extended model includes DX and TX features along with the base fea-tures. Finally, the full model further in-corporates temporal abstracted (TA) features.
Results and DiscussionWe obtained de-identified EHRs from a major 600-bed hospital in Taiwan. In our experiment, 1,860 patients
Table 1. The final feature set for time-to-event modeling.
Category Category code Variables
Base Base Gender, age, smoking, HbA1c, fasting glucose, low-density lipoprotein (LDL) cholesterol, triglyceride, systolic blood pressure, blood urea nitrogen (BUN), creatinine, body weight
Concept abstracted diagnosis features
DX Clinical Classifications Software (CCS) classes 3, 49, 50, 51, 53, 58, 59, 60, 87, 89, 91, 95, 98, 99, 100, 101, 104, 106, 107, 108, 109, 110, 112, 114, 115, 116, 156, 157, 158, 161, 162, 163, 199, 236, 237, 248, 651, 657, 660, 663, and 670
Concept abstracted treatment features
TX angiotensin-converting-enzyme (ACE) inhibitors, angiotensin II receptor blockers (ARBs), amputation, antihypertensive therapy, antiplatelet therapy, dipeptidyl peptidase-4 (DPP4) inhibitors, insulin, lipid-lowering therapy, metformin, sulfonylureas, thiazolidinediones
Temporal abstracted (TA) base features
TA States and trends of base features (HbA1c, fasting glucose, LDL cholesterol, triglyceride, systolic blood pressure, BUN, creatinine, body weight)
Table 2. Significant risk factors for hospitalization events due to diabetes.
Risk factorsFeature category
Hazard ratio
Lower CI* bound
Upper CI bound
Open wounds of extremities (CCS 236) DX 12.898 1.495 121.187
Acute and unspecified renal failure (CCS 157) DX 11.243 1.569 81.705
Insulin treatment TX 6.082 3.780 9.787
Smoking Base 2.750 1.745 4.336
Antiplatelet therapy TX 2.145 1.200 3.841
Upward trend of body weight TA 1.788 1.238 2.582
Upward trend of fasting glucose TA 1.642 1.098 2.459
HbA1c Base 1.112 1.004 1.233
LDL cholesterol Base 1.007 1.000 1.013
Fasting glucose Base 1.003 1.002 1.004
Sulfonylurea treatment TX 0.663 0.442 0.994
Low-level state of fasting glucose TA 0.545 0.304 0.976
* CI = 95 percent confidence interval.
IS-29-03-Lin.indd 18 7/21/14 11:01 AM

S m a r t a n d C o n n e C t e d H e a l t H
MAY/JuNE 2014 www.computer.org/intelligent 19
satisfied our selection criteria of hav-ing an onset diagnosis of diabetes from 2003 to 2012. Among them, 155 had experienced the event (hos-pitalization due to diabetes). One de-fining characteristic of survival and time-to-event data is right censoring. Right censoring occurs when a study ends or when a patient is lost to fol-low-up. As such, we don’t know the actual time to an event for right-cen-sored observations. In this study, we consider observations to be right cen-sored at the last visit of an event-free patient.
We evaluate the models by how well they discriminate between pa-tients with and without the event. We derive receiver operating character-istic (ROC) curves and compute the area under an ROC curve (AUC) to assess a model’s discriminative abil-ity. Because a patient’s history is di-vided into monthly intervals, we perform prognostic prediction on each month until the last event time (at the 85th month). Our time-de-pendent ROC analysis for predictive accuracy strictly follows the method outlined by Patrick Heagerty and Yingye Zheng.6 Figure 3a shows the AUC values of the three models over
time. The average AUC scores for the baseline, extended, and full mod-els are 0.75, 0.87, and 0.90, respec-tively. As the figure demonstrates, the full (extended) model consistently outperforms the extended (baseline) model on each of the 85 monthly-based predictions. Figure 3b shows the ROC curves of the three mod-els for the predictions made at the 42nd month, which is the midpoint among all the prediction months. The ROC curves for the predictions of the other months present similar patterns.
Table 2 shows the statistically sig-nificant covariates in our full model (p-value ≤ 0.05 in at least two im-puted datasets). Hazard ratio is a typical measure of effect in time-to-event analysis. When a hazard ra-tio is significantly greater (less) than one, the risk factor is deemed posi-tively (negatively) associated with the event. Although we couldn’t find suit-able prior clinical studies as an ex-ternal validation source, overall the list of risk factors in Table 2 seems to be clinically reasonable as vali-dated by our medical collabora-tors. Open wounds on extremities are often the result of diabetic foot
syndrome, which occurs in severe diabetic cases. Renal failure is often the result of poorly controlled diabe-tes. Insulin treatments are prescribed when oral medications can no longer control the patient’s rising glucose level. Smoking and antiplatelet ther-apy are associated with more frequent hospitalizations, likely representing the increased risk of stroke, heart at-tack, and peripheral vascular disease. It’s noteworthy that several temporal abstracted features are on the list of significant risk factors. The upward trends of body weight and fasting glu-cose signify high hazard ratios. On the other hand, a low-level fasting glucose is associated with fewer hospitaliza-tion events.
While our modeling framework attained a remarkable perfor-
mance in time-to-event predictions (an AUC of 0.90 in our full model), two limitations of this study point to future research. First, we didn’t deal with clinical texts. Clinical texts con-tain rich descriptions of a patient’s current and historical conditions. However, the inclusion of clinical text in temporal modeling necessitates
0.7
0.75
0.8
0.85
0.9
0.95
1
0 10 20 30 40 50 60 70 80
AUC
Prediction month0.0
0.0
0.2
0.4
0.6
0.8
1.0
0.2 0.4 0.6False positive rate
True
pos
itive
rate
0.8 1.0
(a) (b)
Baseline model Extended model Full model
Figure 3. Performance comparison: (a) the receiver operating characteristic (ROC) of the area under an ROC curve (AUC) values over different prediction points, and as a representative case; (b) the time-dependent ROC curve at the 42nd month.
IS-29-03-Lin.indd 19 7/21/14 11:01 AM

20 www.computer.org/intelligent IEEE INTELLIGENT SYSTEMS
S m a r t a n d C o n n e C t e d H e a l t H
techniques for temporal text process-ing. Current systems achieve only about 70 percent accuracy in nor-malizing temporal expressions.7 We therefore limited this study to struc-tured information in EHRs. Second, our guideline-based feature selec-tion involved extensive manual work in encoding guideline concepts and mapping them to EHR data elements. As such, this approach isn’t as scal-able as automatic feature selection schemes. Future research might also consider combining or comparing guideline-based feature selection with other statistical feature- selection methods.
AcknowledgmentsPatient data are de-identifi ed and HIPAA compliant. We obtained Institutional Re-view Board approval on this study. This re-search is supported by US National Science Foundation grant CBET-0730908, De-fense Threat Reduction Agency Grant HD-TRA10910058, and Taiwan National Science Council grant NSC101-3114-Y-002-003.
We acknowledge Min-Sheng hospital for supporting the research data and our clini-cal collaborators Dr. Craig Stump and Dr. Hung-Yuan Li for providing medical consul-tations and comments.
References1. D.R. Cox, “Regression Models and Life-
Tables,” J. Royal Statistical Soc. Series B
(Methodological), vol. 34, no. 2, 1972,
pp. 187–220.
2. J.D. Kalbfl eisch and R.L. Prentice, Statis-
tical Analysis of Failure Time Data, 2nd
ed., Wiley-Interscience, 2002.
3. J. Hippisley-Cox et al., “Predicting
Risk of Type 2 Diabetes in England
and Wales: Prospective Derivation
and Validation of QDScore,” British
Medical J., vol. 338, 2009; http://dx.doi.
org/10.1136/bmj.b880.
4. B.H. Cho et al., “Application of Irregular
and Unbalanced Data to Predict Diabetic
Nephropathy Using Visualization and
Feature Selection Methods,” Artifi cial
Intelligence in Medicine, vol. 42, no. 1,
2008, pp. 37–53.
5. J. Honaker, G. King, and M. Blackwell,
“Amelia II: A Program for Missing
Data,” J. Statistical Software, vol. 45, no.
i07, 2011; www.jstatsoft.org/v45/i07.
6. P.J. Heagerty and Y. Zheng, “Survival
Model Predictive Accuracy and ROC
Curves,” Biometrics, vol. 61, no. 1, 2005,
pp. 92–105.
7. Y.-K. Lin, H. Chen, and R.A. Brown,
“MedTime: A Temporal Information
Extraction System for Clinical Narra-
tives,” J. Biomedical Informatics, vol. 46,
Dec. 2013, pp. S20–S28.
Selected CS articles and columns are also available for free at
http://ComputingNow.computer.org.
t H e a U t H o r SYu-Kai Lin is a doctoral candidate in the Management Information Systems Department and a research associate in the Artifi cial Intelligence (AI) Lab at the University of Ari-zona. His research interests include health informatics, machine learning, and economic analysis of health IT. Lin has an MBA in technology management from National Tsing Hua University. Contact him at [email protected].
Hsinchun Chen is the University of Arizona Regents’ Professor and Thomas R. Brown Chair in Management and Technology in the Management Information Systems Depart-ment and the funding director of the AI Lab. His research interests include Web comput-ing, search engines, digital libraries, intelligence analysis, biomedical informatics, data/text/Web mining, and knowledge management. Chen has a PhD in information systems from New York University. He’s a Fellow of IEEE and AAAS. Contact him at [email protected].
Randall A. Brown is an associate professor of medicine with the University of Arizona Health Network and a research affi liate with the University of Arizona Management In-formation Systems Department. His research interests include biomedical informatics, stem cell therapy, business intelligence, and portfolio management. Brown has an MD from Rush Medical College in Chicago. Contact him at [email protected].
Shu-Hsing Li is the vice president for fi nance affairs and a professor of accounting at the National Taiwan University. His research interests include multinational transfer pricing, text mining and capital market research, and health care intelligence and cost manage-ment. Li has a PhD in accounting from New York University. Contact him at [email protected].
Hung-Jen Yang is currently the president and CEO of Min-Sheng General Hospital in Taiwan. Yang has a master’s of public health from Harvard University and an MBA from Claremont Graduate University, respectively. Contact him at [email protected].
New in 2014
CLOUDIEEE
COMPUTING
computer.org/cloudcomputing
IEEE Computer Society’s newest magazine tackles the emerging technology of cloud computing.
Subscribe today!
IS-29-03-Lin.indd 20 7/21/14 11:01 AM