Time Planning and Control -...
24
Time Planning and Control Precedence Diagram
Transcript of Time Planning and Control -...

Time Planning and Control
Precedence Diagram
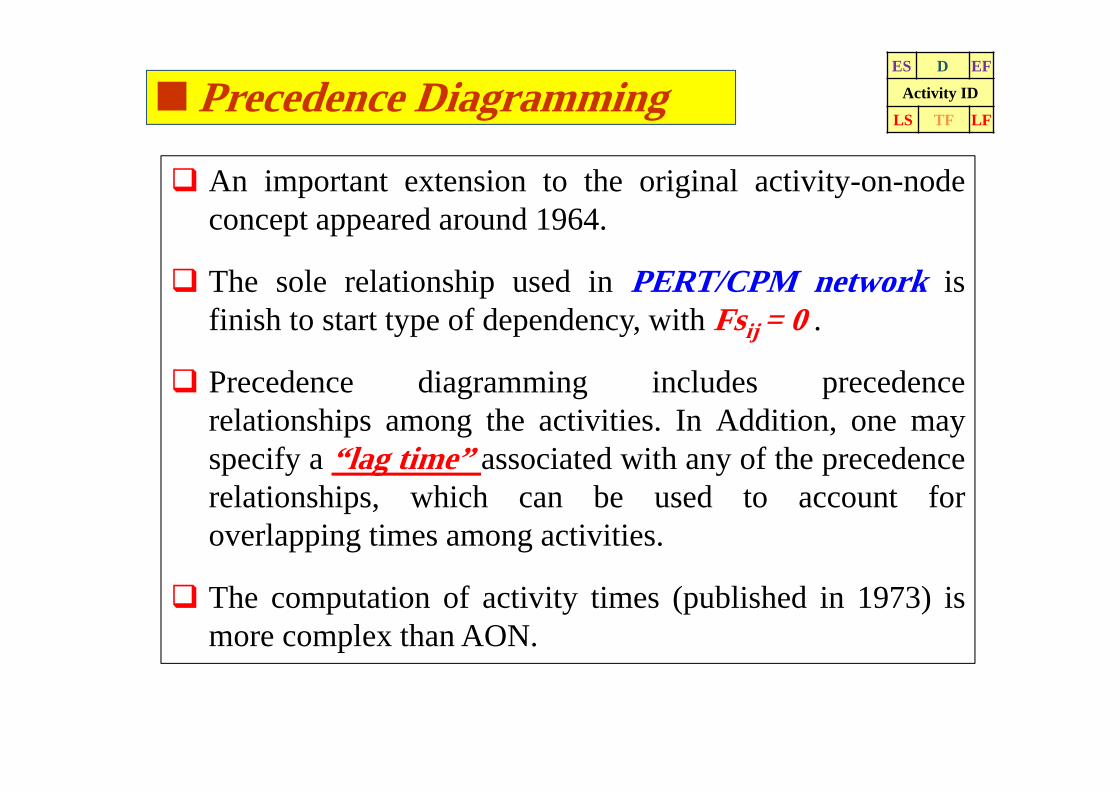
Precedence Diagramming
An important extension to the original activity-on-nodeconcept appeared around 1964.
The sole relationship used in PERT/CPM network isfinish to start type of dependency, with Fsij = 0 .
Precedence diagramming includes precedencerelationships among the activities. In Addition, one mayspecify a “lag time” associated with any of the precedencerelationships, which can be used to account foroverlapping times among activities.
The computation of activity times (published in 1973) ismore complex than AON.
EFDES
Activity ID
LFTFLS

In many cases, there is a delay between the completion of one activity and the start of another following or there is a need to show that one activity will overlap another in some fashion.
A successor "lags" a predecessor, but a predecessor "leads" a successor.
Lag time can be designated on a dependency line with a positive, negative, or zero value.
Limitations and Disadvantages of Lag: Lag would complicate the scheduling process. Lags are not extensively used except where the time effects are
substantial for special project type.
Lag / Lead TimesEFDES
Activity ID
LFTFLS

Precedence Diagramming Relationships Types and constraint
1. Start-to-Start (SSij)
[(j) cannot start till (i) starts by amount of the SS]
The value of SSij is equal to the minimum number of time units that must becompleted on the preceding activity (i) prior to the start of the successor (j).“Lag” is always applied to SS relation.
Example SSij =3 [The start of (j) must lag 3 units after the start of (i)]
i
j
2. Finish-to-Finish (FFij)[(j) cannot finish till (i) finishes by amount of the FF]
FFij is equal to the minimum number of time units that must remain to becompleted on the successor (j) after the completion of the predecessor (i).
Example FFij =5 [The finish of (j) must lag 5 units after the finish of (i) ]
i FFIJ
j

Precedence Diagramming Relationships Types and constraint
3. Finish-to-Start (FSij)[(j) cannot start till (i) finishes by amount of the FS]
FSij is equal to the minimum number of time units that must transpire fromthe completion of the predecessor (i) prior to the start of the successor (j).
Example FSij =6 [The start of (j) must lag 6 units after the finish of (i)]
i FSIJ j
4. Start-to-Finish (SFij)
[(j) cannot finish till (i) starts (rare)]
SFij is equal to the minimum number of time units that must transpire fromthe start of the predecessor (i) to the completion of the successor (j).
Example SFij (SFij ‘ + SFij “) =(4+6) =10 [The finish of (j) must lag 10units after the start of (i)]
SFij'
i
jSFij
''

Precedence Diagramming Relationships Types and constraint
5. Start-to-Start and Finish-to-Finish (ZZij):
ZZij is a combination of two constraints, i.e., a start-to-start and finish-to-finish relationship. It is written with the SSij time units first, followed bythe FFij time units.
Example ZZij =5 , 6 [The start of (j) must lag 5 units after the start of(i) (SSij = 5) & The finish of (j) must lag 6 units after the finish of (i)(FFij = 6)]
ES Duration EF
Activity (i)
LS Total Float LF
ES Duration EF
Activity (j)
LS Total Float LF
Types of constraints with lag/lead Durations
)( ijijij
ij
ij
ij
ij
FFSSZZSFFSFFSS

Precedence Diagram Computation
Forward Pass Computations
[1] ESj = Max. all i
Initial TimeEFi + FSijESi + SSijEFi + FFij – DjESi + SFij - Dj
[2] EFj = ESj + Dj
EFDES
FFActivity ID
LFTFLS

Precedence Diagram Computation
Backward Pass Computations
[3] LFi = Min. all j
Terminal TimeLSj - FSijLFj - FFijLSj - SSij + DiLFj - SFij + Di
[4] LSi = LFi Di
EFDES
FFActivity ID
LFTFLS

Precedence Diagramming CalculationsEXAMPLE
For the given precedence diagram, complete the forward and backward passcalculations. Assume the project starts at T=0, and no splitting on activities isallowed. Also assume that the project latest allowable completion time (projectduration) is scheduled for 30 working days.
FS 0
SS 3FF 4
SS 6
SF 12
FS 0A
Developsystem spec.
(D=8)
CCollect
system data (D=4)
DTest & debug
program(D=6)
ERun
program(D=6)
FDecument program(D=12)
BWrite comp.
program (D=12)

Precedence Diagramming CalculationsAON diagram
A8
B
12
D
6
C4
END
0
E6
F
12
FS 0
SS 3FF 4
SS 6
SF 12
FS 0A
Developsystem spec.
(D=8)C
Collect system data
(D=4)
DTest & debug
program(D=6)
ERun program
(D=6)
FDecument program(D=12)B
Write comp. program (D=12)

Precedence Diagramming Calculations Example Computation
jjj
jiji
jiji
iji
iji
ij
DESEF
DSFESDFFEF
SSESFSEF
allMaxES
]2[
Time Initial
)(]1[
Forward Pass ComputationsActivity A
880
0Time Initial
ADAESAEFAES
Activity B
1512301248
3300Time Initial
)(
BBB
BABA
ABAB
DESEFDFFEF
SSESMaxES A
Activity C1349
9630Time Initial
)(
CDCESCEFBCSSBESMaxES BC
A8
B
12D
6
C4
END
0
E6
F
12
0 8 3 15
9 13
FS 0
SS 3FF 4 SS 6
SF 12
FS 0

Precedence Diagramming Calculations Example Computation
jjj
jiji
jiji
iji
iji
ij
DESEF
DSFESDFFEF
SSESFSEF
allMaxES
]2[
Time Initial
)(]1[
Forward Pass Computations
A8
B
12D
6
C4
END
0
E6
F
12
0 8 3 15
9 13
Activity D21615
150150
DDDESDEFBDFSBEF
meInitial TiMax(B)DES
Activity E27621
13013,
210210Time Initial
),(
EDEESEEFCEFSCEFOR
DEFSDEFDCMaxEES
Activity F271215
13013,15121215
0Time Initial)(
FFF
CFC
FDFDF
DESEFFSEFOR
DSFESMaxES D
15 21
21 27
15 27
27 27
FS 0
SS 3FF 4 SS 6
SF 12
FS 0

Precedence Diagramming Calculations Example Computation
A8
B
12D
6
C4
END
0
E6
F
12
0 8 3 15
9 13
15 21
21 27
15 27
27 27
Activity F 181230
30Tim Terminal
FDFLFFLS
eFLF
Activity E24630
30Tim Terminal
EEE
E
DLFLSeLF
Activity D
186242461230
2702430Tim Terminal
)( ,
DDD
DDFF
DEEFED
DLFLSDSFLF
ORFSLS
e
MinLF
Backward Pass Computations
iii
iijj
iijj
ijj
ijj
ji
DLFLS
DSFLFDSSLS
FFLFFSLS
e
allMinLF
]4[
Tim Terminal
)(]3[
3030 3
30
30
18 3
24 3
2418 3
FS 0
SS 3FF 4 SS 6
SF 12
FS 0

Precedence Diagramming Calculations Example Computation
Backward Pass Computations
iii
iijj
iijj
ijj
ijj
ji
DLFLS
DSFLFDSSLS
FFLFFSLS
e
allMinLF
]4[
Tim Terminal
)(]3[
A8
B
12D
6
C4
END
0
E6
F
12
0 8 3 15
9 13
15 21
21 27
15 27
27 27
3030 3
30
30
18 3
24 3
2418 3
1814 5
186 3113 3
Activity C
1441818018
2402430Tim Terminal
)(
CCC
CFF
CEE
C
DLFLSFSLS
OrFSLS
e
EMinLF
Activity B61218
2012614
1801830Tim Terminal
),(
BDBLFBLSBDBCSSCLS
ORBDFSDLS
e
DCMinBLF
Activity A3811
1183614418
30Tim Terminal)(
ADALFALSADABSSBLS
ABFFBLFe
BMinALF
FS 0
SS 3FF 4 SS 6
SF 12
FS 0

Precedence Diagramming Calculations
Earliest Earliest Latest Latest OnStart Finish Start Finish Slack Critical
Activity ES EF LS LF LS – ES PathA 0 8 3 11 3 NoB 3 15 6 18 3 NoC 9 13 14 18 5 NoD 15 21 15 21 3 NoE 21 27 24 30 3 NoF 15 27 18 30 3 No
Computing Slack Time (Float Time)

, ) ( )
Given the precedence network for a small engineering project with activity durations in working days, it is required to compute the activity times (ES, EF, LS, and LF) and total floats (TF) and then indicate the critical activities.
Example 2
58 3 FS 3FF 5
SS 8
1061055FFFS 2
FS 4SF 3,47134SS 5
FS 0
L
C
D
E
F
H
I
J
K
ZZ 3,2A
EFDES
FFActivity ID
LFTFLS

Example 2
2451916881138FS 3FF 5
SS 8
30102019613171075505FFFS 2
FS 4SF 3,4167922139945SS 5
FS 0
K
ZZ 3,2A L
C
D
E
F
H
I
J
Calculate the Early activity times (ES and EF).EFDES
FFActivity ID
LFTFLS

Example 2
2451916881138FS 3FF 5
30 2522 1417 14SS 8
30102019613171075505FFFS 2
30 2025 1923 135 0
FS 4SF 3,4167922139945SS 5
FS 016 922 99 5
K
ZZ 3,2A L
C
D
E
F
H
I
J
Calculate the late activity times (LS and LF).EFDES
FFActivity ID
LFTFLS

Example 2
2451916881138FS 3FF 5
306252261417614SS 8
30102019613171075505FFFS 2
300202561923613500
FS 4SF 3,4167922139945SS 5
FS 016092209905
L
C
D
E
F
H
I
J
K
ZZ 3,2A
Calculate Total Float for an activity.EFDES
FFActivity ID
LFTFLS

Example 2
2451916881138FS 3FF 5
305252261417614SS 8
30102019613171075505FFFS 2
300202561923613500
FS 4SF 3,4167922139945SS 5
FS 016092209905
L
C
D
E
F
H
I
J
K
ZZ 3,2A
Indicate the critical activities.EFDES
FFActivity ID
LFTFLS

An activity that extends from one activity toanother, but which has no estimated duration ofits own.
It is time-consuming and requires resources, butits duration is controlled, not by its own nature,but by the two activities between which it spans.
Its ES and LS times are determined by theactivity where it begins and its EF and LF timesare dictated by the activity at its conclusion.
Examples: Dewatering, Haul road maintenance
HAMMOCK ACTIVITY
Notes on Schedule

Milestones are points in time that have beenidentified as being important intermediatereference points during the accomplishment ofthe work.
Milestone events can include dates imposed by thecustomer for the finishing of certain tasks as wellas target dates set by the project manager for thecompletion of certain segments of the work.
MILESTONES
Notes on Schedule
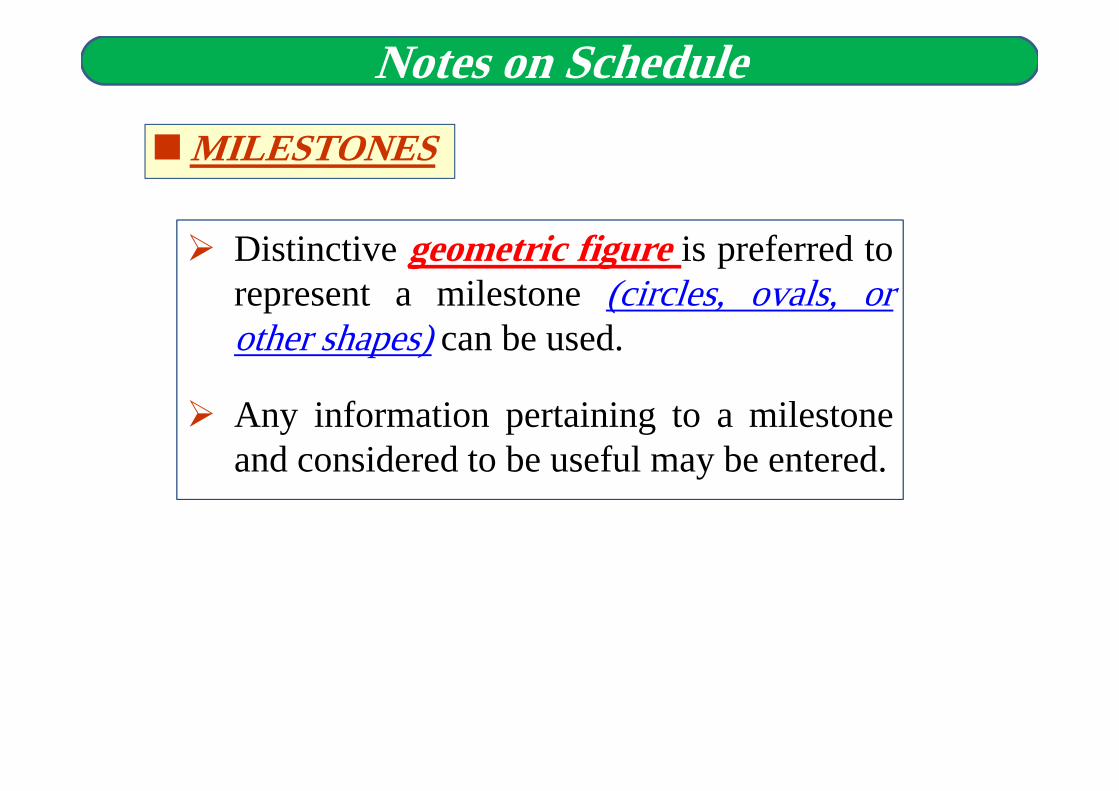
Distinctive geometric figure is preferred torepresent a milestone (circles, ovals, orother shapes) can be used.
Any information pertaining to a milestoneand considered to be useful may be entered.
MILESTONES
Notes on Schedule

How can you shorten the schedule?Via Reducing scope (or quality) Adding resources Concurrency (perform tasks in parallel) Substitution of activities
Reducing Project Duration
Notes on Schedule


![Diagramming Review II - WCUSD15 · about sentence diagramming. classes are excited ... -ed, -d, -t, or ... Diagramming Review II [Compatibility Mode]](https://static.fdocuments.in/doc/165x107/5af7254d7f8b9a9271913b29/diagramming-review-ii-sentence-diagramming-classes-are-excited-ed-d-t.jpg)