Time Management as an administrative tool for charting...
23
Proceedings of the First Asia-Pacific Conference on Global Business, Economics, Finance and Social Sciences (AP14Singapore Conference) ISBN: 978-1-941505-15-1 Singapore, 1-3 August 2014 Paper ID: S447 1 www.globalbizresearch.org Time Management as an administrative tool for charting public service delivery time lines Londoloza L. Luvuno, Department of Public administration and Management, University of South Africa, South Africa. Email: [email protected] _____________________________________________________________________ Abstract On-time delivery of public services by government departments is becoming urgent. This article explores the correlation between time management as an administrative tool to manage time for public service delivery and response to service delivery bottlenecks during the public services delivery process. This is also contextualised by the public outcry and demonstration for on-time delivery of quality public services. The argument in this article focuses on the application of time management as an appropriate administrative tool for charting and planning public services and dates of delivery. In terms of the South African Local Government Turnaround Strategy (LGTAS), time management, public policy implementation and service delivery dates become essential for local government. The article concludes that a clear understanding of the application of time management would effectively, efficiently and economically enhance the process of public service delivery. The article indicates that the existing challenges of delays and that a more active approach is necessary for charting and planning government activities to a point of determining the critical time of public service delivery. However, the focus should rather be placed on the day-to-day scheduling of public service delivery though the use of time management. ___________________________________________________________________________ Key words: Gantt chart, critical path analysis, service delivery, time management, administrative tool.
Transcript of Time Management as an administrative tool for charting...
Proceedings of the First Asia-Pacific Conference on Global Business, Economics, Finance and
Social Sciences (AP14Singapore Conference) ISBN: 978-1-941505-15-1
Singapore, 1-3 August 2014 Paper ID: S447
1
www.globalbizresearch.org
Time Management as an administrative tool for charting public
service delivery time lines
Londoloza L. Luvuno,
Department of Public administration and Management,
University of South Africa, South Africa.
Email: [email protected]
_____________________________________________________________________
Abstract
On-time delivery of public services by government departments is becoming urgent. This
article explores the correlation between time management as an administrative tool to
manage time for public service delivery and response to service delivery bottlenecks during
the public services delivery process. This is also contextualised by the public outcry and
demonstration for on-time delivery of quality public services. The argument in this article
focuses on the application of time management as an appropriate administrative tool for
charting and planning public services and dates of delivery. In terms of the South African
Local Government Turnaround Strategy (LGTAS), time management, public policy
implementation and service delivery dates become essential for local government. The article
concludes that a clear understanding of the application of time management would
effectively, efficiently and economically enhance the process of public service delivery. The
article indicates that the existing challenges of delays and that a more active approach is
necessary for charting and planning government activities to a point of determining the
critical time of public service delivery. However, the focus should rather be placed on the
day-to-day scheduling of public service delivery though the use of time management.
___________________________________________________________________________
Key words: Gantt chart, critical path analysis, service delivery, time management,
administrative tool.
Proceedings of the First Asia-Pacific Conference on Global Business, Economics, Finance and
Social Sciences (AP14Singapore Conference) ISBN: 978-1-941505-15-1
Singapore, 1-3 August 2014 Paper ID: S447
2
www.globalbizresearch.org
1. Introduction
When public officials attempt to determine public services delivery due dates, public
resources quantification, identification of bottlenecks and reduction of public resource costs,
the major stumbling blocks in the effective and efficient execution of these activities is the
improper charting of service delivery activities.
This article explores the use of time management for charting timely and progressive
delivery of public services as well as locating and rectifying bottlenecks. Such an approach
can be understood by first addressing the variations of time schedules. This assists public
officials to simplify the complex process of time management when charting and scheduling
public service delivery time lines. This can also be understood by comprehending the actual
process of charting public service delivery dates and public resource allocations.
Because time management is an administrative tool that focuses on time line scheduling,
it helps with the effective management of public programmes, policies and projects. It is for
this reason that many of the public sector activities are projects in nature and thus require a
time scheduling tool.
Even though time management is deemed to be a private sector management tool due to
many project undertakings, the tool is also applicable to the public sector with specific
reference to national, provincial and local government programmes, policies and projects.
In order for municipal managers and officials alike to manage time better to ensure
quality service delivery, the need to fully comprehend the variations, essence and process of
time management scheduling in the public sector is essential and are discuss next.
1.1 Variations of time management
Time management, sometimes known as network programming or network analysis, is a
generic term used to encompass specific methods of charting public service delivery
activities. A few of these time charting variations discussed by various authors consist of the
following:
1.2 The arrow network diagram
The arrow network diagram is the time management chart itself, which McGowan
(2013:438) describes as a service delivery plan represented in a network of arrows showing
precedence relationships with each arrow representing a single activity. An arrow network is
a diagram constructed to show how all the public sector functions concerning service delivery
are related to national, provincial and local government spheres and to the various stages of
service delivery. Every arrow network has a starting point known as a source and a finishing
point known as a sink which consists of sequences of links and nodes in the form of boxes or
circles between two points. Each link carries an arrow at its head to indicate the direction of
movement, hence the name “arrow network” for a network of directed links. A public service
Proceedings of the First Asia-Pacific Conference on Global Business, Economics, Finance and
Social Sciences (AP14Singapore Conference) ISBN: 978-1-941505-15-1
Singapore, 1-3 August 2014 Paper ID: S447
3
www.globalbizresearch.org
delivery activity to be undertaken is represented by each arrow in a network, extending
between two nodes. The tail of the arrow indicates the start of a public service delivery
activity and the head of the arrow indicates the end of a public service delivery activity. The
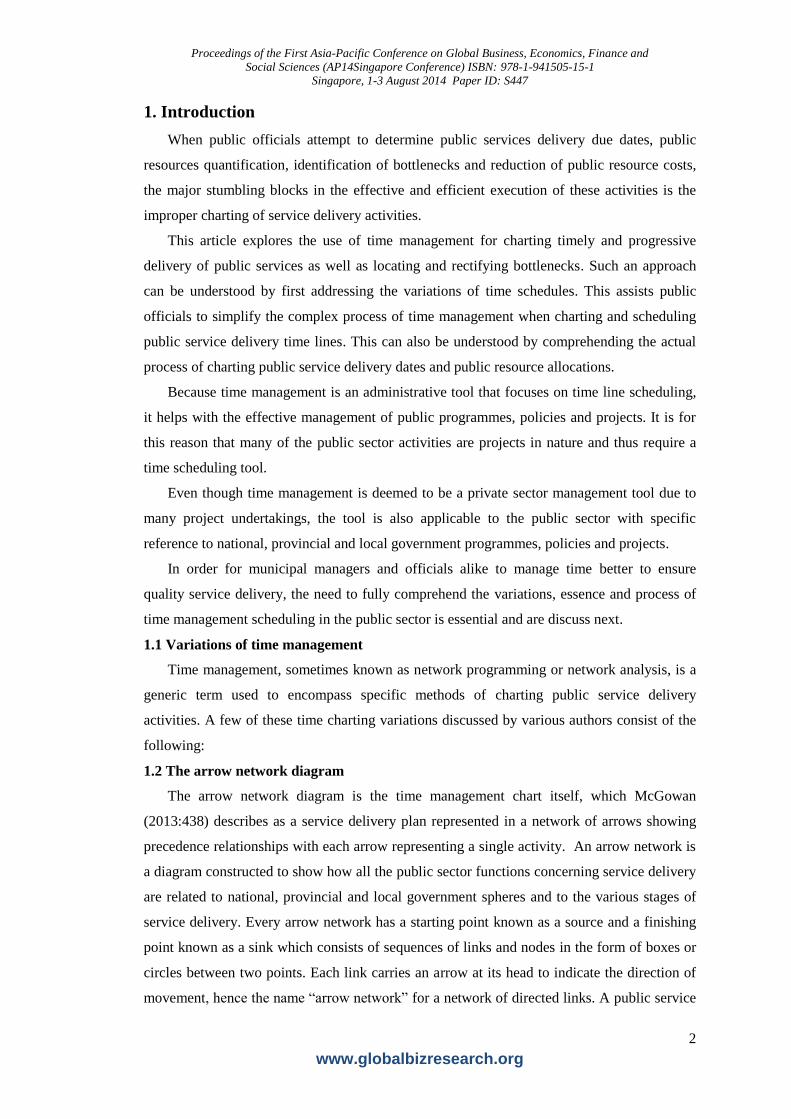
convention that has been adopted in arrow networks relating to work-performance is to use
the term “event” for a node and “activity” for a link as indicated by the diagram of Kanter
(2012:22) below.
Figure 1: represents an arrow network diagram consisting of preceding and succeeding events.
1.3 Precedence network diagram
Precedence network differs from arrow network basically by representing activities in
circles or boxes instead of arrows as denoted in figure 1 above. These circles or boxes are
then linked by arrows of logic showing the connections between activities from sources to
sinks (Zawacki 2012:10). The precedence network diagram, integrated with the arrow
network diagram indicates a simplified porgramme evaluation and review technique (PERT).
The arrow network can also be used for the purposes of denoting public service delivery due
dates and quantification of public resources. In terms of figure1, the arrow network mostly
contains the starting date, the duration time, the latest date and the name of the activity to be
undertaken. Assuming that a public official wants to achieve an objective of initiating a
particular service deliver within 3 days, figure 1 indicates the start day at 1, the duration time
as 3 days, the finish day 4 at the top block of a network box and the name of the activity at the
bottom. In this case “Service delivery initiation phase” took a total of 4 days to complete. In
terms of figure 1, the completion of both the preceeding and succeeding events, would take 6
days.
1.4 Gantt chart diagram
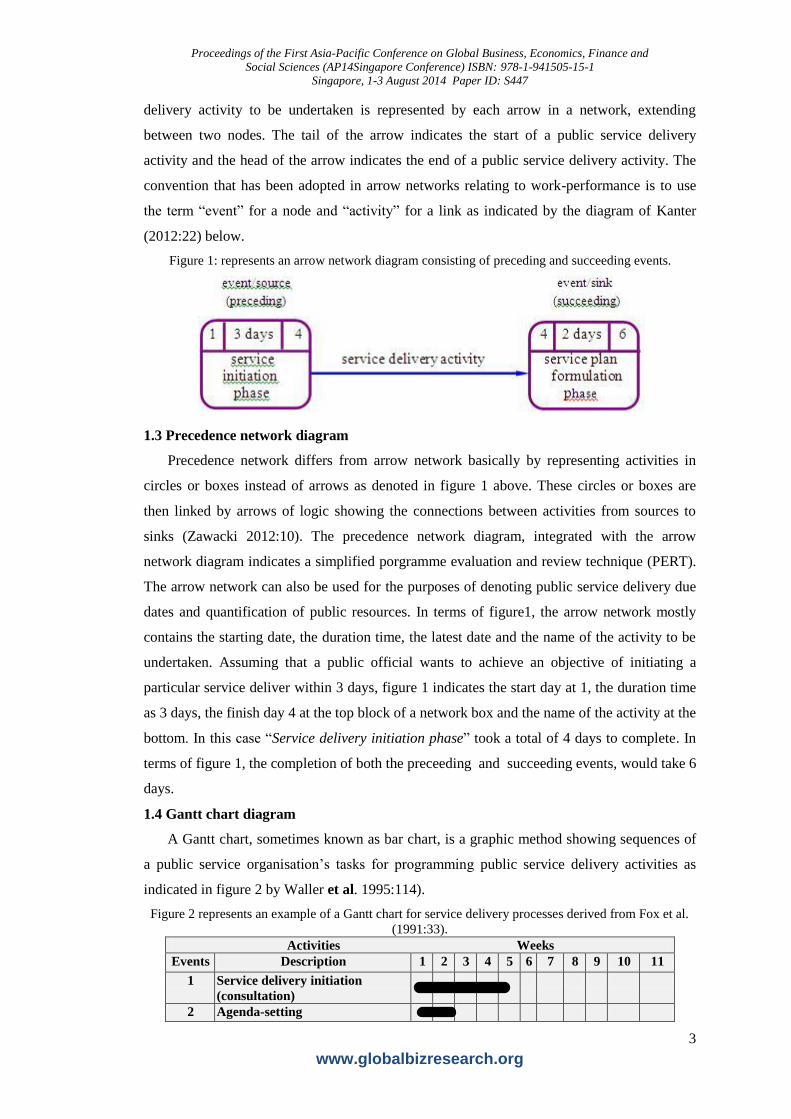
A Gantt chart, sometimes known as bar chart, is a graphic method showing sequences of
a public service organisation‟s tasks for programming public service delivery activities as
indicated in figure 2 by Waller et al. 1995:114).
Figure 2 represents an example of a Gantt chart for service delivery processes derived from Fox et al.
(1991:33).
Activities Weeks
Events Description 1 2 3 4 5 6 7 8 9 10 11
1 Service delivery initiation
(consultation)
2 Agenda-setting
Proceedings of the First Asia-Pacific Conference on Global Business, Economics, Finance and
Social Sciences (AP14Singapore Conference) ISBN: 978-1-941505-15-1
Singapore, 1-3 August 2014 Paper ID: S447
4
www.globalbizresearch.org
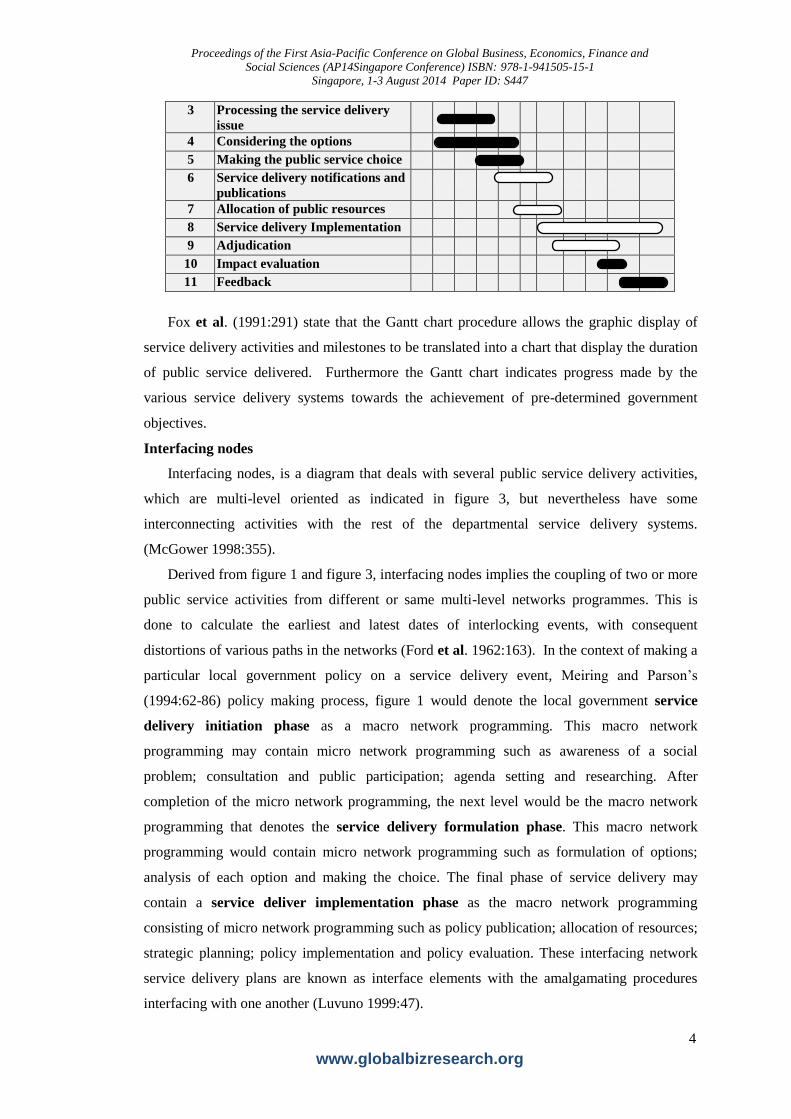
3 Processing the service delivery
issue
4 Considering the options
5 Making the public service choice
6 Service delivery notifications and
publications
7 Allocation of public resources
8 Service delivery Implementation
9 Adjudication
10 Impact evaluation
11 Feedback
Fox et al. (1991:291) state that the Gantt chart procedure allows the graphic display of
service delivery activities and milestones to be translated into a chart that display the duration
of public service delivered. Furthermore the Gantt chart indicates progress made by the
various service delivery systems towards the achievement of pre-determined government
objectives.
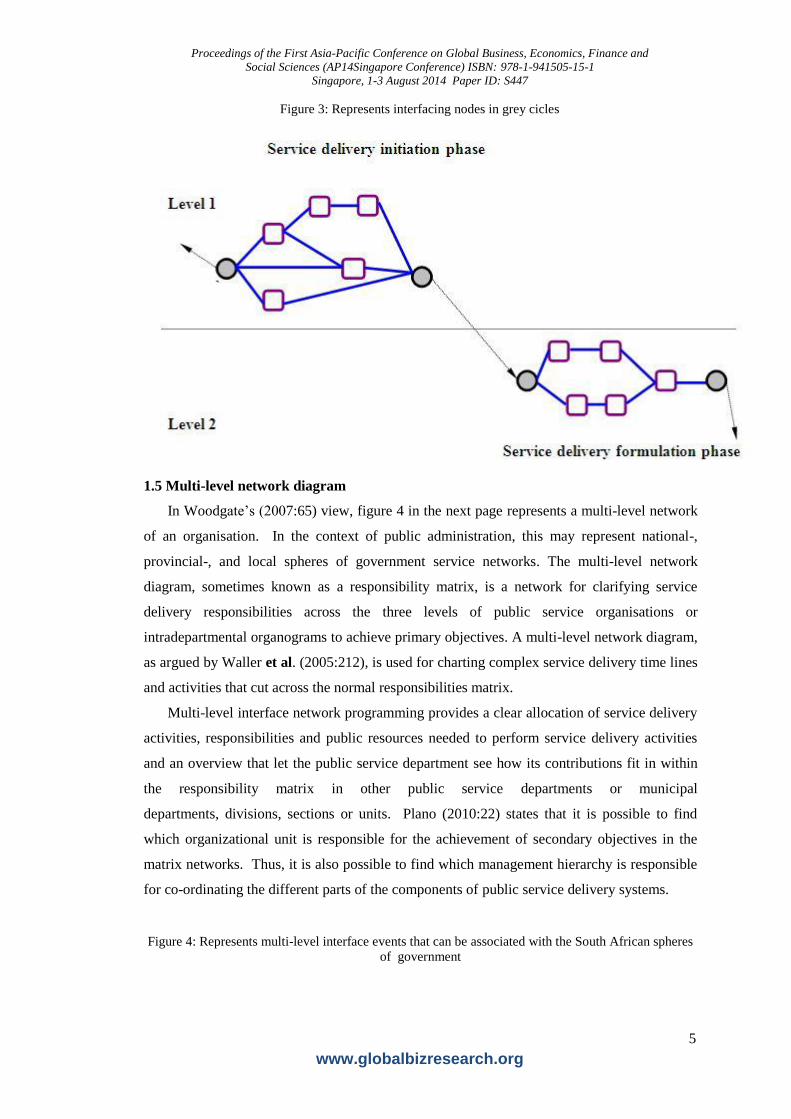
Interfacing nodes
Interfacing nodes, is a diagram that deals with several public service delivery activities,
which are multi-level oriented as indicated in figure 3, but nevertheless have some
interconnecting activities with the rest of the departmental service delivery systems.
(McGower 1998:355).
Derived from figure 1 and figure 3, interfacing nodes implies the coupling of two or more
public service activities from different or same multi-level networks programmes. This is
done to calculate the earliest and latest dates of interlocking events, with consequent
distortions of various paths in the networks (Ford et al. 1962:163). In the context of making a
particular local government policy on a service delivery event, Meiring and Parson‟s
(1994:62-86) policy making process, figure 1 would denote the local government service
delivery initiation phase as a macro network programming. This macro network
programming may contain micro network programming such as awareness of a social
problem; consultation and public participation; agenda setting and researching. After
completion of the micro network programming, the next level would be the macro network
programming that denotes the service delivery formulation phase. This macro network
programming would contain micro network programming such as formulation of options;
analysis of each option and making the choice. The final phase of service delivery may
contain a service deliver implementation phase as the macro network programming
consisting of micro network programming such as policy publication; allocation of resources;
strategic planning; policy implementation and policy evaluation. These interfacing network
service delivery plans are known as interface elements with the amalgamating procedures
interfacing with one another (Luvuno 1999:47).
Proceedings of the First Asia-Pacific Conference on Global Business, Economics, Finance and
Social Sciences (AP14Singapore Conference) ISBN: 978-1-941505-15-1
Singapore, 1-3 August 2014 Paper ID: S447
5
www.globalbizresearch.org
Figure 3: Represents interfacing nodes in grey cicles
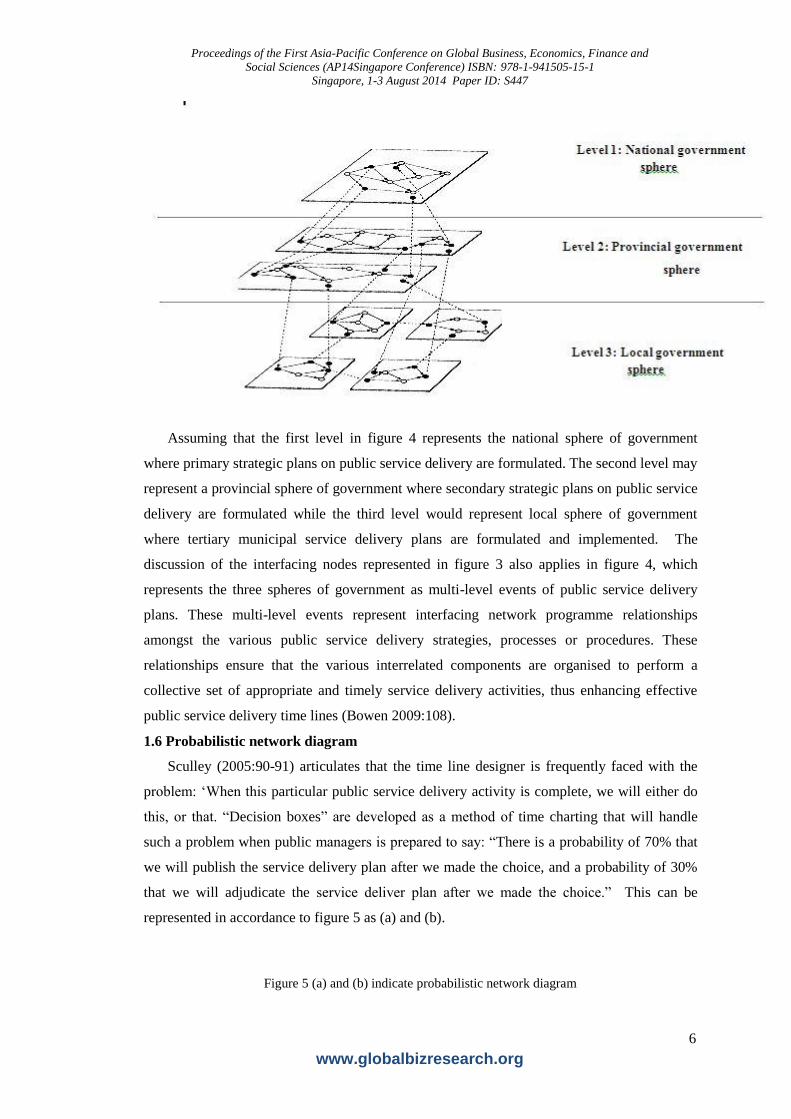
1.5 Multi-level network diagram
In Woodgate‟s (2007:65) view, figure 4 in the next page represents a multi-level network
of an organisation. In the context of public administration, this may represent national-,
provincial-, and local spheres of government service networks. The multi-level network
diagram, sometimes known as a responsibility matrix, is a network for clarifying service
delivery responsibilities across the three levels of public service organisations or
intradepartmental organograms to achieve primary objectives. A multi-level network diagram,
as argued by Waller et al. (2005:212), is used for charting complex service delivery time lines
and activities that cut across the normal responsibilities matrix.
Multi-level interface network programming provides a clear allocation of service delivery
activities, responsibilities and public resources needed to perform service delivery activities
and an overview that let the public service department see how its contributions fit in within
the responsibility matrix in other public service departments or municipal
departments, divisions, sections or units. Plano (2010:22) states that it is possible to find
which organizational unit is responsible for the achievement of secondary objectives in the
matrix networks. Thus, it is also possible to find which management hierarchy is responsible
for co-ordinating the different parts of the components of public service delivery systems.
Figure 4: Represents multi-level interface events that can be associated with the South African spheres
of government
Proceedings of the First Asia-Pacific Conference on Global Business, Economics, Finance and
Social Sciences (AP14Singapore Conference) ISBN: 978-1-941505-15-1
Singapore, 1-3 August 2014 Paper ID: S447
6
www.globalbizresearch.org
Assuming that the first level in figure 4 represents the national sphere of government
where primary strategic plans on public service delivery are formulated. The second level may
represent a provincial sphere of government where secondary strategic plans on public service
delivery are formulated while the third level would represent local sphere of government
where tertiary municipal service delivery plans are formulated and implemented. The
discussion of the interfacing nodes represented in figure 3 also applies in figure 4, which
represents the three spheres of government as multi-level events of public service delivery
plans. These multi-level events represent interfacing network programme relationships
amongst the various public service delivery strategies, processes or procedures. These
relationships ensure that the various interrelated components are organised to perform a
collective set of appropriate and timely service delivery activities, thus enhancing effective
public service delivery time lines (Bowen 2009:108).
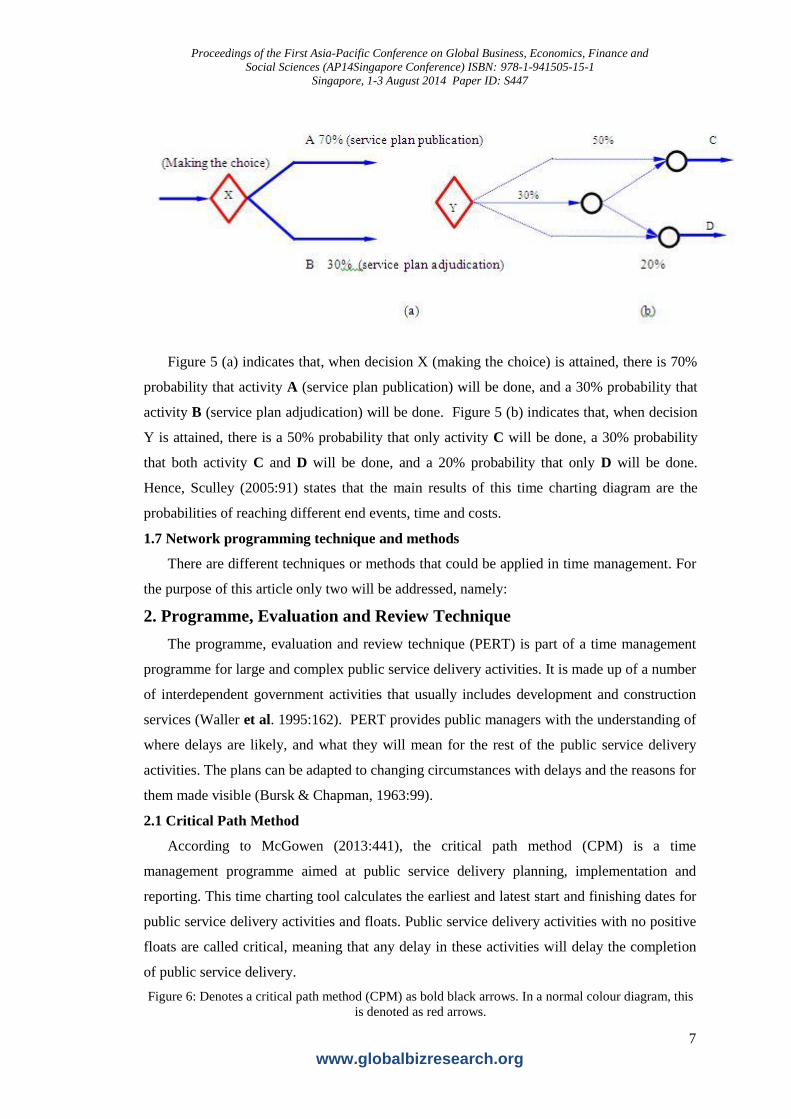
1.6 Probabilistic network diagram
Sculley (2005:90-91) articulates that the time line designer is frequently faced with the
problem: „When this particular public service delivery activity is complete, we will either do
this, or that. “Decision boxes” are developed as a method of time charting that will handle
such a problem when public managers is prepared to say: “There is a probability of 70% that
we will publish the service delivery plan after we made the choice, and a probability of 30%
that we will adjudicate the service deliver plan after we made the choice.” This can be
represented in accordance to figure 5 as (a) and (b).
Figure 5 (a) and (b) indicate probabilistic network diagram
Proceedings of the First Asia-Pacific Conference on Global Business, Economics, Finance and
Social Sciences (AP14Singapore Conference) ISBN: 978-1-941505-15-1
Singapore, 1-3 August 2014 Paper ID: S447
7
www.globalbizresearch.org
Figure 5 (a) indicates that, when decision X (making the choice) is attained, there is 70%
probability that activity A (service plan publication) will be done, and a 30% probability that
activity B (service plan adjudication) will be done. Figure 5 (b) indicates that, when decision
Y is attained, there is a 50% probability that only activity C will be done, a 30% probability
that both activity C and D will be done, and a 20% probability that only D will be done.
Hence, Sculley (2005:91) states that the main results of this time charting diagram are the
probabilities of reaching different end events, time and costs.
1.7 Network programming technique and methods
There are different techniques or methods that could be applied in time management. For
the purpose of this article only two will be addressed, namely:
2. Programme, Evaluation and Review Technique
The programme, evaluation and review technique (PERT) is part of a time management
programme for large and complex public service delivery activities. It is made up of a number
of interdependent government activities that usually includes development and construction
services (Waller et al. 1995:162). PERT provides public managers with the understanding of
where delays are likely, and what they will mean for the rest of the public service delivery
activities. The plans can be adapted to changing circumstances with delays and the reasons for
them made visible (Bursk & Chapman, 1963:99).
2.1 Critical Path Method
According to McGowen (2013:441), the critical path method (CPM) is a time
management programme aimed at public service delivery planning, implementation and
reporting. This time charting tool calculates the earliest and latest start and finishing dates for
public service delivery activities and floats. Public service delivery activities with no positive
floats are called critical, meaning that any delay in these activities will delay the completion
of public service delivery.
Figure 6: Denotes a critical path method (CPM) as bold black arrows. In a normal colour diagram, this
is denoted as red arrows.

Proceedings of the First Asia-Pacific Conference on Global Business, Economics, Finance and
Social Sciences (AP14Singapore Conference) ISBN: 978-1-941505-15-1
Singapore, 1-3 August 2014 Paper ID: S447
8
www.globalbizresearch.org
In the context of figure 6, Turban and Meredith (1991:472) give an example of a critical
path denoted by events 1-2, 2-3, 3-4, 4-9, 9-10, 10-11 as bold black arrows. In colour, the
critical path it is normally denoted in bold red arrows. All of these time line activities have
either zero slack or the same amount of minimum slack allocated to public service delivery
activities in the time management plan.
Wiest et al. (2011:173) argue that, the Critical Path Method shows the interrelationship
between appropriate public service delivery activities and timing that is critical to the total
finishing time. The Critical Path Method is used for charting public services delivery time
lines made up of a number of interdependent activities, where completion dates must be met
punctually. Achievement is made possible with this administrative tool by public managers
ensuring the right public services are delivered on time.
Activities that are critical to service delivery programmes are identified and more
attention paid to these activities. Public resources, in this regard are re-allocated to areas
where needed and which it will have the most effective impact.
2.2 Charting public service deliver plans
Now that public officials have a grasp of the variations of time management, it becomes
essential to familiarize themselves with the application of time line charting, in order to know
how to programme timely and progressive delivery of public services, namely:
3. Public service programme statement and analysis
Battersby (2012:2) states that the first and unavoidable step in charting time lines is to
produce as clear and unambiguous statement of what is to be done and by when. In the case
of service delivery activities, where local government service decisions are to be
implemented, such clear and unambiguous statements would contain tertiary schedules,
agendas, plans, fiscal calendar programmes, timetable and/or dockets for the year that are
linked to secondary and primary objectives of the National and provincial spheres of
government.
Holden and McIlroy (2011:24) advise that whatever local government programmes are
for, for example, meeting basic needs, such as job creation, restitution of land, housing, water
and electricity supply, telecommunications, transportation, provision of clean and healthy

Proceedings of the First Asia-Pacific Conference on Global Business, Economics, Finance and
Social Sciences (AP14Singapore Conference) ISBN: 978-1-941505-15-1
Singapore, 1-3 August 2014 Paper ID: S447
9
www.globalbizresearch.org
environment, nutrition, health care, and social welfare (ANC 1994:7) – an objective must be
defined as well as time and public resource limits established.
These local government programme statements consist of a short and unambiguous
statement of policy, which is often very difficult, but are an essential start in any collective
service delivery processes. Furthermore, each local government service programmes is
analysed under problem statement. This requires municipal managers to investigate and
ultimately formulate a report for undertaking local government service delivery programmes.
Turban and Meredith (1991:465), conclusively state that after municipal managers consulted
with all department heads, a list of all activities is agreed.
Each service delivery activity is clearly defined and responsibility is assigned to a
department head. After some local government programme analysis, planning can proceed
immediately without any intervening steps, while other local government service delivery
programmes need to be converted into programme definitions consisting of a system
specification, performance measures, and objectives. After defining the programme, time line
charting could be initiated, with programme information acquisition and compilation (Pritsker
& Sigal 2010:3).
3.1 Public service programme information collection and analysis
Once public service delivery statements and limits under local government sphere have
been set, local government officials can proceed in collecting in-depth information. Service
programme information constitutes accurate information about public service activities. Thus
public officials must ask themselves (Sanders 2009:34):
What public service objectives have to be achieved?
What must be done to achieve these public service objectives?
When must it be achieved?
Who is going to achieve these objectives?
Where will these objectives be achieved?
What public resources will be necessary?
How must these objectives be achieved to ensure the most effective delivery of services?
All public managers, who are involved in public service delivery, are required to strive
co-operatively toward determining the objectives and collect data pertaining to public service
programmes inclusive of activities to be done. Even consulting outside the public service
organisation confinement can be approached for broader compilation of information
pertaining to service programme (Van Straaten, 1984:173). The researched data can be
quantitative, qualitative or combinations of both quantitative and qualitative information in
nature.

Proceedings of the First Asia-Pacific Conference on Global Business, Economics, Finance and
Social Sciences (AP14Singapore Conference) ISBN: 978-1-941505-15-1
Singapore, 1-3 August 2014 Paper ID: S447
10
www.globalbizresearch.org
An objective may be defined as the desired state of affairs, after which public service are
to be brought about (Kroon, 1995:112). In this regard, public service missions, service
delivery plans, functions, activities and processes suggested by Gildenhuys (1993:435) are
thoroughly broken down into its component parts and explained how this complex interrelated
network of public service delivery activities fit into one another. In addition, Woodgate
(2007:50) suggests the best way of obtaining time line information and at the same time
achieving public management participation is to form Management by Results (MBR) teams
for the purpose of drawing up the time management plan.
Meaning, an interactive mode of constructing public service delivery time lines is
preferable with ideas being sketched on black boards or large sheets of papers. These ideas
will be later turned into precise detailed time line charts by planning staff and offered back to
the public management for approval.
3.2 Data processing
Data processing has been the basic requirement for public officials through which facts
and figures are collected and assigned meanings by act of manipulating data in some way that
is, converting complicated meaningless data into useful knowledge. The data processing in
time management is undertaken in a similar manner as the electronic data processing.
Van Straaten (1984:174) view the collection and processing of data as a “macro-network”
denoting a framework of the objectives of public service delivery that can serve as a
communication medium to be presented to public managers and departmental heads. The
initial time management tool, according to Van Straaten (1984:174), can be disjoined further
into secondary time line charts aimed at achieving the (secondary) objective.
3.3 Charting public network service delivery
Upon determining public service delivery objectives, Van Straaten (1984:73) charges
public managers and heads with the tasks of devising public service strategic time lines and
further advises that the crafting of public time management charts should be chronological,
consecutive and comprehensive in nature in order to guarantee the effective attainment of
service delivery activities. When crafting public network service time lines, public managers,
according to Millers (2010:42) should keep the following principles in mind:
The milestones that indicate a period as in figure. 1 or figure. 6 represent the beginning
and the end of municipal service delivery accomplishment when all other preceding
activities have been achieved.
New public service delivery activities cannot be initiated while preceding activities
have not been accomplished, thus activities should be completed consecutively as
denoted in the network diagram.
The interrelationship between milestones of the network must be clearly indicated.
Proceedings of the First Asia-Pacific Conference on Global Business, Economics, Finance and
Social Sciences (AP14Singapore Conference) ISBN: 978-1-941505-15-1
Singapore, 1-3 August 2014 Paper ID: S447
11
www.globalbizresearch.org
Once a public service activity denoted in a network programming box has been
completed, public managers should proceed to the next activity and not return to the
previous activity.
The duration for completing each activity in a network programming must be indicated
clearly.
3.4 Charting effective service delivery activities
In Morris‟ (1995:67) view, public managers should be aware that there is no conventional
way of constructing a network while Millers (2010:45) also confirms that public managers in
network programming do not have to be conventional but there must be methods.
To construct public service delivery time lines, public managers must start by viewing an
activity as an arrow between two events (boxes). The arrow points in the direction of the time
flow, but its length is not related to the duration of the activity. The number is boxed in front of
the arrow, 1 as shown in figure 6, precedes event and the number that is boxed after the arrow, 2
is the succeeding event (Turban & Meredith, 1991:466).
Derived from the example of public policy-making in figure 2, the activity between event
1 and 2, in figure 6 is labelled a. It can also be labeled 1-2. The construction of a public
service delivery time line starts with event 1, which represents service deliver initiation, the
first activity, a. This will always be the activity that does not require any preceding activity. It
is placed at the left side of the diagram, the event before this activity is marked 1, and the one
after it, is marked 2, which represents agenda-setting (Turban & Meredith, 1991:467).
Activity b; c and d must all be preceded by activity a, whose conclusion is event 2.
Therefore, all of these activities can start only after 2 has occurred as shown in figure 6.
At the end of each activity, a number is assigned to designate the forthcoming event. The
assignment of number 3; 4 and 5 is made as the network programming progress from left to
right. In figure 6, activities c and d can be conducted simultaneously, but none can start until
activity a and b has been completed. Note that activity c was placed above activity d in the
diagram. This was done merely as a matter of convenience for drawing the remaining
diagrams.
The construction of a public service delivery time line, according to Turban and Meredith
(1991:467), continues in the same manner. That is, out of event 4, succeeding municipal
service delivery activities e and f are extended. Out of event 5, the succeeding activities g and
h are also extended, and out of event 6, the succeeding l is drawn. Out of event 7, the
succeeding activity k is drawn, out of event 8, the succeeding activity j is drawn. Out of event
9, the succeeding i is drawn. Out of event 10, the succeeding activity m is drawn and finally
joint to event 11. The diagram grows to the right until all service delivery activities and
events are depicted as a network interface node (Turban & Meredith, 1991:467).
Proceedings of the First Asia-Pacific Conference on Global Business, Economics, Finance and
Social Sciences (AP14Singapore Conference) ISBN: 978-1-941505-15-1
Singapore, 1-3 August 2014 Paper ID: S447
12
www.globalbizresearch.org
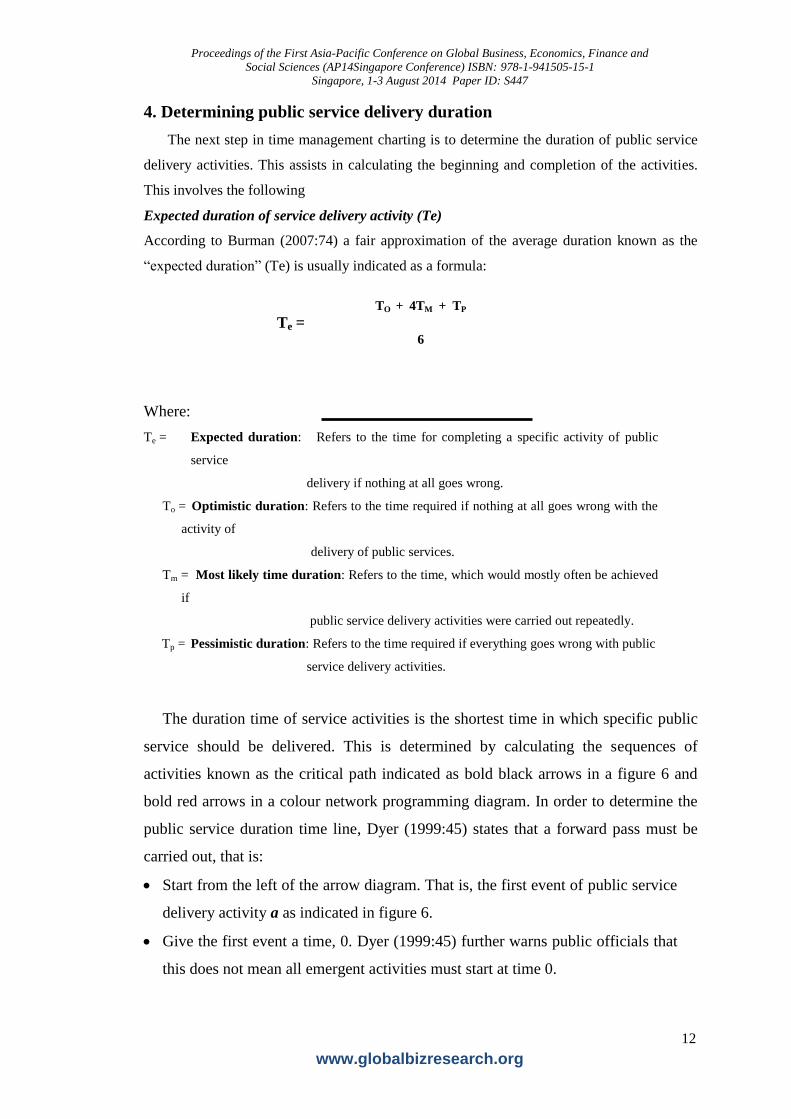
4. Determining public service delivery duration
The next step in time management charting is to determine the duration of public service
delivery activities. This assists in calculating the beginning and completion of the activities.
This involves the following
Expected duration of service delivery activity (Te)
According to Burman (2007:74) a fair approximation of the average duration known as the
“expected duration” (Te) is usually indicated as a formula:
TO + 4TM + TP
Te = 6
Where:
Te = Expected duration: Refers to the time for completing a specific activity of public
service
delivery if nothing at all goes wrong.
To = Optimistic duration: Refers to the time required if nothing at all goes wrong with the
activity of
delivery of public services.
Tm = Most likely time duration: Refers to the time, which would mostly often be achieved
if
public service delivery activities were carried out repeatedly.
Tp = Pessimistic duration: Refers to the time required if everything goes wrong with public
service delivery activities.
The duration time of service activities is the shortest time in which specific public
service should be delivered. This is determined by calculating the sequences of
activities known as the critical path indicated as bold black arrows in a figure 6 and
bold red arrows in a colour network programming diagram. In order to determine the
public service duration time line, Dyer (1999:45) states that a forward pass must be
carried out, that is:
Start from the left of the arrow diagram. That is, the first event of public service
delivery activity a as indicated in figure 6.
Give the first event a time, 0. Dyer (1999:45) further warns public officials that
this does not mean all emergent activities must start at time 0.

Proceedings of the First Asia-Pacific Conference on Global Business, Economics, Finance and
Social Sciences (AP14Singapore Conference) ISBN: 978-1-941505-15-1
Singapore, 1-3 August 2014 Paper ID: S447
13
www.globalbizresearch.org
Proceed in order and calculate the earliest possible time at which the event can
occur.
Public officials must note that if several public service delivery activities lead to an
event, the earliest time is fixed by the longest chain as indicated in figure 6 in bold
black arrows or event 1-2, 2-3, 3-4, 4-8, 8-10, and 10-11. If event 1 is at day 0 and a
duration of 4 days, then event 2 has a duration of 6 days, thus an earliest time of event 1
(4 days) + event 2 (6 days) = 10 days. Event 3 has duration of 8 days, an earliest time of
10 + 8 days = 18 days (activity b). Event 3 has two chains splitting, namely. Event 4
with duration of 4 days, an earliest time of 18 + 4 = 22 days (activity c) and event 5 with
duration of 3 days and an earliest time of 18 + 3 = 21 days (activity d). Event 6 has
duration of 2 days and an earliest time of 21 + 2 = 23 days (activity h). Event 7 has
duration of 1 day and an earliest time of 21 + 1 = 22 days (activity g). Event8 has
duration of 12 days and an earliest time of 22 + 12 = 34 days (activity f). Event 9 has
duration of 4 days and an earliest time of 22 + 4 = 26 days (activity e). Event 10 has
duration of 12 days and an earliest time of 34 + 12 = 46 days (activity j). Finally, event
11 has three activity chains leading into it, namely:
Activity (i): 26 days + 2 days duration time from event 9 to event 11 = earliest time of 28
days.
Activity (m): 46 days + 10 days duration time from event 10 to event 11 = earliest time of 56
days.
Activity (l): 23 days + 2 days duration time from event 6 to event 11 = earliest time of 25
days.
Event 11 determined the earliest time through the longest chain indicated by (m), which
has a combined duration time of 56 days. Hence, the earliest time for event 11 is 25 days.
Latest duration estimation of service delivery
Dyer (1999:47) calculates the latest possible occurrence time for any event in terms of
service delivery by subtracting the final event of a preceding event from a succeeding
event. The formula for this calculation is as follows:
TL = Te (Duration time of succeeding event) - TE (Duration time of preceding vent)
Proceedings of the First Asia-Pacific Conference on Global Business, Economics, Finance and
Social Sciences (AP14Singapore Conference) ISBN: 978-1-941505-15-1
Singapore, 1-3 August 2014 Paper ID: S447
14
www.globalbizresearch.org
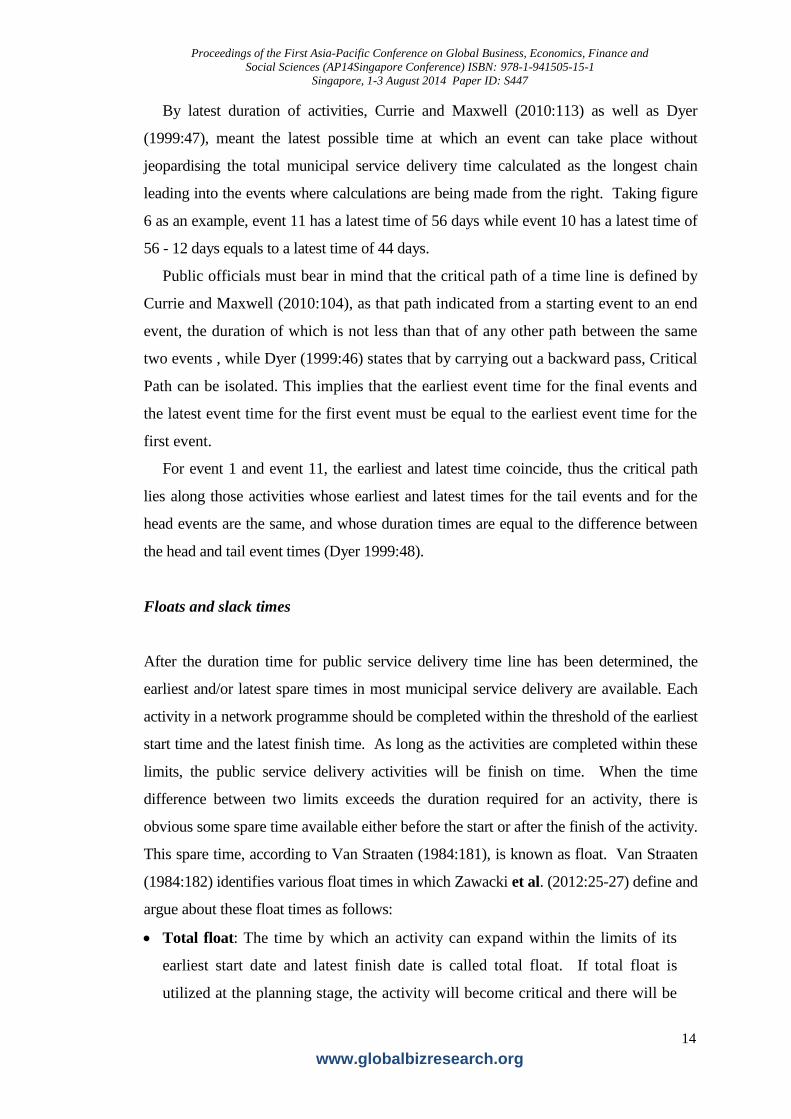
By latest duration of activities, Currie and Maxwell (2010:113) as well as Dyer
(1999:47), meant the latest possible time at which an event can take place without
jeopardising the total municipal service delivery time calculated as the longest chain
leading into the events where calculations are being made from the right. Taking figure
6 as an example, event 11 has a latest time of 56 days while event 10 has a latest time of
56 - 12 days equals to a latest time of 44 days.
Public officials must bear in mind that the critical path of a time line is defined by
Currie and Maxwell (2010:104), as that path indicated from a starting event to an end
event, the duration of which is not less than that of any other path between the same
two events , while Dyer (1999:46) states that by carrying out a backward pass, Critical
Path can be isolated. This implies that the earliest event time for the final events and
the latest event time for the first event must be equal to the earliest event time for the
first event.
For event 1 and event 11, the earliest and latest time coincide, thus the critical path
lies along those activities whose earliest and latest times for the tail events and for the
head events are the same, and whose duration times are equal to the difference between
the head and tail event times (Dyer 1999:48).
Floats and slack times
After the duration time for public service delivery time line has been determined, the
earliest and/or latest spare times in most municipal service delivery are available. Each
activity in a network programme should be completed within the threshold of the earliest
start time and the latest finish time. As long as the activities are completed within these
limits, the public service delivery activities will be finish on time. When the time
difference between two limits exceeds the duration required for an activity, there is
obvious some spare time available either before the start or after the finish of the activity.
This spare time, according to Van Straaten (1984:181), is known as float. Van Straaten
(1984:182) identifies various float times in which Zawacki et al. (2012:25-27) define and
argue about these float times as follows:
Total float: The time by which an activity can expand within the limits of its
earliest start date and latest finish date is called total float. If total float is
utilized at the planning stage, the activity will become critical and there will be
Proceedings of the First Asia-Pacific Conference on Global Business, Economics, Finance and
Social Sciences (AP14Singapore Conference) ISBN: 978-1-941505-15-1
Singapore, 1-3 August 2014 Paper ID: S447
15
www.globalbizresearch.org
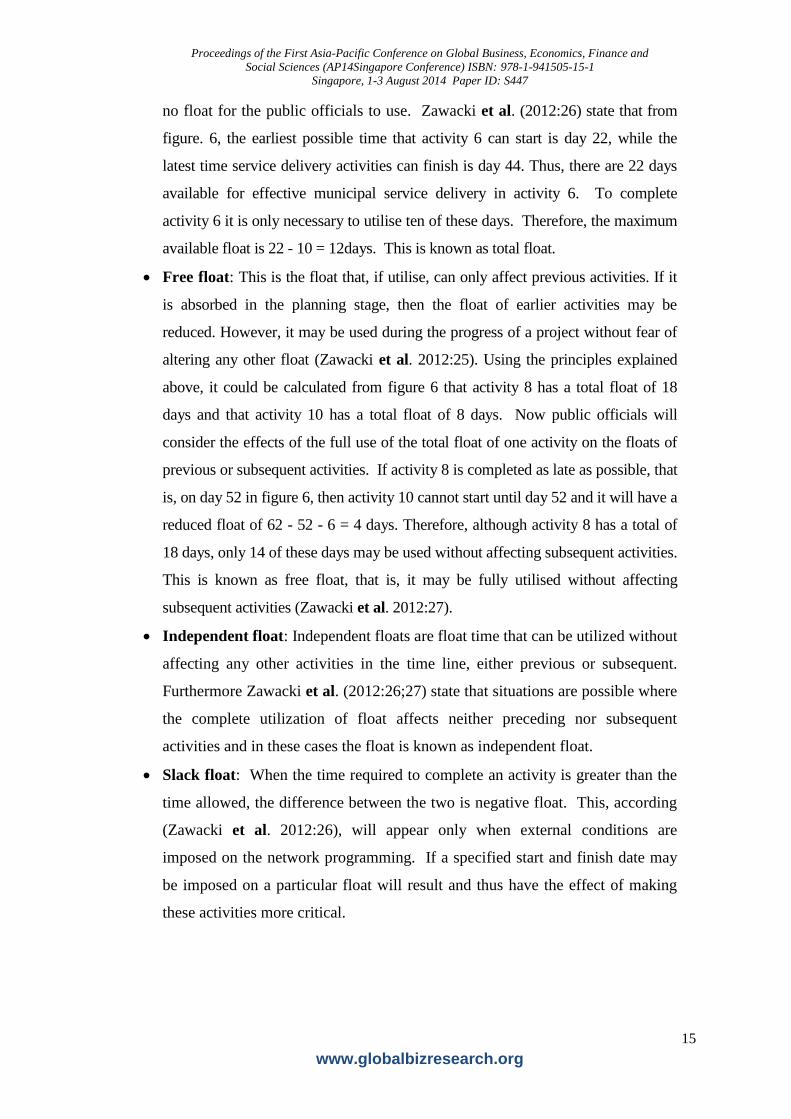
no float for the public officials to use. Zawacki et al. (2012:26) state that from
figure. 6, the earliest possible time that activity 6 can start is day 22, while the
latest time service delivery activities can finish is day 44. Thus, there are 22 days
available for effective municipal service delivery in activity 6. To complete
activity 6 it is only necessary to utilise ten of these days. Therefore, the maximum
available float is 22 - 10 = 12days. This is known as total float.
Free float: This is the float that, if utilise, can only affect previous activities. If it
is absorbed in the planning stage, then the float of earlier activities may be
reduced. However, it may be used during the progress of a project without fear of
altering any other float (Zawacki et al. 2012:25). Using the principles explained
above, it could be calculated from figure 6 that activity 8 has a total float of 18
days and that activity 10 has a total float of 8 days. Now public officials will
consider the effects of the full use of the total float of one activity on the floats of
previous or subsequent activities. If activity 8 is completed as late as possible, that
is, on day 52 in figure 6, then activity 10 cannot start until day 52 and it will have a
reduced float of 62 - 52 - 6 = 4 days. Therefore, although activity 8 has a total of
18 days, only 14 of these days may be used without affecting subsequent activities.
This is known as free float, that is, it may be fully utilised without affecting
subsequent activities (Zawacki et al. 2012:27).
Independent float: Independent floats are float time that can be utilized without
affecting any other activities in the time line, either previous or subsequent.
Furthermore Zawacki et al. (2012:26;27) state that situations are possible where
the complete utilization of float affects neither preceding nor subsequent
activities and in these cases the float is known as independent float.
Slack float: When the time required to complete an activity is greater than the
time allowed, the difference between the two is negative float. This, according
(Zawacki et al. 2012:26), will appear only when external conditions are
imposed on the network programming. If a specified start and finish date may
be imposed on a particular float will result and thus have the effect of making
these activities more critical.
Proceedings of the First Asia-Pacific Conference on Global Business, Economics, Finance and
Social Sciences (AP14Singapore Conference) ISBN: 978-1-941505-15-1
Singapore, 1-3 August 2014 Paper ID: S447
16
www.globalbizresearch.org
Presenting the charted time line for approval
Once the time line charts for service delivery have been completed, it is lawful that
public officials constantly maintain contacts with their superior managers through
detailed reporting and accounting on the progress made for public service delivery.
This will pave the way for obtaining approval. The report process, according to
Cosby (1998:89), should contain:
the network programming activities of public service delivery,
relative costs in public resources and overheads of the charted time line for
delivering service, as well as the envisaged costs improvements,
the cost of involved public service delivery, including the costs of all necessary
public resources needed to produce these goods and services,
Senior management actions required to implement the time line charts.
Before the time line reports and schedules are finally submitted, they must first be
discussed with departmental heads. If the costs of the scheduled public service
delivery are involved, such as the purchase of public resources or if complete
agreement cannot be obtained from everyone concerned, the matter may have to be
decided on by public managers. In this case, O‟Conner (1992:27) maintains that it is
almost certain that public officials responsible for service delivery will be called upon
to justify all public service programme costs.
If capital investment is involved to any extent related to service delivery, public
officials concerned will have to convince doubting participants, often non-technical,
that it will really be justified. Great care must be taken in scheduling and preparing
such public service delivery time lines and estimates, because a failure to live up to
them, may damage both the public service and public officials‟ reputation. If it has
been determined that the report and public service delivery schedule are useful and
ready for implementation, the service delivery activities may proceed on the authority
of the public management echelons (Cosby 1998:89; O‟Conner (1992:27).
Public resources allocation for municipal service delivery
Proceedings of the First Asia-Pacific Conference on Global Business, Economics, Finance and
Social Sciences (AP14Singapore Conference) ISBN: 978-1-941505-15-1
Singapore, 1-3 August 2014 Paper ID: S447
17
www.globalbizresearch.org
Effective implementation of charted time line service delivery activities would require
adequate allocation of public resources. Luvuno (2011:8) identify these public
resources as follows:
Authoritative (legitimate) resources: Authoritative resources would amount to
delegated authority of programme managers to undertake municipal service delivery
activities, where McCleland and King (2011:304) argue that defining legitimate
resources, requires the determination of how much network programming authority
must be delegated? This may amount to the following:
o Formal line authority: This is a programme manager's right to command, act or
direct any delegated public service delivery, based on some enforceable by-laws.
o Staff authority: This can be regarded as the legal authority of public officials to
assist, advice and counsel the formal line officials to whom public officials report,
but do not have the right to command or direct.
o Functional authority: This is a legal right to act with respect to specific public
service activities or processes.
In terms of these authoritative resources, public managers may as well think of
these as organisation parameters. Thus, authoritative resources to public officials
within the public service, responsibility matrix and the public sector service delivery
networks, involves the maxim of “delegatus delegare” where time line schedules are
handed down to subordinates in another service delivery system. Such legitimacy or
delegated authority, according to Roux et al. (1997:95-96), are based on the mandate
or instruction principles of decentralisation and de-concentration of service delivery in
the various public service organizations.

Proceedings of the First Asia-Pacific Conference on Global Business, Economics, Finance and
Social Sciences (AP14Singapore Conference) ISBN: 978-1-941505-15-1
Singapore, 1-3 August 2014 Paper ID: S447
18
www.globalbizresearch.org
Financial resources: Gildenhuys (1993:509-534) identified several budgeting
systems according to which allocation of funds can be undertaken, such as,
performance budgeting, item budgeting, multi-year budget system; zero-based
budgeting systems and single year budgeting systems.
In this regard, Merton (2004:56) regard financial resources as the most
significant means of attaining public service objectives in the sense that, they are
effective tools for public managers where financial resources information such as
cost and sales on buildings, machinery and equipment, labour, raw materials
(natural resources), depreciation, overhead cost, working capital production cost
and expenses sales or benefit enjoyed by the community.
As such, planning programme budget can serve as policy information according
to which decision making, by public managers, in the context of choosing the most
effective, efficient and economic means of realising the community programmes for a
maximum benefit. These financial resources must be defined in order to serve as a
guideline according to which the financial constraints of network programming must
operate or must request a programme budget.
Information resources: To facilitate effective public service decisions on network
programmes, information such as programme background, total resources needed,
performance indicators or measurements/standards reports, project procedures,
schedules, plans, interrelating department networks, must be submitted to the relevant
network programming managers. Hence, Oxenfeldt (2009:7) states that such
information resources must be accurate, timely, comprehensive, validated, reliable,
concise, relevant, mutli-dimensional and aesthetic in nature, to qualify for quality
decision-making by public officials.
Organisational resources: Organisational resources refer to public resources such as
vehicles, machinery, equipment, stationeries, office building and land. To facilitate
the decision making process of municipal mangers on what is needed to accomplish
the pre-determined network programming objectives organisational resources are a
necessity.
Human resources: Although human resources refers to professionals, skilled, semi-
skilled and unskilled human resources, in the context of network programming, these
varieties of person power, in most cases, are supplied by human resources
departments in conjunction with the various departmental human resources managers.
Proceedings of the First Asia-Pacific Conference on Global Business, Economics, Finance and
Social Sciences (AP14Singapore Conference) ISBN: 978-1-941505-15-1
Singapore, 1-3 August 2014 Paper ID: S447
19
www.globalbizresearch.org
The suggestion of Bekker (1996:154) “It is often possible and desirable to utilize
local labor for labor-intensive programme…” clearly defines the pool of human
resources from which municipal officials should make use of when implementing
public service delivery time lines. Bekker (1996:154) cautions public officials to
handle the issue of identifying such human resources from the local pool and insist on
the constant participation of citizens whether it is in the form of complaints, planning
or evaluating statements pertaining to the respective network programming.
Natural resources: Natural resources, in the context of time management, are the
scarcest resources. Such resources consist of minerals, gas, energy, electricity, oil,
chemicals, land, and consumable chef-d'oeuvre (food) water, even time itself and are
made available to humans through nature (Du Toit & Van der Waldt 1997:25).
These natural resources are unique and once lost it cannot be replenished at all.
Therefore, those natural resources required for a specific network programme must be
identified and clearly quantified to ensure that public officials utilise them as
economically as possible. Furthermore, means are devised to control the utilisation of
these resources and elimination of waste as well as preservation measures for future
generations to come.
Implementing municipal service delivery programmes
The first step towards time managed network implementation in any well-managed
public institution is the issuing of an authorisation document. Entitled “Programme or
project authorization” or perhaps “Work order”, this document carries essential data that
define the levels of expenditure authorisation needed for multi-level and sectionalised
departmental and purchasing cost budgets, planned start and finishing dates, details of
the citizen's needs, pricing information, invoicing and delivery instructions (Lock
1993:322).
In terms of the approval phase, this implies that the most important item on a
programme authorisation is the signature of an authorised chief managing directors of a
public programmes at a senior level post. This is the signal that the public service
delivery project has been effectively and efficiently approved and authorised and that
service delivery performance can proceed on a full scale.
Proceedings of the First Asia-Pacific Conference on Global Business, Economics, Finance and
Social Sciences (AP14Singapore Conference) ISBN: 978-1-941505-15-1
Singapore, 1-3 August 2014 Paper ID: S447
20
www.globalbizresearch.org
Controlling, monitoring and evaluating charted public services
At an implementation stage, operational administrators are steered by their supervisors.
The sequential progress of the work performance is monitored in accordance with the
diagrammatic representation of time line chart or network programme. Deviation is
corrected, resources are re-allocated, and delayed time is adjusted to meet the due dates.
Administrators are also enabled to control public resources and the progress of the work
performance undertaken.
Conclusion
Taking note of time, over- and under resourcing of public, and monitoring and
evaluation constrains public organisation are faced with, this article focuses on the
appropriateness, co-ordination, on-time and progressive delivery of the much
anticipated services through the application of time management tool.
Furthermore, this article addresses the variations of and processes of time
management to be applied in public organisation. This includes a discussion on the
process of determining earliest and latest due dates with sufficient lenient time for
effective public service deliveries. To enhance the achievement of approved desired
results, the application of time management tool need to be integrated with various
other administrative tools such as Management-by-Results (MBR).
Time management as an administrative tool emphasises the quantification of public
time and monitoring of progress made. It also emphasises minimal public resources
input for maximum quality goods and services output that are timely and appropriate.
Proceedings of the First Asia-Pacific Conference on Global Business, Economics, Finance and
Social Sciences (AP14Singapore Conference) ISBN: 978-1-941505-15-1
Singapore, 1-3 August 2014 Paper ID: S447
21
www.globalbizresearch.org
References
African National Congress. 1994. The reconstruction and development programme.
Johannesburg: Umanyano.
Battersby, N.L. 2012. Practical approaches to organizational development through
Network Analysis. London: Addison-Wesley.
Bekker, J.C.O. 1996. Citizen participation in local government. Pretoria: J.L. van Schaik.
Bowen, C.J. 2009. Simplifying complex multi-level interfacing network programme.
Oxford: Oxford University Press.
Bursk, M. and Chapman, P.J. 1963. Training and development: moving beyond team myths.
London: Sage.
Cosby, S. 1998. Network analysis: the PERT approach to planning. Chicago: Irwin.
Currie, D.Z. and Maxwell, W. 2010. A glossary of critical path method. Zurich: Postfach
publishing.

Proceedings of the First Asia-Pacific Conference on Global Business, Economics, Finance and
Social Sciences (AP14Singapore Conference) ISBN: 978-1-941505-15-1
Singapore, 1-3 August 2014 Paper ID: S447
22
www.globalbizresearch.org
Du Toit, D.F.P., van der Walt, G., Bayat, M.S. and Cheminais, J. 1998. Public
administration and management for effective governance. Kenwyn: Juta.
Dyer, R. 1999. Time and time slots in the network analysis plan. HarlowEsssex: Longman.
Ford, L.R., Fulkerson, D.R., Hinrichs, J. and Cusumano, M.S. 1962. Flow in networks.
Princeton: Princeton University Press.
Fox, W., Schwella, E. and Wissink, H.F. 1991. Public management. Kenwyn: Juta.
Gildenhuys, J.H.S. 1993. Public financial management. Pretoria: J.L. van Schaik.
Holden, I.R. and McIlroy, P.K. 2011. Network planning in management control systems.
London: Hutchinson Technical Education
Kanter, 2012. Interfacing and intertwining networks: systems analysis in management.
Boston: Houghton Maffin.
Kroon, J. 1995. General management. Bloemfontein: Kagiso.
Lock, D. 1993. Project management: a system approach to planning, scheduling and
controlling. 4th
edition. Aldershot: Gower.
Luvuno, L.L. 2011. Public sector management techniques: the administrative tools for
executive public managers. Saarbrücken: Lambert Academic.
Luvuno, L.L. 1999. Network programming as a decision-making tool for public managers.
Unpublished M.P.A.-script, Department of Public Management. Bloemfontein:
University of the Free state
McCleland, F.E. and King, R.T. 2011. The network analysis and project resources
management. Oxford: Pergamon press.
McGowan, M.F. 2013. Interconnectivity of interfacing nodes. Boston: Houghton Maffin.
Meiring, M.H. and Parson, C.R. 1994. Fundamental public administration: a guide for a
changing South Africa. Port Elizabeth: University of Port Elizabeth.
Merton, U.T. 2004. How to financing for success only. London: Pitman
Millers, W.W. 2010. Strategic planning of activities. New York and London: Praeger.
Morris, L.N. 1995. Variations and models of network analysis. London: Charles Lett.
O'Conner, D.Z. 2011. Practical approach to social network analysis and planning. Zurich:
Postfach.
Oxenfeldt, N.P.(ed.) 2009. The aspects of a qualitative and quantitative data and
information. Santa Monica: Goodyear publisher co.
Plano, P.J. 2010. Managing multi-level organisations with network systems. Oxford:
Clarendon press.
Proceedings of the First Asia-Pacific Conference on Global Business, Economics, Finance and
Social Sciences (AP14Singapore Conference) ISBN: 978-1-941505-15-1
Singapore, 1-3 August 2014 Paper ID: S447
23
www.globalbizresearch.org
Pritsker, A.A.B. and Sigal, C.E. 2010. Management decision-making: A network simulation
approach. London: Prentice-Hall.
Roux, N.L., Brynard, P.A., Bote, P.S. and Fourie, D.J. 1997. Critical issues in public
management and administration in South Africa. Pretoria: Kagiso.
Sanders, D.H. 2009. Computers today. New York: McGraw-Hill.
Sculley, S.P. 2005. Variation of pie charts and network analysis. Chicago: Irwin.
Turbaban, E. and Meredith, J.R. 1991. Fundamentals of management sciences. 5th
ed.
Dallas, Texas: Business Publication.
Van Straaten, F.P. 1984. Administratiewe hulpmiddels vir die programmering van
owerheidsbedrywighede. Pretoria: HAUM.
Waller, J. 2005. TQmanaging. London: Kogan Page.
Waller, J., Allen, D. and Burns, A. 1995. The TQM toolkit: a guide to practical techniques
for total quality management. London: Kogan Page.
Wiest, J.D., Grubbs, F.F., Martino, R.L. and Lach D.C.2011. An analytical study of the
CPM and PERT assumptions. California: Stanford University Press.
Woodgate, H.S. 2007. Planning by network: project planning and control using network
techniques. 3rd
. edition. London: Business Books.
Zawacki,A.N., Martina, B.Z., Karlsons, P.P. and Simon, E. 2012. Advance time
management: Canberra bulletin of Network Analysis. September 2012. 85(4) 423-239