Time Lapsed AVAZ Seismic Modeling Research on CO Storage …journalarticle.ukm.my/11680/1/14 SM46...
10
Time Lapsed AVAZ Seismic Modeling Research on CO 2 Storage Monitoring (Kajian oleh Pemodelan Luputan Masa AVAZ Seismos ke atas CO 2 Pemantauan Simpanan) XUWANG WEI*, YANG YANG & JINFENG MA ABSTRACT CCUS (Carbon Capture, Utilization and Storage) now is a lead way to reduce greenhouse effect such as carbon dioxide emission in the world. This paper presents an integrated overview of seismic monitoring technology when CO 2 injection process. Mainly is time-lapse seismic method .Time-lapse seismic method is a feasible way to monitor CO 2 injection process when CO 2 interaction with minerals, which is proved an effective method in CCUS experiments. AVAZ (Amplitude versus Azimuth) seismic method is proved a useful tool to indentify CO 2 injection process, which can detect fluid-induced seismic anisotropic response and locating where CO 2 flow to in reservoirs, therefore, it’s an effective way to monitor CO 2 flow in CO 2 monitoring process. Since we develop AVAZ modelling experiment base on rock physics theory to modeling the time-lapse AVAZ seismic reservoir response. The research show fluid saturation and pressure behave two main factors influence modeling seismic AVAZ response. Meanwhile the AVAZ response can also be detect by seismic AVAZ data. Keyword: AVAZ modeling; CCUS; rock physics; time lapsed seismic method ABSTRAK CCUS (tawanan karbon, penggunaan dan storan) memimpin jalan untuk mengurangkan kesan rumah hijau seperti pancaran karbon dioksida di dunia. Kajian ini memberi gambaran secara kesuluruhan teknologi pemantauan seismos apabila berlaku proses penyuntikan karbon dioksida berfokus kepada kaedah luputan masa seismos. Kajian luputan masa seismos ialah cara tersaur untuk menjalankan eksperimen ini. AVAZ (Amplitude versus Azimuth) kaedah seismos terbukti sebagai kaedah yang efektif di dalam proses CCUS dan ia dapat mengesan bendalir teraruh oleh respon anisotropi seismos dan melokasikan arus karbon dioksida ke takungan. Pemodelan AVAZ dibina berdasarkan teori fizik batuan untuk kajian pemantauan ini. Kajian menunjukkan ketepuan bendalir dan tekanan ialah dua faktor utama yang mempengaruh pemodelan AVAZ ke atas respon seismos. Kata kunci: Fizik batuan; kajian luputan masa seismos; pemodelan AVAZ Sains Malaysiana 46(11)(2017): 2133-2142 http://dx.doi.org/10.17576/jsm-2017-4611-14 INTRODUCTION GEOLOGIC OVERVIEW Weyburn field is located in southeastern part of Saskatchewan, Canada as a part of Willston Basin (Figure 1). Weyburn field covers over 70 square miles and is one of the largest medium-sour crude oil reservoirs in Canada. Containing approximately 1.4 billion barrels of OOIP (Issaka & Ashraf 2017). It was discovered in 1954 and produced on primary until waterflooding began in 1964. Weyburn Field produced 22° to 35° API oil by primary depletion until 1964. Weyburn Field is divided into two units, the upper Marly zone and lower Vuggy zone (Wegelin 1984). The following production data are from PanCanadian (1997). Because of the fractured nature of the Vuggy zone, it was preferentially swept in the waterflood. Horizontal infill drilling in 1991 to target bypassed oil in Marly. However, only 25% of OOIP has been recovered after 46 years of production. In 2000, a CO 2 injection project began. The CO 2 miscible flood operation is expected to enhance oil recovery for several reasons. First, due to temperature, pressure and oil type, the CO 2 dissoloves into oil and significantly increases the volume of oil. Second the dissolved CO 2 lowers the viscosity of oil and increases its mobility. FIGURE 1. Location of Weyburn oil field (IEA GHG summary report 2004)
-
Upload
truongtuyen -
Category
Documents
-
view
218 -
download
1
Transcript of Time Lapsed AVAZ Seismic Modeling Research on CO Storage …journalarticle.ukm.my/11680/1/14 SM46...
Time Lapsed AVAZ Seismic Modeling Research on CO2 Storage Monitoring(Kajian oleh Pemodelan Luputan Masa AVAZ Seismos ke atas CO2 Pemantauan Simpanan)
Xuwang wei*, Yang Yang & Jinfeng Ma
ABSTRACT
CCUS (Carbon Capture, Utilization and Storage) now is a lead way to reduce greenhouse effect such as carbon dioxide emission in the world. This paper presents an integrated overview of seismic monitoring technology when CO2 injection process. Mainly is time-lapse seismic method .Time-lapse seismic method is a feasible way to monitor CO2 injection process when CO2 interaction with minerals, which is proved an effective method in CCUS experiments. AVAZ (Amplitude versus Azimuth) seismic method is proved a useful tool to indentify CO2 injection process, which can detect fluid-induced seismic anisotropic response and locating where CO2 flow to in reservoirs, therefore, it’s an effective way to monitor CO2 flow in CO2 monitoring process. Since we develop AVAZ modelling experiment base on rock physics theory to modeling the time-lapse AVAZ seismic reservoir response. The research show fluid saturation and pressure behave two main factors influence modeling seismic AVAZ response. Meanwhile the AVAZ response can also be detect by seismic AVAZ data.
Keyword: AVAZ modeling; CCUS; rock physics; time lapsed seismic method
ABSTRAK
CCUS (tawanan karbon, penggunaan dan storan) memimpin jalan untuk mengurangkan kesan rumah hijau seperti pancaran karbon dioksida di dunia. Kajian ini memberi gambaran secara kesuluruhan teknologi pemantauan seismos apabila berlaku proses penyuntikan karbon dioksida berfokus kepada kaedah luputan masa seismos. Kajian luputan masa seismos ialah cara tersaur untuk menjalankan eksperimen ini. AVAZ (Amplitude versus Azimuth) kaedah seismos terbukti sebagai kaedah yang efektif di dalam proses CCUS dan ia dapat mengesan bendalir teraruh oleh respon anisotropi seismos dan melokasikan arus karbon dioksida ke takungan. Pemodelan AVAZ dibina berdasarkan teori fizik batuan untuk kajian pemantauan ini. Kajian menunjukkan ketepuan bendalir dan tekanan ialah dua faktor utama yang mempengaruh pemodelan AVAZ ke atas respon seismos.
Kata kunci: Fizik batuan; kajian luputan masa seismos; pemodelan AVAZ
Sains Malaysiana 46(11)(2017): 2133-2142http://dx.doi.org/10.17576/jsm-2017-4611-14
introduction
GEOLOGIC OVERVIEW
Weyburn field is located in southeastern part of Saskatchewan, Canada as a part of Willston Basin (Figure 1). Weyburn field covers over 70 square miles and is one of the largest medium-sour crude oil reservoirs in Canada. Containing approximately 1.4 billion barrels of OOIP (Issaka & Ashraf 2017). It was discovered in 1954 and produced on primary until waterflooding began in 1964. Weyburn Field produced 22° to 35° API oil by primary depletion until 1964. Weyburn Field is divided into two units, the upper Marly zone and lower Vuggy zone (Wegelin 1984).
The following production data are from PanCanadian (1997). Because of the fractured nature of the Vuggy zone, it was preferentially swept in the waterflood. Horizontal infill drilling in 1991 to target bypassed oil in Marly. However, only 25% of OOIP has been recovered after 46 years of production. In 2000, a CO2 injection project
began. The CO2 miscible flood operation is expected to enhance oil recovery for several reasons. First, due to temperature, pressure and oil type, the CO2 dissoloves into oil and significantly increases the volume of oil. Second the dissolved CO2 lowers the viscosity of oil and increases its mobility.
FIGURE 1. Location of Weyburn oil field (IEA GHG summary report 2004)

21342134
The following reservoir description and data are from PanCanadian (1997). The lower Vuggy zone, is divided into two zone of lithologies. The lower zone of Vuggy is a thinly bedded, slightly argillaceous lime mudstone-wackestone and is interbedded with occasional bioclastic and peloidal packstone. The upper unit of Vuggy is comprised of interbedded peloidal and bioclastic packstones and rare peloidal grainstones. Oolitic grainstones are found near top of unit (Zhao & Chen 2017). Both the upper and lower units of the Vuggy can be divided into two zones of common depositional environment. The sections of lower unit and part of the upper unit that are composed of mudstone and packstone were deposited by a high energy, migrating shoal. Porosity in the Vuggy can be described as intergranular, intragranular and vuggy. Some
FIGURE 2. Stratigraphic column for Weyburn Field. Left side is after Dietrich and Magnusson (1998). Right side is after Wegelin (1984)
TABLE 1. The porosity and permeability and types for each rock formation (Churcher & Edmunds 1994)
Rock unit Marly dolostone Vuggy shoal Vuggy intershoal
Lithology Mudstone, wackstonePackstone
grainstone
Mudstone
packstone
Porosity typemicrosucrosic
some pinpoint vuggy
open vuggy
pinpoint vuggy
intercrystalline
intracrystalline
intercrystalline
pinpoint vuggy
Porosity (%) 20-37 10-21 2-15
Matrix Permeability 0.1-150 1-500 0.01-20
of this porosity is filled by anhydrite cement. Net pay in the Vuggy is 0.1 to18.6 m (6 m in average). The Marly zone, which overlies the Vuggy, is composed of chalky, microcrystalline dolostone and dolomitic limestone. Net pay from 0.1 to 9.8 m (4.3 in average). Descriptions of porosity and permeability of these units are summarized in Table 1.
The Marly is a low permeability, high porosity reservoir, while Vuggy is a high permeability and lower porosity zone. A tight, interbedded evaporitic dolomite and shale sequence overlied the Marly and Vuggy reservoir and forms its top seal. These beds are overlaein by the Midale evaporite. Above the evaprorite is another series of shallowing upward carbonate sequences.

2135
Modeling theorY
ROCK PHYSICS AND ANISOTROPIC FLUIDSUBSTITUTION THEORY
Vp, Vs and density of Marly zone calulated from Brown (2002) that data test from rock physics measurement. Gassmann (1951) proposed a fluid substitution theory on anisotropic medium, represent as follow:
sat dryij ij i jC C Mα α= +
, 1,...6i j =
, (1)
where dryijC represent dry rock elastic stiffness martrix.
3
113
drymn
nm
g
C
Kα == −
∑
*
1 1
g
g
g f
KM
KKK K
ϕ= − − −
.
Gurevich (2003) proposed a fluid substitution theory on porosity and fracture HTI medium, dry rock elastic stiffness martrix represents as follow (Schoenberg & Sayers 1995):
where, 2bM λ µ= + , b
rMλ
= , 1N b
NN b
Z MZ M
∆ =+ , 1
TT
T
ZZµµ
∆ =+ , NZ and TZ is fracture
normal and tangential compliance of HTI medium, where its compent represent as follow:
2/ 0
11 1 116
9Sat NF
g
KLC d LD K L L
µ αθ αϕ
∆ = + −
2/ 0
33 2 14
9Sat NF
g
KLC d LD K L L
µ αθ αϕ
∆ = + −
44SatC µ= , 55 (1 )Sat
TC µ= −∆ ,
where 2L λ µ= + , 2
01 NF
g g
KKDK K L
α φφ ∆
= + − +
, 1 F
g
KK
θ = − , 0 1g
KK
α = − , 2
/0 N
g
KK L
α α= + ∆ ,
143gL K µ= + , 1
23gKλ µ= − , 1 1 Nd = −∆ ,
2
2 21 NdLλ
= − ∆.
Kf of mixed fluid is calculate from Wood‘s equation (1995), Wood‘s equation is
1 gw o
f w o g
SS SK K K K
= + + , (4)
(2)
( )
2
2
(1 ) (1 ) (1 ) 0 0 0(1 ) (1 ) (1 ) 0 0 0(1 ) (1 ) (1 ) 0 0 0
0 0 0 0 00 0 0 0 (1 ) 00 0 0 0 0 (1 )
b N N N
N b N N
N N b Ndryij
T
T
MM r r
r M rC HTI
λ λ
λ λ
λ λ
µ
µ
µ
− ∆ − ∆ − ∆
− ∆ − ∆ − ∆
− ∆ − ∆ − ∆=
− ∆
− ∆
, (3)
where , ,w o gK K K is bulk modulus of water, oil, gas; , ,w o gS S S is saturation of water, oil, gas, add to equal to
Density, bulk modulus, velocity of fluid derive from Baztle and Wang (1992) equation.
AVAZ (AMPLITUDE VERSUS AZIMUTH) MODELING
According to Rϋger (1998) anisotropic P-P reflection coefficient equation, P-P reflection coefficient (Rp) is derive from:
( ) ( )
( ) ( )
2 2
2 2
4 2 2 2 2
1 1 2 2, 2 cos sin2 2
1 cos sin cos sin tan2
VP
V V
Z GR i iZ G
i i
α β βφ δ γ φα α α
α ε φ δ φ φα
∆ ∆ ∆ = + − + ∆ + ∆ +
∆ + ∆ + ∆
, (5)
where i is incident angle,φ is azimut, Z ρα= ,2
G ρβ= , ( )2 11 2α α α= + , 2 1α α α∆ = −
. ( ) ( )( )( )
2 11 2 1 2
V ff
δ ε εδ
ε ε− +
=+ +
, ( )
1 2V εε
ε= −
+, ( )2
0 01 S Pf V V≡ −
, where ( )Vε , ( )Vδ , γ is Thomsen (1986) anisotropic parameters. Formula (2) atau (5) is the fundemental theory of AVAZ.

21362136
RELATIONSHIPS BETWEEN ELASTIC MODULUS AND PRESSURE OF CO2, BRINE, OIL
Brine, oil, CO2 dominated fluids in weyburn oil field, its elastic modulus changes significantly, especially CO2 (Figure 3 to 5), as to large seismic response change, since, the paper must consider pressure changes of different fluids.
Reservoir properties when before inject CO2 and during injecting CO2 (Ma & Morozov 2010). Main reservoir properties according to rock physics testing from a real drilled well before CO2 injection (Brown 2002).
TABLE 2. Reservoir properties before and during CO2 injection (Ma & Morozov 2010)
Parameters Before CO2 injection During injectionTemperature 63°C 56°C (52~58°C)
Oil API gravity 29 (25~34) 29 (25~34)Gas gravity 1.22 1.22CO2 gravity 1.5249 1.5249
Gas/Oil ratio (GOR) 30 L/L 30 L/LSalinity 85,000 ppm NaCl 79,000 ppm NaCl
Water resistivity 0.149 ± 0.023 (ohm m) 0.104 ± 0.014 (ohm m)Oil saturation in Marly zone Average 53% Average 30%Oil saturation in Vuggy zone Average 35% Average 28%
Pore pressure 15 MPa23 MPa near injector8 MPa near producer
Confining pressure 32~33 MPa 32~33 MPaMineral bulk modulus
(Brown 2002)83 GPa (Marly zone)72 GPa (Vuggy zone)
83 GPa (Marly zone)72 GPa (Vuggy zone)
Mineral shear bulk modulus(Brown 2002)
48 GPa (Marly zone)33.5 GPa (Vuggy zone)
48 GPa (Marly zone)33.5 GPa (Vuggy zone)
Mineral bulk modulus of clay(Dvorkin 2007)
21 GPa (Marly zone) 21 GPa (Marly zone)
Mineral shear bulk modulus of clay (Dvorkin 2007)
7 GPa (Marly zone) 7 GPa (Marly zone)
FIGURE 3. Bulk modulus, density, P velocity of CO2 versus pressure changes (Row 1 using Xu’s formula, Row 2 using Batzle-Wang’s formula)
Year 2001, Weyburn oil field investigated reservoir pressure from well data, data shows its range from 12.5 to 18 MPa, 15 MPa in average.
According to Weyburn oil field research report, original salinity of reservoir fluid about to 229,000 ppm, after waterflooding, now salinity of reservoir fluid up to 85,000 ppm, oil API gravity is 29 API, gas/oil ratio (GOR) is 30 L/L.

2137
FIGURE 4. Bulk modulus, density, P velocity of brine versus pressure changes
FIGURE 5. Bulk modulus, density, P velocity of weyburn oil versus pressure changes
TABLE 3. Mixed fluid including CO2, oil, brine, which rock physics parameters versus saturation and pressure changes(calculated from Brown 2002)
Parameter ρ sat α sat β satVδ() γ Vε()
Caprock 2.78 g/cm3 5400 m/s 3375 m/s 0 0 0Model A1 2.32 3943 2300 -0.129 0.138 -0.145Model A2 2.38 3812 2264 -0.132 0.141 -0.149Model A3 2.35 3720 2247 -0.136 0.145 -0.154Model B1 2.33 4115 2382 -0.114 0.120 -0.128Model B2 2.39 3930 2324 -0.117 0.125 -0.133Model B3 2.38 3857 2310 -0.122 0.129 -0.139Model C1 2.41 4224 2458 -0.100 0.108 -0.112Model C2 2.40 4096 2430 -0.106 0.114 -0.117Model C3 2.39 3941 2420 -0.111 0.118 -0.123
TABLE 4. Rock physics parameters that fluid is mixed CO2, oil, brine with saturation changes when pressure is 10 MPa (Model A)
Model parameters
Mixed fluid content Z
Z∆ α
α∆ β
αG
G∆ ( )Vδ∆ γ∆ ( )Vε∆
55% oil mixed 45% Brine(A1) -0.485 -0.311 0.607 -0.882 -0.129 0.138 -0.145
35% oil mixed 35% Brine mixed 30% CO2(A2) -0.493 -0.344 0.612 -0.887 -0.132 0.141 -0.149
20% oil mixed 30% Brine mixed 50% CO2(A3) -0.527 -0.368 0.616 -0.909 -0.136 0.145 -0.154
avaz forward Modeling
ROCKPHYSICS MODEL PARAMETERS
Caprock of Marly which is a evaporate rock overlay Marly, 10-30 m, is a top seal rock. The paper regard as
the caprock as an isotropic medium (Nabil et al. 2016). Marly has a set of fractures with dip from 80-90°, regard as almost vertical fracture (Bunge 2000). Since Marly is as to HTI medium, Rock physics model parameters as follows:

21382138
TABLE 5. Rock physics parameters that fluid is mixed CO2, oil, brine with saturation changes when pressure is 15 MPa (Model B)
Model parameters
Mixed fluid contentZ
Z∆ α
α∆ β
αG
G∆ ( )Vδ∆ γ∆ ( )Vε∆
55% oil mixed 45% Brine(B1) -0.440 -0.270 0.605 -0.821 -0.114 0.120 -0.128
35% oil mixed 35% brine mixed 30% CO2(B2) -0.460 -0.315 0.610 -0.841 -0.117 0.125 -0.133
20% oil mixed 30% brine mixed 50% CO2(B3) -0.482 -0.333 0.614 -0.854 -0.122 0.129 -0.139
TABLE 6. Rock physics parameters that fluid is mixed CO2, oil, brine with saturation changes when pressure is 20 MPa (Model C)
Model parameters
Mixed fluid contentZ
Z∆ α
α∆ β
αG
G∆ ( )Vδ∆ γ∆ ( )Vε∆
55% Oil mixed 45% Brine(C1) -0.383 -0.244 0.606 -0.740 -0.100 0.108 -0.112
35%Oil mixed 35% Brine mixed 30% CO2(C2) -0.417 -0.274 0.611 -0.763 -0.106 0.114 -0.117
20%Oil mixed 30% Brine mixed 50% CO2(C3) -0.457 -0.312 0.620 -0.773 -0.111 0.118 -0.123
avaz Modeling results
The following is P-P reflection coefficient results versus incidence and azimuth with pressure and saturation changes,
FIGURE 6. (Model A1) - P-P reflection coefficient curvesversus incidence and azimuth equal to 0°, 30°, 60°, 90°
before CO2 injection(left)
FIGURE 7. (Model A1) - P-P reflection coefficient mapversus incidence and azimuth before CO2 injection(with pressure = 10 MPa Fluid content is 55% oil
mixed 45% brine (right, same as follows)
FIGURE 8. (Model A2) - P-P reflection coefficient curvesversus incidence and azimuth equal to 0°, 30°, 60°, 90°
when injected 30 % CO2
FIGURE 9. (Model A2) - P-P reflection coefficient mapversus incidence and azimuth when injected 30% CO2
(with pressure = 10 MPa fluid content is 35% oilmixed 35% brine mixed 30% CO2(A2))
2139
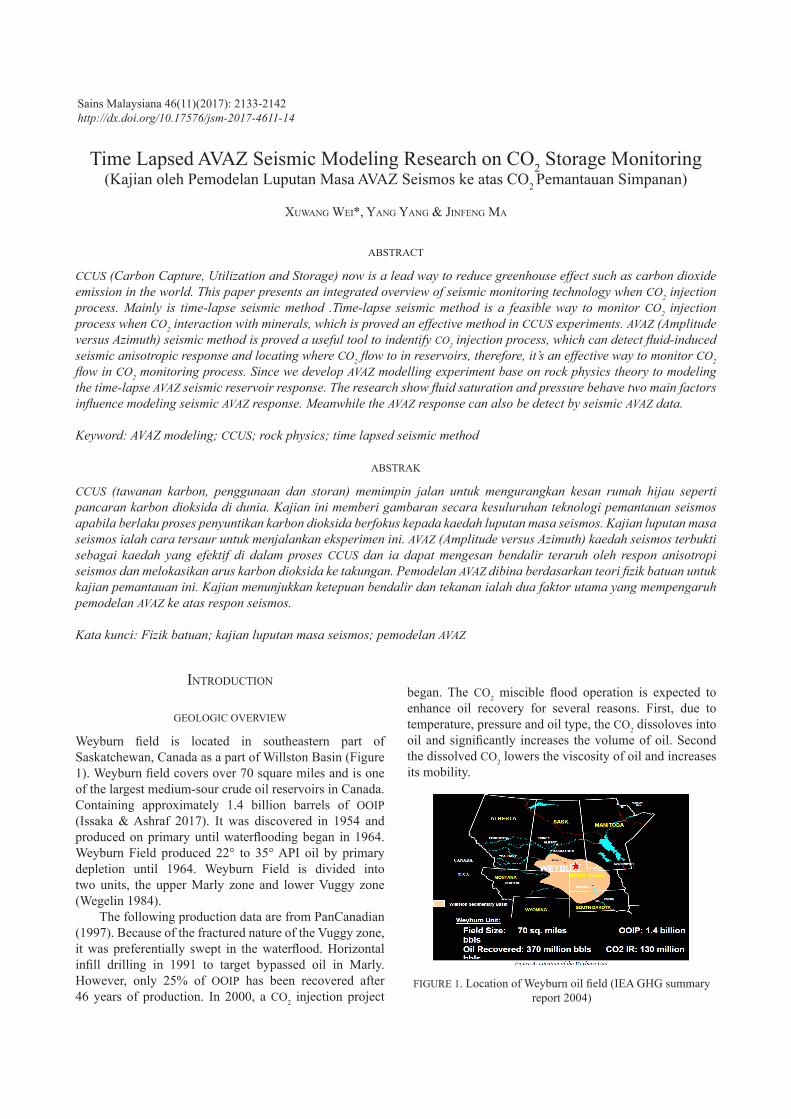
FIGURE 10. (Model A3) - P-P reflection coefficient curves versus incidence and azimuth equal to 0°, 30°, 60°, 90°
when injected 50% CO2
FIGURE 11. (Model A3) - P-P reflection coefficient mapversus incidence and azimuth when injected 50% CO2
(with pressure = 10 MPa fluid content is 20% oilmixed 30% brine mixed 50% CO2)
FIGURE 12. (Model B1) - P-P reflection coefficient curves versus incidence and azimuth equal to 0°, 30°, 60°, 90°
before CO2 injection
FIGURE 13. (Model B1) - P-P reflection coefficient mapversus incidence and azimuth before CO2 injection(with pressure = 15 MPa fluid content is 55% oil
mixed 45% Brine)
FIGURE 14. (Model B2) - P-P reflection coefficientcurves versus incidence and azimuth equal to
0°, 30°, 60°, 90° when injected 30 % CO2
FIGURE 15. (Model B2) - P-P reflection coefficient mapversus incidence and azimuth when injected 30% CO2
(with pressure = 15 MPa fluid content is 35% oil mixed 35%

21402140
brine mixed 30% CO2(A2))
FIGURE 16. (Model B3) - P-P reflection coefficientcurves versus incidence and azimuth equal to
0°, 30°, 60°, 90° when injected 50 % CO2
FIGURE 17. (Model B3) - P-P reflection coefficient mapversus incidence and azimuth when injected 50% CO2
(with pressure = 15 MPa fluid content is 20% oilmixed 30% brine mixed 50% CO2)
FIGURE 18. (Model C1) - P-P reflection coefficientcurves versus incidence and azimuth equal to 0°, 30°, 60°, 90°
before CO2 injectionFIGURE 19. (Model C1) - P-P reflection coefficient map
versus incidence and azimuth before CO2 injection(with pressure = 20 MPa fluid content is 55% oil
mixed 45% brine)
FIGURE 20. (Model C2) - P-P reflection coefficientcurves versus incidence and azimuth equal to
0°, 30°, 60°, 90° when injected 30% CO2;
FIGURE 21. (Model C2) - P-P reflection coefficient map versus incidence and azimuth when injected 30% CO2 (with pressure
= 20 MPa fluid content is 35% oil mixed 35% brine mixed 30%

2141
CO2(A2))
FIGURE 22. (Model C3) - P-P reflection coefficient curves versus incidence and azimuth equal to 0°, 30°, 60°, 90°
when injected 50% CO2
FIGURE 23. (Model C3) - P-P reflection coefficient map versus incidence and azimuth when injected 50% CO2 (with pressure
= 20 MPa fluid content is 20% oil mixed 30% brine mixed 50% CO2)
conclusion
In this work, a theory for modeling reservoir’ s seismic response with AVAZ modeling method is developed and tested within HTI media using in-situ reservoir parameters. The results showed that fluid saturation and pressure behave two main factors influence AVAZ response. Meanwhile the AVAZ response can be detected by seismic AVAZ data.
Therefore, when we inverse AVAZ data to get anisotropic parameters that CO2 injected induced fracture, the factors can be discriminated and we can identify where CO2 flow to. Finally, we monitor CO2 injection process in some degree of CCUS.
REFERENCES
Batzle, M. & Wang, Z. 1992. Seismic properties of pore fluids. Geophysics 57: 1396-1408.
Brown, L.T. 2002. Integration of rock physics and reservoir simulation for the interpretation of time-lapse seismic data at Weyburn field, Saskatchewan, Colorado School of Mines, MSc. Thesis (Unpublished).
Bunge, R. 2000. Midale reservoir fracture characterization using integrated well and seismic data, Weyburn field, Saskatchewan, Canada, Colorado School of Mines, MSc. Thesis (unpublished).
Churcher, P.L. & Edmunds, A.C. 1994 Reservoir characterization and geologic study of weyburn unit, southeastern Saskatchwan. PanCanada Petroleum, Ltd., August, p. 28.
Dietrich, J.R. & Magnusson. D.H. 1998. Basement controls on Phanerozoic development of the Birdstail-Waskada salt dissolution zone, Williston Basin, Southeast Manitoba, 8th Int. Williston Basin. Symp., SGS Special Publication 13: 166-174.
Gassmann, F. 1951. Uber die elastizitat poroser medien: Vierteljahrreschr. Naturforsch. Ges. Zurich 96: 1-21.
Gurevich, B. 2003. Elastic properties of saturated porous rocks with aligned fractures. Journal of Applied Geophysics 54: 203-218.
IEA GHG Weyburn CO2 monitoring & storage project summary report 2000-2004.
Issaka, S. & Ashraf, M.A. 2017. Impact of soil erosion and degradation on water quality: A review. Geology, Ecology, and Landscapes 1(1): 1-11.
Ma, J. & Morozov, I.B. 2010. AVO modeling of pressure-saturation effects in Weyburn CO2 sequestration. The Leading Edge 29(2): 178-183.
Nabil, F.L., Zaidon, A., Anwar, U.M.K., Bakar, E.S., Lee, S.H. & Paridah, M.T. 2016. Impregnation of Sesenduk (Endospermum diadenum) wood with phenol formaldehyde and nanoclay admixture: Effect on fungal decay and termites attack. Sains Malaysiana 45(2): 255-262.
PanCanadian. 1997. Weyburn Unit CO2 Miscible Flood EOR Application, prepared for Saskatchewan Energy and Mines.
Rϋger, A. 1998. Variation of P-wave reflectivity with offset and azimuth in anisotropic media. Geophysics 63(3): 935-947.
Schoenberg, M. & Sayers, C.M. 1995. Seismic anisotropy of fractured rock. Geophysics 60: 204-211.

21422142
Thomsen, L. 1986. Weak elastic anisotropy: Geophysics 51: 1954-1966.
Wegelin, A. 1984. Geology and reservoir properties of Weyburn field, southeastern Saskatchewan. In Oil and Gas in Saskatchewan, edited by Lorsong, J.A. & Wilsons, M.A. Saskatchewan Geological Society Spec. Pub. 7: 71-82.
Whittaker, S.G. & Rostron, B. 2001. Geologic storage of CO2 in a carbonate reservoir within the Williston Basin, Canada: An update. Fifth International Conference on Greenhouse Gas Control Technologies. pp. 385-390.
Zhao, S. & Chen, T. 2017. Design and development of national geographic condition monitoring system based on WebGIS. Geology, Ecology, and Landscapes 1(1): 12-18.
Department of Geology Northwest University Xi’an 710072 China
National & Local Joint Engineering Research Center of Carbon Capture and Storage TechnologyNorthwest UniversityXi’an 710072 China
*Corresponding author; email: [email protected]
Received: 11 January 2017Accepted: 27 May 2017