TIME-LAPSE PHOTOGRAPHY AND IMAGE … · TIME-LAPSE PHOTOGRAPHY AND IMAGE RECOGNITION TO MONITOR...
8
TIME-LAPSE PHOTOGRAPHY AND IMAGE RECOGNITION TO MONITOR OCCUPANT-CONTROLLED SHADE PATTERNS: ANALYSIS AND RESULTS K. Kapsis 1 , W. O’Brien 2 , A.K. Athienitis 1 1 Department of Building, Civil and Environmental Engineering, Concordia University, Montreal, Canada 2 Department of Civil and Environmental Engineering, Carleton University, Ottawa, Canada ABSTRACT This paper presents a high-level overview of a methodology for analysing window shade use in existing buildings. Time-lapse photography is paired with a robust image recognition algorithm to facilitate assessment of shade use and identify any possible trends. The methodology applied on a high- rise building consisting of multiple open plan offices. The analysis showed that the mean shade occlusion and the shade movement rate depend on façade orientation, with the near-south façade having the highest values and the near-north façade having the lowest ones. An average shade use rate of 0.5/day was observed, with the 72% of the shades never adjusted, throughout the period of observation. INTRODUCTION Occupants tend to be inactive shade users with only 40% being readjusted any given day, in one study, with a range of use from daily to never (Inoue et al., 1988). Instead of being highly-responsive to glare conditions, occupants tend to leave their shades in a position that “causes the least trouble”(Bordass et al., 2001). As a result, buildings tend to have much higher mean occlusions than instantaneous weather conditions would suggest. This leads to unnecessary electric lighting use and ultimately inflates energy use relative to what designers might expect. In order to better quantify occupant behaviour with regards to dynamic shading device control, about a dozen researchers have studied their use in real buildings for a duration of days to six years (O’Brien et al., 2013). The ultimate purpose of the researchers ranged from a mere understanding on the key motivators of shade control to establishing a detailed stochastic model based on one or more environmental variables. The studies have generally concluded that solar-related factors (namely glare) are the greatest motivators for shade movement and that indoor temperature has little impact on it. Those without air conditioning do use shades to help control thermal comfort. Occupants with easier access to the shades controls tend to be more active users (Sutter, et al., 2006). Façade orientation and solar penetration depth are among the best predictors of mean shade occlusion. The literature consistently reports that south-facing façades have the greatest mean occlusion and north-facing façades have the least. However, two of the key metrics – mean shade occlusions and shade movement rate – vary considerably between studies and anomalies are commonplace. Many researchers have acknowledged that their results are skewed by unique building characteristics or occupancy patters, including: anidolic reflectors, multiple sets of blinds per space, multiple occupancy, views and privacy, and automated lighting controls, to name a few. Thus, there is a sufficient lack of understanding in manually controlled shade use to justify further and more extensive studies. The objective of this work is to identify and quantify possible triggers and tendencies on manually-controlled shades’ movement and positions, through a revised observational methodology. The long-term objective of this research project is to develop occupant behaviour models for shading controls that can be universally applied to building performance models and advanced shade controls. METHODOLOGY There are three major categories of techniques currently existing to monitor occupant-controlled shade patterns: i) time-lapse photography of the exterior building façade, ii) shades position (electro- mechanical) sensors and iii) building walkthroughs. This paper focuses on time-lapse photography on roller shades; a non-invasive technique that allows large sample sizes to be captured. Researchers (Rea, 1984) have found that image analysis is a very time- consuming process and they often reduce the sample size – either spatial or temporal – to reduce effort. However, if the image processing is automated, it could be a low-cost, efficient process. As initially stated by O’Brien et al. (2010), the technique can be limited mainly by weather conditions (e.g. rain or fog), visual obstructions and veiling reflections on the building façade. The general methodology can be summarized into four major steps: i) time-lapse photography, ii) image pre-processing, iii) image recognition and iv) data analysis. Figure 1 illustrates the major steps. Time-lapse photography A digital camera, with sufficient image resolution (3 megapixels and above, depending on the façade size) captures instantaneous shade positions of an entire building façade. A polarizing filter can be used to minimize veiling reflections. The photographic vantage points should be fixed and be as close as possible to normal to the façade surface, to avoid any image distortion due to photographic angle. In Proceedings of BS2013: 13th Conference of International Building Performance Simulation Association, Chambéry, France, August 26-28 - 3712 -
Transcript of TIME-LAPSE PHOTOGRAPHY AND IMAGE … · TIME-LAPSE PHOTOGRAPHY AND IMAGE RECOGNITION TO MONITOR...
TIME-LAPSE PHOTOGRAPHY AND IMAGE RECOGNITION TO MONITOR OCCUPANT-CONTROLLED SHADE PATTERNS: ANALYSIS AND RESULTS
K. Kapsis1, W. O’Brien2, A.K. Athienitis1
1 Department of Building, Civil and Environmental Engineering, Concordia University, Montreal, Canada 2 Department of Civil and Environmental Engineering, Carleton University, Ottawa, Canada
ABSTRACT
This paper presents a high-level overview of a methodology for analysing window shade use in existing buildings. Time-lapse photography is paired with a robust image recognition algorithm to facilitate assessment of shade use and identify any possible trends. The methodology applied on a high-rise building consisting of multiple open plan offices. The analysis showed that the mean shade occlusion and the shade movement rate depend on façade orientation, with the near-south façade having the highest values and the near-north façade having the lowest ones. An average shade use rate of 0.5/day was observed, with the 72% of the shades never adjusted, throughout the period of observation.
INTRODUCTION Occupants tend to be inactive shade users with only 40% being readjusted any given day, in one study, with a range of use from daily to never (Inoue et al., 1988). Instead of being highly-responsive to glare conditions, occupants tend to leave their shades in a position that “causes the least trouble”(Bordass et al., 2001). As a result, buildings tend to have much higher mean occlusions than instantaneous weather conditions would suggest. This leads to unnecessary electric lighting use and ultimately inflates energy use relative to what designers might expect. In order to better quantify occupant behaviour with regards to dynamic shading device control, about a dozen researchers have studied their use in real buildings for a duration of days to six years (O’Brien et al., 2013). The ultimate purpose of the researchers ranged from a mere understanding on the key motivators of shade control to establishing a detailed stochastic model based on one or more environmental variables. The studies have generally concluded that solar-related factors (namely glare) are the greatest motivators for shade movement and that indoor temperature has little impact on it. Those without air conditioning do use shades to help control thermal comfort. Occupants with easier access to the shades controls tend to be more active users (Sutter, et al., 2006). Façade orientation and solar penetration depth are among the best predictors of mean shade occlusion. The literature consistently reports that south-facing façades have the greatest mean occlusion and north-facing façades have the least. However, two of the key metrics – mean shade occlusions and shade movement rate – vary
considerably between studies and anomalies are commonplace. Many researchers have acknowledged that their results are skewed by unique building characteristics or occupancy patters, including: anidolic reflectors, multiple sets of blinds per space, multiple occupancy, views and privacy, and automated lighting controls, to name a few. Thus, there is a sufficient lack of understanding in manually controlled shade use to justify further and more extensive studies. The objective of this work is to identify and quantify possible triggers and tendencies on manually-controlled shades’ movement and positions, through a revised observational methodology. The long-term objective of this research project is to develop occupant behaviour models for shading controls that can be universally applied to building performance models and advanced shade controls.
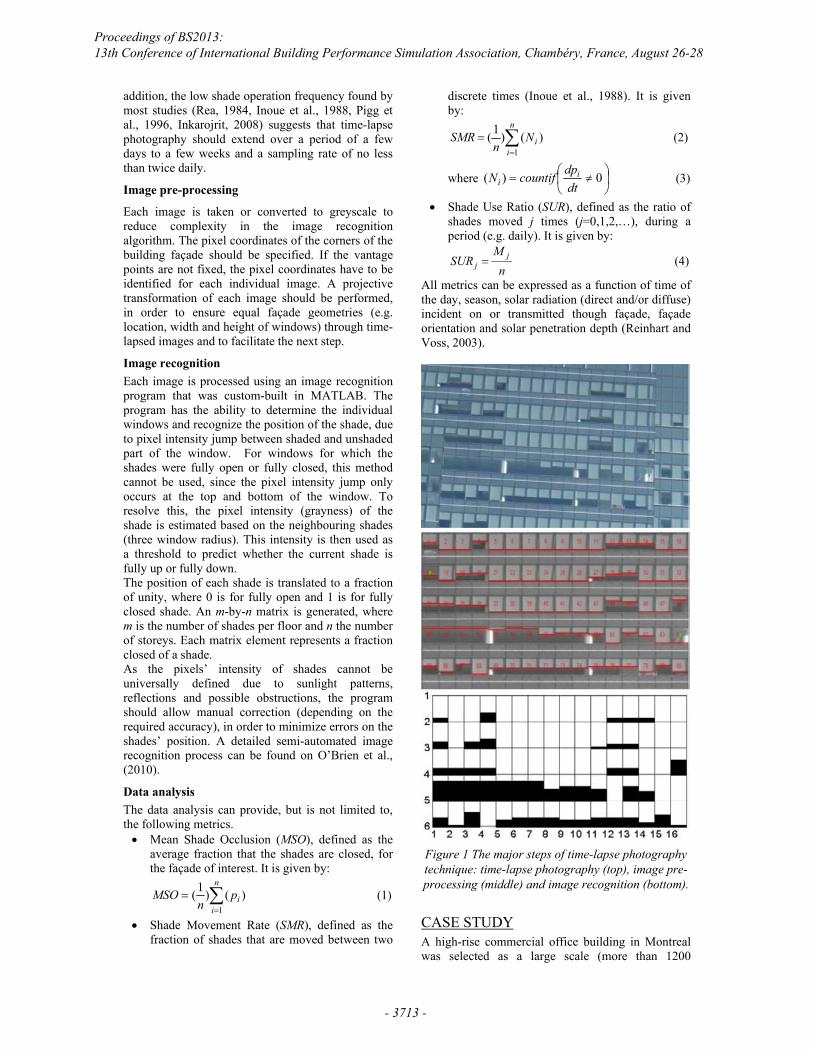
METHODOLOGY There are three major categories of techniques currently existing to monitor occupant-controlled shade patterns: i) time-lapse photography of the exterior building façade, ii) shades position (electro-mechanical) sensors and iii) building walkthroughs. This paper focuses on time-lapse photography on roller shades; a non-invasive technique that allows large sample sizes to be captured. Researchers (Rea, 1984) have found that image analysis is a very time-consuming process and they often reduce the sample size – either spatial or temporal – to reduce effort. However, if the image processing is automated, it could be a low-cost, efficient process. As initially stated by O’Brien et al. (2010), the technique can be limited mainly by weather conditions (e.g. rain or fog), visual obstructions and veiling reflections on the building façade. The general methodology can be summarized into four major steps: i) time-lapse photography, ii) image pre-processing, iii) image recognition and iv) data analysis. Figure 1 illustrates the major steps.
Time-lapse photography A digital camera, with sufficient image resolution (3 megapixels and above, depending on the façade size) captures instantaneous shade positions of an entire building façade. A polarizing filter can be used to minimize veiling reflections. The photographic vantage points should be fixed and be as close as possible to normal to the façade surface, to avoid any image distortion due to photographic angle. In
Proceedings of BS2013: 13th Conference of International Building Performance Simulation Association, Chambéry, France, August 26-28
- 3712 -
addition, the low shade operation frequency found by most studies (Rea, 1984, Inoue et al., 1988, Pigg et al., 1996, Inkarojrit, 2008) suggests that time-lapse photography should extend over a period of a few days to a few weeks and a sampling rate of no less than twice daily.
Image pre-processing
Each image is taken or converted to greyscale to reduce complexity in the image recognition algorithm. The pixel coordinates of the corners of the building façade should be specified. If the vantage points are not fixed, the pixel coordinates have to be identified for each individual image. A projective transformation of each image should be performed, in order to ensure equal façade geometries (e.g. location, width and height of windows) through time-lapsed images and to facilitate the next step.
Image recognition Each image is processed using an image recognition program that was custom-built in MATLAB. The program has the ability to determine the individual windows and recognize the position of the shade, due to pixel intensity jump between shaded and unshaded part of the window. For windows for which the shades were fully open or fully closed, this method cannot be used, since the pixel intensity jump only occurs at the top and bottom of the window. To resolve this, the pixel intensity (grayness) of the shade is estimated based on the neighbouring shades (three window radius). This intensity is then used as a threshold to predict whether the current shade is fully up or fully down. The position of each shade is translated to a fraction of unity, where 0 is for fully open and 1 is for fully closed shade. An m-by-n matrix is generated, where m is the number of shades per floor and n the number of storeys. Each matrix element represents a fraction closed of a shade. As the pixels’ intensity of shades cannot be universally defined due to sunlight patterns, reflections and possible obstructions, the program should allow manual correction (depending on the required accuracy), in order to minimize errors on the shades’ position. A detailed semi-automated image recognition process can be found on O’Brien et al., (2010).
Data analysis The data analysis can provide, but is not limited to, the following metrics. Mean Shade Occlusion (MSO), defined as the
average fraction that the shades are closed, for the façade of interest. It is given by:
n
iip
nMSO
1)()1( (1)
Shade Movement Rate (SMR), defined as the fraction of shades that are moved between two
discrete times (Inoue et al., 1988). It is given by:
n
iiN
nSMR
1)()1( (2)
where
0)(
dtdpcountifN i
i (3)
Shade Use Ratio (SUR), defined as the ratio of shades moved j times (j=0,1,2,…), during a period (e.g. daily). It is given by:
nM
SUR jj (4)
All metrics can be expressed as a function of time of the day, season, solar radiation (direct and/or diffuse) incident on or transmitted though façade, façade orientation and solar penetration depth (Reinhart and Voss, 2003).
Figure 1 The major steps of time-lapse photography technique: time-lapse photography (top), image pre-processing (middle) and image recognition (bottom).
CASE STUDY A high-rise commercial office building in Montreal was selected as a large scale (more than 1200
Proceedings of BS2013: 13th Conference of International Building Performance Simulation Association, Chambéry, France, August 26-28
- 3713 -
windows)towers ofneighboufacades oThe curtaheight ofm height part (estieach stor0.05) aremanuallychain. Each storto windowdepth froOffice cu(with ordistributeclosest toThe wallreflectancwith greyof 0.4-0.5Direct-indused on eand manu
TIME-LIMAGEA time-lathe case A480 wafrom the façade arpoint for
Figure 2façad
Table 1 floors perThe facadbuilding
) case study. f similar heighuring buildingsof interest are iain wall façadf opaque spanof fixed doub
imated visiblerey. Roller she installed ony and individ
rey has severaws with one o
om the façadeubicles of 1.1r without
ed throughouo the façade arls and seperatce of 0.6-0.7) y geometrical 5). direct suspeneach office, coual on-off swit
LAPSE PHOE RECOGNapse photograstudy. A tripo
as used to ca street level. re illustrated othe NE façade
2 Plan view of des of interest
heigh
summarizes r façade oriendes of interestfaçade and t
The buildinht. The buildins and their heiillustrated in Fde (Figure 1) drel on the lo
ble glazed wine transmittanchades (visible
n each windowdually control
al open plan oor more oriente can vary fro1 m, 1.4 m atransparent
ut the officere located 0.7 tions are ligh while the flopatterns (esti
ded fluoresceontrolled by otches.
OTOGRAPNITION aphy techniquod-mounted C
apture the timThe vantage
on Figure 2 (e and so on).
f the building l(bold black lihts are noted.
the number ntation that wet represent onethere were ch
g consists of ng orientationight as well asFigure 2. consists of 0.
ower part, andndow on the upce of 0.5-0.6)e transmittancw, which canlled by a pul
ffices with actations. The ofom 9 m to 18and 1.7 m heseparations)
es. The cubim away.
ht grey (estimoor carpet appmated reflecta
ent luminairesoccupancy sen
PHY AND
ue was appliedCanon PowerS
me-lapsed imae points for e(e.g. “ne” van
location, withnes). Building
of windows ere photogrape third of the thosen in orde
two n, the s the
.8 m d 1.9 pper ), on ce of n be lling
ccess ffice 8 m. eight
are icles
mated pears ance
s are nsors
d on Shot ages, each
ntage
the
g
and phed. total er to
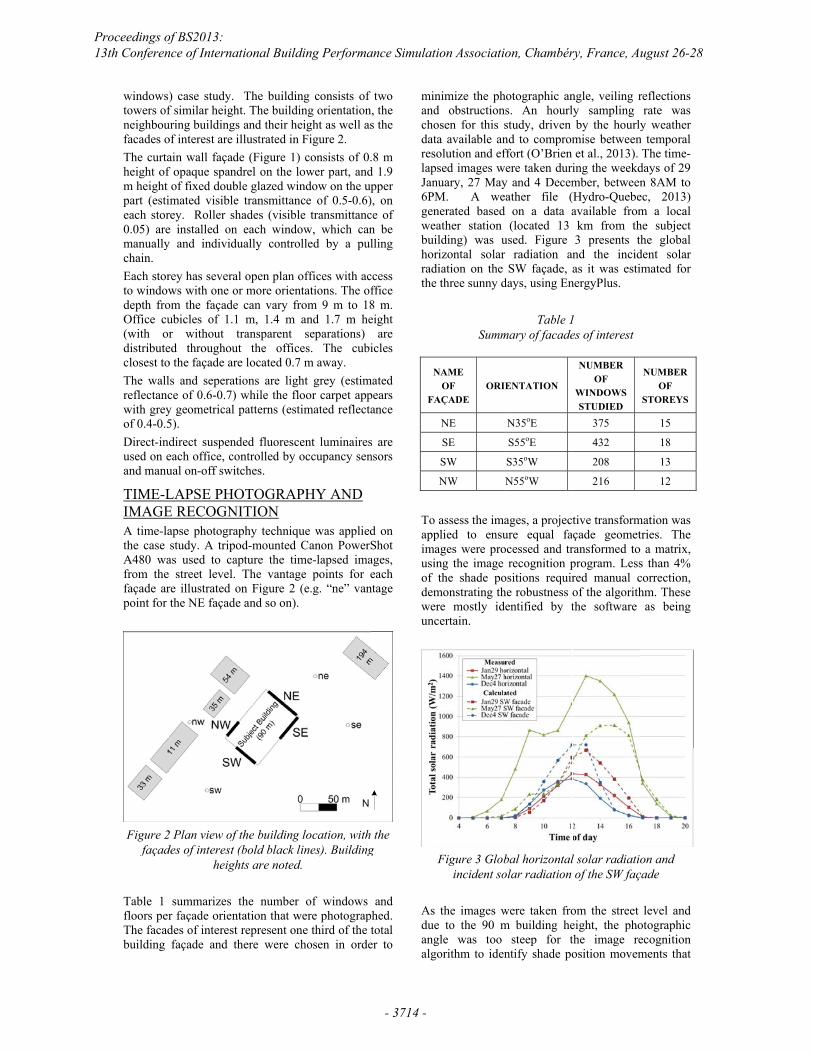
minandchodataresolapsJanu6PMgenweabuilhorradithe
N
FA
To appimausinof tdemwerunc
F
As dueangalgo
nimize the phd obstructionosen for this sa available anolution and efsed images wuary, 27 May
M. A wenerated based ather station lding) was uizontal solar iation on the three sunny d
Summ
NAME OF
AÇADE ORIE
NE
SE
SW
NW N
assess the imaplied to ensuages were prong the image the shade po
monstrating thre mostly idecertain.
Figure 3 Globincident so
the images we to the 90 mgle was too orithm to iden
hotographic ans. An hourlstudy, driven nd to compromffort (O’Brien ere taken duri
y and 4 Decemather file (
on a data a(located 13
used. Figureradiation an
SW façade, adays, using En
Table 1mary of facade
ENTATION
N35oE
S55oE
S35oW
N55oW
ages, a projecture equal faocessed and tr
recognition positions requirhe robustness oentified by t
bal horizontalolar radiation
were taken from building he
steep for tntify shade po
ngle, veiling ry sampling by the hourly
mise betweenet al., 2013).
ing the weekdmber, between(Hydro-Quebeavailable fromkm from th3 presents tnd the incidas it was esti
nergyPlus.
1 es of interest
NUMBER OF
WINDOWS STUDIED
375
432
208
216
tive transformçade geomet
ransformed toprogram. Lessred manual cof the algoriththe software
l solar radiatiof the SW faç
om the street eight, the phothe image reosition movem
reflections rate was
y weather n temporal The time-
days of 29 n 8AM to ec, 2013) m a local he subject the global dent solar imated for
NUMBER OF
STOREYS
15
18
13
12
mation was tries. The
o a matrix, s than 4% correction, hm. These
as being
on and
çade
level and otographic ecognition ments that
Proceedings of BS2013: 13th Conference of International Building Performance Simulation Association, Chambéry, France, August 26-28
- 3714 -
varied lesmovemenconsidereminimal ultimatelythe vantalocations building)Finally, tidentify pshades.
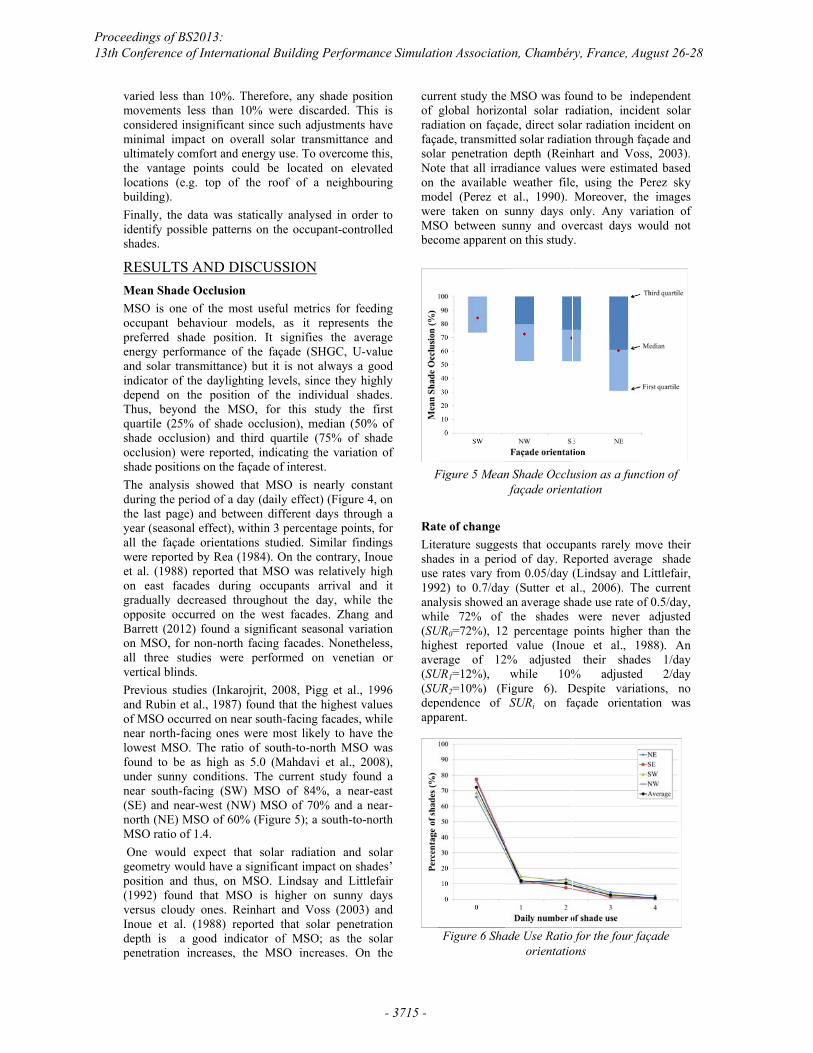
RESULMean ShMSO is occupant preferredenergy pand solarindicator depend oThus, bequartile (shade ococclusionshade posThe analduring ththe last pyear (seaall the fawere repoet al. (19on east graduallyopposite Barrett (2on MSO,all three vertical bPrevious and Rubiof MSO onear nortlowest Mfound to under sunnear sout(SE) and north (NEMSO rati One wogeometryposition (1992) foversus clInoue et depth is penetratio
ss than 10%. nts less than ed insignificanimpact on ov
y comfort andage points c
(e.g. top of. the data was possible patte
LTS AND Dhade Occlusioone of the m
behaviour md shade posit
erformance or transmittancof the daylig
on the positieyond the M(25% of shadcclusion) and n) were reportsitions on the lysis showed
he period of a page) and betsonal effect), açade orientatorted by Rea 988) reported
facades duriy decreased th
occurred on 2012) found a, for non-nort
studies werblinds.
studies (Inkain et al., 1987occurred on nth-facing ones
MSO. The ratibe as high a
nny conditionth-facing (SWnear-west (N
E) MSO of 60io of 1.4. ould expect ty would have and thus, on
found that Mloudy ones. R
al. (1988) r a good ind
on increases,
Therefore, an10% were d
nt since such verall solar t
d energy use. Tcould be locaf the roof of
statically anarns on the oc
DISCUSSIOon
most useful mmodels, as ition. It signiof the façade ce) but it is nghting levels, ion of the in
MSO, for thisde occlusion),
third quartileted, indicatingfaçade of intethat MSO is
day (daily efftween differenwithin 3 perctions studied.(1984). On ththat MSO w
ing occupanthroughout ththe west fac
a significant sth facing facare performed
arojrit, 2008, 7) found that tnear south-facis were most lio of south-toas 5.0 (Mahdns. The curreW) MSO of NW) MSO of 0% (Figure 5)
that solar rada significant iMSO. Linds
SO is higherReinhart and reported that dicator of M
the MSO in
ny shade posidiscarded. Thi
adjustments htransmittance To overcome ated on elevf a neighbou
alysed in ordeccupant-contro
ON
etrics for feeit represents ifies the ave(SHGC, U-vot always a gsince they hi
ndividual shas study the
median (50%e (75% of shg the variatioerest. s nearly consfect) (Figure 4nt days througcentage points Similar find
he contrary, Inas relatively hts arrival an
he day, whilecades. Zhang seasonal variaades. Nonethed on venetian
Pigg et al., 1the highest vaing facades, wlikely to haveo-north MSOdavi et al., 20ent study foun84%, a near-70% and a n
); a south-to-n
diation and simpact on shasay and Littler on sunny dVoss (2003)solar penetraSO; as the sncreases. On
ition is is have and
this, vated uring
er to olled
ding the
erage value good ghly ades. first
% of hade
on of
stant 4, on gh a
s, for dings noue high
nd it the and
ation less, n or
1996 alues while e the was
008), nd a -east near-north
solar ades’ efair days and
ation solar
the
currof radifaçasolaNoton modwerMSbec
F
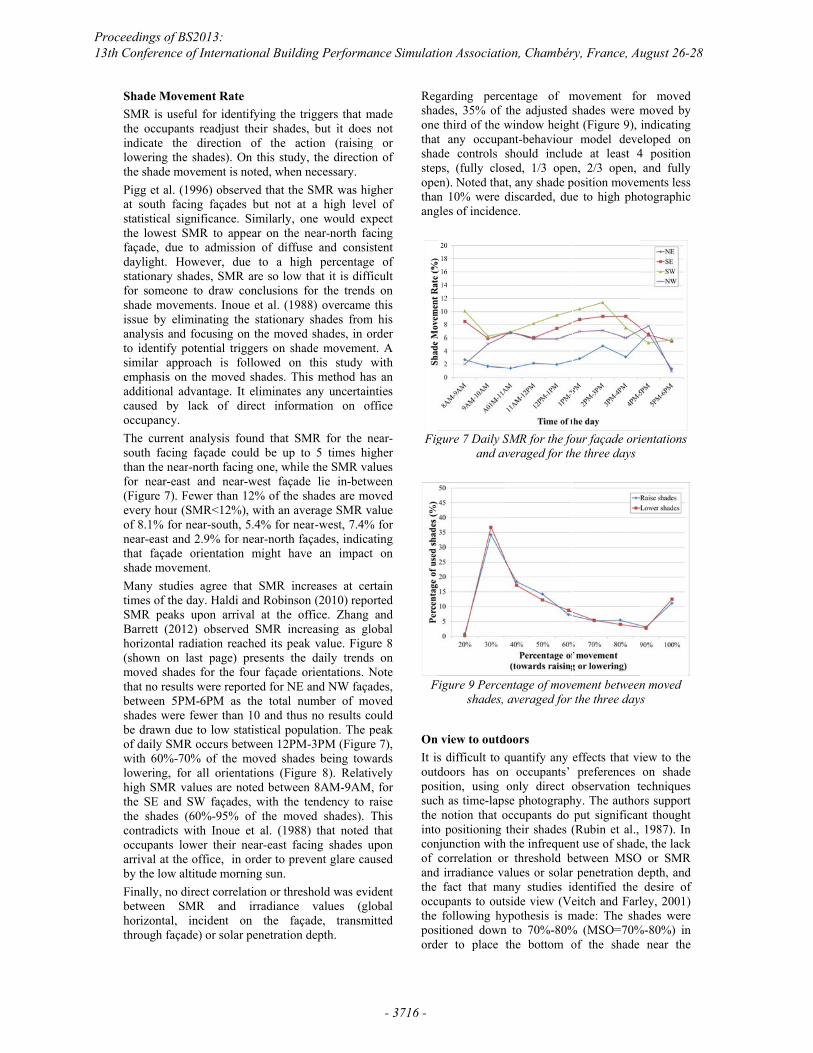
RatLiteshause 199anawhi(SUhighave(SU(SUdepapp
rent study theglobal horizoiation on façaade, transmittear penetrationte that all irrathe availabledel (Perez etre taken on s
SO between scome apparent
Figure 5 Mean
te of changeerature suggesdes in a periorates vary fro
92) to 0.7/dayalysis showed ile 72% of
UR0=72%), 12hest reported
erage of 12UR1=12%), UR2=10%) (Fpendence of parent.
Figure 6 Sha
e MSO was foontal solar raade, direct soled solar radiat
n depth (Reinadiance valuese weather filet al., 1990).sunny days osunny and ovt on this study
n Shade Occlufaçade orien
sts that occupod of day. Reom 0.05/day y (Sutter et aan average shthe shades
2 percentage d value (Ino2% adjusted
while 10%Figure 6). D
SURi on fa
ade Use Ratio orientatio
ound to be indadiation, incidar radiation intion through f
nhart and Vos were estimae, using the PMoreover, th
only. Any vavercast days wy.
usion as a funtation
pants rarely meported avera(Lindsay and al., 2006). Thhade use rate o
were never points higherue et al., 1
their shad% adjusted
Despite variaaçade orienta
for the four faons
dependent dent solar ncident on façade and ss, 2003). ated based Perez sky he images ariation of would not
ction of
move their age shade
Littlefair, he current of 0.5/day,
adjusted r than the 988). An
des 1/day d 2/day ations, no ation was
façade
Proceedings of BS2013: 13th Conference of International Building Performance Simulation Association, Chambéry, France, August 26-28
- 3715 -
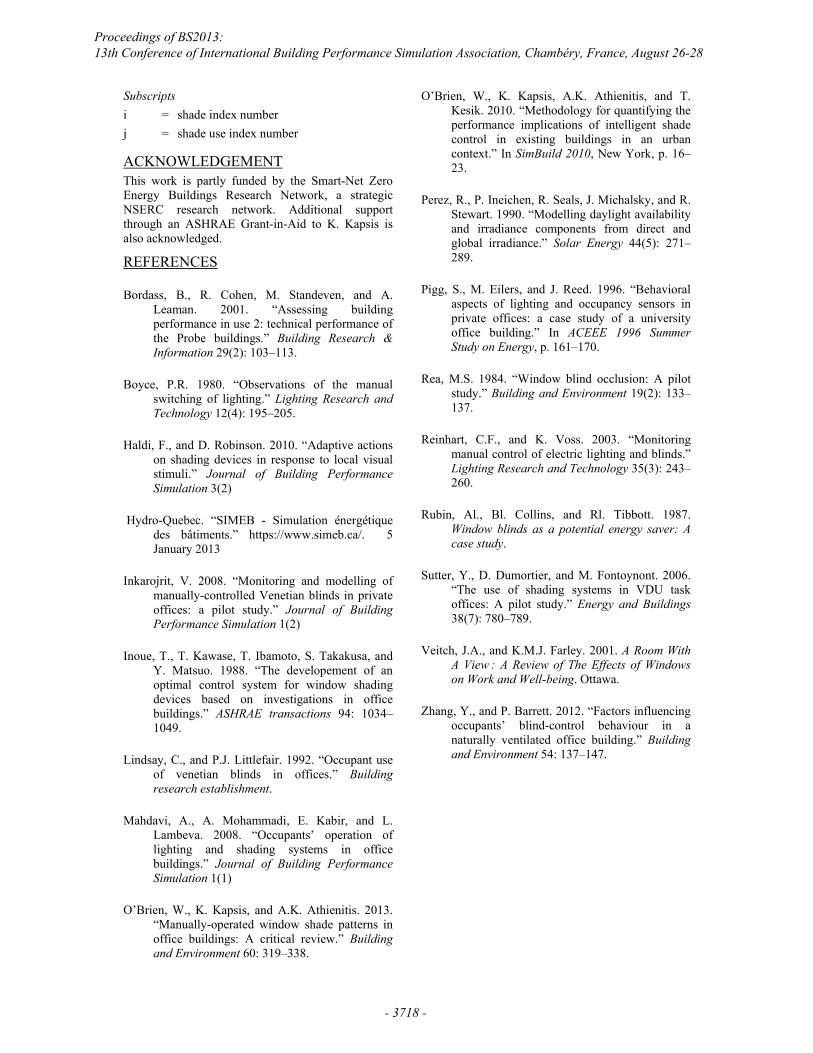
Shade MSMR is uthe occupindicate lowering the shadePigg et alat south statisticalthe lowesfaçade, ddaylight. stationaryfor someshade moissue by analysis ato identifsimilar aemphasisadditionacaused boccupancThe curresouth facthan the nfor near-(Figure 7every houof 8.1% fnear-east that façashade moMany stutimes of tSMR peaBarrett (2horizonta(shown omoved shthat no rebetween shades wbe drawnof daily Swith 60%lowering,high SMRthe SE anthe shadecontradicoccupantarrival at by the lowFinally, nbetween horizontathrough f
Movement Ratuseful for idenpants readjustthe directionthe shades).
e movement isl. (1996) obsefacing façad
l significancest SMR to apdue to admiss
However, dy shades, SMReone to draw ovements. Inoeliminating t
and focusing fy potential trapproach is s on the moveal advantage. by lack of cy. ent analysis fcing façade cnear-north fac-east and nea7). Fewer thanur (SMR<12%for near-southand 2.9% for
ade orientatioovement. udies agree tthe day. Haldiaks upon arr2012) observ
al radiation reon last page)hades for the esults were rep5PM-6PM a
were fewer than due to low sSMR occurs b%-70% of the, for all orienR values are nnd SW façades (60%-95%
cts with Inoues lower their the office, in
w altitude morno direct corre
SMR and al, incident façade) or sola
te ntifying the trt their shadesn of the acOn this study
s noted, when erved that the es but not at. Similarly, oppear on the sion of diffusdue to a higR are so low conclusions
oue et al. (198the stationaryon the moved
riggers on shafollowed on ed shades. ThIt eliminates direct inform
found that SMcould be up tcing one, whilar-west façadn 12% of the s%), with an avh, 5.4% for ner near-north faon might hav
that SMR inci and Robinsoival at the o
ved SMR increached its pea presents thefour façade o
ported for NEs the total n
an 10 and thusstatistical popbetween 12PMe moved shadntations (Figunoted between
des, with the % of the move et al. (1988
near-east facn order to prerning sun.
elation or thresirradiance
on the façar penetration
riggers that ms, but it doesction (raisingy, the directionecessary. SMR was hi
t a high leveone would exnear-north fase and consisgh percentagethat it is difffor the trends88) overcame y shades fromd shades, in oade movemen
this study whis method ha
any uncertainmation on of
MR for the nto 5 times hie the SMR va
de lie in-betwshades are mo
verage SMR vear-west, 7.4%façades, indicave an impact
creases at ceron (2010) repooffice. Zhang reasing as gl
ak value. Figue daily trendsorientations. N and NW faça
number of mos no results culation. The p
M-3PM (Figuredes being towure 8). Relatin 8AM-9AMtendency to r
ved shades). T8) that noted cing shades uevent glare cau
shold was evivalues (gl
çade, transmdepth.
made s not g or on of
gher el of xpect acing stent e of ficult s on this
m his order nt. A with
as an nties ffice
near-gher
alues ween oved value % for ating t on
rtain orted
and lobal ure 8 s on Note ades, oved ould peak e 7),
wards ively , for raise This that
upon used
ident lobal itted
Regshaonethatshastepopethanang
Fig
F
On It isoutdpossuchthe intoconof candthe occthe posord
garding percdes, 35% of
e third of the wt any occupade controls ps, (fully cloen). Noted thatn 10% were d
gles of inciden
gure 7 Daily Sand av
Figure 9 Perceshades,
view to outds difficult to qdoors has on
sition, using h as time-lapsnotion that o
o positioning njunction withcorrelation or
d irradiance vafact that ma
cupants to outfollowing hy
sitioned downer to place
entage of mthe adjusted window heighant-behaviour should includsed, 1/3 opent, any shade pdiscarded, du
nce.
SMR for the foveraged for th
entage of moveaveraged for
doors quantify any n occupants’ only direct ose photographoccupants do their shades (
h the infrequenr threshold balues or solarany studies idside view (Ve
ypothesis is mn to 70%-80%the bottom o
movement foshades were mht (Figure 9), r model devede at least 4n, 2/3 open,
position movemue to high pho
our façade orihe three days
ement betweenthe three day
effects that vipreferences
observation thy. The authoput significan(Rubin et al., nt use of shadebetween MSOr penetration ddentified the eitch and Farl
made: The sha% (MSO=70%of the shade
or moved moved by indicating
eloped on 4 position and fully
ments less otographic
ientations
n moved ys
iew to the on shade
techniques rs support nt thought 1987). In
e, the lack O or SMR depth, and
desire of ley, 2001) ades were
%-80%) in near the
Proceedings of BS2013: 13th Conference of International Building Performance Simulation Association, Chambéry, France, August 26-28
- 3716 -
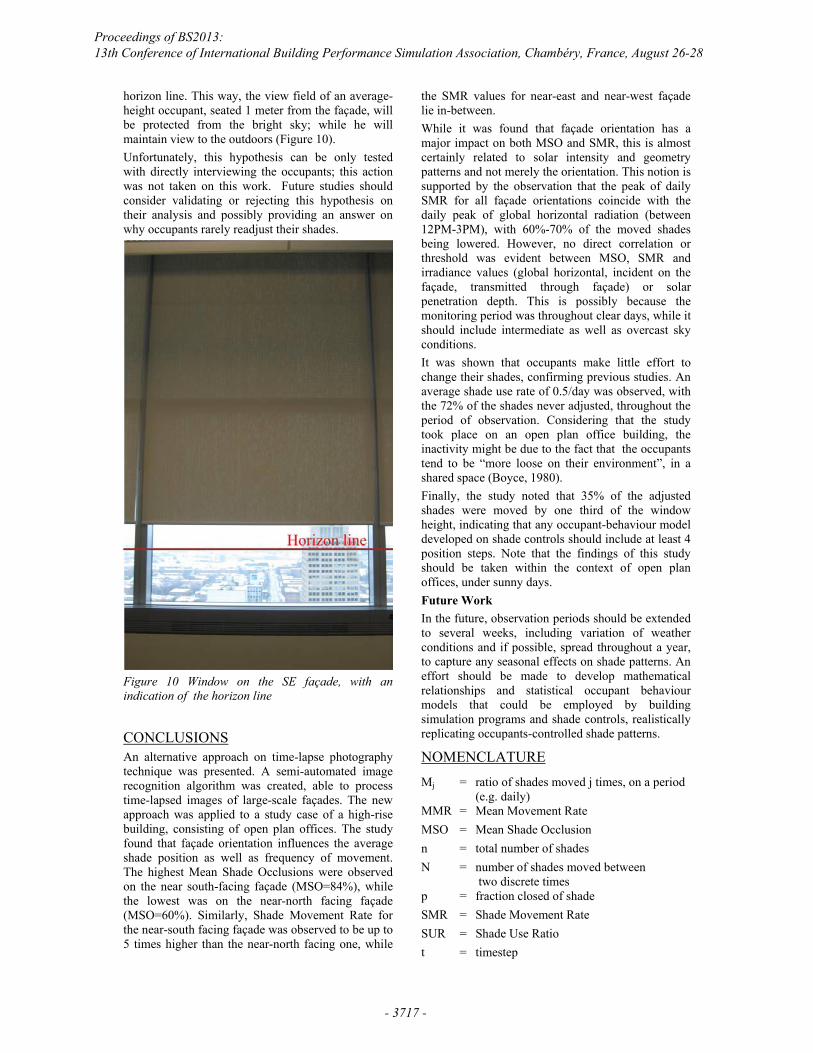
horizon line. This way, the view field of an average-height occupant, seated 1 meter from the façade, will be protected from the bright sky; while he will maintain view to the outdoors (Figure 10). Unfortunately, this hypothesis can be only tested with directly interviewing the occupants; this action was not taken on this work. Future studies should consider validating or rejecting this hypothesis on their analysis and possibly providing an answer on why occupants rarely readjust their shades.
Figure 10 Window on the SE façade, with an indication of the horizon line
CONCLUSIONS An alternative approach on time-lapse photography technique was presented. A semi-automated image recognition algorithm was created, able to process time-lapsed images of large-scale façades. The new approach was applied to a study case of a high-rise building, consisting of open plan offices. The study found that façade orientation influences the average shade position as well as frequency of movement. The highest Mean Shade Occlusions were observed on the near south-facing façade (MSO=84%), while the lowest was on the near-north facing façade (MSO=60%). Similarly, Shade Movement Rate for the near-south facing façade was observed to be up to 5 times higher than the near-north facing one, while
the SMR values for near-east and near-west façade lie in-between. While it was found that façade orientation has a major impact on both MSO and SMR, this is almost certainly related to solar intensity and geometry patterns and not merely the orientation. This notion is supported by the observation that the peak of daily SMR for all façade orientations coincide with the daily peak of global horizontal radiation (between 12PM-3PM), with 60%-70% of the moved shades being lowered. However, no direct correlation or threshold was evident between MSO, SMR and irradiance values (global horizontal, incident on the façade, transmitted through façade) or solar penetration depth. This is possibly because the monitoring period was throughout clear days, while it should include intermediate as well as overcast sky conditions. It was shown that occupants make little effort to change their shades, confirming previous studies. An average shade use rate of 0.5/day was observed, with the 72% of the shades never adjusted, throughout the period of observation. Considering that the study took place on an open plan office building, the inactivity might be due to the fact that the occupants tend to be “more loose on their environment”, in a shared space (Boyce, 1980). Finally, the study noted that 35% of the adjusted shades were moved by one third of the window height, indicating that any occupant-behaviour model developed on shade controls should include at least 4 position steps. Note that the findings of this study should be taken within the context of open plan offices, under sunny days. Future Work In the future, observation periods should be extended to several weeks, including variation of weather conditions and if possible, spread throughout a year, to capture any seasonal effects on shade patterns. An effort should be made to develop mathematical relationships and statistical occupant behaviour models that could be employed by building simulation programs and shade controls, realistically replicating occupants-controlled shade patterns.
NOMENCLATURE
Mj = ratio of shades moved j times, on a period (e.g. daily)
MMR = Mean Movement Rate MSO = Mean Shade Occlusion n = total number of shades N = number of shades moved between
two discrete times p = fraction closed of shade SMR = Shade Movement Rate SUR = Shade Use Ratio t = timestep
Proceedings of BS2013: 13th Conference of International Building Performance Simulation Association, Chambéry, France, August 26-28
- 3717 -
Subscripts i = shade index number j = shade use index number
ACKNOWLEDGEMENT This work is partly funded by the Smart-Net Zero Energy Buildings Research Network, a strategic NSERC research network. Additional support through an ASHRAE Grant-in-Aid to K. Kapsis is also acknowledged.
REFERENCES
Bordass, B., R. Cohen, M. Standeven, and A. Leaman. 2001. “Assessing building performance in use 2: technical performance of the Probe buildings.” Building Research & Information 29(2): 103–113.
Boyce, P.R. 1980. “Observations of the manual switching of lighting.” Lighting Research and Technology 12(4): 195–205.
Haldi, F., and D. Robinson. 2010. “Adaptive actions on shading devices in response to local visual stimuli.” Journal of Building Performance Simulation 3(2)
Hydro-Quebec. “SIMEB - Simulation énergétique des bâtiments.” https://www.simeb.ca/. 5 January 2013
Inkarojrit, V. 2008. “Monitoring and modelling of manually-controlled Venetian blinds in private offices: a pilot study.” Journal of Building Performance Simulation 1(2)
Inoue, T., T. Kawase, T. Ibamoto, S. Takakusa, and Y. Matsuo. 1988. “The developement of an optimal control system for window shading devices based on investigations in office buildings.” ASHRAE transactions 94: 1034–1049.
Lindsay, C., and P.J. Littlefair. 1992. “Occupant use of venetian blinds in offices.” Building research establishment.
Mahdavi, A., A. Mohammadi, E. Kabir, and L. Lambeva. 2008. “Occupants’ operation of lighting and shading systems in office buildings.” Journal of Building Performance Simulation 1(1)
O’Brien, W., K. Kapsis, and A.K. Athienitis. 2013. “Manually-operated window shade patterns in office buildings: A critical review.” Building and Environment 60: 319–338.
O’Brien, W., K. Kapsis, A.K. Athienitis, and T. Kesik. 2010. “Methodology for quantifying the performance implications of intelligent shade control in existing buildings in an urban context.” In SimBuild 2010, New York, p. 16–23.
Perez, R., P. Ineichen, R. Seals, J. Michalsky, and R. Stewart. 1990. “Modelling daylight availability and irradiance components from direct and global irradiance.” Solar Energy 44(5): 271–289.
Pigg, S., M. Eilers, and J. Reed. 1996. “Behavioral aspects of lighting and occupancy sensors in private offices: a case study of a university office building.” In ACEEE 1996 Summer Study on Energy, p. 161–170.
Rea, M.S. 1984. “Window blind occlusion: A pilot study.” Building and Environment 19(2): 133–137.
Reinhart, C.F., and K. Voss. 2003. “Monitoring manual control of electric lighting and blinds.” Lighting Research and Technology 35(3): 243–260.
Rubin, Al., Bl. Collins, and Rl. Tibbott. 1987. Window blinds as a potential energy saver: A case study.
Sutter, Y., D. Dumortier, and M. Fontoynont. 2006. “The use of shading systems in VDU task offices: A pilot study.” Energy and Buildings 38(7): 780–789.
Veitch, J.A., and K.M.J. Farley. 2001. A Room With A Viewࣟ: A Review of The Effects of Windows on Work and Well-being. Ottawa.
Zhang, Y., and P. Barrett. 2012. “Factors influencing occupants’ blind-control behaviour in a naturally ventilated office building.” Building and Environment 54: 137–147.
Proceedings of BS2013: 13th Conference of International Building Performance Simulation Association, Chambéry, France, August 26-28
- 3718 -
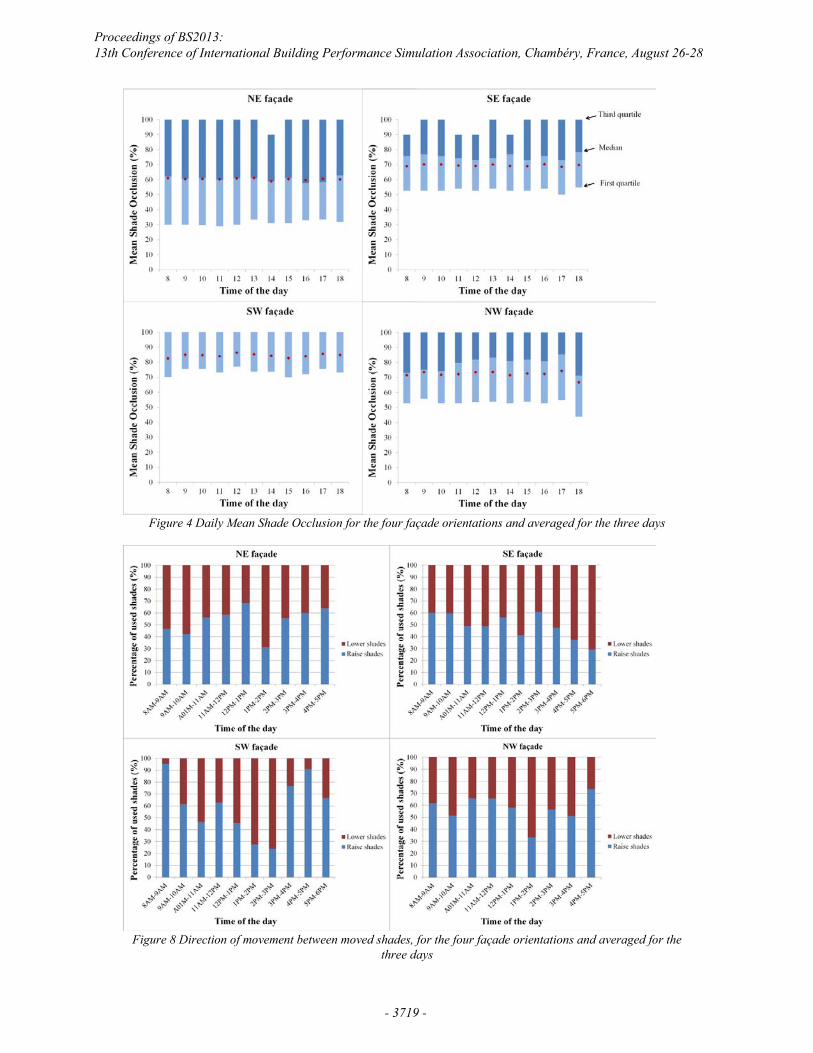
Figure 4 Daily Mean Shade Occlusion for the four façade orientations and averaged for the three days
Figure 8 Direction of movement between moved shades, for the four façade orientations and averaged for the
three days
Proceedings of BS2013: 13th Conference of International Building Performance Simulation Association, Chambéry, France, August 26-28
- 3719 -