Time-Frequency Attenuation of Swell Noise on Seismic Data from Offshore Central Niger-Delta,...
6
IOSR Journal of Applied Geology and Geophysics (IOSR-JAGG) e-ISSN: 2321–0990, p-ISSN: 2321–0982.Volume 3, Issue 5 Ver. I (Sep. - Oct. 2015), PP 30-35 www.iosrjournals.org DOI: 10.9790/0990-03513035 www.iosrjournals.org 30 | Page Time-Frequency Attenuation of Swell Noise on Seismic Data from Offshore Central Niger-Delta, Nigeria. 1 Tamunobereton-ari, I.; 2 Ngeri, A.P. and 3 Amakiri, A.R.C. 1,2,3 Department of Physics, Rivers State University of Science and Technology, Port Harcourt 500001, Nigeria. Abstract: Diversity of noise types with different characteristics makesseparation of signal and noise a challenging process.Swell noiseusually contaminates tracesand it is characterized by high amplitude and low frequencies and affects only a limited band offrequencies.This work presents how FX projection filter (FXEDIT code) processing approach was used to attenuate swell noise on dataset from a marine seismic survey offshoreCentral Niger-Delta, Nigeria, which shows as an effective amplitude preserving and robust tool that gives better results compared to many other conventional filtering algorithms.With this processing approach and working side-by-side with the shot gather and the RMS windows; the results achieved are reliable and satisfactory by giving clearer images for reservoir characterization. The level of swell noise attenuation after this approach greatly increased the confidence to use the data for subsequent processing steps. Keywords: swell noise, streamer, signal, algorithm, attenuation, amplitude, frequency, filter. I. Introduction Seismic data always consist of a signal and a noise component. What is considered as noise is relative and depends on the application of the data. However, any recorded energy which interferes with the desired signal is considered as noise. The noise can be classified as background noise (for instance wind, swell, noise from nearby production, or interference from nearby seismic acquisition), source-generated noise (for instance direct and scattered waves or multiples), and instrument noise and can show up as coherent or incoherent energy in seismic gathers (Landrø, 2008). These noise most times mask the data in such a way that would be impossible for one to understand the geology of the subsurface. Marine seismic data that has been acquired during marginal weather conditions often contains noise caused by sea-surface swell. This noise is impulsive, broad-band and high amplitude with low velocity, and is difficult to remove by conventional filtering or editing techniques. It is possible for the noise to be organized in such a way that it can survive the common midpoint stack. Seismic data processing is to achieve a noise free data for high-quality imaging of the subsurface so as to understand the geology of the subsurface that is of significant importance to the oil and gas sector from an economic point of view. To achieve this, seismic data has to be process using sophisticated processing algorithm to attenuate all types of noise recorded in the data during the acquisition of the data and noise that are cause during processing by not using the right parameter (Gulunay, 2008; Elboth et al, 2010b). Hydrostatic pressure noise Hydrostatic pressure variations relates directly to the height of the water column over the seismic streamer. Such variations are caused by ocean swells and by streamer buckling. The vertical movement w(x; z; t) due to surface waves of a particle, in deep water, at depth z in deep water is approximately given by Kundu (1977) as w(x; z) = A − sin(kx-t) (1) Here A denotes the amplitude of the surface waves, with positive z pointing downwards. The wave-number is = 2 , where is the wave-length, and ω = √gk is the angular frequency, where g denotes gravity. Typical ocean swells have around 50-100m and frequencies well below 1Hz. Such waves cause very large amplitude, low frequency noise on seismic data. In Parrish (2005) it is shown that streamer buckling also can induce low frequencies (≤ 0.1Hz), large amplitude pressure variation noise. Thankfully, the frequency content of hydrostatic pressure variations is limited to 0-1(2)Hz. This frequency band does normally not contain much useful seismic data, and can therefore be removed with a low-cut filter. The second image in Figure 1 shows the result of applying a low-cut filter to the input data. This work is focus on de-noising swell noise, a type of noise seen on marine data. Swell noise is a random, unorganized noise that is caused by waves and turbulence perturbation on the cables of the survey lines. The effect of swell noise is more noticed on a bad weather day. This noise type has high amplitude, it is loud on
-
Upload
iosrjournal -
Category
Documents
-
view
230 -
download
4
description
IOSR Journal of Applied Geology and Geophysics (IOSR-JAGG) volume.3 issue.5 version.1
Transcript of Time-Frequency Attenuation of Swell Noise on Seismic Data from Offshore Central Niger-Delta,...
IOSR Journal of Applied Geology and Geophysics (IOSR-JAGG)
e-ISSN: 2321–0990, p-ISSN: 2321–0982.Volume 3, Issue 5 Ver. I (Sep. - Oct. 2015), PP 30-35
www.iosrjournals.org
DOI: 10.9790/0990-03513035 www.iosrjournals.org 30 | Page
Time-Frequency Attenuation of Swell Noise on Seismic Data from
Offshore Central Niger-Delta, Nigeria.
1Tamunobereton-ari, I.;
2Ngeri, A.P. and
3Amakiri, A.R.C.
1,2,3Department of Physics, Rivers State University of Science and Technology, Port Harcourt 500001, Nigeria.
Abstract: Diversity of noise types with different characteristics makesseparation of signal and noise a
challenging process.Swell noiseusually contaminates tracesand it is characterized by high amplitude and low
frequencies and affects only a limited band offrequencies.This work presents how FX projection filter (FXEDIT
code) processing approach was used to attenuate swell noise on dataset from a marine seismic survey
offshoreCentral Niger-Delta, Nigeria, which shows as an effective amplitude preserving and robust tool that
gives better results compared to many other conventional filtering algorithms.With this processing approach
and working side-by-side with the shot gather and the RMS windows; the results achieved are reliable and
satisfactory by giving clearer images for reservoir characterization. The level of swell noise attenuation after
this approach greatly increased the confidence to use the data for subsequent processing steps.
Keywords: swell noise, streamer, signal, algorithm, attenuation, amplitude, frequency, filter.
I. Introduction Seismic data always consist of a signal and a noise component. What is considered as noise is relative
and depends on the application of the data. However, any recorded energy which interferes with the desired
signal is considered as noise. The noise can be classified as background noise (for instance wind, swell, noise
from nearby production, or interference from nearby seismic acquisition), source-generated noise (for instance
direct and scattered waves or multiples), and instrument noise and can show up as coherent or incoherent energy
in seismic gathers (Landrø, 2008). These noise most times mask the data in such a way that would be impossible
for one to understand the geology of the subsurface. Marine seismic data that has been acquired during marginal
weather conditions often contains noise caused by sea-surface swell. This noise is impulsive, broad-band and
high amplitude with low velocity, and is difficult to remove by conventional filtering or editing techniques. It is
possible for the noise to be organized in such a way that it can survive the common midpoint stack.
Seismic data processing is to achieve a noise free data for high-quality imaging of the subsurface so as
to understand the geology of the subsurface that is of significant importance to the oil and gas sector from an
economic point of view. To achieve this, seismic data has to be process using sophisticated processing algorithm
to attenuate all types of noise recorded in the data during the acquisition of the data and noise that are cause
during processing by not using the right parameter (Gulunay, 2008; Elboth et al, 2010b).
Hydrostatic pressure noise
Hydrostatic pressure variations relates directly to the height of the water column over the seismic
streamer. Such variations are caused by ocean swells and by streamer buckling.
The vertical movement w(x; z; t) due to surface waves of a particle, in deep water, at depth z in deep water is
approximately given by Kundu (1977) as
w(x; z) = A𝜔𝑒−𝑘𝑧sin(kx-𝜔t) (1)
Here A denotes the amplitude of the surface waves, with positive z pointing downwards. The wave-number is
𝑘 =2𝜋
𝜆 , where 𝜆 is the wave-length, and ω = √gk is the angular frequency, where g denotes gravity. Typical
ocean swells have 𝜆 around 50-100m and frequencies well below 1Hz. Such waves cause very large amplitude,
low frequency noise on seismic data. In Parrish (2005) it is shown that streamer buckling also can induce low
frequencies (≤ 0.1Hz), large amplitude pressure variation noise.
Thankfully, the frequency content of hydrostatic pressure variations is limited to 0-1(2)Hz. This frequency band
does normally not contain much useful seismic data, and can therefore be removed with a low-cut filter. The
second image in Figure 1 shows the result of applying a low-cut filter to the input data.
This work is focus on de-noising swell noise, a type of noise seen on marine data. Swell noise is a
random, unorganized noise that is caused by waves and turbulence perturbation on the cables of the survey lines.
The effect of swell noise is more noticed on a bad weather day. This noise type has high amplitude, it is loud on
Time-Frequency Attenuation of Swell Noise on Seismic Data from Offshore Central Niger…
DOI: 10.9790/0990-03513035 www.iosrjournals.org 31 | Page
seismic data, it has low frequency that fall within the range of 2 – 15(20) Hz. The attenuation of swell noise has
posed a major challenge in data processing.
Swell-noise
Swell-noise is high amplitude noise that normally contains frequencies from 2-15(20)Hz. It usually
affects a number of neighboring traces, and can be observed in seismic data as vertical stripes or 'blobs'. There
are two different mechanisms that create swell-noise. On fluid filled streamers, the streamer motion can induce
transversal waves (so-called bulge wave). Bulge waves are known to generate high-amplitude noise up to
around 10Hz. Modern foam filled streamers are less troubled by such bulge waves (Peacock et al,1983; Monty
et al, 2007; Dowling, 1998; and Tamunobereton-ari et al, 2012).
Cross-flow is the second mechanismthat can generate swell-noise, which can be induced by waves or
ocean currents. According to Bull and Dekkers (1993), Heenanand Morrison (2002a,b) and Snarski (2004), flow
characteristics in the turbulent boundary layer surrounding long cylindrical objects like seismic streamers will
change when the local angle between the streamer and the flow direction exceeds 6-15o. Instead of having a
symmetrical turbulent boundary layer, an increased angle will result in an unsymmetrical boundary layer where
vortex shedding can take place. Vortex shedding is an unsteady flow where vortices are created and detached
with a period that depends on the local flow conditions. It is also evident that depth or shallowness of the water
body to the sea-bed strongly influences the swell noise magnitude in the acquisition. This creates strong
alternating pressure fluctuations that will be observed as high-amplitude swell-noise.
II. Materials and Method The diversity of noise types with different characteristics makesseparation of signal and noise a
challenging process. However, efficient noise attenuation and/orremoval is important for high-quality
imaging.Swell-noise cannot be removed by a band-pass filter without also removing large parts of the seismic
reflection signal. Instead, we have found that time-frequency filtering is a well suitedalgorithm.
One of the methods used in attenuating swell noise without affecting the signals is the use of a
projection filter; this is because projection filter allows the signal to be preserved while at the same time
optimizing the attenuation of noise such as swell noise. To achieve this, the data is Fourier transformed into the
FX domain, were the signals are separated from the swell noise, since both swell noise and signals have
different frequencies. Once the data are transformed into the FX domain, the data is divided into time and
spectral gates. Frequency components within the gates are flagged as bad traces if their amplitudes are a user
specified amount greater than the median amplitude of the gate. The frequency components that are flagged are
zeroed and replace with signals constructed by an FX projection filter. We used FXEDIT code in this work to
attenuate the swell noise.
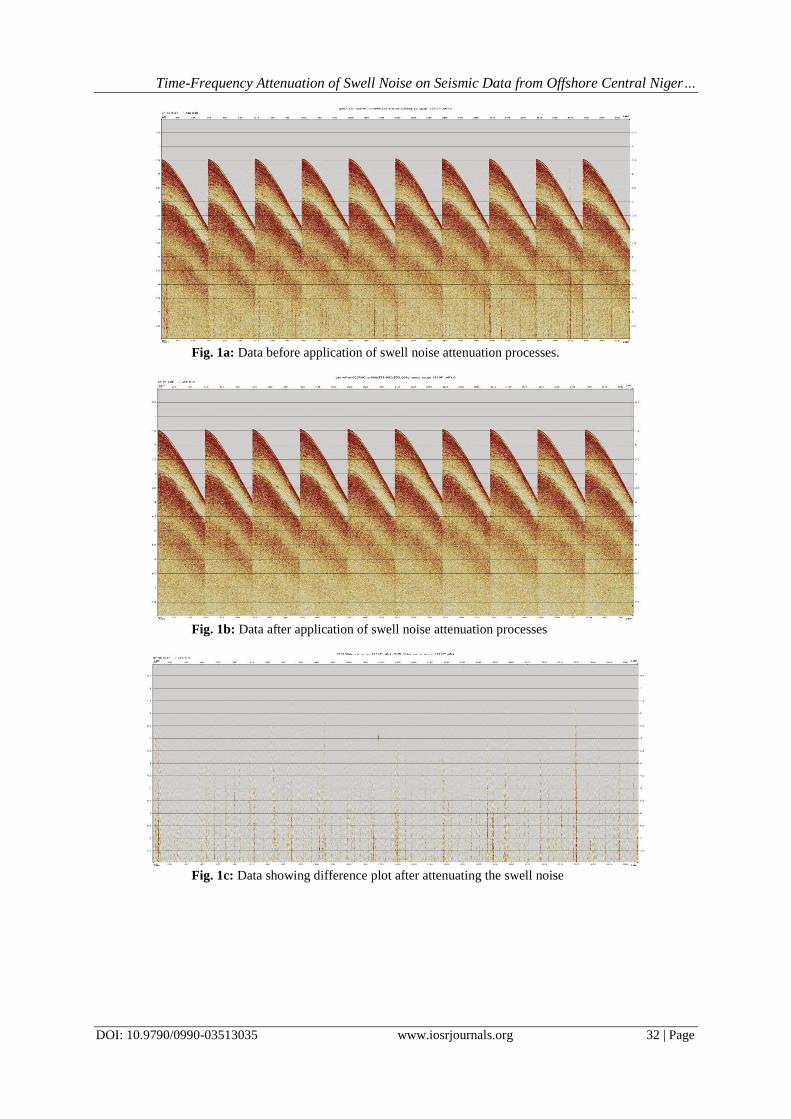
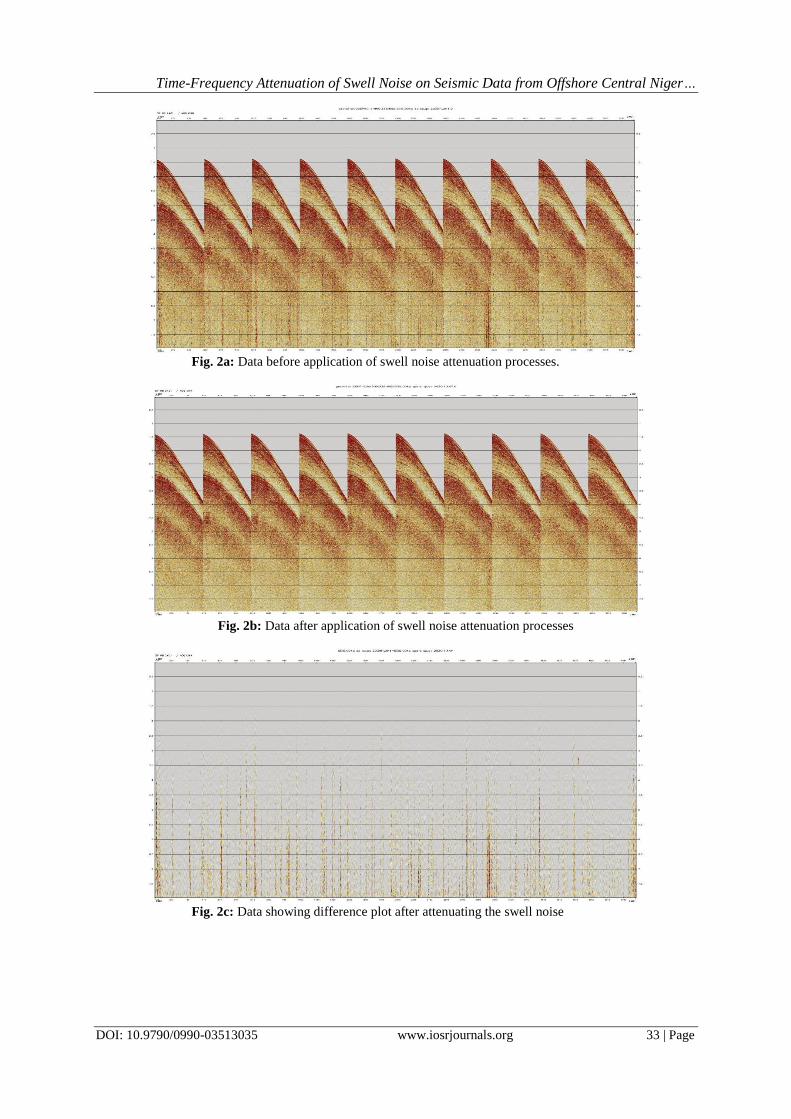
III. Result and Discussions The data used for this work are 3-D shot gathers from the same trace but different sail-lines. Figures 1a
and 2a are the data affected by swell noise before the attenuation processes; containing lots ofseismic(swell)
noise. The noise can be observed as vertical stripes in the data containing highamplitude low frequency
disturbances. Figures 1b and 2b represent the clear data after the attenuation processes; while Figures 1c and 2c
show the difference plot of the shot gathers (before and after attenuation), i.e. the extracted noise from the
attenuation processes.
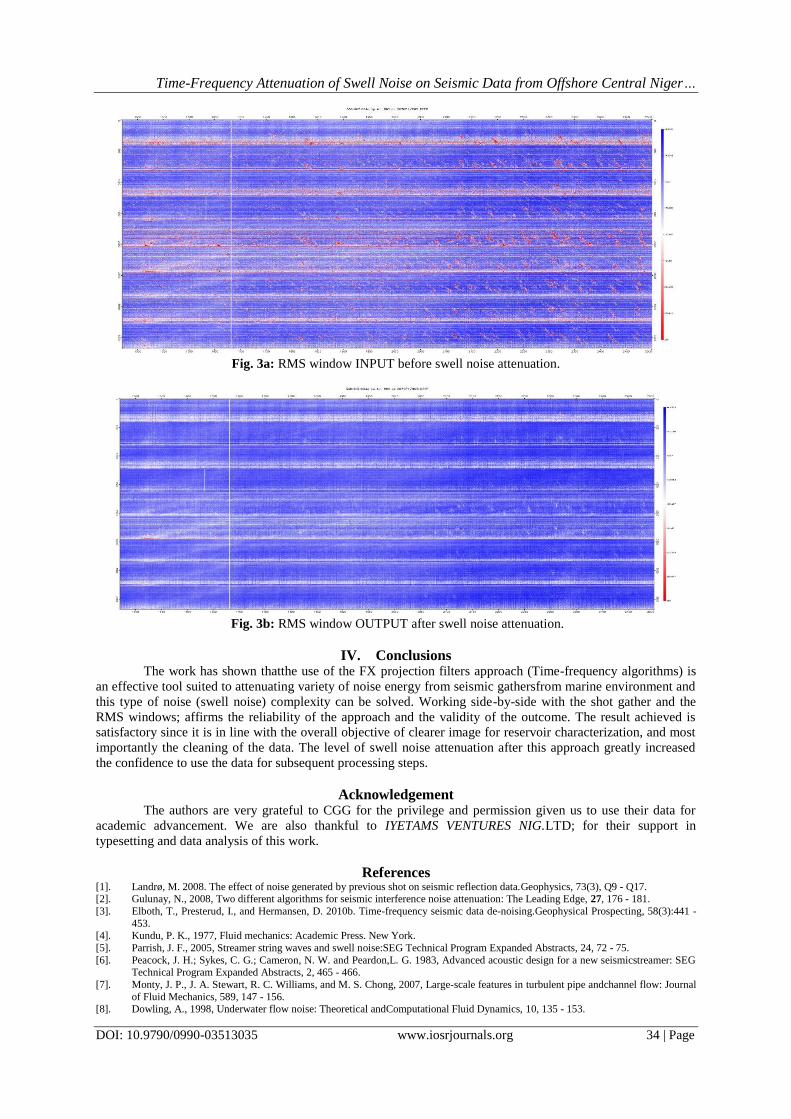
When attenuating swell noise during pre-processing ofmarine seismic data, we QC the data that we
worked with so as to see more details of the distribution of swell noise on the data (it is an essential step in
processing). This was achieved by generating deep amplitude RMS windows; these RMS windows are used to
identify acquisition noise such as swell noise which are very evident as red strands scattered all over the data as
shown by Figure 3a. The importance of generating these RMS windows is that both sail-lines that are affected
and sail-lines that are not affected with swell noise can be easily seen.
The RMS maps also aid us in choosing the right sail-line to perform our test. In testing for swell noise
parameter; noisy line was tested in order to see the effect of the tested parameters on the noisy data, at the same
time to ensure that the tested parameter does not affect our signals,as shown by Figure 3b, attenuation of the
swell noise was effective as we have clear data with the signals been preserved.
Time-Frequency Attenuation of Swell Noise on Seismic Data from Offshore Central Niger…
DOI: 10.9790/0990-03513035 www.iosrjournals.org 32 | Page
Fig. 1a: Data before application of swell noise attenuation processes.
Fig. 1b: Data after application of swell noise attenuation processes
Fig. 1c: Data showing difference plot after attenuating the swell noise
Time-Frequency Attenuation of Swell Noise on Seismic Data from Offshore Central Niger…
DOI: 10.9790/0990-03513035 www.iosrjournals.org 33 | Page
Fig. 2a: Data before application of swell noise attenuation processes.
Fig. 2b: Data after application of swell noise attenuation processes
Fig. 2c: Data showing difference plot after attenuating the swell noise
Time-Frequency Attenuation of Swell Noise on Seismic Data from Offshore Central Niger…
DOI: 10.9790/0990-03513035 www.iosrjournals.org 34 | Page
Fig. 3a: RMS window INPUT before swell noise attenuation.
Fig. 3b: RMS window OUTPUT after swell noise attenuation.
IV. Conclusions The work has shown thatthe use of the FX projection filters approach (Time-frequency algorithms) is
an effective tool suited to attenuating variety of noise energy from seismic gathersfrom marine environment and
this type of noise (swell noise) complexity can be solved. Working side-by-side with the shot gather and the
RMS windows; affirms the reliability of the approach and the validity of the outcome. The result achieved is
satisfactory since it is in line with the overall objective of clearer image for reservoir characterization, and most
importantly the cleaning of the data. The level of swell noise attenuation after this approach greatly increased
the confidence to use the data for subsequent processing steps.
Acknowledgement The authors are very grateful to CGG for the privilege and permission given us to use their data for
academic advancement. We are also thankful to IYETAMS VENTURES NIG.LTD; for their support in
typesetting and data analysis of this work.
References [1]. Landrø, M. 2008. The effect of noise generated by previous shot on seismic reflection data.Geophysics, 73(3), Q9 - Q17. [2]. Gulunay, N., 2008, Two different algorithms for seismic interference noise attenuation: The Leading Edge, 27, 176 - 181.
[3]. Elboth, T., Presterud, I., and Hermansen, D. 2010b. Time-frequency seismic data de-noising.Geophysical Prospecting, 58(3):441 -
453. [4]. Kundu, P. K., 1977, Fluid mechanics: Academic Press. New York.
[5]. Parrish, J. F., 2005, Streamer string waves and swell noise:SEG Technical Program Expanded Abstracts, 24, 72 - 75.
[6]. Peacock, J. H.; Sykes, C. G.; Cameron, N. W. and Peardon,L. G. 1983, Advanced acoustic design for a new seismicstreamer: SEG Technical Program Expanded Abstracts, 2, 465 - 466.
[7]. Monty, J. P., J. A. Stewart, R. C. Williams, and M. S. Chong, 2007, Large-scale features in turbulent pipe andchannel flow: Journal
of Fluid Mechanics, 589, 147 - 156. [8]. Dowling, A., 1998, Underwater flow noise: Theoretical andComputational Fluid Dynamics, 10, 135 - 153.
Time-Frequency Attenuation of Swell Noise on Seismic Data from Offshore Central Niger…
DOI: 10.9790/0990-03513035 www.iosrjournals.org 35 | Page
[9]. Tamunobereton-ari, I.;Omubo-Pepple, V.B. and Briggs-Kamara, M.A. (2012). Dredging for Reclamation of Mangrove Swamp of
Ogu, in Ogu/Bolo Local Government Area of Rivers State, Nigeria: The Impact on Biodiversity and the Environment. Trends in
Advanced Science and Engineering, 3(2), 57 – 63. [10]. Bull, M. K. and Dekkers, W. 1993, Vortex shedding from longslender cylinders in near-axial flow: Physics of Fluids, 5, 3296 -
3298.
[11]. Heenan, A. F. and Morrison, J. F. 2002a, Turbulence boundary layers on axially-inclined cylinders. I. Surfacepressure/Velocity correlations: Experiments in Fluids, 32, 547 - 557.
[12]. Snarski, S., 2004, Flow over yawed circular cylinders: Wall pressure spectra and flow regimes: Physics of Fluids, 16, 344 - 359.