Cost function and market equilibrium : trade-off between ...
Upload
sachin-dhawadCategory
view
28download
0description

7/18/2019 Time Cost Trade Off
http://slidepdf.com/reader/full/time-cost-trade-off-56d69bdbe50a6 1/10
6. Time-Cost Trade-Off analysis
6.1. Introduction
It is common for people to want to shorten project duration. It may be the project is behind scheduleor the scheduled project deadline has been moved forward. By knowing the critical path, the projectmanager and his or her team can use several duration compression techniques to shorten the project
schedule.
Crashing is a technique for making cost and schedule time trade-offs to obtain the greatest amountof time compression for the least incremental cost. This technique is also known as time cost trade-
offs.
Crashing is a process for reducing the duration of critical path activities by allocating moreresources to those activities or by changing their scope. In this case some (or all) of the activitiescan be speeded up (crashed) by increasing the amount of money spent on them.
If the minimum time for an activity is used, the activity is said to be totally crashed . If somewhere
between the normal time and minimum time is used then the activity is said to be partially crashed .
If the relationship between the time spent on an activity and its cost is linear then the problem as towhich activities to partially crash, totally crash or not crash at all can be formulated as one in linear
programming.
The objective is to minimise the total cost of completing the project by the specified date. Ofcourse, if the desired finish date is too short, the problem may be infeasible.
CPM was initially set up to address the time cost trade-off dilemma often presented to projectmanagers, where there is a complex relationship between project time-to-complete and cost-to-
complete.
6.2. Estimating Cost and Duration
Consider the following:
• Rent increases with time.
• Running costs – water, electricity and gas would increase with time.
• If the project’s duration is reduced, employee labour rate will increase if the workers have towork overtime.
• Contract labour on a fixed rate is not affected by time, but their productivity may reduce if theywork long hours.
• Fixed price contracts may not be affected by time.
If you shorten the duration of a project, some costs will reduce (plant hire), while others willincrease (overtime). On large complex projects you need a model like CPM to work out the overalleffect of these types of changes.Accountants, for various reasons, classify costs in two general categories: direst cost also known asvariable cost, and indirect cost, sometimes referred to as fixed cost.
DIRECT COSTS
• Some of the examples of Direct Costs are materials, equipment, labour wages, overtime
premium, subcontractors, freight, sales tax.

7/18/2019 Time Cost Trade Off
http://slidepdf.com/reader/full/time-cost-trade-off-56d69bdbe50a6 2/10
2
• They vary directly with your volume of output.
• They generally increase as the duration of a project is shortened.
INDIRECT COSTS
• Some of the examples of indirect costs are insurance, start-up, security, marketing, goodwill,supervision, overheads, interest charges, contractual penalties, clerical costs.
• They are fixed periodic costs.
• They generally decrease as the duration of a project is shortened.
The Critical Path Method is a deterministic scheduling technique in which each activity has two sets
of times. The first is the normal time that we used in our scheduling so far. The other time is the
crash time, which is the shortest time required to complete an activity. Associated with each time
are the normal coast and the crash cost respectively. Usually we can shorten an activity’s duration
by adding more resources hence the crash cost is higher than the normal cost.
Normal Duration, Normal Cost
Determine the most cost-effective plan for the project. That is the plan you would come up with if
you were going to bid against competitors for the same project or resources (and indeed most
projects are competing, at one level or another).
We should always follow three simple steps.
1. Determine the most cost-effective technical approach. (determine which method will allow you
to complete any given activity while spending the least amount of money)
2. Make an estimate of how long the most cost-efficient method will take to complete. (this is
meant to give you an advantage if you are “bidding” for the work. You must be careful not to
underestimate durations. Engineers, especially those without a lot of experience, are notoriously
optimistic when estimating time, and will often think “effort” rather than “duration.” Ignore any
external special conditions at this point, such as bad weather or sick leave. Assume that things
will go as planned.
3. Selectively adjust your estimate for any activity that is subject to common problems. (If you
know that while pouring concrete you have a 20% chance of rain, you then adjust the duration
of the pour accordingly. If pouring would take 10 days without interruption, then adjust it to 12
days. Likewise, there is a certain probability that, while your software developers are writing
programs, the network will go down at some point. At this stage, you are anticipating common
problems. These are occurrences that do not necessarily require additional resources, but they
7/18/2019 Time Cost Trade Off
http://slidepdf.com/reader/full/time-cost-trade-off-56d69bdbe50a6 3/10
3
will add to the duration of the activity. Be sure to adjust only those activities subject to common
problems. Leave all the other estimates alone.
Now in terms of normal duration, activity crashing is the compression of activity duration beyond
the most efficient combination of resources (normal duration), while maintaining qualityrequirements. Examples are
• using overtime
• doubling up resources, more men on the job!
• lot splitting
• subcontracting portions
• using faster resources, air freight, bigger machines,
Costs of Crashing Activities:
• overtime premium
• subcontractor's profit
• coordination effort
• multiple setups
• more expensive resources
• other...
EXAMPLE 1
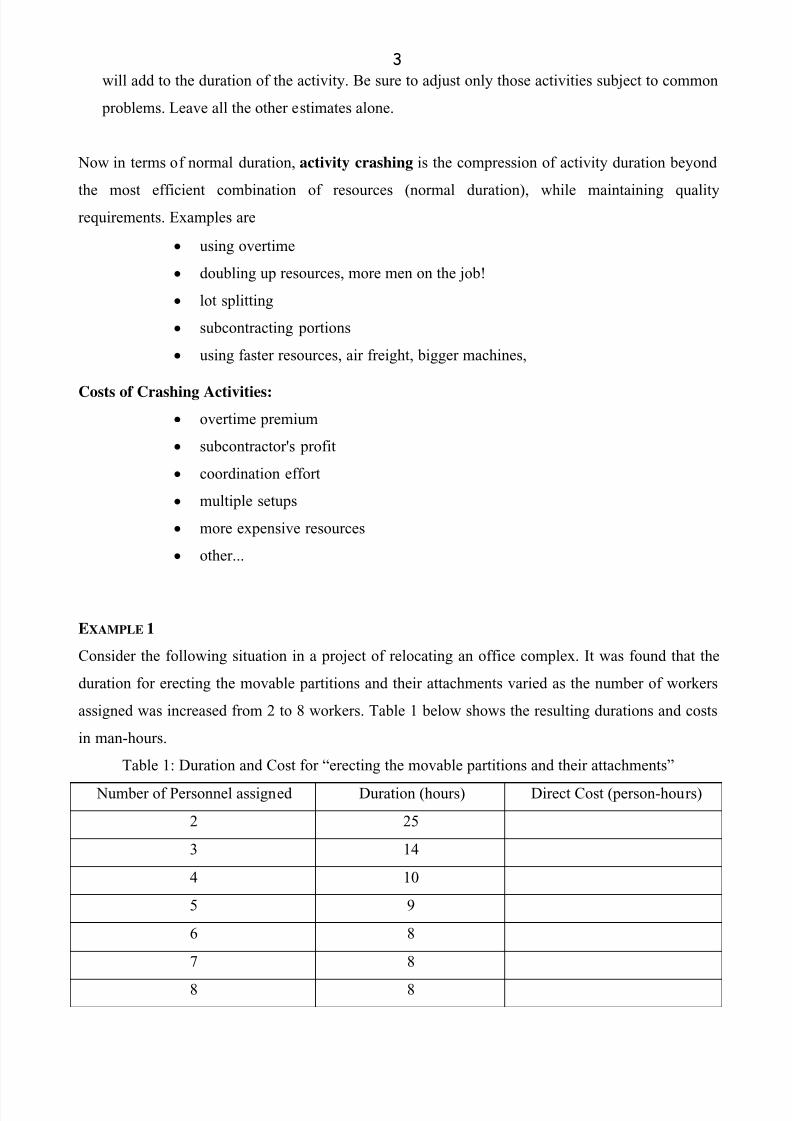
Consider the following situation in a project of relocating an office complex. It was found that the
duration for erecting the movable partitions and their attachments varied as the number of workers
assigned was increased from 2 to 8 workers. Table 1 below shows the resulting durations and costs
in man-hours.
Table 1: Duration and Cost for “erecting the movable partitions and their attachments”
Number of Personnel assigned Duration (hours) Direct Cost (person-hours)
2 25
3 14
4 10
5 9
6 8
7 8
8 8
7/18/2019 Time Cost Trade Off
http://slidepdf.com/reader/full/time-cost-trade-off-56d69bdbe50a6 4/10
4
OPTIMUM DURATION Figure 1: Total cost curve as a function of direct and indirect costs
Unless planned at the Optimum Duration level, further crashing of activities adds to their total cost
(overtime, special shipping, etc), which may defeat the reason you got the bid in the first place:
cost. Crashing activities also adds to your team’s stress level, which increases the chance of failure.
When having to crash activities to meet an external deadline, it is an opportunity to reach for the
Optimum Duration and actually reduce total cost as you reduce duration.
Simulating all the costs will give you the overall effect of time changes on project costs. This
technique can also be used for project acceleration where you need to know the trade-off between
the cost of accelerating a project to meet certain milestones compared with the penalties of failing to
achieve them.
EXAMPLE 2
Suppose you wish to have a ditch dug in your backyard. The high school kid next door will do it in
a five days for $50, or you can hire a ditch-witch for $160 and do it in an afternoon. The indirectcosts associated with keeping the lawn torn up is $10 per day.
(a) Find the normal cost and the normal duration.
(b) Find the fully crashed point
(c) If the kid next door would take a $20 bonus to finish in 3 days determine the new total cost
for hiring him.
(d) Is the new total cost in part (c) an acceptable alternative?
Cost($)
Duration of the project
7/18/2019 Time Cost Trade Off
http://slidepdf.com/reader/full/time-cost-trade-off-56d69bdbe50a6 5/10
5
6.3. Schedule Compression
Two main last resort techniques are known as crashing, which looks at cost-schedule trade-offs, and
fast tracking, which looks at the possibility of performing activities in parallel that would normally
be done in sequence.
Fast tracking involves doing project tasks at the same time rather than in sequence. Fast trackingrequires, by necessity, that the task dependencies allow such parallel work.
What else can be done to shorten the critical path?
• See if some activities might be further broken down to allow fast-tracking. If dependencies
between activities originally did not allow fast-tracking, breaking up these activities might open
new possibilities to accomplish tasks in parallel. Maybe some activities do not have to be
completely finished before a successor activity can be started. Thinking creatively about the
different activities on the critical path can help to possibly take them off the critical path, which
helps to shorten the overall project schedule.
• Check the duration estimates of the critical activities – in Microsoft Project a simple double
click on the task duration will open a Task Information dialog box. Often, duration estimates are
based on rules of thumb or include fudge factors. Breaking down the critical activities to a more
detailed breakdown might adjust the durations upward. Although this does not help to shorten
the critical path, it can save you from any surprises during the execution of the project, which
can also be beneficial.
An additional tool for project schedule development is simulation. Simulation is the process of
calculating project and activity durations using different assumptions, constraints, and resource
allocations. Two commonly used types of simulation are Monte Carlo simulation and what-if
analyses. Monte Carlo simulations are probabilistic analyses used to calculate a distribution of
likely results (in our case likely project or task durations). What-if-analysis take advantage of logic
networks by simulating various scenarios, such as what if a major component for a system isdelayed. Both these techniques allow additional insight into the duration of projects and project
activities.
6.4. Performing Time-Cost Trade-Off
It is based on the following assumptions:
1. Each activity has two pairs of duration and cost estimates: normal and crash. The normal time is
the estimated length of time required to perform the activity under normal conditions, according
to the plan (In PERT it is the expected time estimated using the three time used, [(a + 4m +b)/6]
and under the assumption of resource loadings that are normal. The normal cost is the estimated

7/18/2019 Time Cost Trade Off
http://slidepdf.com/reader/full/time-cost-trade-off-56d69bdbe50a6 6/10
6
cost to complete the activity in the normal time. The crash cost is the estimated cost to complete
the activity in the crash time.
2. An activity’s duration can be incrementally accelerated from its normal time to its crash time by
applying more resources – assigning more people, working overtime, using more equipment,
and so on. Increased costs will be associated with expediting the activity.3. An activity cannot be completed in less than its crash time, no matter how many additional
resources are applied. For example, activity A cannot be completed in less than 5 weeks, no
matter how many more resources are used or how much money is spent.
4. The resource necessary to reduce an activity’s estimated duration from its normal time to its
crash time will be available when needed.
5. Each activity has its own cost per time period for accelerating the activity’s duration from its
normal time to its crash time. Within the range between an activity’s normal and crash points, if
the relationship between time and cost is linear this acceleration cost per time period is
calculated as shown in lecture handout 1: (Such a linearity assumption enables us to use linear
programming to determine just which activities should be crashed and by how much.
EXAMPLE 3
Consider the simple project in Figure 2 and answer the following questions.
Figure 2: Network with Normal and Crash Times and Their CostsActivity: Normal estimate (weeks, $)
Crash estimate (weeks, $)
A: N = 7, $50,000 B: N = 9, $80,000 C = 5, $62,000 C = 6, $110,000
C: N = 10, $40,000 D: N=8, $30,000
C = 9, $45,000 C = 6, $42,000
(a) Find the critical path.
(b) What is the total project cost?
(c) How long would the project take if all the activities were performed in their minimum possible
time (crash time)? What would be the total cost?
(d) Calculate the cost-per-week rate to accelerate for each activity.
(e) Using the time-cost trade-off method, reduce the project duration as much as possible. What is
the new total cost?
1
3
4
2

7/18/2019 Time Cost Trade Off
http://slidepdf.com/reader/full/time-cost-trade-off-56d69bdbe50a6 7/10
7
Table 2 displays the incremental acceleration in total project completion and the associatedincremental increase in total project cost. It indicates that reducing the total project duration by 1week would increase the total project cost by $5,000. To reduce it by 2 weeks would cost $11,000,and to reduce it by 3 weeks would cost $23,000.
Table 2: Time-Cost Trade-Off
CD (18 weeks) $200,000
Step CP (weeks) Activities to Crash (1 week) Extra Cost ($) Total Cost($)
1 CD (18) C (C now is at minimum time) 5,000 205,000
2 CD (17) D (only activity to crash) 6,000 211,0003 CD, AB (16) D (D now at minimum time) 6,000
A 6,000 223,0004 CD, AB (15) C and D at its fully crashed time
(f) Compare this new total cost as a result of Time-Cost Trade-Off to the total crash costdetermined in (c)? If the new project deadline is 15 weeks, is it necessary to perform all theactivities in their minimum possible time (crash time)? Why or why not?
If all four activities were crashed, the total cost of the project would be $259,000, but it would stillnot be completed any earlier than 15 weeks. Using the time-cost trade-off method, we were able toreduce the project duration from 18 weeks to 15 weeks at an additional cost of $23,000 byselectively crashing the critical activities with the lowest acceleration cost per time period.Crashing all the activities would have resulted in a waste of $36,000 because no reduction in total
project duration beyond 15 weeks could be achieved.
6.5. Criteria for Selecting Activities to Crash
There are several characteristics that mark or highlight an activity that exists on the Critical Path as
a better candidate for crashing.
1. Must be on the Critical Path. Crashing noncritical activities that already have slack only buys more slack and doesn’t shortenthe project duration. Only critical path activities drive the project and crashing them will shortenthe project duration.
2. Precedes multiple activities.When an activity bottlenecks numerous succeeding activities, it is a great candidate to shorten.Once this activity is shortened, it allows the multiple activities to begin.
3. Long duration.An activity that has a long duration offers more potential time gain from crashing it.
4. Lower cost per period gained.Activities that cost less to crash are preferred. These include those requiring lower paid, lowerskilled workers or other resources that are otherwise sitting idle.
5. Early in the project (the Sunshine Rule).If you fail in crashing the activity and it takes longer than planned, it is still early in the project.Thus you still have recovery time. Also, typically demand on resources early in the project islower than other times, and they should be readily available.
6.
Labour-intensive.When an activity is low skill labour intensive, it is easy to add people to help complete the project early. When an activity requires high skills to complete, it may be hard to find qualifiedindividuals who are capable of completing the task.
7/18/2019 Time Cost Trade Off
http://slidepdf.com/reader/full/time-cost-trade-off-56d69bdbe50a6 8/10
8
7. Subject to common problemsTry to pick activities that are subject to higher probability of common problems. Shortening theduration lowers the exposure time and lessens the chances of having a problem.
6.6. The Least Cost Plan for the all crash time schedule
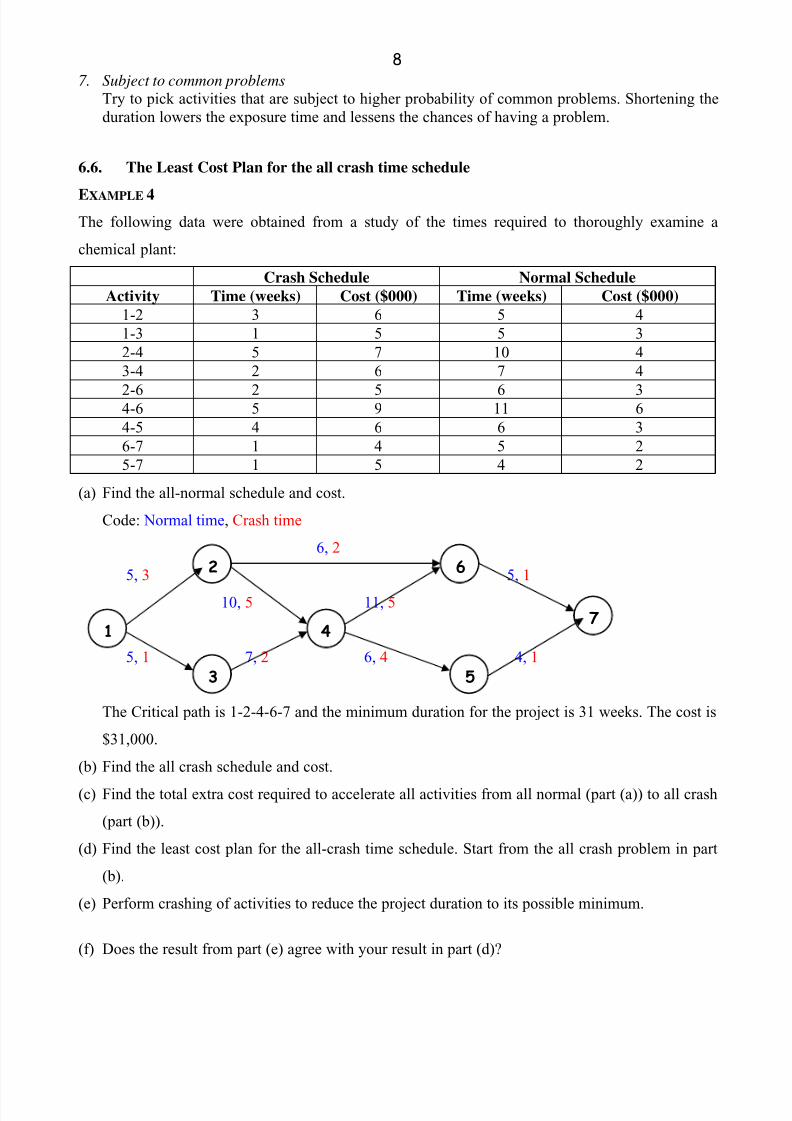
EXAMPLE 4The following data were obtained from a study of the times required to thoroughly examine a
chemical plant:
Crash Schedule Normal ScheduleActivity Time (weeks) Cost ($000) Time (weeks) Cost ($000)
1-2 3 6 5 4
1-3 1 5 5 3
2-4 5 7 10 4
3-4 2 6 7 4
2-6 2 5 6 34-6 5 9 11 6
4-5 4 6 6 3
6-7 1 4 5 2
5-7 1 5 4 2
(a) Find the all-normal schedule and cost.
Code: Normal time, Crash time
6, 2
5, 3 5, 1
10, 5 11, 5
5, 1 7, 2 6, 4 4, 1
The Critical path is 1-2-4-6-7 and the minimum duration for the project is 31 weeks. The cost is
$31,000.
(b) Find the all crash schedule and cost.
(c) Find the total extra cost required to accelerate all activities from all normal (part (a)) to all crash
(part (b)).
(d) Find the least cost plan for the all-crash time schedule. Start from the all crash problem in part
(b).
(e) Perform crashing of activities to reduce the project duration to its possible minimum.
(f) Does the result from part (e) agree with your result in part (d)?
17
5
6
4
3
2

7/18/2019 Time Cost Trade Off
http://slidepdf.com/reader/full/time-cost-trade-off-56d69bdbe50a6 9/10
9
Path Normal duration (wks) Fully crashed duration (wks)
Activity Acceleration cost per week ($) Max weeks to crash
12467 $53,000
path (weeks) Crashing cost Expansion Saving ($) New total cost ($)
EXAMPLE 5 (NON LINEAR ACCEERATION COST)
The network for shooting a TV commercial as shown in the table has a fixed cost of $90 per day,
but shortening the project duration can save money. Find the least cost schedule.
Activity Normal Time Crash Time Cost Increase ($) (1 st , 2 nd , 3 rd day)
1-2 7 4 30, 50, 70
2-3 9 6 40, 45, 65
1-3 12 10 60, 60
2-4 11 9 35, 60
3-4 3 3 -

7/18/2019 Time Cost Trade Off
http://slidepdf.com/reader/full/time-cost-trade-off-56d69bdbe50a6 10/10
10
7, 4 1 1, 9
9, 6
12, 10 3, 3
1-2-4: 18 days
1-2-3-4: 19 days
1-3-4: 15 days
Critical path is 1-2-3-4 and the duration is 19days.
Table 3: Time-Cost Trade-Off for Shooting a TV Commercial
1-2-3-4 (19 days) $1,710Step CP (days) Activities to crash by 1 day Cost Change($) Total Cost($)1 1-2-3-4 (19)
1-2-4 (18)1-3-4 (15)
1-2 (30) 30 – 90 = -60 1,650
2 1-2-3-4 (18)1-2-4 (17)1-3-4 (15)
2-3 (40) 40 – 90 = -50 1,600
3 1-2-3-4 (17)1-2-4 (17)
1-3-4 (15)
1-2 (50)2-3 (45), 2-4 (35)
50 – 90 = -40 1,560
4 1-2-3-4 (16)1-2-4 (16)1-3-4 (15)
1-2 (70)2-3 (45), 2-4 (35)
70 – 90 = -20 1,540
5 1-2-3-4 (15)1-2-4 (15)1-3-4 (15)
2-3 (45)2-4 (35)1-3 (60)
45+35+60-90=50 1,590
6 1-2-3-4 (14)1-2-4 (14)1-3-4 (14)
2-3 (65)2-4 (60)1-3 (60)
65+60+60-90=95 1,685
1-2-3-4 (13)1-2-4 (13)1-3-4 (13)
Fully crashed
1
3
4
2