Time-based bioactivity analysis
9
Time-based bioactivity analysis | Presented By Date Time-Based Bioactivity Analysis Reaxys Medicinal Chemistry Matthew CLARK 18 May 2016
-
Upload
matthew-clark -
Category
Documents
-
view
159 -
download
3
Transcript of Time-based bioactivity analysis

Time-based bioactivity analysis |
Presented By
Date
Time-Based Bioactivity Analysis
Reaxys Medicinal Chemistry
Matthew CLARK
18 May 2016
Time-based bioactivity analysis |
R&D Solutions FOR PHARMA & LIFE SCIENCES Essential Tools and Solutions for Pharma & Life Sciences
https://www.elsevier.com/rd-solutions/pharma-and-life-sciences-solutions
Matthew Clark, Ph. D. [email protected]
Time-based bioactivity analysis |
Q: can you analyze activity reported for a target over time, to see the time trend of improvement?
A: Yes
Findings for PIK3 example
• While the most active compound has hovered around the 1-10pM range of affinity, the scaffolds are similar
• Looking over the distribution of activities reported for all PIK3-active compounds, the peak of the distribution has shifted only moderately over time.
Findings for ABL1 example
• Most active compound about 10nM for some time
• Number of highly active compound reports increasing over time
• Trend is moving to more active compounds
Follow Up From Bioactivity Prediction Webinar Question
Time-based bioactivity analysis |
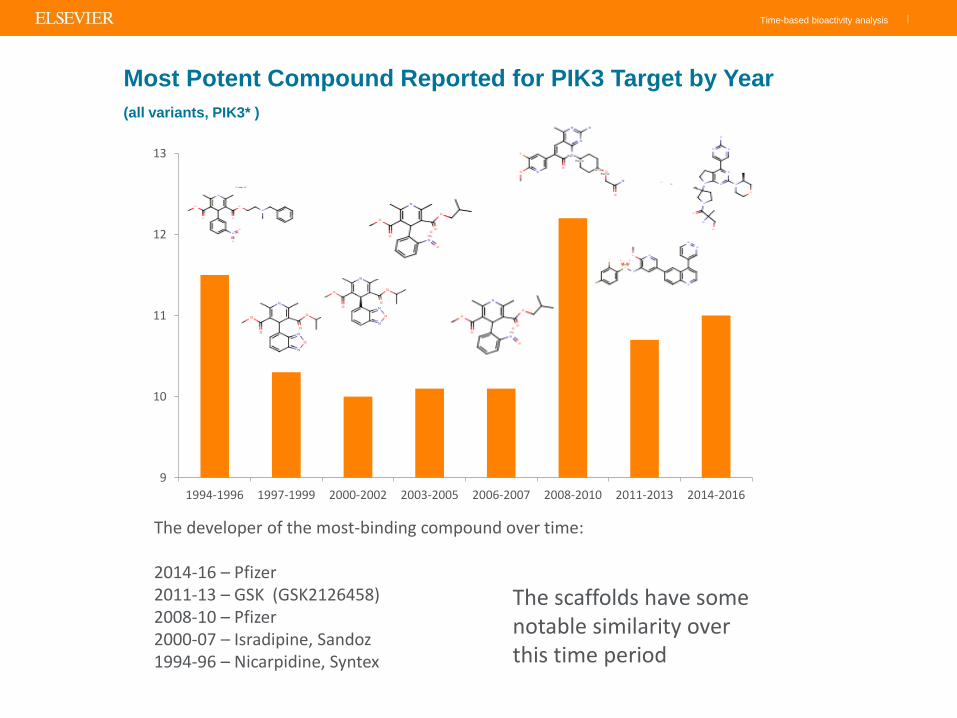
Most Potent Compound Reported for PIK3 Target by Year
(all variants, PIK3* )
The developer of the most-binding compound over time: 2014-16 – Pfizer 2011-13 – GSK (GSK2126458) 2008-10 – Pfizer 2000-07 – Isradipine, Sandoz 1994-96 – Nicarpidine, Syntex
9
10
11
12
13
1994-1996 1997-1999 2000-2002 2003-2005 2006-2007 2008-2010 2011-2013 2014-2016
The scaffolds have some notable similarity over this time period

Time-based bioactivity analysis |
• The peak of reported activities has shifted only moderately
• The number of compounds reported per year increased 1000 fold between 1994 and 2014
5
Distribution of Activities for PIK3 Target Over Time
Graph shows the number of assay reports in each decade of activity for the given time spans That is, how the activities are distributed Note: some compounds are reported in more than one time frame.
0
1000
2000
3000
4000
5000
6000
7000
8000
0 2 4 6 8 10 12
Nu
mb
er o
f C
om
po
un
ds
Rep
ort
ed
-log10[M] activity
1994-1996
1997-1999
2000-2002
2003-2005
2006-2008
2009-2011
2012-2014
2015-2016

Time-based bioactivity analysis |
• 1994-1996 compound is from Plexxicon, most active from Princeton U., most recent from Nektar.
• 2000-2002 leader was Staurosporine!
6
ABL1 Kinase
6
7
8
9
10
11
12
1994-1996 1997-1999 2000-2002 2003-2005 2006-2007 2008-2010 2011-2013 2014-2016
Time-based bioactivity analysis |
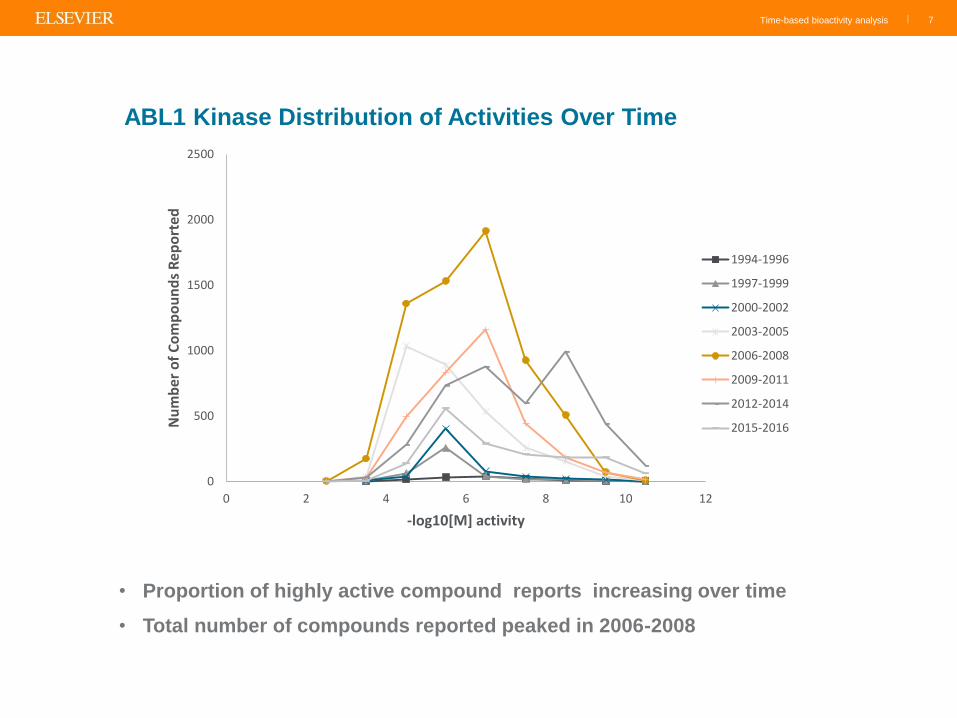
• Proportion of highly active compound reports increasing over time
• Total number of compounds reported peaked in 2006-2008
7
ABL1 Kinase Distribution of Activities Over Time
0
500
1000
1500
2000
2500
0 2 4 6 8 10 12
Nu
mb
er o
f C
om
po
un
ds
Rep
ort
ed
-log10[M] activity
1994-1996
1997-1999
2000-2002
2003-2005
2006-2008
2009-2011
2012-2014
2015-2016
Time-based bioactivity analysis |
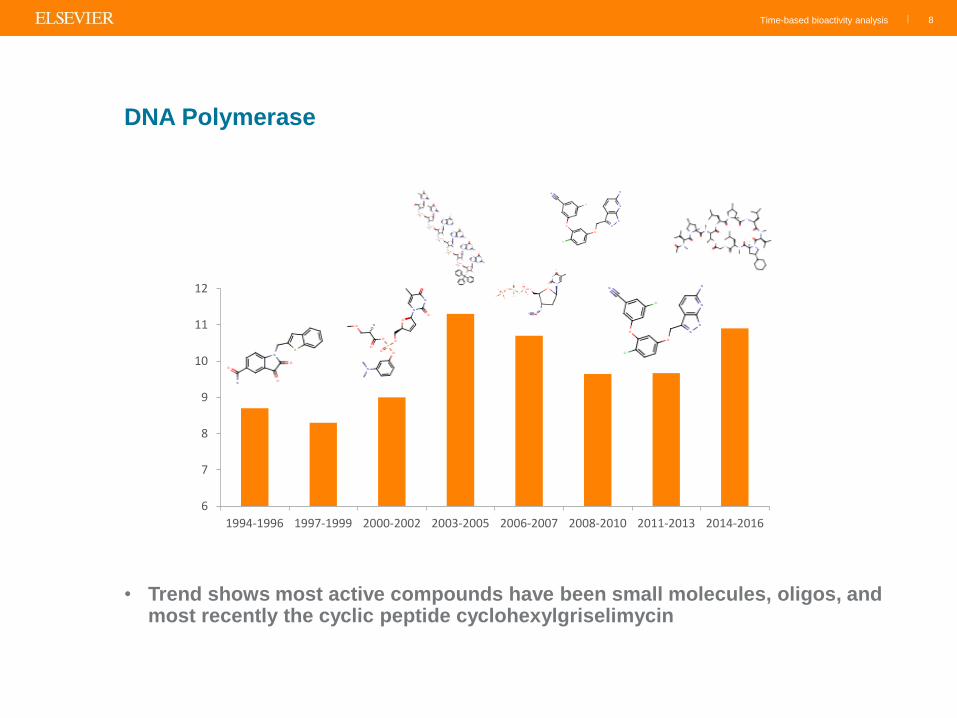
• Trend shows most active compounds have been small molecules, oligos, and most recently the cyclic peptide cyclohexylgriselimycin
8
DNA Polymerase
6
7
8
9
10
11
12
1994-1996 1997-1999 2000-2002 2003-2005 2006-2007 2008-2010 2011-2013 2014-2016
Time-based bioactivity analysis | 9
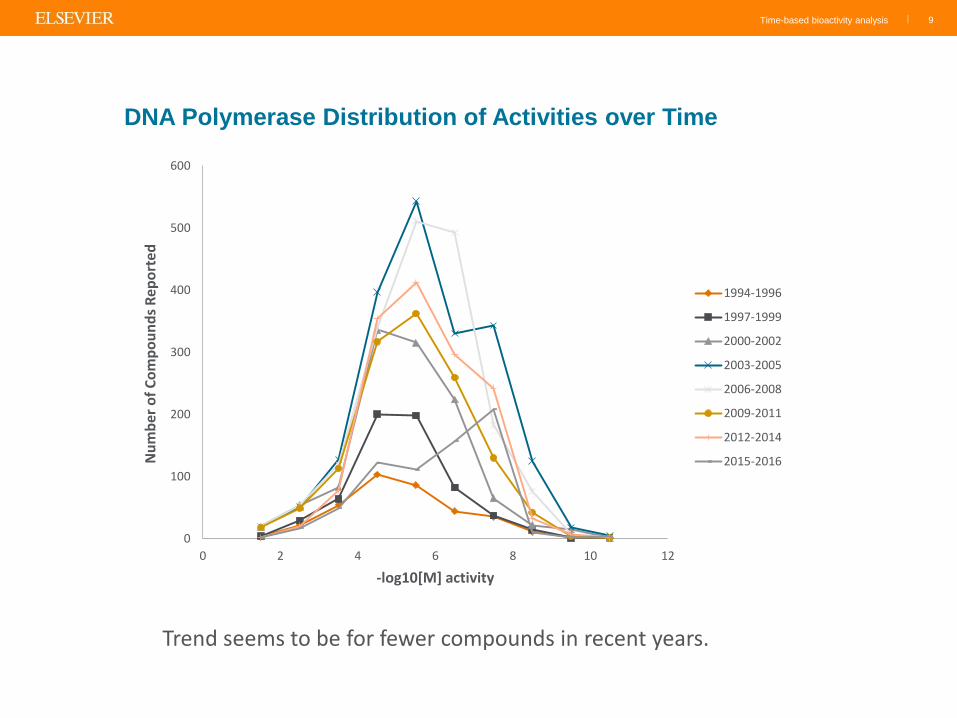
DNA Polymerase Distribution of Activities over Time
0
100
200
300
400
500
600
0 2 4 6 8 10 12
Nu
mb
er o
f C
om
po
un
ds
Rep
ort
ed
-log10[M] activity
1994-1996
1997-1999
2000-2002
2003-2005
2006-2008
2009-2011
2012-2014
2015-2016
Trend seems to be for fewer compounds in recent years.