Time and risk preferences for losses
110
Time and risk preferences for losses David Hardisty Sauder School of Business Operations and Logistics Seminar September 8 th , 2014
-
Upload
seth-emerson -
Category
Documents
-
view
35 -
download
1
description
Time and risk preferences for losses. David Hardisty Sauder School of Business Operations and Logistics Seminar September 8 th , 2014. Overview. Project 1: Does Prospect Theory hold in intertemporal choice ? The interaction of time and risk in preferences for gains and losses. - PowerPoint PPT Presentation
Transcript of Time and risk preferences for losses

Time and risk preferences for losses
David HardistySauder School of Business
Operations and Logistics SeminarSeptember 8th, 2014

2
Project 1: Does Prospect Theory hold in intertemporal choice? The interaction of time and risk in preferences for gains and losses.
Project 2: Time and uncertainty in repeated prisoner’s dilemmas
Project 3: Framing energy costs to promote energy efficiency and sustainability
Overview
1. Does Prospect Theory Hold in Intertemporal
Choice? The interaction of time and risk in
preferences for gains and losses

4
Prospect Theory
(Kahneman & Tversky, 1979)

5
Why do many people buy insurance, even bad insurance (such as travelers insurance)?
Why do many people pre-pay for gas in rental cars?
Questions

6
Gains Losses
Risk +$100 or 50% chance of +$200
-$100 or 50% chance of -$200
Time +$100 nowor +$100 next year
-$100 now or-$100 next year
Risk + Time +$100 nowor50% chance of +$200 next year
-$100 nowor50% chance of -$200 next year
Preferences for gains and losses

7
Receive $70 now or in a month? 100% choose now.
Pay $70 now or in a month?53% choose now.
(Hardisty & Weber, 2009; Mischel, W., Grusec, & Masters, 1969; Thaler, 1981)
Time preferences for gains and losses: the “sign effect”

8
Gains Losses
Risk +$100 or 50% chance of +$200
-$100 or 50% chance of -$200
Time +$100 nowor +$100 next year
-$100 now or-$100 next year
Risk + Time +$100 nowor50% chance of +$200 next year
-$100 nowor50% chance of -$200 next year
????

9
Participants Total N=1385 across 5 studies National U.S. sample, average age = 38 Mix of Mturk, SSI, and Qualtrics

10
Study 1 Overview Hypothetical scenarios Gain vs Loss Future “certainty” vs uncertainty (Probability vs Variability) (Medium vs Large Magnitude) (Order)

11
Study 1: Gain Scenario
Please imagine you face a set of choices about receiving $100 from investments immediately, or another amount in one year.

12
Study 1: Medium Gain Choices Receive $100 immediately or receive $90 in
one year? Receive $100 immediately or receive $100
in one year? Receive $100 immediately or receive $110
in one year?…
Receive $100 immediately or receive $200 in one year?

13
Study 1: Large Gain Choices Receive $10,000 immediately or receive
$9,000 in one year? Receive $10,000 immediately or receive
$10,000 in one year? …
Receive $10,000 immediately or receive $20,000 in one year?

14
Study 1: Probabilistic Gain Receive $100 immediately or 50% chance
of receiving $180 in one year? Receive $100 immediately or 50% chance
of receiving $200 in one year? …
Receive $100 immediately or 50% chance of receiving $400 in one year?

15
Study 1: Variable Gain Receive $100 immediately or receive $45 to
$135 in one year? Receive $100 immediately or receive $50 to
$150 in one year? …
Receive $100 immediately or receive $100 to $300 in one year?

16
Study 1: Losses
Please imagine you face a set of choices about paying a $100 bill immediately, or another amount in one year. Control: Pay $100 immediately or pay
$150 in one year? Probabilistic: Pay $100 immediately or
50% chance of paying $300 in one year? Variable: Pay $100 immediately or pay $75
to $225 in one year?

17
Study 1: Results

18
Study 1: Results
19
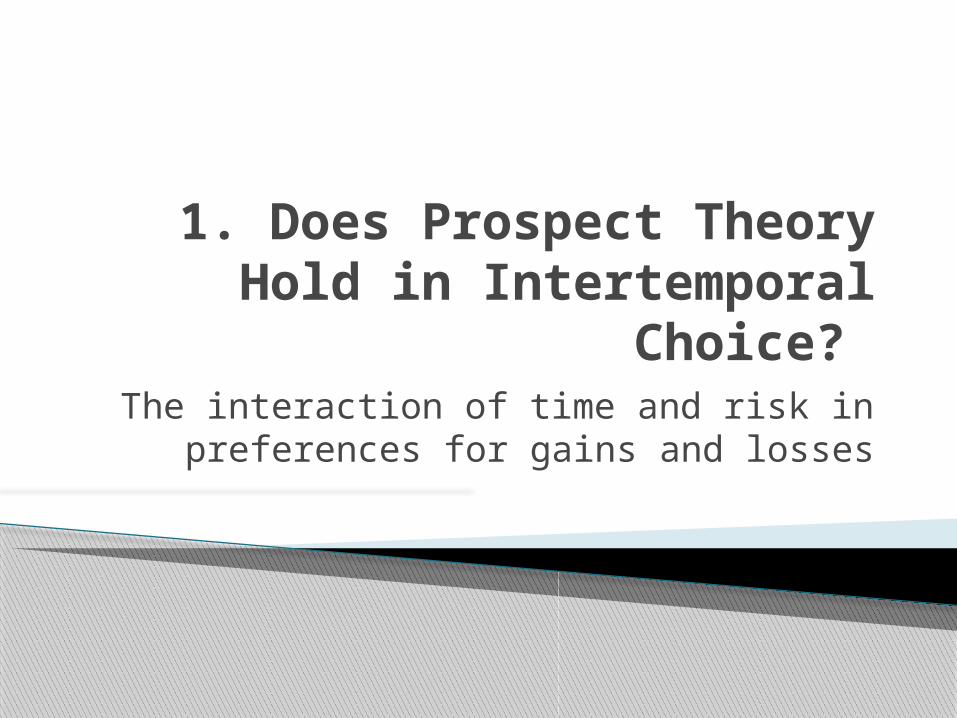
Today In One Year In One Year
+$100 +$130 .5*+$306
+$10,000 +$11,600 .5*+$30,720
-$100 -$104 .5*-$189
-$10,000 -$10,600 .5*-$18,700
In Dollars

20
Study 1: Summary Participants were risk averse for future
gains and future losses Weird study or weird participants? What about immediate uncertainty?

21
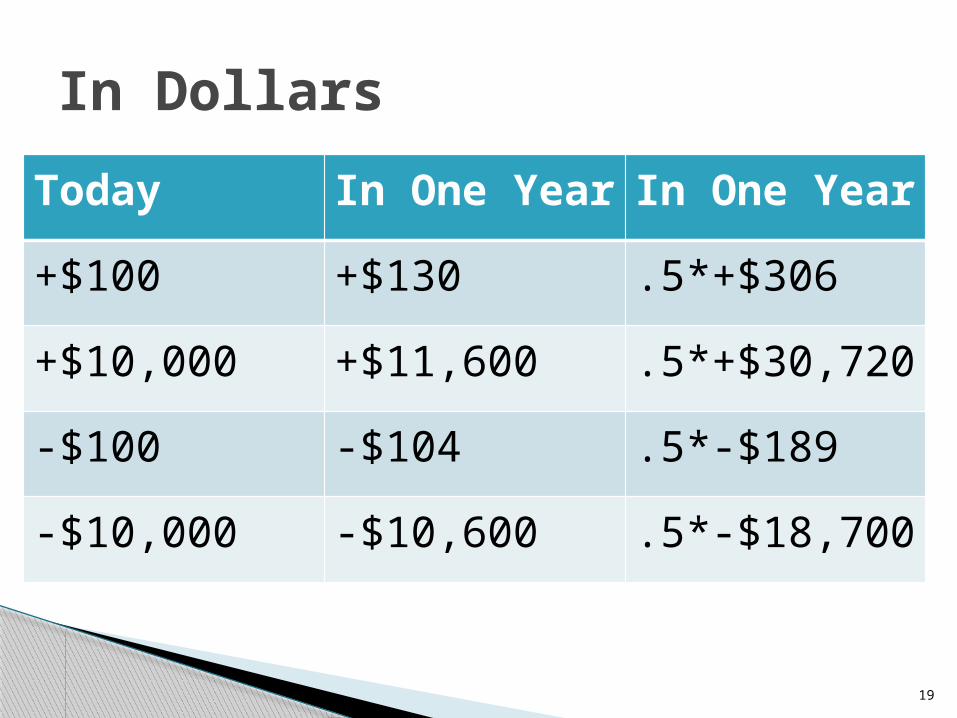
Study 2: Overview Prospect theory questions (all immediate
outcomes) Immediate uncertainty vs future “certainty” Hypothesis 1: Prospect theory preferences
when all outcomes are immediate Hypothesis 2: Risk aversion when making
intertemporal choices
22
Study 2: Prospect Theory Methods 50% chance of receiving $200, or receive
$100 for sure? 50% chance of receiving $20,000, or
receive $10,000 for sure? 50% chance of paying $200, or pay $100 for
sure? 50% chance of paying $20,000, or pay
$10,000 for sure?

23
Prospect Theory: Results

24
Study 2: Intertemporal Choice Methods Control:
Receive $100 immediately or $150 in one year?
Immediate uncertainty: 50% chance of receiving $200 immediately or receive $150 for sure in one year?
25
Study 2: Results

26
Study 2: Results

27
Study 2: Summary When making intertemporal choices,
participants showed risk aversion for gains and losses
What happens when both the immediate and future outcomes are uncertain?

28
Study 3: Intertemporal Choice Methods Control:
Receive $100 immediately or $150 in one year?
Immediate and future uncertainty: 50% chance of receiving $200 immediately or 50% chance of receiving $300 in one year?

29
Study 3: Results

30
Study 3: Results

31
Individual differences
discounting of
gainsdiscounting of
losses
young company .00 .16*
employed part time
.11* .14*
Financial resources
-.38** -.23**
income -.13* -.03
feel secure -.20* -.22*
smoking .16** .02

32
We replicate our results all in one study, with both MBAs and non-MBAs
Study 4

33

34
Why is this happening? One hypothesis: the combination of time and
risk is complex, and most people prefer simple, straightforward outcomes. Ex:◦ $100 now (simple)◦ 50% chance of $200 (pretty simple)◦ $100 next year (pretty simple)◦ 50% chance of $200 next year (not so simple)
We asked people about outcome complexity Also measured: numeracy & need for
cognition
Study 5

35
Study 5: Methods$100 now $110 in one year
How simple and straightforward do you find the option on the left?
very simple very complicated1 2 3 4 5 6 7
How simple and straightforward do you find the option on the right?
very simple very complicated1 2 3 4 5 6 7

36
Study 5: Methods
$100 now 50% chance of $220 in one year
How simple and straightforward do you find the option on the left?
very simple very complicated1 2 3 4 5 6 7
How simple and straightforward do you find the option on the right?
very simple very complicated1 2 3 4 5 6 7

37
Study 5: Results

UncertaintyTiming
ComplexityShift
Change in Time
Preference
(β = 2.59, p < .001)
(β = 0.07, p < .001)
β = 0.04, p = .01
(β = 0.34, p < .001)
β = 0.24, p < .001
Study 5: Mediation
Bootstrapped test of mediation: p < .01
39
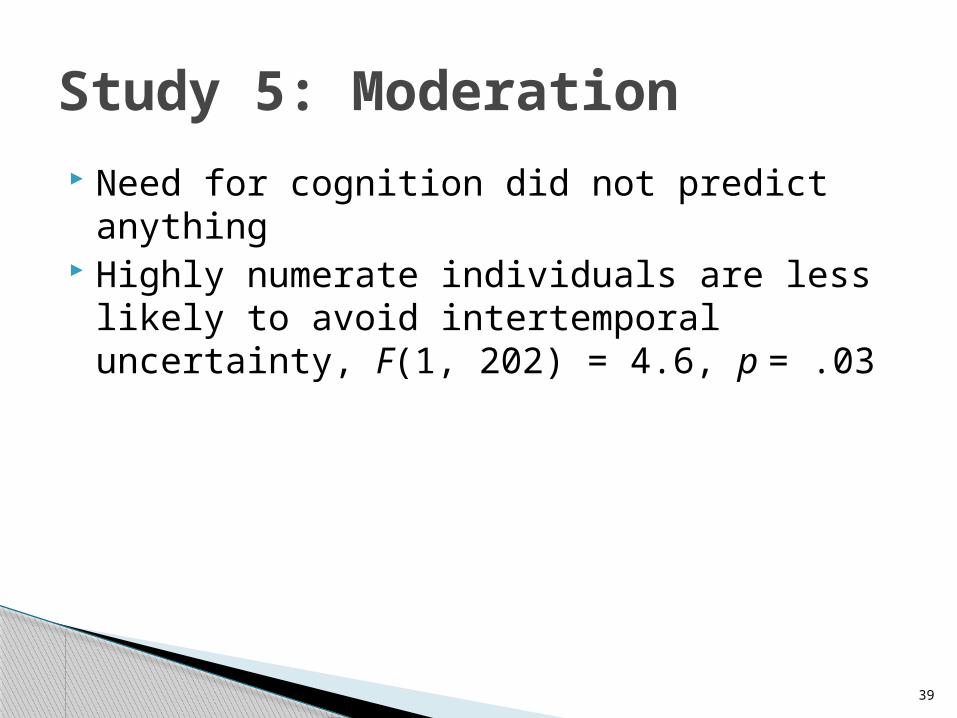
Need for cognition did not predict anything Highly numerate individuals are less likely
to avoid intertemporal uncertainty, F(1, 202) = 4.6, p = .03
Study 5: Moderation

40
Overall Summary In intertemporal contexts, participants are
risk averse for gains and losses (in contrast to prospect theory predictions)
This is partially driven by a preference for simple, straightforward outcomes in “complex” situations.

41
When combined with “implicit future uncertainty”, our results may explain the “sign effect” in intertemporal choice
Our results are consistent with the “equity premium puzzle” may explain the “annuity puzzle” and also suggest an “ARM-premium puzzle” may exist
Also may explain pre-buying gas for rental cars
Implications & Applications
42
Any other ideas on why people do this? Any other suggestions for the paper?
Questions

2. Time and uncertainty in repeated prisoner’s
dilemmas

IDS Background Interdependent Security (IDS) is a social
dilemma with stochastic losses (Kunreuther & Heal, 2003)
Examples: border security airline security pest/disease control risky investment Individuals generally cooperate less in IDS
(Kunreuther & Heal, 2003; Gong, Baron, & Kunreuther, 2009)

Research Motivation In real life, players often precommit their
strategy (whether to invest in protection) for several years in advance at a time
examples: CO2 reductions, fishing licenses

Research Motivation Normally, greater delay is associated with
increased uncertainty example: $10 promised today or in 20 years However, with repeated low probability
events, increasing time horizon may increase subjective probability
example: fire insurance for tomorrow, or for the next 20 years

Methods Overview 4 studies Sample of Columbia students (N=271) Anonymous, repeated prisoners dilemma 4 blocks of 20 rounds Switching partners between each block Comprehension quiz after instructions Incentive compatible payouts

Study 1Does precommitment raise investment
rates in interdependent security?

Study 1 Overview Between subjects:
- Regular, repeated PD- Regular, repeated IDS- Precommitted IDS
Expected values and nash equilibria are the same in all conditions

IDS instructions (pg 1)Scenario: Imagine you are an investor in
Indonesia and you have a risky joint venture that earns 8,500 Rp per year. However, there is a small chance that you and/or your counterpart will suffer a loss of 40,000 Rp in a given year. You have the option to pay 1,400 Rp for a safety measure each year to protect against the possible loss. However, you will only be fully protected if both you and your counterpart invest in protection. The loss has an equal chance of happening each year, regardless of whether it occurred in the previous year.

IDS payoff matrixYour Counterpart
INVEST NOT INVEST
You INVEST - You definitely lose 1,400 Rp, and have a 0% chance of the large loss occurring.
- Your counterpart definitely loses 1,400 Rp, and has a 0% chance of the large loss occurring.
- You definitely lose 1,400 Rp and have a 1% chance of losing an additional 40,000 Rp.
- Your counterpart has a 3% chance of losing 40,000 Rp and a 97% chance of losing 0 Rp.
NOT INVEST
- You have a 3% chance of losing 40,000 Rp and a 97% chance of losing 0 Rp.
- Your counterpart definitely loses 1,400 Rp and has a 1% chance of losing an additional 40,000 Rp.
- You have a 4% chance of losing 40,000 Rp and a 96% chance of losing 0 Rp.
- Your counterpart has a 4% chance of losing 40,000 Rp and a 96% chance of losing 0 Rp.

PD payoff matrixYour Counterpart
INVEST NOT INVEST
You INVEST - You lose 1,400 Rp.- Your counterpart loses 1,400 Rp.
- You lose 1,800 Rp. - Your counterpart loses 1,200 Rp.
NOT INVEST
- You lose 1,200 Rp.- Your counterpart loses 1,800 Rp.
- You lose 1,600 Rp.- Your counterpart loses 1,600 Rp.

IDS: Choices
Will you invest in protection this year? INVEST | NOT INVEST
Do you think your counterpart will invest in protection this year?
DEFINITELY | PROBABLY | PROBABLY NOT | DEFINITELY NOT
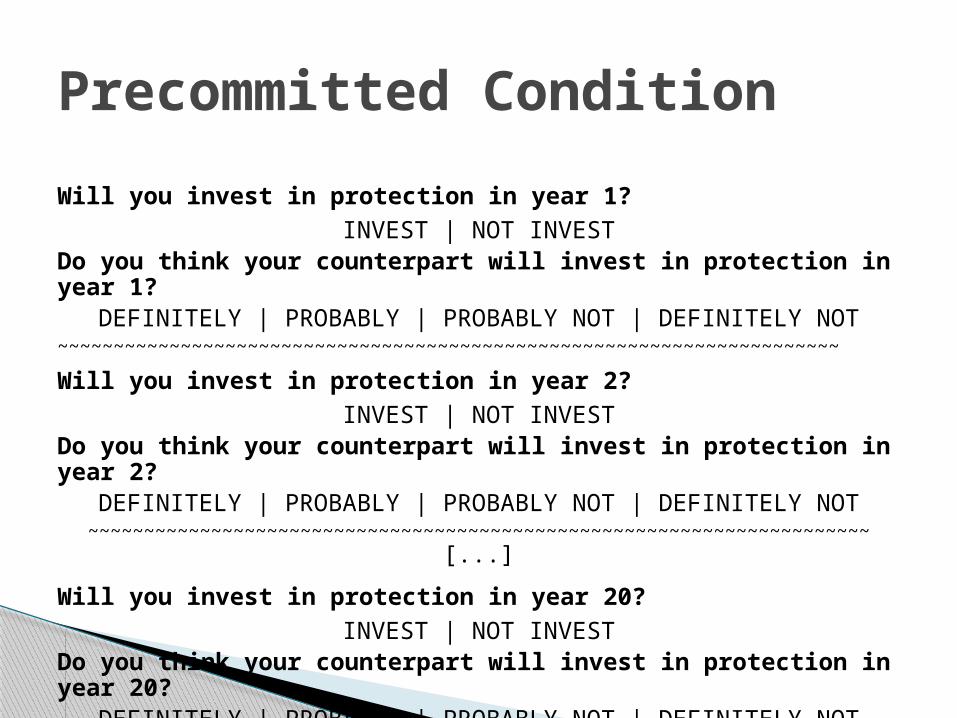
Precommitted Condition
Will you invest in protection in year 1? INVEST | NOT INVEST
Do you think your counterpart will invest in protection in year 1?
DEFINITELY | PROBABLY | PROBABLY NOT | DEFINITELY NOT~~~~~~~~~~~~~~~~~~~~~~~~~~~~~~~~~~~~~~~~~~~~~~~~~~~~~~~~~~~~~~~~~~~~~~
Will you invest in protection in year 2? INVEST | NOT INVEST
Do you think your counterpart will invest in protection in year 2?
DEFINITELY | PROBABLY | PROBABLY NOT | DEFINITELY NOT~~~~~~~~~~~~~~~~~~~~~~~~~~~~~~~~~~~~~~~~~~~~~~~~~~~~~
~~~~~~~~~~~~~~~~~ [...]
Will you invest in protection in year 20? INVEST | NOT INVEST
Do you think your counterpart will invest in protection in year 20?
DEFINITELY | PROBABLY | PROBABLY NOT | DEFINITELY NOT
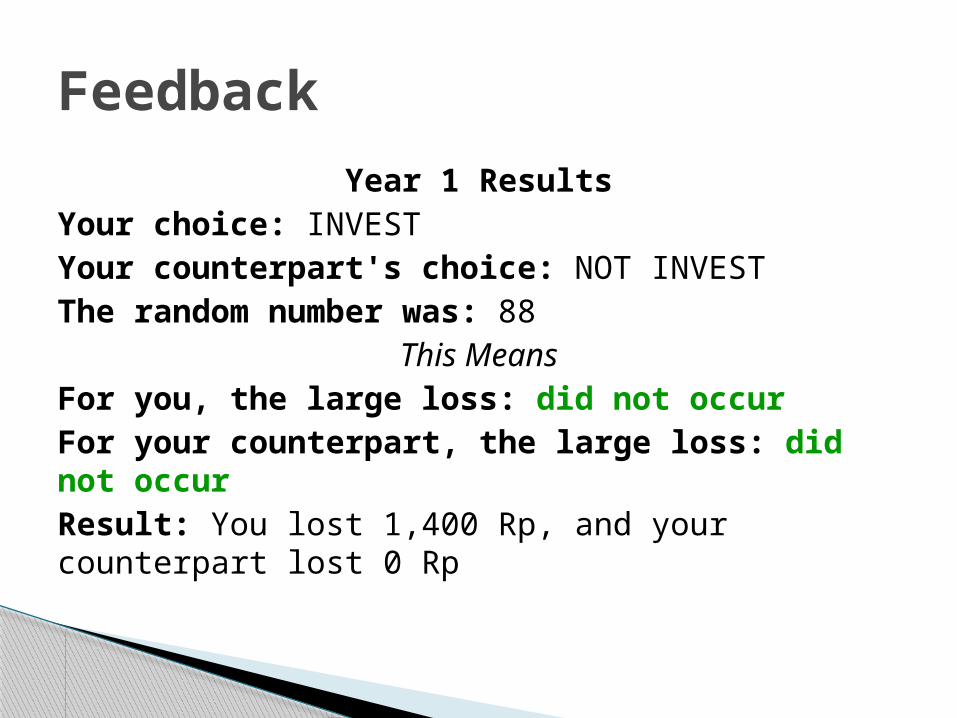
Feedback
Year 1 ResultsYour choice: INVESTYour counterpart's choice: NOT INVESTThe random number was: 88
This MeansFor you, the large loss: did not occurFor your counterpart, the large loss: did not occurResult: You lost 1,400 Rp, and your counterpart lost 0 Rp

PD vs IDS
0
0.1
0.2
0.3
0.4
0.5
0.6
0.7
0.8
0.9
1
Block 1 Block 2 Block 3 Block 4
Investm
en
t P
rop
ort
ion
IDS rep
PD rep

PD vs IDS
0
0.1
0.2
0.3
0.4
0.5
0.6
0.7
0.8
0.9
1
Block 1 Block 2 Block 3 Block 4
Investm
en
t P
rop
ort
ion
IDS rep
PD rep

PD vs IDS
0
0.1
0.2
0.3
0.4
0.5
0.6
0.7
0.8
0.9
1
Block 1 Block 2 Block 3 Block 4
Investm
en
t P
rop
ort
ion
IDS rep
PD rep
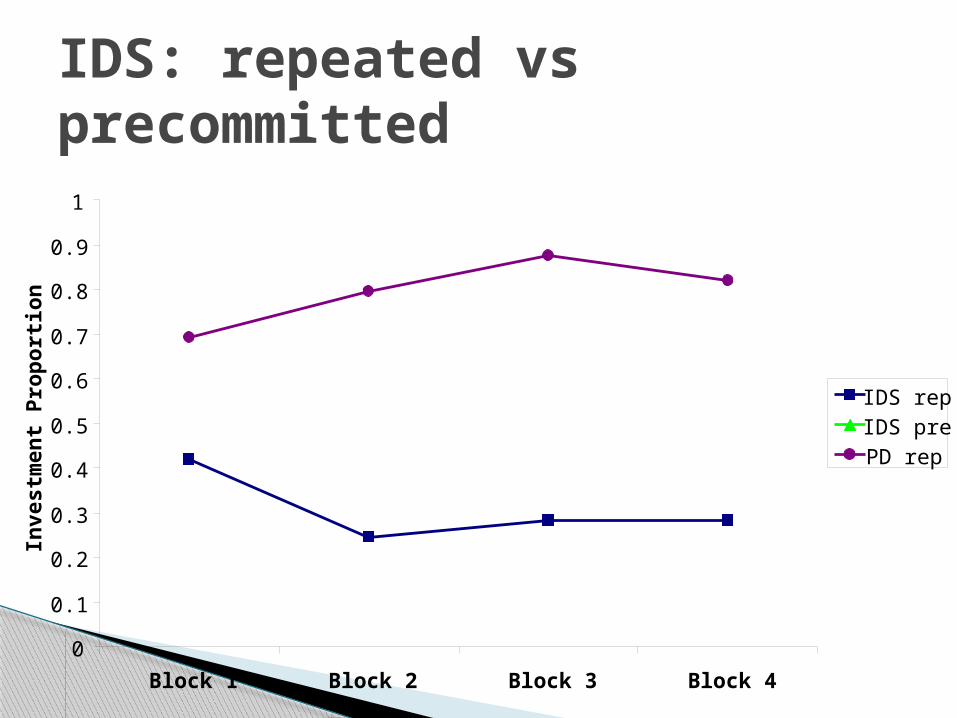
IDS: repeated vs precommitted
0
0.1
0.2
0.3
0.4
0.5
0.6
0.7
0.8
0.9
1
Block 1 Block 2 Block 3 Block 4
Investm
en
t P
rop
ort
ion
IDS repIDS prePD rep

IDS: repeated vs precommitted
0
0.1
0.2
0.3
0.4
0.5
0.6
0.7
0.8
0.9
1
Block 1 Block 2 Block 3 Block 4
Investm
en
t P
rop
ort
ion
IDS repIDS prePD rep

Study 1 Discussion Uncertainty lowers cooperation between individuals
playing loss framed dilemma Why?
- Perhaps uncertainty transforms the game from a social dilemma to a game of chance
Under uncertainty, precommitment raises cooperation Why?
- Perhaps precommitment raises subjective probability of the loss- We know that in intertemporal contexts, people are risk averse for losses (Project 1)
We can investigate these in a solo game

Study 2Question: Do individuals playing a (non-
dilemma) solo game invest more often when precommitting?

Solo payoff matrix
INVEST - You definitely lose 1,400 Rp, and have a 0% chance of the large loss occurring.
NOT INVEST - You have a 4% chance of losing 40,000 Rp and a 96% chance of losing 0 Rp.

IDS repeated vs Solo repeated
0
0.1
0.2
0.3
0.4
0.5
0.6
0.7
0.8
0.9
1
Block 1 Block 2 Block 3 Block 4
Inve
stm
ent
Pro
po
rtio
n
IDS rep
IDS pre
Solo rep
Solo pre

IDS repeated vs Solo repeated
0
0.1
0.2
0.3
0.4
0.5
0.6
0.7
0.8
0.9
1
Block 1 Block 2 Block 3 Block 4
Inve
stm
ent
Pro
po
rtio
n
IDS rep
IDS pre
Solo rep
Solo pre

Conclusion IDS players are mostly playing a game of
chance, showing risk-seeking for losses
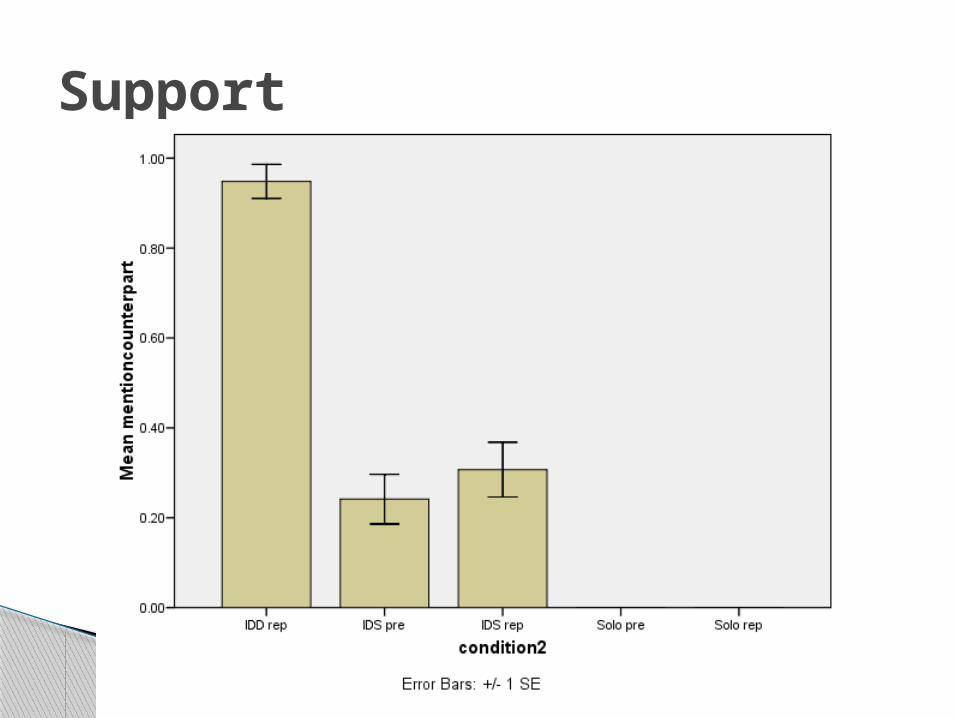
Support

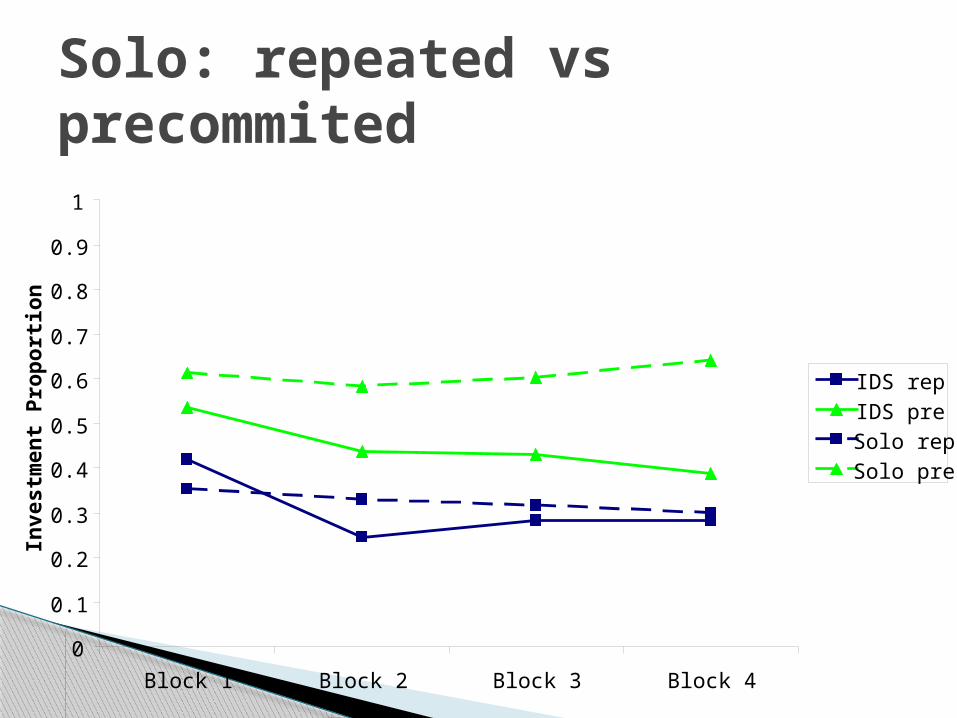
Solo: repeated vs precommited
0
0.1
0.2
0.3
0.4
0.5
0.6
0.7
0.8
0.9
1
Block 1 Block 2 Block 3 Block 4
Inve
stm
ent
Pro
po
rtio
n
IDS rep
IDS pre
Solo rep
Solo pre
Solo: repeated vs precommited
0
0.1
0.2
0.3
0.4
0.5
0.6
0.7
0.8
0.9
1
Block 1 Block 2 Block 3 Block 4
Investm
en
t P
rop
ort
ion
IDS repIDS preSolo repSolo pre

Conclusion Precommitment raises investment rates by
individuals Why?
- Perhaps subjective probability is increased- People are risk seeking for losses in intertemporal situations

How else can we improve investment under uncertainty? Perhaps environmental framing can
highlight social goals and raise investment rates

Study 3Question: Will environmental framing will
increase investment rates?

IDS environmental instructionsScenario: Imagine you are a farmer in Indonesia. You
get an annual yield of 8,500 Rupiah (Rp) from your potato crops. Both you and a neighboring farmer use the pesticide Aldicarb on your potato crops. However, there is a small risk of groundwater contamination each year from this pesticide, which is toxic. If contamination occurs, you and/or your neighboring farmer will suffer a loss of 40,000 Rp, to pay for groundwater cleanup. You have the option to switch to a more expensive, though safer, pesticide, at the cost of 1,400 Rp annually, to avoid groundwater contamination. However, you will only be fully protected if both you and your counterpart invest in the safer pesticide. The groundwater contamination has an equal chance of happening each year, regardless of whether it occurred in the previous year.
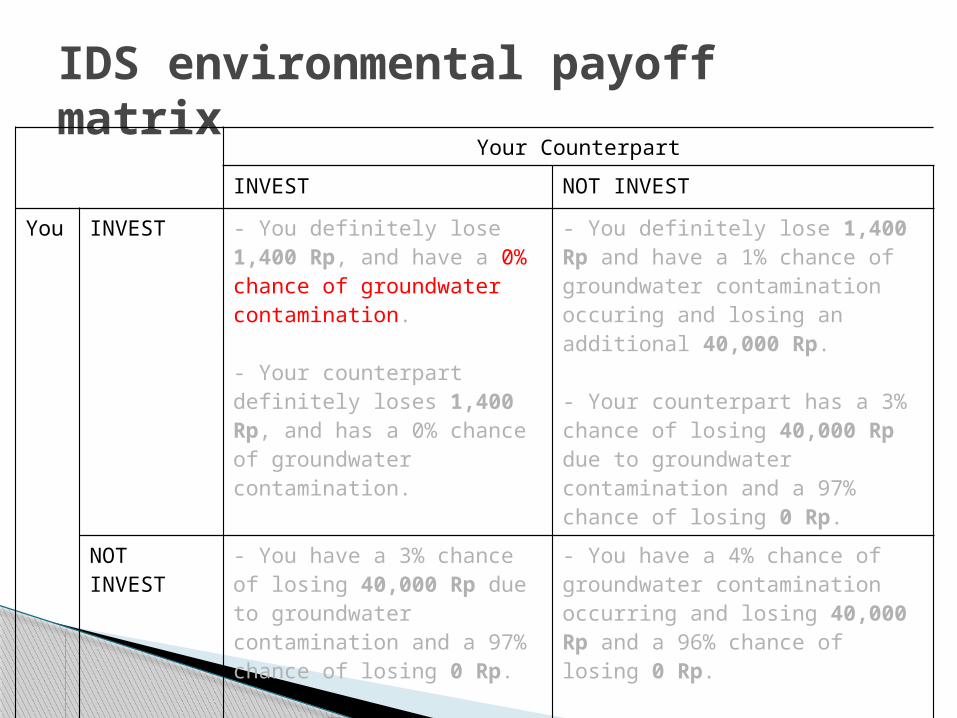
IDS environmental payoff matrix
Your Counterpart
INVEST NOT INVEST
You INVEST - You definitely lose 1,400 Rp, and have a 0% chance of groundwater contamination.
- Your counterpart definitely loses 1,400 Rp, and has a 0% chance of groundwater contamination.
- You definitely lose 1,400 Rp and have a 1% chance of groundwater contamination occuring and losing an additional 40,000 Rp.
- Your counterpart has a 3% chance of losing 40,000 Rp due to groundwater contamination and a 97% chance of losing 0 Rp.
NOT INVEST
- You have a 3% chance of losing 40,000 Rp due to groundwater contamination and a 97% chance of losing 0 Rp.
- Your counterpart definitely loses 1,400 Rp and has a 1% chance of groundwater contamination occuring and losing an additional 40,000 Rp.
- You have a 4% chance of groundwater contamination occurring and losing 40,000 Rp and a 96% chance of losing 0 Rp.
- Your counterpart has a 4% chance of groundwater contamination occurring and losing 40,000 Rp and a 96% chance of losing 0 Rp.

IDS Environmental: ChoicesWill you invest in the safer pesticide this year?
INVEST | NOT INVEST
Do you think your counterpart will invest in the safer pesticide this year?
DEFINITELY | PROBABLY | PROBABLY NOT | DEFINITELY NOT

Feedback
Year 1 ResultsYour choice: INVESTYour counterpart's choice: NOT INVESTThe random number was: 88
This MeansFor you, groundwater contamination: did not occurFor your counterpart, groundwater contamination : did not occurResult: You lost 1,400 Rp, and your counterpart lost 0 Rp

Environmental Frame Results
0
0.1
0.2
0.3
0.4
0.5
0.6
0.7
0.8
0.9
1
Block 1 Block 2 Block 3 Block 4
Inve
stm
ent
Pro
po
rtio
n
IDS rep
IDS pre
IDS rep E
IDS pre E

Environmental Frame Results
0
0.1
0.2
0.3
0.4
0.5
0.6
0.7
0.8
0.9
1
Block 1 Block 2 Block 3 Block 4
Inve
stm
ent
Pro
po
rtio
n
IDS rep
IDS pre
IDS rep E
IDS pre E

Conclusion Environmental framing may not have a
significant effect on investment rates

Study 4Question: How does precommitment affect
investment rates in a deterministic prisoners dilemma

IDD payoff matrixYour Counterpart
INVEST NOT INVEST
You INVEST - You lose 1,400 Rp.- Your counterpart loses 1,400 Rp.
- You lose 1,800 Rp. - Your counterpart loses 1,200 Rp.
NOT INVEST
- You lose 1,200 Rp.- Your counterpart loses 1,800 Rp.
- You lose 1,600 Rp.- Your counterpart loses 1,600 Rp.

PD: Repeated vs Precommitted
0
0.1
0.2
0.3
0.4
0.5
0.6
0.7
0.8
0.9
1
Block 1 Block 2 Block 3 Block 4
Investm
en
t P
rop
ort
ion
PD repPD pre

PD: Repeated vs Precommitted
0
0.1
0.2
0.3
0.4
0.5
0.6
0.7
0.8
0.9
1
Block 1 Block 2 Block 3 Block 4
Investm
en
t P
rop
ort
ion
PD repPD pre

Conclusion Precommitment reduces investment rates in
deterministic social dilemmas Why? Perhaps individuals realize there is no
opportunity for reciprocity and are worried about being a sucker

Summary Precommitment lowers cooperation in
regular prisoner’s dilemma, but raises it in interdependent security situations
Why? ◦ In IDS, precommitment raises subjective
probability of loss ◦ In IDS, people are risk averse when making
intertemporal choices◦ In deterministic PD, precommitment removes the
possibility of reciprocity

86
Is this project worth pursuing? What would you recommend for next steps? What journals would you target?
Questions

3. Framing energy costs to promote energy efficiency
and sustainability
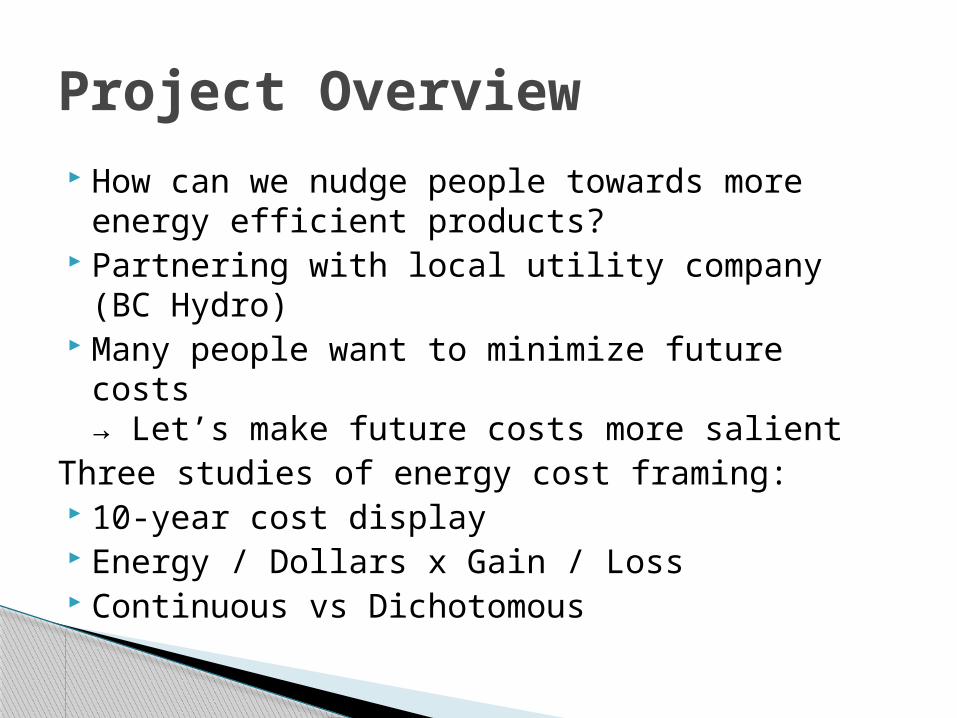
Project Overview How can we nudge people towards more
energy efficient products? Partnering with local utility company (BC
Hydro) Many people want to minimize future costs
→ Let’s make future costs more salientThree studies of energy cost framing: 10-year cost display Energy / Dollars x Gain / Loss Continuous vs Dichotomous

People
Dale Griffin Yoonji Shim

Study 1 methods
Price: $999.95 Estimated
Electricity Use (W): 121
Standby energy consumption: 0.2w
Brand: Samsung Size: 50” Resolution: 1080p
Price: $749.95 Estimated
Electricity Use (W): 181
Standby energy consumption: 0.4w
Brand: Samsung Size: 50” Resolution: 1080p

Study 1 methods
Price: $999.95 10-year estimated
cost: $600 Estimated Electricity
Use (W): 121 Standby energy
consumption: 0.2w Brand: Samsung Size: 50” Resolution: 1080p
Price: $749.95 10-year estimated
cost: $1,000 Estimated Electricity
Use (W): 181 Standby energy
consumption: 0.4w Brand: Samsung Size: 50” Resolution: 1080p

Price: $629.99 Estimated Yearly
Electricity Use (kWh): 169
Model: 4.5 Cu. Ft. 9 cycle Top Load Washer
Brand: Samsung
Price: $899.99 Estimated Yearly
Electricity Use (kWh): 150
Model: 4.8 Cu. Ft. 13 cycle Top Load Washer
Brand: Whirlpool

Price: $629.99 10-year estimated cost:
$180 Estimated Yearly
Electricity Use (kWh): 169
Model: 4.5 Cu. Ft. 9 cycle Top Load Washer
Brand: Samsung
Price: $899.99 10-year estimated cost:
$100 Estimated Yearly
Electricity Use (kWh): 150
Model: 4.8 Cu. Ft. 13 cycle Top Load Washer
Brand: Whirlpool

Study 1 Results: "Clean" Products
TV Oven Computer Monitor
Vacuum0
0.1
0.2
0.3
0.4
0.5
0.6
0.7
0.8
0.9
1 Control10-year cost
Pro
port
ion
ch
oosin
g t
he
en
erg
y e
fficie
nt
op
tion

Study 1 Results: Real Products
Heater Lightbulb Furnace Washing Machine
0
0.1
0.2
0.3
0.4
0.5
0.6
0.7
0.8
0.9 Control10-year cost
Pro
port
ion
ch
oosin
g t
he
en
erg
y e
fficie
nt
op
tion

Study 1: Why? Not discount rates or environmental
attitudes◦ (These predict choices, but are not affected by
our manipulation.) Goal activation? Cost under-estimation? Increased time horizon?

97
Sample: BC Hydro customers See if the effect replicates Test why it works:
◦ Improved estimation◦ Goal activation◦ Time horizon
URLs: ◦ 10-year cost: https://
www.yourpowerpoll.ca/R.aspx?a=364&t=1 ◦ Control: https://
www.yourpowerpoll.ca/R.aspx?a=365&t=1
Study 2: Overview

98
Study 2: Choice Results

99
If you were purchasing a new [furnace], what product features would be most important to you? Please be as specific as possible.
Most important: ________________Second most important: ________________Third most important: ________________
Study 2: Goal activation

100
Study 2: Goal Activation Results
101
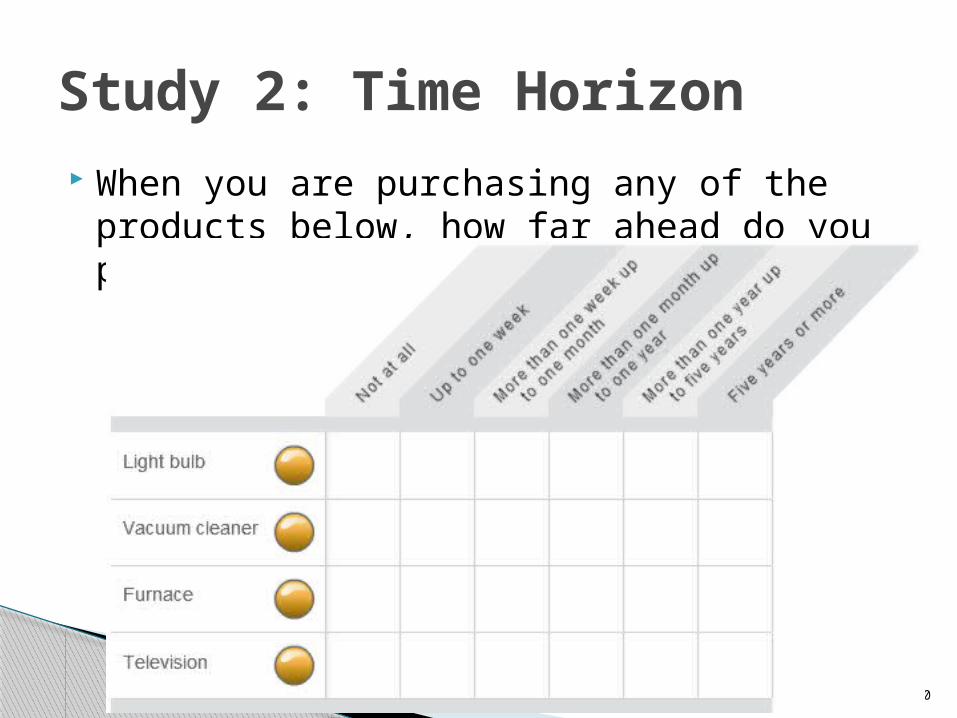
When you are purchasing any of the products below, how far ahead do you plan?
Study 2: Time Horizon
102
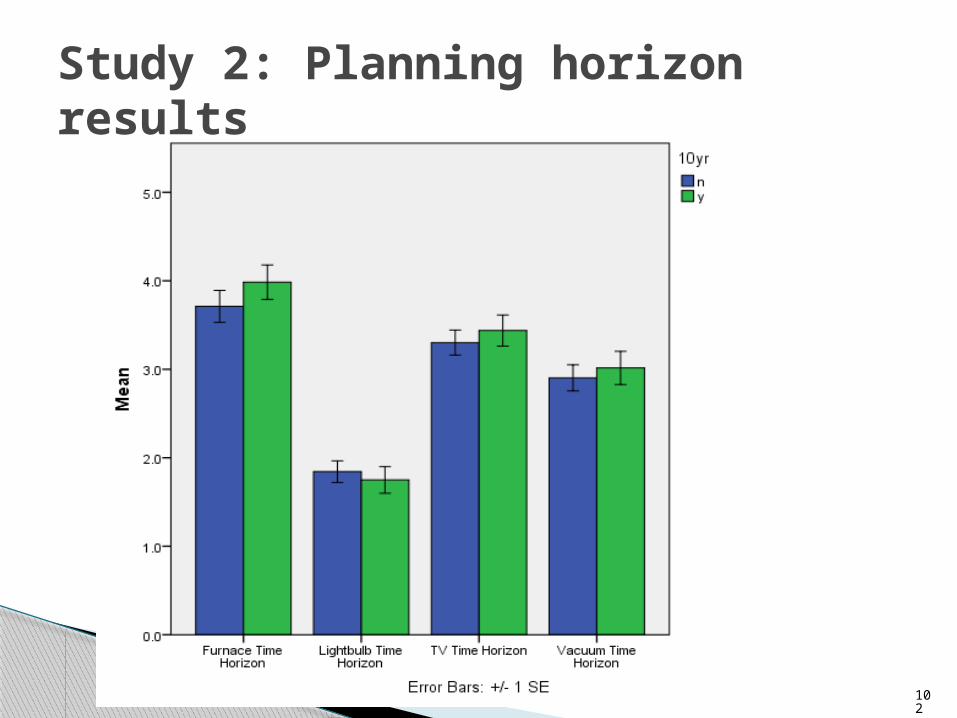
Study 2: Planning horizon results

103
Please imagine that you purchased this [furnace] for use in your home:
Study 2: Cost estimation
How much do you estimate you would spend on energy to use this furnace in your home, over a period of 10 years?
$_______________

104
Study 2: Cost estimation results

105
Study 2: Cost estimation results

Study 3: Methods
Price: $764.99 Estimated Annual Dollars
[Energy] Saved [Wasted]: $27 [259 kWh]
Interior Capacity: Up to 16 place settings
Dishwasher Type: Full-size built-in
Brand: Bosch
Price: $649.99 Estimated Annual Dollars
[Energy] Saved [Wasted]: $0 [279 kWh]
Interior Capacity: Up to 14 place settings
Dishwasher Type: Full-size built-in
Brand: LG

Study 3: Results (Real)
Cost Saved$650
$660
$670
$680
$690
$700
$710
$720
$730
$740
$750 MoneyEnergy
Willin
gn
ess t
o P
ay f
or
En
erg
y E
fficie
nt
Dis
h-
wash
er

Going forward Further explore mediators Compare with & against existing methods
(social norms, defaults, etc) Field studies & implementation

109
1. When making intertemporal decisions, people avoid uncertainty
2. In interdependent games under uncertainty, precommitment can raise investment rates
3. You can nudge consumers towards energy efficient options by making future operational costs salient on labels
Review

Thank You!