TIMBER NOTICE OF SALE SALE NAME: OPIN HARDWOODS …
16
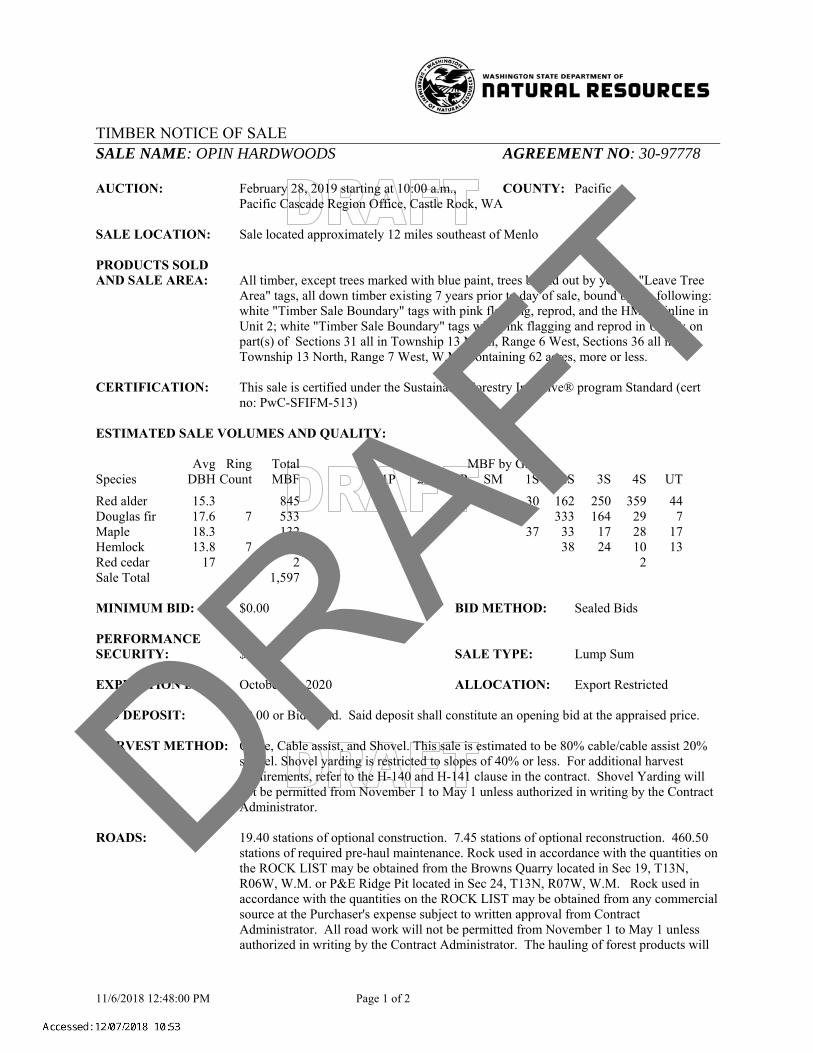
TIMBER NOTICE OF SALE 11/6/2018 12:48:00 PM Page 1 of 2 SALE NAME: OPIN HARDWOODS AGREEMENT NO: 30-97778 AUCTION: February 28, 2019 starting at 10:00 a.m., COUNTY: Pacific Pacific Cascade Region Office, Castle Rock, WA SALE LOCATION: Sale located approximately 12 miles southeast of Menlo PRODUCTS SOLD AND SALE AREA: All timber, except trees marked with blue paint, trees bound out by yellow "Leave Tree Area" tags, all down timber existing 7 years prior to day of sale, bound by the following: white "Timber Sale Boundary" tags with pink flagging, reprod, and the HM-Mainline in Unit 2; white "Timber Sale Boundary" tags with pink flagging and reprod in Unit 3; on part(s) of Sections 31 all in Township 13 North, Range 6 West, Sections 36 all in Township 13 North, Range 7 West, W.M., containing 62 acres, more or less. CERTIFICATION: This sale is certified under the Sustainable Forestry Initiative® program Standard (cert no: PwC-SFIFM-513) ESTIMATED SALE VOLUMES AND QUALITY: Avg Ring Total MBF by Grade Species DBH Count MBF 1P 2P 3P SM 1S 2S 3S 4S UT Red alder 15.3 845 30 162 250 359 44 Douglas fir 17.6 7 533 333 164 29 7 Maple 18.3 132 37 33 17 28 17 Hemlock 13.8 7 85 38 24 10 13 Red cedar 17 2 2 Sale Total 1,597 MINIMUM BID: $0.00 BID METHOD: Sealed Bids PERFORMANCE SECURITY: $0.00 SALE TYPE: Lump Sum EXPIRATION DATE: October 31, 2020 ALLOCATION: Export Restricted BID DEPOSIT: $0.00 or Bid Bond. Said deposit shall constitute an opening bid at the appraised price. HARVEST METHOD: Cable, Cable assist, and Shovel. This sale is estimated to be 80% cable/cable assist 20% shovel. Shovel yarding is restricted to slopes of 40% or less. For additional harvest requirements, refer to the H-140 and H-141 clause in the contract. Shovel Yarding will not be permitted from November 1 to May 1 unless authorized in writing by the Contract Administrator. ROADS: 19.40 stations of optional construction. 7.45 stations of optional reconstruction. 460.50 stations of required pre-haul maintenance. Rock used in accordance with the quantities on the ROCK LIST may be obtained from the Browns Quarry located in Sec 19, T13N, R06W, W.M. or P&E Ridge Pit located in Sec 24, T13N, R07W, W.M. Rock used in accordance with the quantities on the ROCK LIST may be obtained from any commercial source at the Purchaser's expense subject to written approval from Contract Administrator. All road work will not be permitted from November 1 to May 1 unless authorized in writing by the Contract Administrator. The hauling of forest products will DRAFT
Transcript of TIMBER NOTICE OF SALE SALE NAME: OPIN HARDWOODS …
TIMBER NOTICE OF SALE
11/6/2018 12:48:00 PM Page 1 of 2
SALE NAME: OPIN HARDWOODS AGREEMENT NO: 30-97778 AUCTION: February 28, 2019 starting at 10:00 a.m., COUNTY: Pacific Pacific Cascade Region Office, Castle Rock, WA SALE LOCATION: Sale located approximately 12 miles southeast of Menlo PRODUCTS SOLD AND SALE AREA: All timber, except trees marked with blue paint, trees bound out by yellow "Leave Tree
Area" tags, all down timber existing 7 years prior to day of sale, bound by the following: white "Timber Sale Boundary" tags with pink flagging, reprod, and the HM-Mainline in Unit 2; white "Timber Sale Boundary" tags with pink flagging and reprod in Unit 3; on part(s) of Sections 31 all in Township 13 North, Range 6 West, Sections 36 all in Township 13 North, Range 7 West, W.M., containing 62 acres, more or less.
CERTIFICATION: This sale is certified under the Sustainable Forestry Initiative® program Standard (cert
no: PwC-SFIFM-513) ESTIMATED SALE VOLUMES AND QUALITY: Avg Ring Total MBF by Grade Species DBH Count MBF 1P 2P 3P SM 1S 2S 3S 4S UT
Red alder 15.3 845 30 162 250 359 44 Douglas fir 17.6 7 533 333 164 29 7 Maple 18.3 132 37 33 17 28 17 Hemlock 13.8 7 85 38 24 10 13 Red cedar 17 2 2 Sale Total 1,597 MINIMUM BID: $0.00 BID METHOD: Sealed Bids PERFORMANCE SECURITY: $0.00 SALE TYPE: Lump Sum EXPIRATION DATE: October 31, 2020 ALLOCATION: Export Restricted BID DEPOSIT: $0.00 or Bid Bond. Said deposit shall constitute an opening bid at the appraised price. HARVEST METHOD: Cable, Cable assist, and Shovel. This sale is estimated to be 80% cable/cable assist 20%
shovel. Shovel yarding is restricted to slopes of 40% or less. For additional harvest requirements, refer to the H-140 and H-141 clause in the contract. Shovel Yarding will not be permitted from November 1 to May 1 unless authorized in writing by the Contract Administrator.
ROADS: 19.40 stations of optional construction. 7.45 stations of optional reconstruction. 460.50
stations of required pre-haul maintenance. Rock used in accordance with the quantities on the ROCK LIST may be obtained from the Browns Quarry located in Sec 19, T13N, R06W, W.M. or P&E Ridge Pit located in Sec 24, T13N, R07W, W.M. Rock used in accordance with the quantities on the ROCK LIST may be obtained from any commercial source at the Purchaser's expense subject to written approval from Contract Administrator. All road work will not be permitted from November 1 to May 1 unless authorized in writing by the Contract Administrator. The hauling of forest products will
DRAFT

TIMBER NOTICE OF SALE
11/6/2018 12:48:00 PM Page 2 of 2
not be permitted from November 1 to May 1 unless authorized in writing by the Contract Administrator.
ACREAGE DETERMINATION CRUISE METHOD: The sale acres were determined by GPS delineation. Cruise was completed using variable
plot cruise methods. FEES: $27,100.00 is due on day of sale. $9.00 per MBF is due upon removal. These are in
addition to the bid price. SPECIAL REMARKS: This sale contains an estimated 83 MBF of high quality DF 2 saw, 23 MBF of high
quality DF 3 saw derived from the cruise, see cruise for details. There are 2 cattle guard Installations and a gate re install associated with this proposal see road plan for details. See driving map for gate locations. PCP 1-1 gate keys may be obtained from the Pacific Cascade Region office.
DRAFT

>>
>
>>
>
>
>
> > >>>>>>
>>
>
>>
>
>>
>>> >
>>
> >>
>
>>
>
>
>>>
>>
>
>>
> >
>>
>>
>
>>
>>
>>
>
>>
>>
>
>>
>>
>
>
>>
>>
>>>
>>
>
>>
> > >>
>
>>
>
>
>
>
>
>
>>
>
>>
>
>>
>
>
>>
>>
> >>>> >>> >
>>
>>
>>
>
>>>
>>
>>
>
>>
>>>
>>
> >>
> >
>>
>
>
>
>
>
>
>>>> > >
>>>
>
>>>>
>>>
>
>
>
>>
>
>>
>>
>
>
>
> > >
>>>
>
>>
>>
>>
>
>
>
>>
>>
>>
>>>>
>>
> >> >
>
>
>>
>>
>>
>
>>
>
>>>>
>>
>>
>
>
>
>>
>
>>
>>
>>>
>>
>
>
>>
>
>
>>
>
>> >
>
> >
>>
>> > >
>>
>>
>
>>
>> > >>>
>>
>>
>
>
>
>>
>
>>
>>
>>
>>
>
>>
>>
>
>>
>>>>
>>
>>>
>>
> >>
>>
>
>
>>>>>>
>>>
>>
>
>
>> >
>>
>>
> >>
>
>>
>>
>
>>
>>
>
>>
>
>>
>>
>
>
>
>> >>>>
>
>>
>
>>
>
>>
>>
>
>> >
>
>
>
> >> >
>>
>
>>
>>
>>
> >>>
>>
>>
>>
>
>>
>
>>
>
>>>>
>>
>>
>>
>>
>
>>
>>
>>
>>>>
>>>>
>
>>
>
>>
>>
>>
>>>>
>>
> >
>>>>
>
>
>
>
>
>>
>>
>
>>
>>
>>>>>>>>>>>>>>>>
>>
>>
> >
>
>>
>
>
>>
>>
>
>>
>>
>>
> >
>>>
>
>>>
>>
>>
>>
>>
>>
>
> >
>
>
>>
>>
>
>>
> >>
>>
> >
>>
>
>>
>>
>>>
>
>>
>>
>
>>
>
>
>
>
>
> >
>
~~~~ ~~~~~~~ ~ ~
~~~ ~ ~ ~~~~~~~~~
~ ~ ~ ~~~ ~
~ ~~~ ~
~~~~~~~~~~~
~ ~ ~ ~ ~ ~~~ ~ ~
~~~ ~ ~~
~~¦¦
~ ~¦
¦
~
~
¦
¦
~~~~~~~~ ~ ~ ~ ~ ~ ~ ~~
~
~
¦
¦
~~ ¦
¦
~~
~~¦¦ ¦
¦
\\\
"
"
"
"
"
"
""
k
k
k
kk
k
]%5
]%5]%5
]%5
]%5
]%5
]%5
]%5
]%5
]%5]%5
]%5]%5
]%3]%3
]%3
]%3
]%3
]%4
]%3
]%3
]%4
]%5]%5
k
]%5
]%5
]%5
]%5]%5
]%3
k
k
kk
k
]%5
k k]%4
o
o
o
o
o
o
o
o
o
o
36 311 6
T13N
T12N
R07W
R06W
Pe nn y C reek
P e nn y Creek
HM-1509
HM-Mainline
HM-1200
HM-1100
H M-1300HM-130 0 Ext.
HM-1500
R07W
R06W
HM-Mainli n e
Unit 256 AcresHM-1310
36 311 6
T13N
T12N
R07W
R06W
Pe nn y C reekHM-1509
HM-Mainline
HM-1200
HM-1100
H M-1300HM-130 0 Ext.
HM-1500
R07W
R06W
HM-1310
Unit 36 Acres
Private
123°28.5'W
123°28.5'W
123°29'W
123°29'W
123°29.5'W
123°29.5'W
46°34
.5'N
46°34
.5'N
46°34
'N
46°34
'N
46°33
.5'N
46°33
.5'N
T I M B E R S A LE MAPS A L E N AME:A G R E E M ENT #:T O W N S H IP(S):T R U S T (S):
R E G ION:C O U N T Y(S):E L E VAT I ON RGE:
30-097778
³Prepared By:
0 1,000 2,000 3,000500 Feet
dsch490 Modification Date: dsch490 9/10/2018
Variable Retention Harvest""" """ """ """ """" """ """ """ """" """ """ """ """" """ """ """ """" """ """ """ """" """ """ """ """" """ """ """ """" """ """ """ "
Leave Tree AreaRiparian Mgt Zone
~ ~ ~ Sale Boundary Tags~ ~ ~¦ ¦ ¦ Leave Tree Tags
Timber Type Change
Existing RoadsRequired Pre-Haul MaintenanceOptional Construction
\ Optional Reconstruction
> > Streams]% Stream Typek Stream Type Break" Survey Monumento Leave Tree
Pacific Cascade RegionOPIN HARDWOODS
T13R6W, T13R7W 335-815Pacific
Capitol Grant (7), Common School and Indemnity (3)
All State Unless Otherwise NotedDRAFT
")
")
")
")")
")
!
)
!
!
)!
!
â
!
1
1
!
!
^
¬«6
¬«6
P&E-Mainline1.2 mi.
P&E Ridge Pit
HM-Mainline0.1 mi.
15.7 miles to Hwy 101from HM-Mainline
35.6 miles to I-5from HM-Mainline
P&E-Mainline0.9 mi.
P&E-30000.4 mi.
P&E-Mainline
MC-8400
BrownsQuarry
HM-Mainline0.2 mi.
Frances
HM-27001.0 mi.
HM-Mainline3.2 mi.HM-1200
0.6 mi.
HM-Mainline0.5 mi.
HM-Mainline2.1 mi.
HM-Mainline0.3 mi.
HM-Mainline
HM-2200
HM-2000
HM-200
HM-Mainline0.3 mi.
HM-Mainline2.9 mi.
HM-Mainline3.2 mi.
HM-27001.0 mi.
P&E-Mainline0.9 mi.
P&E-Mainline1.2 mi.
P&E-30000.4 mi.
P&E Ridge Pit Browns Quarry
P&E-Mainline
HM-2200
HM-2000
HM-Mainline
MC-8400
HM-1200
HM-1500
Frances
15.7 miles to Hwy 101from HM-Mainline
35.6 miles to I-5from HM-Mainline
HM-200
15
1817 19
1620
D R I V I N G MAPS A L E N AME:A G R E E M ENT#:T O W N S H IP(S):T R U S T (S):
R E G ION:C O U N T Y(S):E L E VAT I ON RGE:
OPIN HARDWOODS
³Prepared By:
Pacific Cascade Region
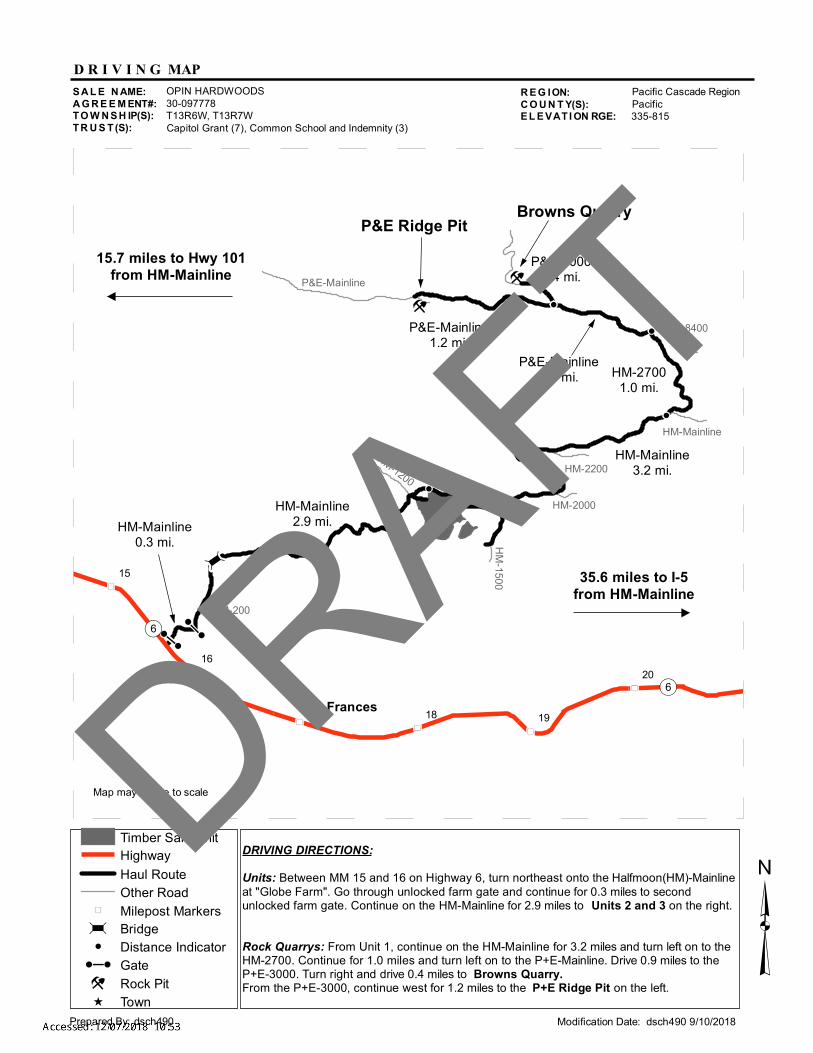
DRIVING DIRECTIONS:Units: Between MM 15 and 16 on Highway 6, turn northeast onto the Halfmoon(HM)-Mainlineat "Globe Farm". Go through unlocked farm gate and continue for 0.3 miles to secondunlocked farm gate. Continue on the HM-Mainline for 2.9 miles to Units 2 and 3 on the right.
Rock Quarrys: From Unit 1, continue on the HM-Mainline for 3.2 miles and turn left on to theHM-2700. Continue for 1.0 miles and turn left on to the P+E-Mainline. Drive 0.9 miles to theP+E-3000. Turn right and drive 0.4 miles to Browns Quarry.From the P+E-3000, continue west for 1.2 miles to the P+E Ridge Pit on the left.
dsch490 Modification Date: dsch490 9/10/2018
Timber Sale UnitHighwayHaul RouteOther Road
") Milepost Markersâ Bridge! Distance Indicator
)! ! Gate1 Rock Pit^ Town
30-097778T13R6W, T13R7W
Pacific335-815
Capitol Grant (7), Common School and Indemnity (3)
Map may not be to scaleDRAFT

j:\forms\pre-sales\CRUISE-Narrative.doc Revised: 2/17/2000
Cruise Narrative
Sale Name: Opin Hardwoods
Region: Pacific Cascade
App. #: 30-
District: Lewis
Lead Cruiser: A.Herrman
Completion date: 7-31-2017
Other Cruisers: D.Worlock
Unit acreage specifications:
Unit #
Cruised acres
Cruised acres agree with sale acres? Yes/No
If acres do not agree explain why.
2 56 YES 2 6 YES
Total 62 YES Unit cruise specifications:
Unit #
Sample type (VP, FP, ITS,100%)
Expansion factor (BAF, full/ half)
Sighting height (4.5 ft, 16 ft.)
Grid size (Plot spacing or % of area)
Plot ratio (Cru./Tally)
Total number of plots
2 VP 46.94 4.5’ 250’ x 250’ 1:1 39 3 VP 46.94 4.5’ 250’ X 250’ Cruise all 6
Sale/Cruise Description:
Minor species cruise intensity: Cruised on appropriate plots. Minimum cruise spec: 40% 0f Form- Factor at 16 feet D.O.B or 5 inch Top, and merchantable top. Avg. ring count by sp: DF = 10 WH = NA SS = NA Leave/take tree description: Leave tree clumps are bounded with yellow “Leave Tree Area” tags and pink
flagging, individual leave trees are marked with a single band of blue paint. Sort Description: HA– Logs meeting the following criteria: Surface characteristics for a high
quality A sort will have sound tight knots not to exceed 1 ½” in diameter, numbering not more than an average of one per foot of log length. May include logs with not more than two larger knots. Knots and knot indicators ½” in diameter and smaller shall not be a determining factor. Logs will have a growth ring count of 6 or more rings per inch in the outer third top end of the log. (min dia 8”.) HB – Logs meeting the following criteria: Surface characteristics for a B sort will have sound tight knots not to exceed 1 ½” in diameter. May include logs with not more than two larger knots up to 2 ½” in diameter. Logs will have a growth ring count of 6 or more rings per inch in the outer third to end of the log. (min dia 8”.) R – Logs meeting the following criteria: Gross diameter of 12 inches or greater, excessive knots greater than 2 ½ inches with recovery less than 65% of the net scale.
Field observations:
Opin hardwoods timber sale contains 2 units. Breakdown by unit is as follows: Unit 2 (56 acres) contains a total volume of 1,369 mbf and averages 24,449 bf/acre. Board-foot composition is 55% Red Alder, 31% Douglas Fir, and 9% Big Leaf Maple. Average diameter is 15.7”. Average bole height is 69’.
DRAFT

j:\forms\pre-sales\CRUISE-Narrative.doc Revised: 2/17/2000
Defect averages 8.1%. Unit 3 (6 acres) contains a total volume of 227 mbf and averages 37,913 bf/acre. Board-foot composition is 41% Red Alder, 49% Douglas Fir, and 5% Big Leaf Maple. Average diameter is 17.9”. Average bole height is 80’. Defect averages 7.3%.
Grants: Prepared by: K.B Title: Timber Cruiser
DRAFT

Species, Sort Grade - Board Foot Volumes (Project)PSPCSTGRTC
Project:
Acres
CLOESD
62.00
Page 1
Date 9/27/2018
Time 4:11:27PM
T12N R07W S01 Ty00U2 56.00
T12N R07W S01 Ty00U3 6.00
Net Bd. Ft. per AcreTotal
Ln
Log Scale Dia.
Percent of Net Board Foot Volume Average Log
Per
Logs
T
S
Spp Def% Gross NetNet MBF Ft /Acre
BdFt
%
So Gr
5-7 8-1112-15 16+ 12-20 36-9931-3521-30
Lf
CF/Bd
Ft
rt ad
Log Length
In
Dia
RA CU CU 436 100.0 35.3 5 0.00 7
RA D UT 5 711 44 100 49 20 34.9 711 51 18 0.25 5
RA D 1S 3 501 29 5.7 100 47 402 1.2 472 53 35 3.02 18
RA D 2S 19 2,770 162 5.9 100 12 34 164 15.9 2,606 54 31 1.54 13
RA D 3S 30 4,315 250 6.6 100 10 5 52 119 33.9 4,031 34 32 1.10 10
RA D 4S 21 3,074 180 5.8 100 14 1 48 66 44.0 2,895 37 31 0.72 8
RA D 4S 22 3,028 181 3.7 100 8 18 27 33 87.2 2,914 47 29 0.39 6
27 43RA Totals 53 8.1 14,834 13,630 845 51 19 3 12 5 40 25 54 252.3 0.66 7
WH CU CU 143 100.0 3.8 2 0.00 8
WH D 2S 44 649 38 6.4 41 59 27 43 327 1.9 608 31 33 2.21 16
WH D 3S 29 401 24 2.4 27 73 98 88 4.4 391 2 39 0.86 8
WH D 4S 11 161 10 100 30 5.4 161 100 30 0.29 5
WH D UT 16 207 13 100 9 56 33 6.3 207 35 30 0.39 5
35 31WH Totals 5 12.4 1,562 1,367 85 21 18 26 1 12 55 27 63 21.8 0.68 7
BM CU CU 126 100.0 5.2 13 0.00 9
BM D UT 13 280 17 56 4 40 31 36 7.7 280 69 20 0.47 6
BM D 1S 28 652 37 8.9 100 91 316 1.9 594 9 21 3.97 20
BM D 2S 24 609 33 13.5 100 28 26 142 3.7 526 46 28 1.59 13
BM D 3S 14 335 17 16.6 100 27 31 91 3.1 279 43 27 1.25 10
BM D 4S 15 386 21 12.0 100 46 36 51 6.7 339 18 26 0.65 8
BM D 4S 6 136 7 21.5 100 29 3.7 107 100 27 0.48 6
12 37BM Totals 8 15.8 2,523 2,126 132 30 25 33 47 16 23 66 32.0 0.91 9
DF CU CU 1.4 0.00 7
DF HB 2S 15 1,371 83 2.5 42 58 100 361 3.7 1,337 38 2.15 15
DF HB 3S 4 363 23 100 77 116 3.1 363 23 31 0.94 10
DF D 2S 47 4,358 251 7.0 35 65 0 99 376 10.8 4,053 1 39 2.23 16
DF D 3S 27 2,373 141 4.3 29 71 1 7 90 88 25.9 2,271 1 37 0.64 8
DF D 4S 5 471 29 100 13 14 25 18.5 471 72 26 0.26 5
DF D UT 2 107 7 88 12 100 12 9.2 107 13 0.23 5
14 6DF Totals 33 4.9 9,042 8,602 533 23 23 39 2 3 89 30 118 72.6 0.95 8
RC D 4S 100 28 2 100 100 40 .7 28 36 0.95 5
100RC Totals 0 28 28 2 100 36 40 .7 0.95 5
Totals 1,597 38 22 21 19 11 29 4 55 26 68 379.4 8.0 25,752 27,988 0.75 8DRAFT

TC PSTATS
CLOESDPROJECT
PLOTS TREESACRES
1
DATE
233 45 62.00
9/27/2018
RGE SC TRACT TYPETWP
12N 07 01 CLOESD 00U2
12N 07W 01 CLOESD 00U3
PROJECT STATISTICSPAGE
CuFt BdFt
S W
ESTIMATED PERCENT
TREES TOTAL SAMPLE
PER PLOT TREES TREESPLOTS TREES
TOTAL 45 233 5.2
CRUISE 28 139 5.0 10,946 1.3
DBH COUNT
REFOREST
COUNT 16 87 5.4
BLANKS 1
100 %
STAND SUMMARY
SAMPLE TREES AVG BOLE REL BASAL GROSS GROSS NETNET
TREES /ACRE DBH LEN DEN AREA BF/AC BF/AC CF/AC CF/AC
81 113.4 15.3 70 144.4 14,834 4,200R ALDER 13,630 4,283 36.9
28 32.7 17.6 81 55.1 9,042 2,093DOUG FIR 8,602 2,093 13.1
20 14.3 18.3 63 26.2 2,523 665BL MAPLE 2,126 692 6.1
9 15.4 13.8 50 16.0 1,562 405WHEMLOCK 1,367 425 4.3
1 .7 17.0 38 1.1 28 24WR CEDAR 28 24 0.3
139 176.6 15.9 69 242.7 7,517 27,988 25,752 7,387TOTAL
CONFIDENCE LIMITS OF THE SAMPLE
TIMES OUT OF 100 THE VOLUME WILL BE WITHIN THE SAMPLE ERROR 68.1
60.9
COEFFSAMPLE TREES - BF
SD:
INF. POP.# OF TREES REQ.
VAR.% S.E.% LOW AVG HIGH 5 10 15
CL
1.0
68.1
58.1 6.5 145 155 165R ALDER
88.5 17.0 616 743 869DOUG FIR
74.6 17.6 220 267 314BL MAPLE
150.8 53.2 156 334 512WHEMLOCK
WR CEDAR
11.4 266 300 335 723 181 80TOTAL 134.5
COEFFSAMPLE TREES - CF
SD:
INF. POP.# OF TREES REQ.
VAR.% S.E.% LOW AVG HIGH 5 10 15
CL
1.0
68.1
57.8 6.4 44 47 51R ALDER
77.4 14.9 139 163 188DOUG FIR
62.2 14.7 68 80 92BL MAPLE
127.5 45.0 43 78 113WHEMLOCK
WR CEDAR
8.9 70 77 84 437 109 49TOTAL 104.6
COEFFTREES/ACRE
SD:
INF. POP.# OF PLOTS REQ.
VAR.% S.E.% LOW AVG HIGH 5 10 15
CL
1.0
68.1
90.0 13.4 98 113 129R ALDER
178.9 26.6 24 33 41DOUG FIR
210.5 31.4 10 14 19BL MAPLE
259.3 38.6 9 15 21WHEMLOCK
670.8 99.9 0 1 1WR CEDAR
8.0 162 177 191 116 29 13TOTAL 53.9
COEFFBASAL AREA/ACRE
SD:
INF. POP.# OF PLOTS REQ.
VAR.% S.E.% LOW AVG HIGH 5 10 15
CL
1.0
68.1
84.1 12.5 126 144 162R ALDER
162.6 24.2 42 55 68DOUG FIR
206.0 30.7 18 26 34BL MAPLE
242.9 36.2 10 16 22WHEMLOCK
670.8 99.9 0 1 2WR CEDAR
6.9 226 243 260 86 21 10TOTAL 46.4
DRAFT

TC PSTATS
CLOESDPROJECT
PLOTS TREESACRES
2
DATE
233 45 62.00
9/27/2018
RGE SC TRACT TYPETWP
12N 07 01 CLOESD 00U2
12N 07W 01 CLOESD 00U3
PROJECT STATISTICSPAGE
CuFt BdFt
S W
COEFFNET BF/ACRE
SD:
INF. POP.# OF PLOTS REQ.
VAR.% S.E.% LOW AVG HIGH 5 10 15
CL
1.0
68.1
86.1 12.8 11,881 13,630 15,379R ALDER
168.2 25.0 6,447 8,602 10,756DOUG FIR
221.5 33.0 1,425 2,126 2,827BL MAPLE
232.8 34.7 893 1,367 1,842WHEMLOCK
670.8 99.9 0 28 55WR CEDAR
7.7 23,764 25,752 27,740 107 27 12TOTAL 51.8
COEFFNET CUFT FT/ACRE
SD:
INF. POP.# OF PLOTS REQ.
VAR.% S.E.% LOW AVG HIGH 5 10 15
CL
1.0
68.1
86.1 12.8 3,662 4,200 4,739R ALDER
166.7 24.8 1,574 2,093 2,613DOUG FIR
219.8 32.7 447 665 882BL MAPLE
234.7 35.0 263 405 546WHEMLOCK
670.8 99.9 0 24 47WR CEDAR
7.2 6,852 7,387 7,921 94 24 10TOTAL 48.6
COEFFV_BAR/ACRE
SD:
INF. POP.# OF PLOTS REQ.
VAR.% S.E.% LOW AVG HIGH 5 10 15
CL
1.0
68.1
25.6 3.8 82 94 106R ALDER
91.7 13.7 117 156 195DOUG FIR
201.0 29.9 54 81 108BL MAPLE
149.9 22.3 56 86 115WHEMLOCK
670.8 99.9 0 25 51WR CEDAR
7.7 98 106 114 107 27 12TOTAL 51.8
DRAFT

Species, Sort Grade - Board Foot Volumes (Type)TSPCSTGRT
CLOESDProject:
1Page
9/27/2018Date
4:11:28PMTime
T12N R07W S01 T00U2T12N R07W S01 T00U2
PlotsAcresTypeTractSecRgeTwp
109 39 56.0000U2CLOESD0107W12N
CuFt BdFt
S W
Sample Trees
Net Bd. Ft. per AcreTotal
Ln Dia Bd Log Length
Percent Net Board Foot Volume Average Log
Per
Logs
T
S
Spp Def% Gross Net Net MBF Ft In Ft /AcreBdFt
%
rt ad
Grade
5-7 16+ 12-20 21-30 31-35 36-998-11 12-15
Log Scale Dia.
Lf
CF/So Gr
RA CU CU 476 100.0 5 38.2 0.00 7
RA DM UT 5 720 40 100 44 56 19 21 34.4 720 0.25 5
RA DM 1S 3 460 26 100 46 54 35 400 1.1 460 2.88 17
RA DM 2S 20 2,749 145 6.0 100 12 57 31 30 162 15.9 2,584 1.55 13
RA DM 3S 29 4,257 223 6.5 100 10 30 5 54 32 119 33.4 3,980 1.10 10
RA DM 4S 20 2,831 149 5.8 100 13 40 1 46 31 65 41.2 2,667 0.72 8
RA DM 4S 23 3,147 170 3.6 100 7 45 19 29 30 34 89.4 3,034 0.40 6
RA Totals 55 8.2
14,640 13,444 753 28 49 19 3 12 43 40 25 53
253.6 6 0.66 7
DF CU CU 1.5 0.00 7
DF HB 2S 16 1,278 70 2.4 50 50 100 38 342 3.6 1,247 2.07 15
DF HB 3S 5 402 23 100 23 77 31 116 3.5 402 0.94 10
DF DM 2S 39 3,180 164 7.6 40 60 1 99 38 337 8.7 2,937 2.11 15
DF DM 3S 31 2,417 130 4.2 31 69 2 5 93 37 89 26.1 2,315 0.64 8
DF DM 4S 7 503 28 100 14 71 15 26 26 19.6 503 0.26 5
DF DM UT 2 119 7 88 12 100 13 12 10.2 119 0.23 5
DF Totals 31 4.8
7,898 7,522 421 18 27 24 32 3 6 88 30 103
73.2 3 0.86 8
BM CU CU 118 100.0 12 4.7 0.00 9
BM DM UT 13 289 16 53 4 43 26 74 21 38 7.6 289 0.47 6
BM DM 1S 28 655 34 7.1 100 90 10 21 340 1.8 608 4.22 20
BM DM 2S 26 639 31 13.3 100 24 49 27 29 145 3.8 554 1.61 13
BM DM 3S 12 304 14 18.2 100 33 29 38 27 89 2.8 249 1.32 10
BM DM 4S 15 363 18 11.2 100 53 5 42 25 51 6.3 322 0.67 8
BM DM 4S 6 150 7 21.5 100 100 27 29 4.1 118 0.48 6
BM Totals 9 15.0
2,520 2,141 120 13 27 26 34 47 35 18 23 69
31.2 0.95 9
WH CU CU 158 100.0 2 4.3 0.00 8
WH DM 2S 36 518 27 7.2 57 43 43 37 20 32 274 1.8 481 2.00 15
WH DM 3S 32 433 24 2.5 28 72 100 40 89 4.8 422 0.85 8
WH DM 4S 14 179 10 100 100 30 30 6.0 179 0.29 5
WH DM UT 18 230 13 100 9 35 56 30 33 6.9 230 0.39 5
WH Totals 5 13.6
1,517 1,311 73 40 23 21 16 2 35 49 27 55
23.7 14 0.64 7
RC DM 4S 100 31 2 100 100 36 40 .8 31 0.95 5
RC Totals 0 31 31 2 100 100 36 40
.8 0.95 5
1,369 24 39 21 15 12 30 5 53 26 64 382.4Type Totals 8.1 26,605 24,449 0.72 8
DRAFT

Species, Sort Grade - Board Foot Volumes (Type)TSPCSTGRT
CLOESDProject:
1Page
9/27/2018Date
4:11:28PMTime
T12N R07W S01 T00U3T12N R07W S01 T00U3
PlotsAcresTypeTractSecRgeTwp
32 6 6.0000U3CLOESD0107W12N
CuFt BdFt
S W
Sample Trees
Net Bd. Ft. per AcreTotal
Ln Dia Bd Log Length
Percent Net Board Foot Volume Average Log
Per
Logs
T
S
Spp Def% Gross Net Net MBF Ft In Ft /AcreBdFt
%
rt ad
Grade
5-7 16+ 12-20 21-30 31-35 36-998-11 12-15
Log Scale Dia.
Lf
CF/So Gr
RA CU CU 64 100.0 10 7.8 0.00 6
RA DM UT 4 630 4 100 100 15 16 40.1 630 0.27 5
RA DM 1S 3 882 4 33.3 100 100 30 420 1.4 588 4.30 22
RA DM 2S 19 2,968 17 5.2 100 17 24 59 32 181 15.6 2,812 1.49 13
RA DM 3S 29 4,852 27 7.1 100 7 60 33 32 116 38.9 4,507 1.03 10
RA DM 4S 33 5,338 30 5.9 100 21 21 59 31 71 70.3 5,024 0.68 9
RA DM 4S 12 1,913 11 5.9 100 21 79 24 27 66.5 1,800 0.32 6
RA Totals 41 7.7
16,648 15,362 92 16 62 18 4 18 42 40 26 64
240.6 0.70 8
DF HB 2S 11 2,236 13 2.8 100 100 40 510 4.3 2,174 2.71 18
DF DM 2S 78 15,354 87 5.7 26 74 1 99 40 483 29.9 14,472 2.53 17
DF DM 3S 10 1,961 11 5.1 9 91 18 24 57 34 77 24.2 1,860 0.69 8
DF DM 4S 1 170 1 100 100 23 20 8.5 170 0.24 5
DF Totals 49 5.3
19,721 18,676 112 2 9 20 69 3 94 36 279
66.9 3 1.72 12
BM CU CU 199 100.0 19 10.0 0.00 5
BM DM UT 9 193 1 100 100 17 23 8.3 193 0.43 6
BM DM 1S 23 624 3 26.1 100 100 20 170 2.7 461 2.36 17
BM DM 2S 14 325 2 16.7 100 100 20 100 2.7 271 1.25 13
BM DM 3S 28 616 3 9.1 100 100 30 100 5.6 560 0.97 10
BM DM 4S 26 598 3 16.7 100 100 30 50 10.0 498 0.57 8
BM Totals 5 22.4
2,556 1,984 12 10 53 14 23 47 53 23 51
39.3 0.65 8
WH DM 2S 94 1,877 11 4.5 100 100 40 640 2.8 1,793 3.19 20
WH DM 3S 6 98 1 100 100 21 70 1.4 98 0.97 10
WH Totals 5 4.3
1,975 1,891 11 5 95 5 95 34 450
4.2 2.73 16
227 8 33 18 41 10 21 2 67 27 108 350.9Type Totals 7.3 40,899 37,913 0.97 9DRAFT

TC TSTATS
CLOESD
TWP RGE SECT TYPE
PROJECT
PLOTS TREESACRES
PAGE
DATE
201 39 56.0000U2CLOESD0107W12N
9/27/2018
1STATISTICS
CuFt BdFtTRACT
S W
ESTIMATED PERCENT
TREES TOTAL SAMPLE
PER PLOT TREES TREESPLOTS TREES
TOTAL 39 201 5.2
CRUISE 22 107 4.9 10,090 1.1
DBH COUNT
REFOREST
COUNT 16 87 5.4
BLANKS 1
100 %
STAND SUMMARY
SAMPLE TREES AVG BOLE REL BASAL GROSS GROSS NETNET
TREES /ACRE DBH LEN DEN AREA BF/AC BF/AC CF/AC CF/AC
64 115.1 15.2 69 145.6 14,640 4,188R ALDER 13,444 4,279 37.3
17 33.6 16.8 79 51.8 7,898 1,879DOUG FIR 7,522 1,879 12.6
17 13.9 18.7 63 26.5 2,520 673BL MAPLE 2,141 698 6.1
8 16.9 13.5 50 16.9 1,517 407WHEMLOCK 1,311 429 4.6
1 .8 17.0 38 1.2 31 26WR CEDAR 31 26 0.3
107 180.2 15.7 69 241.9 7,311 26,605 24,449 7,173TOTAL
CONFIDENCE LIMITS OF THE SAMPLE
TIMES OUT OF 100 THE VOLUME WILL BE WITHIN THE SAMPLE ERROR 68.1
61.1
COEFF
SAMPLE TREES - BF
SD: 1.0
INF. POP.# OF TREES REQ.
VAR.% S.E.% LOW AVG HIGH 5 10 15
CL: 68.1
%
57.3 7.2 135 146 156R ALDER
121.3 30.3 359 515 671DOUG FIR
71.7 18.5 234 288 341BL MAPLE
170.2 64.2 74 208 341WHEMLOCK
WR CEDAR
13.1 200 230 260 729 182 81TOTAL 135.1
COEFF
SAMPLE TREES - CF
SD: 1.0
INF. POP.# OF TREES REQ.
VAR.% S.E.% LOW AVG HIGH 5 10 15
CL: 68.1
%
54.0 6.7 43 46 49R ALDER
102.4 25.6 88 119 149DOUG FIR
58.0 15.0 74 87 100BL MAPLE
133.0 50.2 27 53 80WHEMLOCK
WR CEDAR
9.7 58 64 70 399 100 44TOTAL 99.9
COEFF
TREES/ACRE
SD: 1.0
INF. POP.# OF PLOTS REQ.
VAR.% S.E.% LOW AVG HIGH 5 10 15
CL: 68.1
%
86.7 13.9 99 115 131R ALDER
176.9 28.3 24 34 43DOUG FIR
217.9 34.9 9 14 19BL MAPLE
241.5 38.6 10 17 23WHEMLOCK
624.5 99.9 0 1 2WR CEDAR
8.1 166 180 195 102 26 11TOTAL 50.6
COEFF
BASAL AREA/ACRE
SD: 1.0
INF. POP.# OF PLOTS REQ.
VAR.% S.E.% LOW AVG HIGH 5 10 15
CL: 68.1
%
82.3 13.2 126 146 165R ALDER
164.9 26.4 38 52 65DOUG FIR
206.6 33.0 18 26 35BL MAPLE
234.7 37.6 11 17 23WHEMLOCK
624.5 99.9 0 1 2WR CEDAR
7.4 224 242 260 84 21 9TOTAL 45.9
COEFF
NET BF/ACRE
SD: 1.0
INF. POP.# OF PLOTS REQ.
VAR.% S.E.% LOW AVG HIGH 5 10 15
CL: 68.1
%
DRAFT

TC TSTATS
CLOESD
TWP RGE SECT TYPE
PROJECT
PLOTS TREESACRES
PAGE
DATE
201 39 56.0000U2CLOESD0107W12N
9/27/2018
2STATISTICS
CuFt BdFtTRACT
S W
NET BF/ACRE
SD: 1.0
COEFF # OF PLOTS REQ. INF. POP.
VAR. S.E.% LOW AVG HIGH 5 10 15
CL: 68.1
%
86.1 13.8 11,592 13,444 15,297R ALDER
166.8 26.7 5,515 7,522 9,530DOUG FIR
222.6 35.6 1,378 2,141 2,903BL MAPLE
234.2 37.5 820 1,311 1,803WHEMLOCK
624.5 99.9 0 31 61WR CEDAR
8.1 22,474 24,449 26,425 102 25 11TOTAL 50.5
COEFF
NET CUFT FT/ACRE
SD: 1.0
INF. POP.# OF PLOTS REQ.
VAR.% S.E.% LOW AVG HIGH 5 10 15
CL: 68.1
%
85.6 13.7 3,615 4,188 4,762R ALDER
166.9 26.7 1,377 1,879 2,381DOUG FIR
220.4 35.3 435 673 910BL MAPLE
233.5 37.4 255 407 559WHEMLOCK
624.5 99.9 0 26 52WR CEDAR
7.8 6,616 7,173 7,731 94 24 10TOTAL 48.6
COEFF
V-BAR/ACRE
SD: 1.0
INF. POP.# OF PLOTS REQ.
VAR.% S.E.% LOW AVG HIGH 5 10 15
CL: 68.1
%
3.1 .5 80 92 105R ALDER
10.6 1.7 107 145 184DOUG FIR
201.2 32.2 52 81 110BL MAPLE
134.5 21.5 49 78 107WHEMLOCK
624.5 99.9 0 25 51WR CEDAR
31.4 93 101 109 1,542 385 171TOTAL 196.5
DRAFT

TC TSTATS
CLOESD
TWP RGE SECT TYPE
PROJECT
PLOTS TREESACRES
PAGE
DATE
32 6 6.0000U3CLOESD0107W12N
9/27/2018
1STATISTICS
CuFt BdFtTRACT
S W
ESTIMATED PERCENT
TREES TOTAL SAMPLE
PER PLOT TREES TREESPLOTS TREES
TOTAL 6 32 5.3
CRUISE 6 32 5.3 857 3.7
DBH COUNT
REFOREST
COUNT
BLANKS
100 %
STAND SUMMARY
SAMPLE TREES AVG BOLE REL BASAL GROSS GROSS NETNET
TREES /ACRE DBH LEN DEN AREA BF/AC BF/AC CF/AC CF/AC
17 98.0 15.8 76 133.0 16,648 4,313R ALDER 15,362 4,328 33.5
11 25.1 25.1 105 86.1 19,721 4,090DOUG FIR 18,676 4,090 17.2
3 18.3 15.3 63 23.5 2,556 590BL MAPLE 1,984 636 6.0
1 1.4 32.0 104 7.8 1,975 386WHEMLOCK 1,891 386 1.4
32 142.8 17.9 80 250.3 9,440 40,899 37,913 9,379TOTAL
CONFIDENCE LIMITS OF THE SAMPLE
TIMES OUT OF 100 THE VOLUME WILL BE WITHIN THE SAMPLE ERROR 68.1
59.1
COEFF
SAMPLE TREES - BF
SD: 1.0
INF. POP.# OF TREES REQ.
VAR.% S.E.% LOW AVG HIGH 5 10 15
CL: 68.1
%
56.5 14.1 162 189 215R ALDER
51.6 16.3 915 1,094 1,272DOUG FIR
82.3 57.0 67 157 246BL MAPLE
WHEMLOCK
18.8 433 533 633 451 113 50TOTAL 106.3
COEFF
SAMPLE TREES - CF
SD: 1.0
INF. POP.# OF TREES REQ.
VAR.% S.E.% LOW AVG HIGH 5 10 15
CL: 68.1
%
66.5 16.6 45 54 63R ALDER
45.0 14.2 199 233 266DOUG FIR
75.8 52.4 21 45 68BL MAPLE
WHEMLOCK
16.2 102 122 141 336 84 37TOTAL 91.8
COEFF
TREES/ACRE
SD: 1.0
INF. POP.# OF PLOTS REQ.
VAR.% S.E.% LOW AVG HIGH 5 10 15
CL: 68.1
%
117.9 52.5 47 98 150R ALDER
155.1 69.1 8 25 42DOUG FIR
155.9 69.4 6 18 31BL MAPLE
244.9 109.1 1 3WHEMLOCK
25.9 106 143 180 161 40 18TOTAL 58.1
COEFF
BASAL AREA/ACRE
SD: 1.0
INF. POP.# OF PLOTS REQ.
VAR.% S.E.% LOW AVG HIGH 5 10 15
CL: 68.1
%
93.2 41.5 78 133 188R ALDER
163.3 72.7 23 86 149DOUG FIR
167.3 74.5 6 23 41BL MAPLE
244.9 109.1 8 16WHEMLOCK
16.4 209 250 291 65 16 7TOTAL 36.9
COEFF
NET BF/ACRE
SD: 1.0
INF. POP.# OF PLOTS REQ.
VAR.% S.E.% LOW AVG HIGH 5 10 15
CL: 68.1
%
88.6 39.4 9,304 15,362 21,420R ALDER
166.2 74.0 4,851 18,676 32,501DOUG FIR
181.5 80.8 381 1,984 3,587BL MAPLE
244.9 109.1 1,891 3,954WHEMLOCK
28.3 27,199 37,913 48,626 192 48 21TOTAL 63.5
DRAFT

TC TSTATS
CLOESD
TWP RGE SECT TYPE
PROJECT
PLOTS TREESACRES
PAGE
DATE
32 6 6.0000U3CLOESD0107W12N
9/27/2018
2STATISTICS
CuFt BdFtTRACT
S W
NET CUFT FT/ACRE
SD: 1.0
COEFF # OF PLOTS REQ. INF. POP.
VAR. S.E.% LOW AVG HIGH 5 10 15
CL: 68.1
%
COEFF
NET CUFT FT/ACRE
SD: 1.0
INF. POP.# OF PLOTS REQ.
VAR.% S.E.% LOW AVG HIGH 5 10 15
CL: 68.1
%
87.1 38.8 2,641 4,313 5,986R ALDER
167.9 74.8 1,032 4,090 7,148DOUG FIR
174.7 77.8 131 590 1,049BL MAPLE
244.9 109.1 386 807WHEMLOCK
23.3 7,194 9,379 11,564 130 33 14TOTAL 52.3
COEFF
V-BAR/ACRE
SD: 1.0
INF. POP.# OF PLOTS REQ.
VAR.% S.E.% LOW AVG HIGH 5 10 15
CL: 68.1
%
88.6 39.4 70 116 161R ALDER
166.2 74.0 56 217 378DOUG FIR
181.5 80.8 16 85 153BL MAPLE
244.9 109.1 242 505WHEMLOCK
28.3 109 151 194 192 48 21TOTAL 63.5
DRAFT

Species Summary - Trees, Logs, Tons, CCF, MBFPSPCTLTCMTC
1
9/27/2018Date:
CLOESDProject
4:11:30PMTime
Acres 62.00
T12N R07W S01 Ty00U 56.00
T12N R07W S01 Ty00U 6.00
Page No
SpeciesT
Logs
S
Total
Gross Net Gross
Total MBF
Net
Total CCFTotal
Trees
Total
Tons Tree Log
Net Cubic Ft/
LF
CF/
R ALDER 13,457 2,656 2,604 920 845 7,033 7,303 0.65 37.03 19.35
DOUG FIR 4,415 1,298 1,298 561 533 2,030 3,699 0.97 63.94 29.40
BL MAPLE 1,662 429 412 156 132 888 1,137 1.03 46.39 24.80
WHEMLOCK 1,112 263 251 97 85 953 842 0.70 26.33 22.56
WR CEDAR 43 15 15 2 2 43 34 0.95 34.26 34.26
20,689 1,735 1,597Totals 4,661 4,580 10,946 13,016 0.75 41.84 22.14
Wood Type
CF/
LF
Net Cubic Ft/
LogTreeTons
Total
Trees
Total Total CCF
Net
Total MBF
GrossNetGross
Total
LogsSpecies
0.91 28.07 51.67 620C 4,575 3,026 5,570 1,576 659 1,563
0.69 19.95 38.08 977H 8,440 7,921 15,119 3,085 1,076 3,016
20,689 1,735 1,597Totals 4,661 4,580 10,946 13,016 0.75 41.84 22.14
DRAFT