Tilburg University Takeovers and (Excess) CEO Compensation ...
44
Tilburg University Takeovers and (Excess) CEO Compensation Feito Ruiz, Isabel; Renneboog, Luc Publication date: 2017 Document Version Early version, also known as pre-print Link to publication in Tilburg University Research Portal Citation for published version (APA): Feito Ruiz, I., & Renneboog, L. (2017). Takeovers and (Excess) CEO Compensation. (CentER Discussion Paper; Vol. 2017-039). CentER, Center for Economic Research. General rights Copyright and moral rights for the publications made accessible in the public portal are retained by the authors and/or other copyright owners and it is a condition of accessing publications that users recognise and abide by the legal requirements associated with these rights. • Users may download and print one copy of any publication from the public portal for the purpose of private study or research. • You may not further distribute the material or use it for any profit-making activity or commercial gain • You may freely distribute the URL identifying the publication in the public portal Take down policy If you believe that this document breaches copyright please contact us providing details, and we will remove access to the work immediately and investigate your claim. Download date: 14. Mar. 2022
Transcript of Tilburg University Takeovers and (Excess) CEO Compensation ...

Tilburg University
Takeovers and (Excess) CEO Compensation
Feito Ruiz, Isabel; Renneboog, Luc
Publication date:2017
Document VersionEarly version, also known as pre-print
Link to publication in Tilburg University Research Portal
Citation for published version (APA):Feito Ruiz, I., & Renneboog, L. (2017). Takeovers and (Excess) CEO Compensation. (CentER DiscussionPaper; Vol. 2017-039). CentER, Center for Economic Research.
General rightsCopyright and moral rights for the publications made accessible in the public portal are retained by the authors and/or other copyright ownersand it is a condition of accessing publications that users recognise and abide by the legal requirements associated with these rights.
• Users may download and print one copy of any publication from the public portal for the purpose of private study or research. • You may not further distribute the material or use it for any profit-making activity or commercial gain • You may freely distribute the URL identifying the publication in the public portal
Take down policyIf you believe that this document breaches copyright please contact us providing details, and we will remove access to the work immediatelyand investigate your claim.
Download date: 14. Mar. 2022

No. 2017-039
TAKEOVERS AND (EXCESS) CEO COMPENSATION
By
Isabel Feito-Ruiz, Luc Renneboog,
21 September 2017
ISSN 0924-7815 ISSN 2213-9532

Takeovers and (Excess) CEO Compensation
Isabel Feito-Ruiz University of Leon.
Department of Business Administration, Campus Vegazana s/n. E-24071 Leon (Spain).
E-mail:[email protected]
and
Luc Renneboog Tilburg University.
Department of Finance, P.O. Box 90153, 5000LE Tilburg (Netherlands)
E-mail: [email protected]
Abstract.
We study if a CEO’s equity-based compensation affects the expected value generation in takeovers. When the
objectives of management and shareholders are more aligned, as proxied by the use of equity-based compen-
sation, more value-maximizing acquisitions are expected. Whereas in widely-held firms the decision power is
with the management, in firms with concentrated ownership the decision power may be with major blockhold-
ers. This may entail that ownership concentration and equity-based pay are substitutes. We find a strongly
positive relation between equity-based compensation and cumulative abnormal announcement returns at take-
overs, but this relation is eroded when dominant share blocks are held by corporations, which confirms the
substitution effect. Powerful CEOs in companies with weak boards and without actively monitoring sharehold-
ers may set their own pay which could lead to excesses. We relate excess pay to how takeover decisions are
received by the market, and demonstrate that excess compensation negatively affects the acquirer’s stock val-
uation at a takeover announcement. The market is thus able to identify firms with agency problems and is
cautious in its expectations about potential value creation by means of acquisitions.
Keywords: Equity-based compensation, Mergers and acquisitions (M&As), Takeover, Shareholder
protection, Ownership concentration.
JEL codes: G30; G32; G34, F30.
Acknowledgment: We are grateful for interesting suggestions by Fabio Braggion, Marc Goergen, Chendi
Zhang, Oliver Spalt, Yang Zhao, Ludo de Bisschop, Cara Vansteenkiste, Rik Frehen, Greg Trojanowski, Fabio
Castiglionesi, William Megginson, Felix Lopez Iturriaga, Garen Markarian, Ana I. Fernandez, Susana
Menendez-Requejo, Carlo Chiarella and by the participants to seminars at the CUNEF (Madrid, Spain) and
presentations at the 30th International Conference of the French Finance Association (AFFI) (Lyon, France),
the XXIII ACEDE Annual Conference (Malaga, Spain) and Finance Forum (Segovia, Spain), the 14th Infiniti
Conference (Dublin). This paper was completed during Isabel Feito-Ruiz’ visiting stay at Tilburg University.
This work was supported by the Spanish Economy and Competitiveness Ministry (ECO2012-31772) and As-
turias (Project SV-PA-13_ECOEMP-19). All remaining errors are our own.
1
Takeovers and (Excess) CEO Compensation
1. Introduction
Corporate investment decisions such as those on mergers and acquisitions (M&As) may be driven
by the managers’ personal objectives such as maximizing personal wealth or private benefits, possi-
bly even at the expense of shareholder value. An executive compensation contract, especially when
it comprises equity-based remuneration, ought to align the managerial objectives with those of share-
holders. According to the optimal contracting theory, equity-based compensation of top executives
may be effective in shaping long-term corporate investment policies and encourage managers to
make decisions that do not hurt the return required by shareholders (Jensen and Ruback, 1983;
Shleifer and Vishny, 1986). In an M&A context, Datta, Iskandar-Datta, and Raman (2001) find a
positive relation between the abnormal returns of bidding firms in takeovers and top executive stock
option compensation. Thus, giving shareholder-oriented incentives to top management leads to better
takeovers (this is at least what the market seems to believe). The authors also find that managers pay
lower premiums in takeovers and undertake more risky investments when these have high levels of
equity-compensation. Therefore, they support the efficacy of stock option-based compensation to
motivate managers to take on risky projects that maximize shareholders’ value (even in the absence
of active ownership). Likewise, Williams and Rao (2006) document that stock options are effective
means for motivating managers to alter their risk incentive behavior.
Our research aims to answer the following questions for European mergers and acquisitions, while
controlling for internal corporate governance aspects (such as board structure, the existence of direc-
tor networks), external governance (ownership concentration by type of owner), the countries’ cor-
porate governance regulations, and firm and takeover transaction characteristics:
First, does CEO equity-compensation (LTIPs and stock options) have a positive effect on the bidder’s
shareholder valuation when an M&A is announced?
Second, how does CEO equity-compensation interact with other monitoring mechanisms (such as
concentrated ownership) in the context of takeover decisions?
Third, do top executives receive excess pay, and - if this is the case - does excess compensation
influence the takeover decision as well as the takeover transaction’ valuation?
Our results show that, first, bidder’s shareholders put a higher expected value on the takeover trans-
action (the expected synergies) at the announcement for firms of which CEOs receive a higher level

2
of equity-based compensation. This suggests that the shareholders have more faith in takeover deci-
sions when the proceeds/losses will also be shared with the top management (through their equity
claims when the options and restricted stock vest). Second, the major blockholders do not have an
impact on the relation between the CEOs’ equity-based compensation and the M&A announcement
with exception of the dominant corporate blockholders whose presence erodes the relation between
the bidder’s shareholder value at announcement and the equity-based bay. The latter result is con-
sistent with a substitute effect between the monitoring role concentrated ownership (held by corpo-
rations) and the self-regulatory role of equity-based compensation (Bebchuk and Hamdani, 2009).
Third, strong equity-based incentives are not always leading to value-maximizing decisions: when
CEOs receive what is perceived as excessive compensation, the market reacts negatively to corporate
decisions such as takeovers. Public concerns about the excess remuneration of top managers have
shown that CEOs’ compensation could blur fair managerial corporate investment judgments and be
regarded as an agency problem (managerial power theory).
Our contributions to the literature are threefold. First, although some academic studies have exam-
ined the relation between CEOs’ compensation and takeover performance, that focus was limited to
the US market for corporate control. We analyze the effect of the top executive equity-based remu-
neration on the share price reaction to intra-European corporate bids. As Continental Europe’s cor-
porate governance differs from those of the US and UK (stakeholder-oriented regimes of Continental
Europe versus market-oriented regimes of Anglo-American countries), we will be able to answer the
question as to how equity-based compensation (stock options plans and long term incentives stock
schemes (LTIPs stock)) affects the takeover decision and the market reaction to takeovers in a dif-
ferent regulatory context. Second, our findings contribute to the view that the effectiveness of a cor-
porate governance mechanism depends on the corporate context such as corporate ownership, which
is more concentrated in Continental Europe than Anglo-American countries (Barca and Becht, 2001;
Faccio and Lang, 2002). Agency problems between shareholders and managers are in general lower
in the Continental European countries because blockholders have more incentives to monitor man-
agers and they can force the managers to carefully ponder on value-creating acquisition strategies in
order to avoid suboptimal risk investment decisions. Still, in these countries, another type of agency
problem may arise: that between the majority shareholder and minority blockholders. Given that our
dataset covers continental Europa and the UK, both types of agency costs may arise. Still, the dichot-
omy between shareholder-management and majority-minority shareholders does not perfectly coin-
cide with regional borders (market-based versus blockholder-based governance systems). Specifi-
cally, not all UK firms are widely-held: a minority of listed UK firms (about 10-15% and mostly
firms in the trade and logistics industry) have larger blocks amounting to more than 25% of the
equity. In addition, when we take average of the largest share block of listed UK firms, we obtain
14.5%. Whether or not the 14% share stake in the UK is powerful enough to trigger majority-minority
agency problems depends on the concentration of shares in minority blocks held. Even in a country

3
with strong ownership concentration such as Germany, about one fifth of German listed firms do not
have a blockholder owning 20% or more of the shares. Consequently, both types of agency problems
may arise to some extent both in the UK and in Continental European countries. For these reasons,
we study different degrees of ownership concentration, ownership by type of shareholder, and the
presence of a dominant shareholder of a specific type in addition to minority shareholders (by type).
Our ownership measures are based on the ‘ultimate owner’ as we take the direct and indirectly con-
trolled share stakes (hence, also held by intermediate investment vehicles) into account. Finally, we
also contribute to the literature on the limits of CEO compensation as a corporate governance device.
The remainder of the paper is organized as follows. Section 2 reviews the literature and formulates
the hypotheses. Section 3 describes the sample and methodology. Section 4 presents the data sources
and sample characteristics. Section 5 presents the findings and Section 6 concludes.
2. Literature and Hypotheses
Agency conflicts between managers and shareholders in publicly held corporations refer to the fact
that corporate decisions may be influenced by managers’ personal objectives rather than maximiza-
tion of shareholder value. Furthermore, whereas shareholders can diversify away firm-specific risk,
the managers’ risk is frequently undiversified as their human capital may largely depend on their
company. This may induce managers to adopt corporate policies that are too risk-averse and more
likely to pass up value-enhancing risky projects (Smith and Stulz, 1985). Moreover, it may be hard
for shareholders to verify whether managers undertake a project, such as a takeover transaction, with
an optimal combination of return and risk. To address this agency problem and to overcome mana-
gerial risk aversion, compensation contracts (arm´s-length contracting between shareholders and
managers) can encompass the right incentives to drive managers towards value-enhancing projects.
Not all components of the compensation package have a uniform effect on the risk incentives. Cash
compensation, in the form of base salary and the bonus, does not provide the right incentives for
managers to increase firm risk given that the former is not performance-linked and the latter has a
short-term rearview horizon (Lambert and Larcker, 1987), but long-term equity-based incentive
plans (LTIPs or restricted stock) and stock options may incentivize managers to take on more risky
projects with long term payoff (Sudarsanam and Huang, 2007). Previous studies focusing on US
M&A decisions document that stock options are an effective means to motivate managers to alter
their risk incentive behavior and maximize shareholder value in the absence of effective internal
control mechanisms (Datta et al, 2001; Williams and Rao, 2006).
2.1. Compensation contract incentives and corporate ownership
4
The corporate governance structures in Continental Europe differ significantly from the US and the
UK. For instance, in Continental Europe, firms’ ownership is significantly more concentrated than
US and UK firms (La Porta, Lopez-de-Silanes and Shleifer, 1999; Barca and Becht, 2001; Faccio
and Lang, 2002). The median US firm does not have a shareholder owning a share stake that exceeds
the disclosure threshold of 5%, whereas in the median German firm the largest shareholder has ma-
jority control. Most of major shareholder activism is happening behind the scenes (Becht, Franks,
Mayer and Rossi, 2009; Cziraki, Renneboog and Szilagyi, 2010; McCahery et al., 2016) and they
may force management to carefully evaluate the acquisition decision in order to avoid suboptimal
risky projects (Shleifer and Vishny, 1986). We therefore argue that compensation focusing on share-
holder-oriented incentives is a necessity in widely-held firms (in which the atomistic shareholders
are free-riding on control) and is less important in firms with strong blockholders who are large
enough to internalize the costs of monitoring and are hence closely monitoring important corporate
decisions (Bebchuk and Hamdani, 2009).
Hypothesis 1: High equity-based compensation (stock options and restricted stock) of the manage-
ment of bidding firms positively influences a widely-held bidder’s shareholder value in a takeover
(hypothesis 1a), but the level of equity-based compensation is not related to shareholder value in the
presence of large monitoring shareholders in the bidding firm (hypothesis 1b).
While this hypothesis states that the presence of large blockholders can offset the effect of equity-
based compensation, an alternative hypothesis to this substitute mechanism is that high equity-based
compensation leads to value-generating takeovers regardless of the degree of ownership concentra-
tion.
2.2. Excessive compensation
While equity-based compensation seeks to minimize the agency costs between managers and share-
holders, excessive equity-based compensation may lead to non-value-maximizing behavior. The con-
vex payoff structure of stock option compensation may incentivize managers to engage in risk-seek-
ing behavior leading to overinvestment, investments in non-value-enhancing projects (Elson, 2003).
Restricted stock (which usually vests after three years and is in the UK conditional on meeting a
performance benchmark) is a substitute for stock options to align managers and shareholder interests.
Still, the lack of a strong pay-for-performance relation and public concern about excesses of top
manager remuneration shows that CEO compensation may be an agency problem itself (Bertrand
and Mullainathan, 2001; Bebchuk and Fried, 2003; Grinstein and Hribar, 2004; Weisbach, 2007). A
higher CEO compensation may reflect poor corporate governance structures in that managers could
hijack the CEO compensation contracting and pay themselves excessive compensation (Core et
al.,1999; Weisbach, 2007). This would erode the incentives and the precision to find value-enhancing

5
takeover deals such that no effect or a negative effect of excessive compensation on bidder takeover
returns is expected.
Hypothesis 2: Excessive CEO compensation is negatively correlated to the bidder shareholder value
at a takeover transaction.
2.3. Controlling for other corporate governance mechanisms
The board structure, director networks, and the country corporate governance regulation may also
influence the valuation of takeovers by acquiring shareholders, which is why we control for the fol-
lowing types of variables. The board of directors is an internal control mechanism to promote and
protect shareholder interests and we take into account the board size, the number of executives, the
degree of the board’s independence, and the CEO/Chairman duality. A higher board size has been
shown to be associated with less effective boards and more managerial power, also called the ‘busy
board’ problem (Yermarck, 1996; Fich and Shivdasani, 2006). Boone, Field, Karpoff and Raheja
(2007) consider that the effect of the board size on the acquiring shareholder valuation is not clear
because of the fact that the board size may be endogenous; it could be determined by the character-
istics of the firm. The number of executive directors at board level (either as members of a one-tier
board or as members of a management board which exists next to a supervisory board in a two-tier
system) could impact corporate decision making. To supervise the management, the board of direc-
tors should comprise independent non-executives directors, who have not been managers in the firm,
and do not have a remuneration or consulting contract from the firm (with exception of fees), or any
other form of financial relation (e.g. through loans from the firm). Previous studies show mixed
results in relation to the effect of board independence: Franks, Mayer, and Renneboog (2001) and
Sudarsanam and Huang (2007) show a positive effect on M&A announcement returns, but Weir and
Laing (2000), Adams and Ferreira (2007), Harris and Raviv (2008) disagree. Duchin, Matsusaka and
Ozbas (2010) find that outside directors are more effective when the costs of information are lower.
CEO/chairman duality which captures whether the functions of CEO and chairman are accumulated
by one person is usually associated with higher compensation (Core et al., 1999) and less effective
corporate governance. The latter follows from that fact that one of the tasks of the chairman is mon-
itor the CEO and the decisions of the managerial team, which is de facto inefficient, if not impossible,
and therefore induces a negative effect on takeover value.
A CEO’s professional network may positively or negatively influence his decisions on takeovers and
other types of corporate restructurings. First, being on the board of other firms may elicit valuable
information about those firms, sectors, and industries (or even interesting views on the evolution of
macro-economic variables). Consequently, the takeover decisions will be more informed which
could then be reflected in the expected returns (Renneboog and Zhao, 2011). Acquirer returns are
also higher in transactions with a second-degree connections where one acquirer director and one

6
target director serve on the same third board (Cai and Sevilir, 2012). Second, the fact that executive
directors have been offered non-executive directorships in other firms may reflect that they have
been successful managers in the past and may signal talent (Fama and Jensen, 1983). Third, on the
contrary, busy CEOs with many non-executive directorships divide their attention over the firm they
manage and firms they supervise. Consequently, it may be that such busy CEOs make poorer takeo-
ver decisions. In a takeover context, Ahn, Jiraporn and Kim (2010) document a non-linear relation-
ship between the multiple directorships and the acquiring shareholder valuation. Up to a threshold,
holding multiple directorships increases the value of takeover decisions, but after exceeding the
threshold, more outside director positions held by managers of bidding firms could decrease the ex-
pected value of the takeover.
In addition to the above internal corporate governance and CEO specific characteristics, country-
level governance such as the quality of the legal and institutional environment may also influence
the takeover decisions as a lower quality may induce more asymmetric information and agency prob-
lems (La Porta et al., 1998). Therefore, we expect a positive relation between the quality of legal and
institutional environment in terms of shareholder protection and bidder shareholder valuation around
M&A announcement. We consider the three indices developed by Martynova and Renneboog
(2011b) on shareholder, minority shareholder, and creditor protection to capture the quality of the
legal and institutional environment. Each of these indices also include the rule of law, the degree to
which laws are enforced in courts. The shareholder protection index measures the degree of share-
holder orientation of a national regulation. The index increases with the number and quality of legal
provisions that provide shareholders with effective power to appoint and dismiss the board of direc-
tors and to control most of the important corporate decisions on, for instance, equity issues or anti-
takeover measures. A higher index score reflects that management is required to act in accordance
with the interests of shareholders. The minority shareholder protection index measures the regulatory
provisions that increase the relative power of the minority shareholders in the presence of strong
majority shareholders. In firms with concentrated ownership, dominant shareholders may extract
private benefits of control by influencing managerial decisions for his own benefit (see e.g. Durnev
and Kim, 2005). A higher index score reflects that the minority shareholders are more powerful vis-
à-vis dominant shareholders. The creditor protection index captures the regulatory provisions that
allow creditors to force repayment more easily, to take possession of the collateral, or even to gain
control over the firm in case of financial distress. Again, the higher the index, the stronger the creditor
protection.
2.4. Firm and transaction characteristics
7
The expected returns in takeovers have been shown to depend on several bidder and deal character-
istics. For instance, Lang, Stulz and Walking (1989) demonstrate that firms with high growth oppor-
tunities (proxied by a large market-to-book ratio) obtain high abnormal returns around the time of
the acquisition announcement. Dong, Hirshleifer, Richardson, and Teoh (2006) find evidence of the
opposite; a negative relation prevails which leads them to regard a high market-to-book ratio as a
proxy for overvaluation rather than of growth opportunities.
Jensen’s (1986) free cash flow hypothesis predicts that unrestrained managers of firms with high free
cash flow have more resources at their disposal to engage in empire building acquisitions at the
detriment of shareholder value. High free cash flow could therefore be related to lower bidder returns.
High debt levels reduce the future free cash flow and limit managerial discretion, so that leverage
could be an effective bonding mechanism (Masulis, Wang and Xie, 2007; Marynova and Renneboog,
2009b) which would lead to more positive bidder returns. Information leakage, insider trading, mar-
ket anticipation or trading on rumors related to the takeover deal can be reflected in the price runup.
A high runup could thus reveal that part of the information generated by the takeover announcement
is already incorporated in the stock prices such that the announcement returns are lower (Martynova
and Renneboog, 2009).
The target firm status may also matter because takeover negotiations with private firms may be less
complex and hence lead to lower acquisition costs relative to listed firms. Furthermore, takeovers of
unlisted targets are often friendly and without bidder competition. Unlisted firms may also seek to
be acquired because of liquidity problems which enables the acquirer to offer a lower price (Officer,
2007); that is to say, adverse selection forces the price to drop (Akerlof, 1970). Chang (1998) con-
forms greater gains for the bidder when the target firm is unlisted. Another issue, typical of unlisted
firms, can affect the announcement returns: unlisted firms usually have a concentrated ownership
structure, which entails that if the payment occurs by means of an all-equity or mixed transaction,
the target shareholders of the new firm could become the controlling shareholder in the merged firm,
especially in case the bidding firm has a dissipated ownership structure (Officer, Poulsen and
Stegemoller, 2009).
Moeller, Schlingemann, and Stulz (2004) find that bidder size is negatively correlated with bidder
returns around the M&A announcement. A related issue is the relative deal size: a larger target firm
may be more transparent and fewer adverse selection problems in its valuation may arise (Asquith,
Bruner and Mullins, 1983). A larger target size may generate higher integration costs (Agrawal, Jaffe
and Mandelker (1992), which affects bidder expected returns negatively. Morck, Shleifer and Vishny
(1990), Lang and Stulz (1994) and Berger and Ofek (1995) document that the takeover diversification
(when bidder and target are in unrelated industries) diminishes the acquirer’s wealth due to manag-
ers’ tendency to overpay. On contrast, Jensen and Ruback (1983) and Campa and Kedia (2002) as-
sociate the diversification with wealth creation in M&As transactions, which makes the expected
relation ambiguous.
8
The method of payment (and the sources of financing) may also influence the announcement returns.
When the bidding firm offers equity it signals that their shares are overvalued (Myers and Majluf,
1984). Consequently, an acquisition announcement paid with equity will emit a negative signal about
the bidder’s shares and thus trigger a negative price reaction (Travlos, 1987; Sudarsanam and Ma-
hate, 2003; Moeller et al., 2004). When a cash offer is made to a target firm, its share price increases
significantly more than in the case of an all-equity offer. The reason is that a cash offer may signal
that the bidding shareholders do not want to share future profits with the target shareholders, which
may indicate that bidding firm is convinced about the quality of the target (Martynova and
Renneboog, 2009). Golubov, Petmezas and Travlos (2015) find that stock-financed acquisitions are
not value destructive.
Earlier studies found mixed results regarding the effect of cross-border versus domestic M&As on
the acquiring firms’ returns. Positive cross-border M&A bidder returns are associated with the ben-
efits from the access to international capital markets (Francis, Hassan and Sun, 2008) and corporate
governance spill-overs from bidder to target (Bris and Cabolis, 2008). The imposition of a better
corporate governance system on the target firm, can generate value in the merged firm by eliminating
managerial opportunism that may have existed at the target (Hagendorff, Collins and Keasey, 2007;
Martynova and Renneboog, 2008; Feito-Ruiz and Menéndez-Requejo, 2011). In contrast, negative
cross-border M&A bidder returns can be explained by agency conflicts and asymmetric information
problems in foreign target firms (Moeller and Schlingemann, 2005).
A hostile takeover attitude by the target usually raises the price offered in an M&A. The bargained
up price induces a negative valuation of the bidder’s stock (Goergen and Renneboog, 2004; Campa
and Hernando, 2004). The same occurs in the case of multiple bidders because competition may
cause the winning bidder to succumb to the winner’s curse and to pay a higher price for the target
firm (Moeller et al., 2004). A tender offer is not unlike a hostile bid because the target board is
frequently bypassed when the offer is made, which could then have a negative impact on the bidder’s
announcement returns (Moeller et al., 2004).
Finally, we will also include in our model a dummy indicating whether a full acquisition has taken
place, which limits the transfer wealth from the target’s minority shareholders to the major share-
holders for example by using pyramidal control chains (La Porta et al., 1999; Martynova and
Renneboog, 2011).
3. Data sources and sample description
To test the above hypotheses, we collect information on M&As announced by European listed bid-
ding firms and involving both listed and unlisted target firms from around the world. Our sample
period starts in 2002 when the M&A market was slowly recovering (subsequent to the equity crisis
9
of March 2000) and ends at the close of 2007 when the financial crisis struck which slowed down
the market for corporate control.
We build our dataset from the Thomson One Banker Mergers & Acquisitions Database, DataStream.
We retain transactions that: (1) are completed; (2) involve a change in the control; and (3) for which
bidder share prices are available in Datastream. We gather CEO compensation information from
BoardEx (compiled by Management Diagnostics Limited), which provides detailed information on
executive compensation outside of the US for publically listed firms and includes biographic infor-
mation on executive and non-executive directors. From BoardEx, we also collect cash and equity-
based compensation data for all executive and non-executive board members. Cash compensation
includes base salary and bonus, while equity-based compensation1 includes the value of restricted
stock, stock options, and other elements of long-term incentives plans (LTIPs) granted in a given
year. We collect ownership data from the Amadeus Database from Bureau Van Dijk and use Lexis
Nexis to cross-validate the M&A information collected from the databases above. Our final sample
of M&A transactions consists of 216 cases involving firms from 26 countries (see Table 1). The fact
that the UK comprises the largest European market for corporate control is also reflected in this
sample.
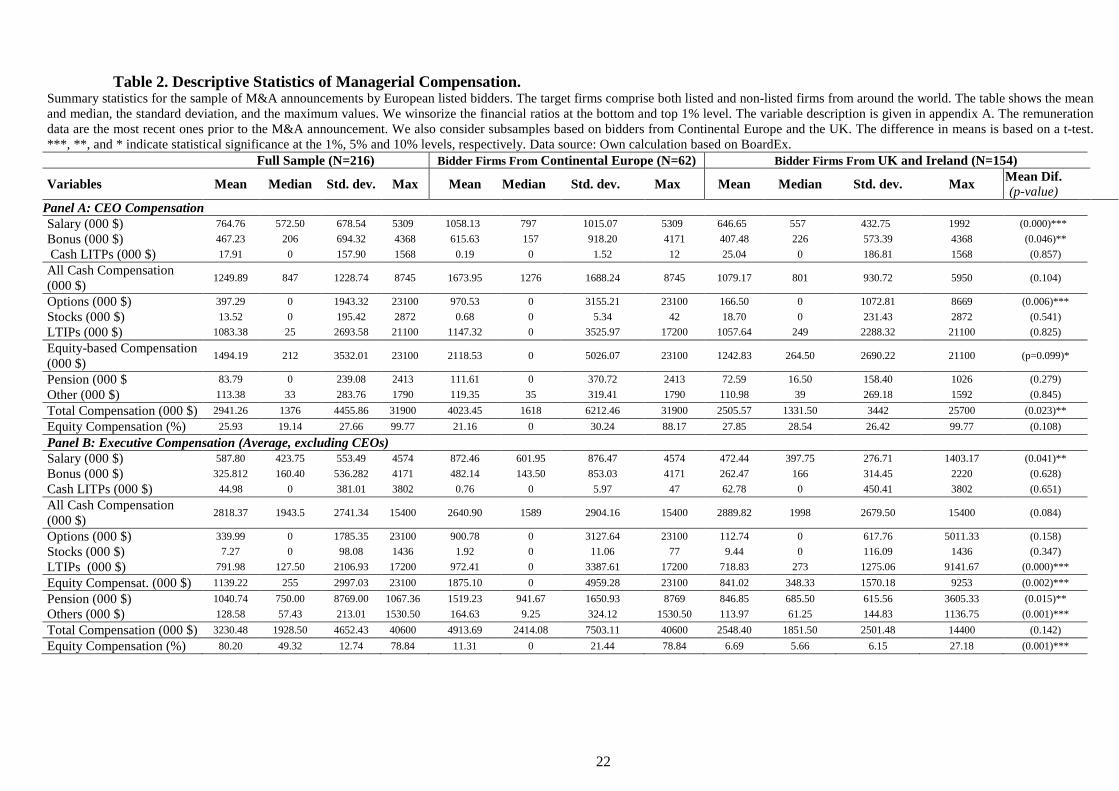
The median CEO of the bidding companies earns about USD 1.4 million (although some very well
paid outliers drive the average up to USD 2.9 million). Whereas the CEO of the median listed UK
company earns more than his continental European counterpart, this is not the case in this sample
where UK CEOs earn USD 1.3m and continental CEOs earn USD 1.6m. This difference in our sam-
ple is the consequence that the median bidding UK firm is considerably smaller than the median
continental bidder.
The CEO of the median continental European firm earns USD 1.3 million in cash compensation
(salary and bonus) and the UK CEO USD 801,000 in cash (Panel A of Table 2). About half of the
sample firms do not pay out equity compensation, but when they do, this type of remuneration is
typically higher than the cash compensation. On the average value of the allocated stock options and
restricted stock (LTIPs) amounts to about USD 1.5 million; higher in Continental Europe (USD
1 BoardEx distinguishes between (1) the intrinsic value of options, which is calculated by multiplying the num-
ber of options awarded in the period by the difference between stock and exercise price, and (2) the estimated
value of options awarded, which is a theoretical value that captures the potential value of the option during the
vesting period by means of the Black Sholes model. We will work with the estimated value. For the value of
LTIPs, BoardEx displays the maximum value obtainable under the long-term incentive plan. We call the top
manager ‘CEO’ even when the firm calls him/her “Managing Director” or “Chairman Executive”.
10
2.1million) than in the UK (USD 1.2 million). A similar picture is exhibited in Panel B of Table 2
for the other executive directors.
[Insert Tables 1-3 about here]
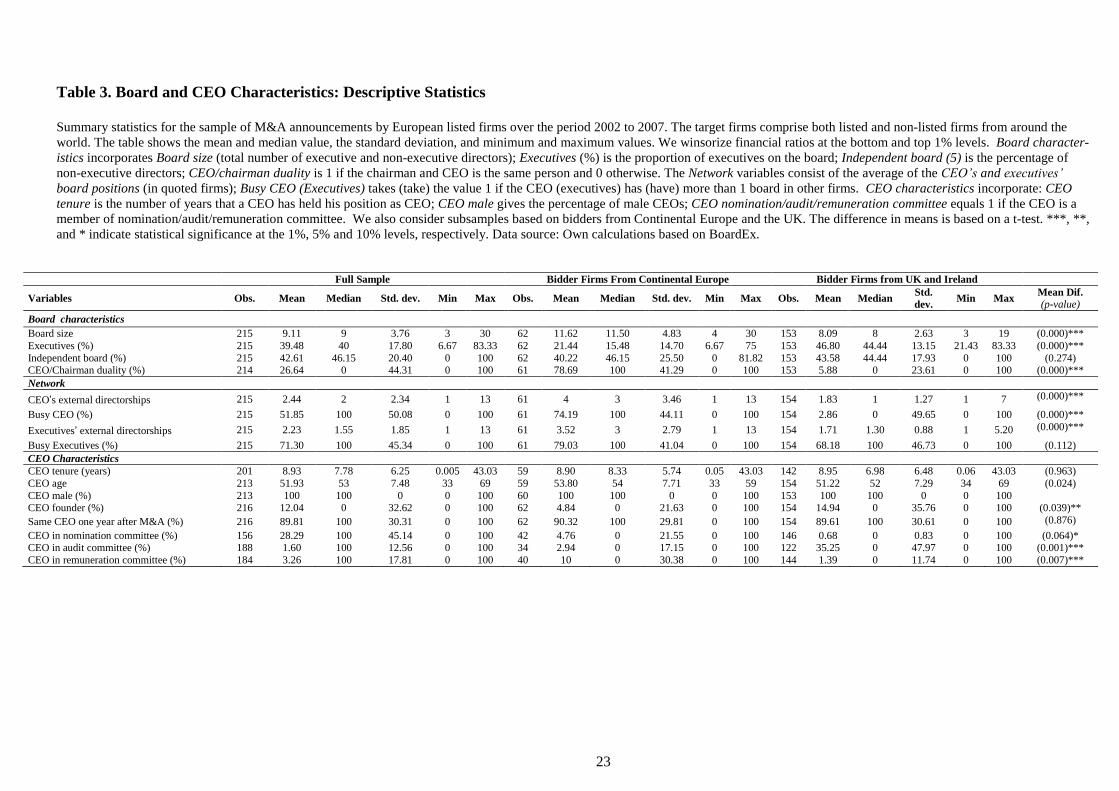
Table 3 presents an overview of the board and CEO characteristics for the Continental European and
UK firms. The board size averages 9 directors; 11.6 for Continental Europe (where, in some countries
such as Germany, the non-executive directors operate in a supervisory board, separated from the
management or executive board) and 8 for the UK. The difference in board composition between
Continental Europe and the UK is striking: the percentage of executive directors is lower for Conti-
nental Europe than for the UK (21.4% versus 46.8%, respectively). CEOs and other executive direc-
tors are busier in Continental Europe than the UK as they hold more as non-executive directorships
in Continental Europe (4 on average for CEOs) versus only 1.8 in the UK. The average number of
positions for executives is also higher in Continental Europe (with 3.5) than the UK (1.7). The pro-
portion of CEOs who founded their company amounts to 4.8% for Continental Europe firms and to
14.9% for the UK firms. CEOs are in more nomination and remuneration committees in Continental
Europe than in the UK.
In Table 4, we present the ownership distribution of the bidding firm, categorizing the largest block-
holder by block size and type of shareholder (Panel A). The first four columns represent the number
of the bidding firms in which the majority shareholder is a family firm or individual, a financial
institution, a non-financial firm, a venture capital firm, or a foundation, and the share block size
(smaller than 10% of the equity, between 10 and 20%, between 20 and 60%, and more than 60%).
Column (5) indicates the total number of bidding firms with a specific type of shareholder as the
largest blockholder. Column (6) and (7) show the mean of ownership block by type of shareholder
and its standard deviation. In Panel A, we observe that a financial institution is the largest shareholder
in almost 60% of bidding firms; 18.5% has an individual or a family as largest blockholder; 17.6%
has a non-financial company; 3.2% has a venture capital; and less than 1% has a foundation. The
mean of the ownership held by the largest shareholder in the bidder firm is 23.3% on average. The
percentage of ownership held by a family or an individual is 25.2%, 41.7% if it is a non-financial
firm, 17.4% if it is a financial institution, 16.9% if it is a venture capital and 32.2% if it is a founda-
tion. In panel B we compare the ownership distribution of the M&As by type of largest shareholder
in bidding firms from Continental Europe and UK, respectively. We observe that there are significant
differences between the mean of the percentage of ownership when the largest shareholder is a family
or an individual. In Continental Europe, the percentage held by a family or an individual is 48.5%,
while in the UK it is 18.4%. Similarly, for the other categories of owner, concentrated ownership
structures is stronger in Continental Europe than in the UK.
Table 5 presents the firm and M&A transaction characteristics of the sample. The market to book
ratio of acquiring firms is on average 1.6, and the leverage ratio (debt/assets) amounts to 20%. On
11
average, there is no price run-up. The majority of the deals (66.2%) are announced by large firms (in
the largest size quartile), the relative size of the target firm is small (20% only of the bidder’s size).
The majority of the target firms are unlisted (75% of the deals). Acquiring firms paid for the majority
of M&As with cash only (69%). The majority of the M&As are focused in the sense that they take
over a target in the same industry (70.4%), domestic (54.3%), friendly (99.5%), and full acquisitions
in that they acquire all the target’s equity (97.7% of the cases).
4. Bidder shareholder valuation and equity-based compensation
In the first part of our analysis, we estimate the acquiring shareholders’ returns around the M&A
announcement which is followed by modeling of the determinants of the acquiring shareholder val-
uation.
4.1. Bidder stock price reactions and their determinants
To examine the stock price effect of the M&A announcement, we calculate the cumulative abnormal
returns (CARs) around the announcement date, by means of the market model of which the parame-
ters are estimated in the period (-200, -21) days before the announcement date using a local index.
CARs for the acquiring shareholders are positive on the announcement day with 0.7%, which is in
line with earlier other findings for Europe (e.g. Martynova and Renneboog, 2011a) and the US
(Moeller et al., 2004) (see Table 6). To examine the effects of the equity-based compensation on the
bidder shareholder returns we carry out a multivariate analysis using an OLS regression with indus-
try, country and year fixed effects and report robust standard errors. Besides, we control for transac-
tion and firm characteristics and other corporate governance mechanism. The basic specification of
the model is as follows:
We calculate the CAR in a two-day window before and after the announcement date and the explan-
atory variables include:
Equity-based compensation (EBC) which is the natural logarithm of one plus the total CEO equity
compensation (stock option and restricted stock) divided by total CEO compensation over the fiscal
year prior to the announcement. We will also test the stock option compensation (natural logarithm
of one plus stock option divided by total CEO compensation) and the LTIPs (restricted stock) (natural
logarithm of one plus LTIPs divided by total CEO compensation) separately. Hypothesis 1a points
out that we expect a positive effect on the bidder shareholder valuation. We also interact equity-
)1(
*
,
98
7654
3210,
jitt
mm
kk
ii
iiii
iiji
sYearDummie
miesCountryDummmiesIndustryDuteristicsDealCharacteristicsFirmCharac
overnanceCorporateGeristicsCEOCharactNetworkcteristicsBoardChara
rshipBidderOwneensationEquityComprshipBidderOwneensationEquityCompCAR i

12
based compensation with bidder ownership in order to investigate whether the presence of strong
shareholder control neutralizes the impact of equity-based compensation on the bidder shareholder
value (hypothesis 1b). Salary (and Bonus) are defined as the natural logarithm of one plus the total
CEO salary (bonus) divided by total CEO compensation earned over the fiscal year prior to the an-
nouncement.
Bidder ownership concentration is defined as the percentage of control rights held by the ultimate
owner. Following Martynova and Renneboog (2009), we focus on control rights rather than on stock
because we want to control for dual class shares, pyramidal ownership structures, multiple control
chains, and cross-holdings. Strong control may induce tight monitoring of managerial decisions such
that management may have less discretion to undertake takeover transactions that are not value-en-
hancing. We not only include the percentage of ownership to capture concentration, but also the
degree to which specific thresholds are reached. We include dummy variables capturing the size of
the ownership stake held by the large shareholder: Ownership10 is defined as a dummy variable that
takes the value of 1 if the large shareholders held less than 10%, ownership10/20 when the share-
holder held between 10% and 20%, ownership20/60 when it is between 20% and 60% and owner-
ship60 when the shareholder percentage is higher than 60% (if we consider 10, 25, 50% thresholds
or (close) alternative cut-off values, the results do not differ much). Not only the voting rights con-
centration may matter in terms of monitoring but also the type of shareholder holding those voting
rights as some types may be on average more inclined to monitor than others. Therefore, we also
consider the identity of the ultimate owners partition them into these categories: (i) Family, for indi-
viduals or families; (ii) Financial institutions (e.g. mutual funds, pension funds, banks, insurance
companies); (iii) Non-financial firms (private or public firms, not active in the financial industry);
(iv) Venture capital, for venture capital firms; (v) Foundation, for trusts and foundations. While
families and non-financial blockholders may actively monitor managerial decision making and are
thus more concerned about the firm value creation in acquisitions (Feito-Ruiz and Menendez-Re-
quejo, 2010), it is not certain whether all institutional investors try to influence the firm’s strategic
policies (Hartzell and Staks, 2003). While some institutions can be regarded as activists (Ferreira,
Massa and Matos, 2010) demonstrate that foreign institutional investors often engage more with the
firm they invest in), others take a passive stance. Considering the issue that dominant shareholders
could expropriate the rights of minority shareholders, we consider the ownership structure of each
firm by including its dominant shareholder (by type of shareholder) as well as the blockholders who
own at least 5% but are minority blockholders (by type of shareholder). This way, we include for
instance that the dominant shareholder is a family or individual and that there are also other block-
holders present e.g. of the type institutional blockholder, other corporation, etc. So, in addition to the
Dominant blockholder dummies (dominant corporations, institutional investors, and individuals/fam-
ilies), which are dummy variables set to one if the largest blockholder is of this type of shareholder,

13
we also include in our models the variables With minority Family/ Corporate/ Institutional/ Govern-
ment block which are the interaction terms of the dummy capturing the presence of a minority block
of this type with the presence of a dominant shareholder of the types mentioned above. We will also
include the interaction terms between the dominant blockholders and the equity-based pay.
We control for board characteristics, networks, corporate governance, and firm and deal character-
istics (all are defined in Appendix A).
In Table 7, we present the results of the above model: we find that the abnormal returns for acquiring
firms are higher when the CEO earns a higher equity-based compensation and salary, which supports
hypothesis 1a. The result remains valid when we progressively add more control variables (board
characteristics, the CEO’s network, the bidder’s ownership structure, corporate governance indices,
firm financial variables, transaction characteristics) to the industry, country2, and time fixed effects
(models (1) to (6)). The board characteristics of the bidder firm (size, proportion of executive direc-
tors, chairman duality, and board independence) do not seem to affect the expected takeover returns.
In contrast, the announcement returns of takeovers initiative by busy CEOs, who serve on many
boards, are lower by about one third. Table 7 also reveals that the bidder’s ownership structure and
the corporate governance regulation (at the country level) do not have a significant impact. What
does have an impact is the price runup and the relative size of the transaction: a higher price runup
and a large target firm lead trigger higher expected returns. As documented in the literature (e.g.
Martynova and Renneboog, 2011), friendly M&As increase the acquiring shareholder value around
the M&A announcement (whereas in the case of hostile bids, the market fears that upwardly revised
bids will create a winner’s curse which reflects to a value-destroying takeover). The results are robust
to the use of different windows for the announcement CARs such as (-1,+1), (-1,0), (-3,+3).
Table 8 presents the results of the models explaining bidder returns which now include interaction
terms between the equity-based compensation and the ownership concentration (hypothesis 1b). We
also confirm that equity-based compensation has a positive effect on bidder returns, but when the
acquiring firm has both an ultimate shareholder with high levels of ownership concentration and a
CEO with high equity-based compensation, the positive effect is reduced (Models (3) and (5)) – this
is especially the case when another corporation is a blockholder ((Models (2), (4) and (6)). This
finding is in line with hypothesis 1b; in a bidding firm with this type of blockholder, the managerial
decisions are better monitored and important decisions that can have a substantial impact on corpo-
rate value will be screened by the blockholder, such that the need (and effect) of strong equity-based
incentives for the management is lower. This result suggests that equity-based pay and strong own-
ership held by a corporation are substitute governance mechanisms, although this substitution effect
is confined to ownership only held by corporations. We also observe that the bidder returns are higher
2 In the model that includes the corporate governance indices (which are measured by country), country fixed
effects are excluded.
14
when the ultimate shareholder has high levels of ownership concentration and it is a family or a
company, which indicates that the ownership concentration has a managerial control effect on the
acquiring firms. The positive effect of family firms on the acquiring shareholder valuation is con-
sistent with the result found by Feito-Ruiz and Menendez-Requejo (2010). All other results from the
main model presented in Table 7 are upheld.
[Insert Tables 6-8 about here]
4.2. Excess compensation
Next, we examine the impact of excessive compensation in the bidding firms on the announcement
returns of the takeover transaction. It may be that CEOs whose remuneration is in the very top per-
centiles of remuneration have been able to dominate the remuneration contracting process and extract
high rents from the firm. Such high compensation may reflect that internal monitoring (boards) or
external monitoring (shareholders) are deficient, and that the management has much (uncontrolled)
discretion in corporate decision making. If this were the case, then takeover decision process may
not be geared towards value-maximization either. First, we estimate the total (or equity-based) com-
pensation of CEO by means of the following Tobit model:
The dependent variable CEO Compensation represents the CEO’s total compensation in the year
prior to the M&A. The independent variables are listed under equation (1) (and are defined in Ap-
pendix A). The excess compensation is the difference between the real compensation and the pre-
dicted compensation from equation (2), which is input in equation (3). We expect a negative effect
of CEO compensation on the CARs (Hypothesis 2).
Tables 9 show the results of the estimation of the CEO’s total compensation. Founder-CEOs earn
less compensation. Firms with larger boards pay a higher compensation to the CEO (while board size
may proxy for firms size, we do also include firm size as a control variable). Blockholders (families,
)2(sYearDummie
miesCountryDummmiesIndustryDuLeverageitiesthOpportunBidderGrow
eBiddderSizormanceBidderPerfovernanceGorporateGrshipBidderOwne
eristicsCEOCharactNetworkcteristicsBoardCharaationCEOCompens
j,itt
mm
kk
i7i8
i7i61i5i4
i3i2i10i
ε+ψ∑+
+δ∑+∑+φ+φ+
+φ+φ+φ++φ+
+φ+φ+φ+φ=
)3(
*
,
98
7654
3210,
jitt
mm
kk
ii
iiii
iiji
sYearDummie
miesCountryDummmiesIndustryDuteristicsDealCharacteristicsFirmCharac
overnanceCorporateGeristicsCEOCharactNetworkcteristicsBoardChara
rshipBidderOwneensationEquityComprshipBidderOwneensationExcessCompCAR i
15
financial institutions, and other corporations)3 seem to put a brake on total compensation. A lower
pay is expected in such firms as the expected large shareholder monitoring would reduce the discre-
tion that top management has on the remuneration contracting process. We now turn to the relation
between the bidder returns and the excess total CEO compensation (Table 10). Consistent with hy-
pothesis 2, we find that the excess CEO total compensation, negative and significantly affect the
bidders’ returns. Excessive compensation does not minimize the agency costs between managers and
shareholders, but could rather be the expression of serious agency problems. We find that takeovers
made by managers with excessive pay are more negatively received by the market.
[Insert Tables 9-10 about here]
5. Robustness
Dominant vs minority shareholders
European firms (but also a subsample of listed UK firms) may suffer from conflicts of interest be-
tween controlling and minority shareholders (Bechuck and Hamdani, 2009; Mork, Wolfenzon and
Yeung, 2005, among others), which is why we perform some robustness tests on the findings of
Tables 7-8: we include in our models variables capturing the ownership stakes held by the large
shareholder. Ownership5/10 is a dummy variable that takes the value of 1 if the largest shareholder
hold more than 5% and less than 10%, ownership10/20 and ownership20/60 equal 1 when the share-
holders hold between 10% and 20% and between 20% and 60%, respectively, and ownership60 is 1
when the shareholder owns more than 60%. We also include the interaction term between these var-
iables and the CEO’s equity-based compensation. The results are shown in Table 11 and are in line
with those shown in Table 7-8: the positive and significant effect of CEO equity-based compensation
is maintained, and interaction term between CEO equity-based compensation and ownership con-
centration higher than 20% is negatively statistically significance supporting substitution effect.
In Table 12, we include whether the firm has a dominant shareholder of a specific type (family,
financial institution, or corporation) and whether minority blockholders (by type) are present. We
find little correlation between the bidder CARs and ownership with exception of the positive impact
of family ownership and the negative correlation of the interaction between a dominant share stake
held by a corporation and the equity-based compensation. This is entirely in line with the above
findings on ownership concentration.
3Given that there is not any stated-owned firm in the sample, we cannot see the possible effect of this large
shareholder on the compensation in Europe, not being possible to compare our results with the recent paper
of Liang, Renneboog and Sun (2015) for Chinese firms.
16
[Insert Tables 11 and 12 about here]
CEO turnover risk, CEO pay slice and total CEO compensation
The CEO’s excess compensation may be influenced by the risk of being dismissed and the CEO’s
compensation relative to the other of top managers (which may reflect the presence of agency con-
flicts). As a robustness check we have re-run the regressions of Table 9 by including the CEO turn-
over risk (estimated following Peters and Wagner (2014)) and the CEO pay slice (following Beb-
chuk, Cremers and Peyer (2011)). We find that CEO turnover risk has a negative impact on the total
CEO compensation; this result is not in line with Peter and Wagner (2014) (see Appendix Table B1).
This difference might be associated with the fact that our sample focuses on bidder firms that under-
take an M&A in Europe, instead of all the US firms. The positive coefficient of CEO pay slice, the
fraction of the CEO’s total compensation relative to the top-five executives, may proxy for the CEO’s
power to influence his compensation. Our re-estimated excess CEO total compensation is input in
the models of Table B2 (Appendix B) and these results are in line with what was reported for Table
10.
CEO equity-based compensation and takeover probability: selection bias
Another concern could be the possible selection bias problem in relation to the CEO equity-based
compensation and the takeover deal as the propensity of undertaking a takeover may be affected by
the CEO’s equity-based compensation, which is the first stage of our Heckman selection model. In
the second stage, we analyze the determinants of the CARs considering the possible relation between
equity-based pay and the probability that an M&A is undertaken. The results of this analysis are
shown in Tables B3 and B3 (Appendix B): a CEO’s equity-based compensation has a negative effect
on the takeover probability, which is in line with previous studies indicating that CEOs make fewer
wealth-reducing mergers when they own more stock (Bliss and Rosen, 2001, among others). After
controlling for this effect, we show that the effect of CEO equity-based compensation is positively
correlated to the CARs around the takeover announcement, which corroborates the robustness of our
results detailed above.
6. Conclusions
This paper analyzes if the CEO’s equity-based compensation affects takeover decisions and their
expected value generation. When the objectives of the management and shareholders are more
aligned, as proxied by the use of equity-based compensation, one may expect that the right type of
(value-maximizing) acquisitions are made and that this is perceived as such by the market. The bid-
der’s stock price is then expected to be higher. Given that we work with a sample of European ac-
quisitions and that a subsample of bidders have concentrated ownership, we also focus on the role of

17
large shareholders as monitors and decision makers. Whereas in widely-held firms, the decision
power is with the management, in firms with concentrated ownership, the decision power may be
with the major blockholders which may entail that ownership concentration and equity-based pay are
substitutes. We find a strongly positive relation between equity-based compensation and stock prices,
while controlling for CEO traits (age, tenure, being a founder, network size), board characteristics
(size, independence of directors, CEO-chairman duality, committee membership), the degree of ex-
ternal monitoring (ownership concentration by type of owner: families and individuals, corporations,
financial institutions, etc.), the level of shareholder protection in the country of the bidder, and firm
characteristics (size, growth, free cash flow). Furthermore, the positive relation between equity-based
pay is eroded in a context of concentrated ownership. A detailed analysis of ownership involving the
distinction between who holds the dominant share blocks (families, corporations, financial institu-
tions) along with minority share blocks reveals that a substitution effect between equity-based pay
and concentrated ownership arises in case a corporation is the dominant blockholder.
While equity-based pay turns management into co-owners and should make their decision making
more value-oriented, it is possible that powerful CEOs in companies with weak boards and lack of
actively monitoring shareholders manage to set their own pay (and pay-for-performance structure)
which could lead to excesses. We therefore estimate a ‘normal’ remuneration for the CEO consider-
ing some of his traits (such as age, and tenure or experience), firm attributes (such as size and finan-
cial performance), industry, country (e.g. the degree of investor protection), and the year of pay. We
then obtain excess pay by subtracting normal from the actual pay. We relate excess pay to how take-
over decisions are received by the market, and demonstrate that excess compensation negatively
affects the acquirer’s stock valuation at a takeover announcement. The market is thus able to identify
firms with agency problems and is cautious in its expectations about the potential value creation by
means of acquisitions.
18
References
Adams, R.B., Ferreira, D. (2007): “A Theory of Friendly Boards”. Journal of Finance, 62, 217–250.
Agrawal, A., Jaffe, J., Mandelker, G. (1992): “The Post-merger Performance of Acquiring Firms: a
Re-Examination of an Anomaly”. Journal of Finance, 47, 1605-22.
Ahn, S., Jiraporn, P., Kim, Y.S. (2010): “Multiple directorship and acquiring returns”. Journal of
Banking and Finance, 34, 2011-2026.
Akerlof, G.A. (1970): “The Market for “lemons”: Quality Uncertainty and the Market Mechanism”.
Quarterly Journal of Economic, 84, 488-00.
Asquith, P., Bruner, R., Mullins, D. (1983): “The Gains to Bidding Firms from Merger”. Journal of
Financial Economics, 11, 121-39.
Barca, F., Becht, M. (2001): “The Control of Corporate Europe” (Oxford: Pxford University Press).
Bebchuck, L.A., Cremers, K.J.M, Peyer, U.C. (2011): ”The CEO pay slice”. Journal of Financial
Economics, 102, 199-221.
Bebchuk, L., Fried, J. (2003): “Executive compensation as an agency problem”. Journal of Economic
Perspectives, 17, 71–92.
Bebchuck, L.A., Hamdani, A. (2009): “The Elusive Quest for Governance Standards”. University of
Pennsylvania Law Review, 157, 1263-1317.
Becht, M., Franks, J., Mayer, C. Rossi, S. (2009): “Return to Shareholder Activism: Evidence from
a Clinical Study of Hermes U.K. Focus Funds”. Review of Financial Studies, 22, 3093-3129.
Berger, P.G., Ofek, E. (1995): “Diversification’s Effect on Firm Value”. Journal of Financial Eco-
nomics, 37, 39-65.
Bertrand, M., Mullainathan,S. (2001): “Are CEOS Rewarded for Luck? The Ones without Principals
Are”. The Quarterly Journal of Economics, 116 (3), 901-932.
Boone, A., Field, L., Karpoff, J., Raheja, C. (2007): “The Determinants of Corporate Board Size and
Composition: an Empirical Analysis”. Journal of Financial Economics, 85, 66–101.
Bliss, T., Rosen, R. (2001). CEO Compensation and Bank Mergers. Journal of Financial Economics,
61, 107-138.
Bris, A., Cabolis, C. (2008): “The Value of Investor Protection: Firm Evidence from Cross-Border
Mergers”. The Review of Financial Studies, 21, 605-649.
Cai, Y., Sevilir, M. (2012): “Board Connection and M&A transactions”. Journal of Financial Eco-
nomics, 103, 327-349.
Campa, J.M., Kedia, S. (2002): “Explaining the Diversification Discount”. Journal of Finance, 57,
1731-62.
Campa, J.M., Hernando, I. (2004): “Shareholder Value Creation in European M&As”. European Fi-
nancial Management, 10, 47-81.
Chang, S. (1998): “Takeovers of Privately Held Targets, Method of Payment, and Bidder Returns”.
Journal of Finance, 53, 773-84.
Core, J.E., Holthausen, R.W., Larcker, D.F. (1999): “Corporate Governance, Chief Executive Officer
Compensation, and Firm Performance”. Journal of Financial Economics, 51, 371-406.
Cziraki, P., Renneboog, L. Szilagyi, P.G. (2010): “Shareholder Activism through Proxy Proposals:
The European Perspective”. European Financial Management, 16 (5), 738-777.
Datta, S., Iskandar-Datta, M., Raman, K. (2001): “Executive Compensation and Corporate Acquisi-
tion Decisions”. The Journal of Finance, 56 (6), 2299-2336.
Dodd, P., Warner, J.B. (1983): “On Corporate Governance: A study of Proxy Contests”. Journal of
Financial Economics, 11, 401-38.
Dong, M., Hirshleifer, D., Richardson S., Teoh, S.H. (2006): “Does Investor Misevaluation Drive
the Takeover Market?” Journal of Finance, 61, 725-62.
Duchin, R., Matsusaka, J.G., Ozbas, O. (2010): “When are Outside Directors Effective?” Journal of
Financial Economics, 96, 195–214.
Durnev, A., Kim, H. (2005): “To Steal or Not to Steal: Firm Attributes, Legal Environment, and
Valuation”. Journal of Finance, 60, 1461–1493.
Elson, C. (2003): “What´s Wrong with Executive Compensation?” Harvard Business Review. 81(1),
68-77.
Faccio, M., Lang, L.H.P. (2002): “The Ultimate Ownership of Western European Corporations”.
Journal of Financial Economics, 65, 365-395.
19
Fama, E., Jensen, M.C. (1983): “Separation of Ownership and Control”. Journal of Law and Eco-
nomics, 26, 3001-325.
Ferreira, M.A., Massa, M., Matos., P. (2010): “Shareholder at the Gate: Institutional Investors and
Cross-border mergers and acquisitions”. Review of Financial Studies, 23, 601-644.
Feito-Ruiz, I., Menendez-Requejo, S. (2010): “Family Firm Mergers and Acquisitions in Different
Legal Environments”. Family Business Review, 23, 60-75.
Feito-Ruiz, I., Menendez-Requejo, S. (2011): “Cross-border Mergers and Acquisitions in Different
Legal Environments”. International Review of Law and Economics, 31, 169-187.
Franks, J., Mayer, C., Renneboog, L. (2001): “Who Disciplines Management in Poorly Performing
Companies?” Journal of Financial Intermediation, 10, 2009-248.
Francis, B.B., Hassan, I., Sun, X. (2008): “Financial Market Intergration and the Value of Global
Diversification: Evidence fior U.S. Acquirers in Cross-Border Mergers and Acquisitions”. Journal
of Banking & Finance, 32, 1522-1540.
Fich, E., Shivdasani, A. (2006): “Are Busy Boards Effective Monitors?” Journal of Finance, 61(2),
689-724.
Fidrmuc, J.A., Goergen, M., Renneboog, L. (2006): “Insider Trading, News Releases and Ownership
Concentration”. Journal of Finance, 61 (6), 2931-2974.
Goergen, M., Renneboog, L. (2004): “Shareholder Wealth Effects of European Domestic and Cross-
border Takeover Bids”. European Financial Management, 10, 9-45.
Grinstein, Y. Hribar, P. (2004): “CEO Compensation and Incentives Evidence from M&A Bonuses”.
Journal of Financial Economics, 73 (1), 119-143.
Golubov, A., Petmezas, D., Travlos, N.G. (2015): “Do Stock-Financed Acquisitions Destroy Value?
New Methods and Evidence”. Review of Finance, doi: 10.1093/rof/rfv009.
Harris, M., Raviv, A. (2008): “A Theory of Board Control and Size”. Review of Financial Studies,
21, 1797–1832.
Hagendorff, J., Collins, K., Keasey, K. (2007). Investor Protection and the Value Effects of Bank
Mergers Announcements in Europe and the US”. Journal of Banking and Finance, 54, 1969-1997.
Haztzell, J.C., Starks, L.T. (2003): “Institutional Investors and Executive Compensation”. Journal of
Finance, 58 (6), 2351-2374.
Jensen, M.C., Ruback, R.S. (1983): “The Market for Corporate Control: the Scientific Evidence”.
Journal of Financial Economics, 11, 5-50.
Jensen, M. C. (1986): “Agency Cost of Free Cash Flow, Corporate Finance, and Takeovers”. Amer-
ican Economic Review, 76, 323-329.
Lambert, R.A., Larcker, D.F. (1987): “Executive Compensation Effects of Large Corporate Acquis-
tions”. Journal of Accounting and Public Policy, 6, 231-243.
Lang, L., Stulz, M., Walkling, R.A. (1989). Managerial Performance, Tobin’s Q, and the Gains from
Successful Tender Offers. Journal of Financial Economics, 24, 137-154.
Lang, L., Stulz, R.M. (1994): “Tobin's Q. Corporate Diversification and Firm Performance”. Journal
of Political Economy, 102, 1248-80.
La Porta, R., López-de-Silanes, F., Shleifer, A. (1999): “Corporate Ownership around the World”.
Journal of Finance, 54, 471-17.
La Porta, R., Lopez-de-Silanes, F., Shleifer, A. (1999): “Corporate Ownership around the World”.
Journal of Finance, 54, 471-17.
Liang, H., Renneboog, L., Sun, S.L. (2015): “The Political Determinants of Executive Compensa-
tion: Evidence from an Emergy Economy”. Emerging Markets Review, 25, 69-91.
Myers, S., Majluf, N. (1984): “Corporate Financing and Investment Decisions When Firms Have
Information that Investors Do Not Have”. Journal of Financial Economics, 13, 187-21.
Martynova, M., Renneboog, L. (2008): “Spillover of Corporate Governance Standard in Cross-bor-
der Mergers and Acquisitions”. Journal of Corporate Finance, 14, 200-23.
Martynova, M., and Renneboog, L. (2009): “What Determines the Financing Decision in Corporate
takeovers: Cost of Capital, Agency Problems, or the Method of payment?” Journal of Corporate
Finance, 15, 290-315.
Martynova, M., Renneboog, L. (2011a): “The Performance of the European Market for Corporate
Control: Evidence from the Firth Takeover Wave”. European Financial Management, 17, 208-259.

20
Martynova, M. and L. Renneboog (2011b): “Evidence on the International Evolution and Convergence
of Corporate Governance Regulations”. Journal of Corporate Finance, 17 (5), 1531-1557.
Masulis, R., Wang, C., Xie, F. (2007): “Corporate Governance and Acquirer Returns”. Journal of
Finance, 4, 1851-1889.
McCahery, J.A., Sautner, Z., Stark, L.T. (2016): “Behind the Scenes: The Corporate Governance
Preferences of Institutional Investors”. Journal of Finance, 71 (6), 2905-2932.
Morck, R., Shleifer, A., Vishny, R.W. (1990): “Do Managerial Objectives Drive Bad Acquisitions?”
Journal of Finance, 45, 31-48.
Morck, R., Wolfenzon, D., Yeung, B. (2005): “Corporate Governance, Economic Entrenchment and
Growth”. Journal of Economic Literature, 43, 3, 655-720.
Moeller, S.B., Shilingemann, F.P., Stulz, R.M. (2004): “Do Shareholders of Acquiring Firms Gain
from Acquisitions?” Journal of Financial Economics, 73, 201-228.
Moeller, S.B., Shilingemann, F.P. (2005): “Global Diversification and Bidder gains: A Comparison
between Cross-border and Domestic Acquisitions”. Journal of Banking & Finance, 29, 533-64.
Officer, M. (2007): “The Price of Corporate Liquidity: Acquisition Discounts for Unlisted Targets”.
Journal of Financial Economics, 83, 571–598.
Officer, M., Poulsen, A., Stegemoller, M. (2009): “Target-firm Information Asymmetry and Ac-
quirer Returns”. Review of Finance, 13, 467–493.
Peters, F.S., Wagner, A.F. (2014): “The Executive Turnover Risk Premium”. Journal of Finance, 69
(4), 1529-1563.
Renneboog, L., Zhao, Y. (2011): “US Knows us in the UK: On Director Networks and CEO Com-
pensation”. Journal of Corporate Finance, nº 17, 1132-1157.
Shleifer, A., Vishny, R.W. (1986): “Large Shareholder and Corporate Control”. Journal of Political
Economy, nº 94, 461-488.
Smith, C., Stulz, R. (1985): “The Determinants of Firms’ Hedging Policies”. Journal of Financial &
Quantitative Analysis, 20, 391-405.
Sudarsanam, S., Mahate, A.A. (2003): “Glamour Acquirers, Method of Payment and Post-acquisition
Performance: The UK Evidence”. Journal of Business Finance & Accounting, 30, 299-42.
Sudarsanam, S., Huang, J. (2007): “Executive Compensation and Managerial Overconfidence: Im-
pact on Risk Taking and Shareholder Value in Corporate Acquisitions. International Mergers and
Acquisitions Activity Since 1990”. Recent Research and Quantitative Analysis. Edited by: Greg N.
Gregoriou & Luc Renneboog.
Travlos, N.G. (1987): “Corporate Takeover Bids, Method of Payment and Bidding Firms´ Stock
Returns”. Journal of Finance, 42, 973-63.
Weisbach, M.S. (2007): “Optimal Executive Compensation versus Managerial Power: a Review of
Lucian Bebchuk and Jesse Fried’s ‘‘Pay without Performance. The Unfulfilled Promise of Execu-
tive Compensation’’. Journal of Economic Literature, 45, 419–428.
Weir, C., Laing, D. (2000): “The Performance-Governance Relationship: The Effect of Cadbury
Compliance on U.K. Quoted Companies”. Journal of Management and Governance, 4, 265- 281.
Williams, M.A., Rao, R.P. (2006): “CEO Stock Options and Equity Risk Incentives”. Journal of
Business Finance & Accounting, 33, 26-44.
Yermack, D. (1996): “Higher Market Valuation of Companies with a Small Board of Directors”.
Journal of Financial Economics, 40, 185–211.

21
Table 1. Geographical distribution of M&A sample
Sample includes 216 M&A deals announced by European listed bidder on listed targets from all over the world.
Source: Thomson One Banker Mergers & Acquisitions Database
All
Country Acquiring firm Target firm
Australia 2
Austria 1
Belgium 1 1
Canada 8
China 2
Czech Republic 1
Denmark 4
Egypt 2
Finland 7 2
France 18 9
Germany 3 9
Hong Kong, China 1
Ireland-Rep 9 6
Israel 1
Italy 2 4
Netherlands 9 6
Norway 5 4
Russian Fed. 1
Singapore 1
South Africa 1
Spain 4 7
Sweden 10 3
Switzerland 3 3
United Kingdom 145 105
United States 31
Utd Arab Emirate 1
All 216 216
22
Table 2. Descriptive Statistics of Managerial Compensation. Summary statistics for the sample of M&A announcements by European listed bidders. The target firms comprise both listed and non-listed firms from around the world. The table shows the mean
and median, the standard deviation, and the maximum values. We winsorize the financial ratios at the bottom and top 1% level. The variable description is given in appendix A. The remuneration
data are the most recent ones prior to the M&A announcement. We also consider subsamples based on bidders from Continental Europe and the UK. The difference in means is based on a t-test.
***, **, and * indicate statistical significance at the 1%, 5% and 10% levels, respectively. Data source: Own calculation based on BoardEx.
Full Sample (N=216) Bidder Firms From Continental Europe (N=62) Bidder Firms From UK and Ireland (N=154)
Variables Mean Median Std. dev. Max Mean Median Std. dev. Max Mean Median Std. dev. Max Mean Dif.
(p-value)
Panel A: CEO Compensation
Salary (000 $) 764.76 572.50 678.54 5309 1058.13 797 1015.07 5309 646.65 557 432.75 1992 (0.000)***
Bonus (000 $) 467.23 206 694.32 4368 615.63 157 918.20 4171 407.48 226 573.39 4368 (0.046)**
Cash LITPs (000 $) 17.91 0 157.90 1568 0.19 0 1.52 12 25.04 0 186.81 1568 (0.857)
All Cash Compensation
(000 $) 1249.89 847 1228.74 8745 1673.95 1276 1688.24 8745 1079.17 801 930.72 5950 (0.104)
Options (000 $) 397.29 0 1943.32 23100 970.53 0 3155.21 23100 166.50 0 1072.81 8669 (0.006)***
Stocks (000 $) 13.52 0 195.42 2872 0.68 0 5.34 42 18.70 0 231.43 2872 (0.541)
LTIPs (000 $) 1083.38 25 2693.58 21100 1147.32 0 3525.97 17200 1057.64 249 2288.32 21100 (0.825)
Equity-based Compensation
(000 $) 1494.19 212 3532.01 23100 2118.53 0 5026.07 23100 1242.83 264.50 2690.22 21100 (p=0.099)*
Pension (000 $ 83.79 0 239.08 2413 111.61 0 370.72 2413 72.59 16.50 158.40 1026 (0.279)
Other (000 $) 113.38 33 283.76 1790 119.35 35 319.41 1790 110.98 39 269.18 1592 (0.845)
Total Compensation (000 $) 2941.26 1376 4455.86 31900 4023.45 1618 6212.46 31900 2505.57 1331.50 3442 25700 (0.023)**
Equity Compensation (%) 25.93 19.14 27.66 99.77 21.16 0 30.24 88.17 27.85 28.54 26.42 99.77 (0.108)
Panel B: Executive Compensation (Average, excluding CEOs)
Salary (000 $) 587.80 423.75 553.49 4574 872.46 601.95 876.47 4574 472.44 397.75 276.71 1403.17 (0.041)**
Bonus (000 $) 325.812 160.40 536.282 4171 482.14 143.50 853.03 4171 262.47 166 314.45 2220 (0.628)
Cash LITPs (000 $) 44.98 0 381.01 3802 0.76 0 5.97 47 62.78 0 450.41 3802 (0.651)
All Cash Compensation
(000 $) 2818.37 1943.5 2741.34 15400 2640.90 1589 2904.16 15400 2889.82 1998 2679.50 15400 (0.084)
Options (000 $) 339.99 0 1785.35 23100 900.78 0 3127.64 23100 112.74 0 617.76 5011.33 (0.158)
Stocks (000 $) 7.27 0 98.08 1436 1.92 0 11.06 77 9.44 0 116.09 1436 (0.347)
LTIPs (000 $) 791.98 127.50 2106.93 17200 972.41 0 3387.61 17200 718.83 273 1275.06 9141.67 (0.000)***
Equity Compensat. (000 $) 1139.22 255 2997.03 23100 1875.10 0 4959.28 23100 841.02 348.33 1570.18 9253 (0.002)***
Pension (000 $) 1040.74 750.00 8769.00 1067.36 1519.23 941.67 1650.93 8769 846.85 685.50 615.56 3605.33 (0.015)**
Others (000 $) 128.58 57.43 213.01 1530.50 164.63 9.25 324.12 1530.50 113.97 61.25 144.83 1136.75 (0.001)***
Total Compensation (000 $) 3230.48 1928.50 4652.43 40600 4913.69 2414.08 7503.11 40600 2548.40 1851.50 2501.48 14400 (0.142)
Equity Compensation (%) 80.20 49.32 12.74 78.84 11.31 0 21.44 78.84 6.69 5.66 6.15 27.18 (0.001)***
23
Table 3. Board and CEO Characteristics: Descriptive Statistics
Summary statistics for the sample of M&A announcements by European listed firms over the period 2002 to 2007. The target firms comprise both listed and non-listed firms from around the
world. The table shows the mean and median value, the standard deviation, and minimum and maximum values. We winsorize financial ratios at the bottom and top 1% levels. Board character-
istics incorporates Board size (total number of executive and non-executive directors); Executives (%) is the proportion of executives on the board; Independent board (5) is the percentage of
non-executive directors; CEO/chairman duality is 1 if the chairman and CEO is the same person and 0 otherwise. The Network variables consist of the average of the CEO’s and executives’
board positions (in quoted firms); Busy CEO (Executives) takes (take) the value 1 if the CEO (executives) has (have) more than 1 board in other firms. CEO characteristics incorporate: CEO
tenure is the number of years that a CEO has held his position as CEO; CEO male gives the percentage of male CEOs; CEO nomination/audit/remuneration committee equals 1 if the CEO is a
member of nomination/audit/remuneration committee. We also consider subsamples based on bidders from Continental Europe and the UK. The difference in means is based on a t-test. ***, **,
and * indicate statistical significance at the 1%, 5% and 10% levels, respectively. Data source: Own calculations based on BoardEx.
Full Sample Bidder Firms From Continental Europe Bidder Firms from UK and Ireland
Variables Obs. Mean Median Std. dev. Min Max Obs. Mean Median Std. dev. Min Max Obs. Mean Median Std.
dev. Min Max
Mean Dif.
(p-value)
Board characteristics
Board size 215 9.11 9 3.76 3 30 62 11.62 11.50 4.83 4 30 153 8.09 8 2.63 3 19 (0.000)***
Executives (%) 215 39.48 40 17.80 6.67 83.33 62 21.44 15.48 14.70 6.67 75 153 46.80 44.44 13.15 21.43 83.33 (0.000)***
Independent board (%) 215 42.61 46.15 20.40 0 100 62 40.22 46.15 25.50 0 81.82 153 43.58 44.44 17.93 0 100 (0.274) CEO/Chairman duality (%) 214 26.64 0 44.31 0 100 61 78.69 100 41.29 0 100 153 5.88 0 23.61 0 100 (0.000)***
Network
CEO’s external directorships 215 2.44 2 2.34 1 13 61 4 3 3.46 1 13 154 1.83 1 1.27 1 7 (0.000)***
Busy CEO (%) 215 51.85 100 50.08 0 100 61 74.19 100 44.11 0 100 154 2.86 0 49.65 0 100 (0.000)***
Executives’ external directorships 215 2.23 1.55 1.85 1 13 61 3.52 3 2.79 1 13 154 1.71 1.30 0.88 1 5.20 (0.000)***
Busy Executives (%) 215 71.30 100 45.34 0 100 61 79.03 100 41.04 0 100 154 68.18 100 46.73 0 100 (0.112)
CEO Characteristics
CEO tenure (years) 201 8.93 7.78 6.25 0.005 43.03 59 8.90 8.33 5.74 0.05 43.03 142 8.95 6.98 6.48 0.06 43.03 (0.963)
CEO age 213 51.93 53 7.48 33 69 59 53.80 54 7.71 33 59 154 51.22 52 7.29 34 69 (0.024)
CEO male (%) 213 100 100 0 0 100 60 100 100 0 0 100 153 100 100 0 0 100
CEO founder (%) 216 12.04 0 32.62 0 100 62 4.84 0 21.63 0 100 154 14.94 0 35.76 0 100 (0.039)**
Same CEO one year after M&A (%) 216 89.81 100 30.31 0 100 62 90.32 100 29.81 0 100 154 89.61 100 30.61 0 100 (0.876)
CEO in nomination committee (%) 156 28.29 100 45.14 0 100 42 4.76 0 21.55 0 100 146 0.68 0 0.83 0 100 (0.064)* CEO in audit committee (%) 188 1.60 100 12.56 0 100 34 2.94 0 17.15 0 100 122 35.25 0 47.97 0 100 (0.001)***
CEO in remuneration committee (%) 184 3.26 100 17.81 0 100 40 10 0 30.38 0 100 144 1.39 0 11.74 0 100 (0.007)***

24
Table 4. Bidder Ownership Structure: Descriptive Statistics.
The table shows the number of firms in which the largest shareholder has a specific ownership stake. The table also presents the mean and standard deviation of the
ownership held by the majority shareholder (panel A). We distinguish the following types of the largest shareholders (panel A): family or individual; financial institution;
non-financial firm; venture capital company; and foundation. For panel B, we add compare the subsample of bidder firms from Continental Europe and the UK. Data
source: Own calculation based on Amadeus Bureau Van Dijk.
Panel A: Largest Blockholder by Type of Owner
Type of Shareholder
Below
10% 10-
20% 20-
60% 60-
100%
Sum of
largest
blocks
Mean of largest
block (%)
Stand.
Dev.
(%)
Family/Individual 9 14 13 4 40 25.17 21.64
Financial Institution 38 57 29 5 129 17.42 14.49
Non-Financial Firm 5 5 17 11 38 41.71 31.49
Venture Capital 3 3 1 - 7 16.91 17.13
Foundation 0 - 2 - 2 32.15 15.34
All 55 79 62 20 216 23.25 21.75
Panel B: Largest Blockholder by Type of Owner for Continental Europe and the UK
Type of Sharholder
Continental Europe UK
Be-
low
10%
10-
20% 20-
60% 60-
100%
Sum of
largest
blocks
Mean of
largest
block
(%)
Stand.
Dev. (%)
Below
10%
10-
20%
20-
60%
60-
100%
Sum of
largest
blocks
Mean of
largest
block
(%)
Stand.
Dev.
(%)
Mean Dif.
(p-value)
Family/Individual - 1 5 3 9 48.45 22.23 9 13 8 1 31 18.41 16.35 (0.0004)***
Financial Institution 9 3 6 3 21 25.74 22.65 29 54 23 2 108 15.79 11.79 (0.358)
Non-Financial Firm 4 2 14 9 29 42.76 30.14 1 3 3 2 9 38.29 37.29 (0.525)
Venture Capital - - 1 - 1 53.50 - 3 3 - - 6 10.81 6.31 (0.134)
Foundation - - 2 - 2 32.15 15.34 - - - - - - - -
All 13 6 28 15 62 42 73 34 5 154
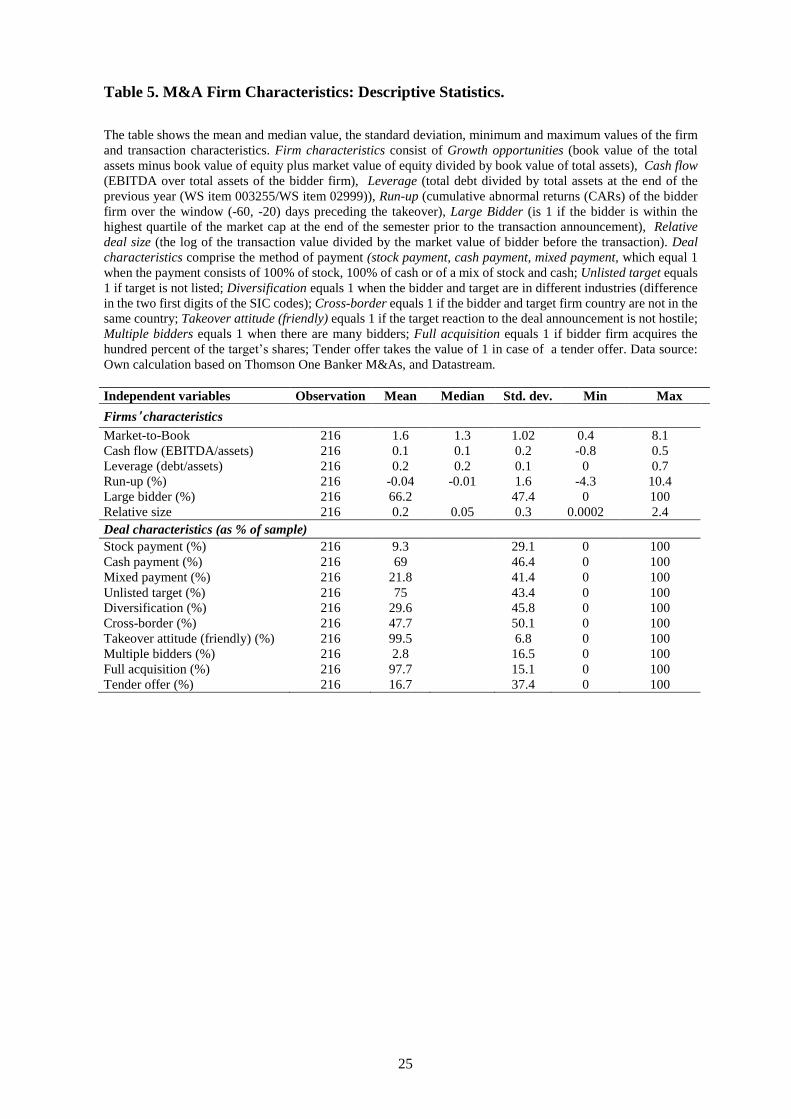
25
Table 5. M&A Firm Characteristics: Descriptive Statistics.
The table shows the mean and median value, the standard deviation, minimum and maximum values of the firm
and transaction characteristics. Firm characteristics consist of Growth opportunities (book value of the total
assets minus book value of equity plus market value of equity divided by book value of total assets), Cash flow
(EBITDA over total assets of the bidder firm), Leverage (total debt divided by total assets at the end of the
previous year (WS item 003255/WS item 02999)), Run-up (cumulative abnormal returns (CARs) of the bidder
firm over the window (-60, -20) days preceding the takeover), Large Bidder (is 1 if the bidder is within the
highest quartile of the market cap at the end of the semester prior to the transaction announcement), Relative
deal size (the log of the transaction value divided by the market value of bidder before the transaction). Deal
characteristics comprise the method of payment (stock payment, cash payment, mixed payment, which equal 1
when the payment consists of 100% of stock, 100% of cash or of a mix of stock and cash; Unlisted target equals
1 if target is not listed; Diversification equals 1 when the bidder and target are in different industries (difference
in the two first digits of the SIC codes); Cross-border equals 1 if the bidder and target firm country are not in the
same country; Takeover attitude (friendly) equals 1 if the target reaction to the deal announcement is not hostile;
Multiple bidders equals 1 when there are many bidders; Full acquisition equals 1 if bidder firm acquires the
hundred percent of the target’s shares; Tender offer takes the value of 1 in case of a tender offer. Data source:
Own calculation based on Thomson One Banker M&As, and Datastream.
Independent variables Observation Mean Median Std. dev. Min Max
Firms’ characteristics
Market-to-Book 216 1.6 1.3 1.02 0.4 8.1
Cash flow (EBITDA/assets) 216 0.1 0.1 0.2 -0.8 0.5
Leverage (debt/assets) 216 0.2 0.2 0.1 0 0.7
Run-up (%) 216 -0.04 -0.01 1.6 -4.3 10.4
Large bidder (%) 216 66.2 47.4 0 100
Relative size 216 0.2 0.05 0.3 0.0002 2.4
Deal characteristics (as % of sample)
Stock payment (%) 216 9.3 29.1 0 100
Cash payment (%) 216 69 46.4 0 100
Mixed payment (%) 216 21.8 41.4 0 100
Unlisted target (%) 216 75 43.4 0 100
Diversification (%) 216 29.6 45.8 0 100
Cross-border (%) 216 47.7 50.1 0 100
Takeover attitude (friendly) (%) 216 99.5 6.8 0 100
Multiple bidders (%) 216 2.8 16.5 0 100
Full acquisition (%) 216 97.7 15.1 0 100
Tender offer (%) 216 16.7 37.4 0 100

26
Table 6. Bidder Cumulative Average Abnormal Returns (CARs)
We show the cumulative abnormal returns for 216 M&A transactions announced by European listed firms on
listed and unlisted target firms (all around the world). To test the significance of the returns, we use the (para-
metric) Dodd and Warner T-test (1983). ***, **, * represent statistical significance at the 1%, 5% and 10%
level.
Event Window All (N=216) Test Dodd & Warner
0 0.72%*** 6.90
(p=0.000)
(-1,+1) 1.38%*** 6.82
(p=0.000)
(-2,+2) 1.62%*** 5.81(
(p=0.000)
(-8,+8) 0.67% 1.29
(p=0.20)
(-20,+20) 0.46% 0.23
(p=0.82)
(-20,0) 0.31% 0.55
(p=0.58)
(0,+5) 1.60%*** 5.51
(p=0.07)
(0,+8) 1.11%*** 3.20
(p=0.000)
(0,+20) 0.87% 1.27
(p=0.21)
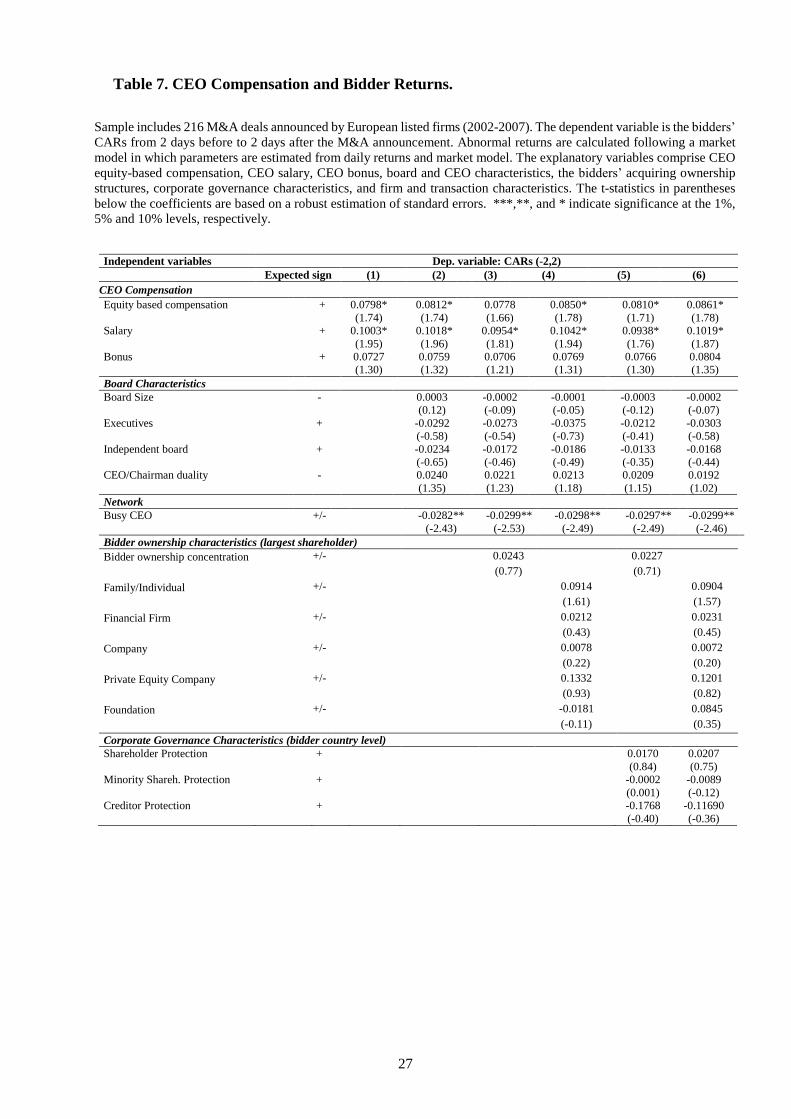
27
Table 7. CEO Compensation and Bidder Returns.
Sample includes 216 M&A deals announced by European listed firms (2002-2007). The dependent variable is the bidders’
CARs from 2 days before to 2 days after the M&A announcement. Abnormal returns are calculated following a market
model in which parameters are estimated from daily returns and market model. The explanatory variables comprise CEO
equity-based compensation, CEO salary, CEO bonus, board and CEO characteristics, the bidders’ acquiring ownership
structures, corporate governance characteristics, and firm and transaction characteristics. The t-statistics in parentheses
below the coefficients are based on a robust estimation of standard errors. ***,**, and * indicate significance at the 1%,
5% and 10% levels, respectively.
Independent variables Dep. variable: CARs (-2,2)
Expected sign (1) (2) (3) (4) (5) (6)
CEO Compensation
Equity based compensation + 0.0798* 0.0812* 0.0778 0.0850* 0.0810* 0.0861*
(1.74) (1.74) (1.66) (1.78) (1.71) (1.78)
Salary + 0.1003* 0.1018* 0.0954* 0.1042* 0.0938* 0.1019*
(1.95) (1.96) (1.81) (1.94) (1.76) (1.87)
Bonus + 0.0727 0.0759 0.0706 0.0769 0.0766 0.0804
(1.30) (1.32) (1.21) (1.31) (1.30) (1.35)
Board Characteristics
Board Size - 0.0003 -0.0002 -0.0001 -0.0003 -0.0002
(0.12) (-0.09) (-0.05) (-0.12) (-0.07)
Executives + -0.0292 -0.0273 -0.0375 -0.0212 -0.0303
(-0.58) (-0.54) (-0.73) (-0.41) (-0.58)
Independent board + -0.0234 -0.0172 -0.0186 -0.0133 -0.0168
(-0.65) (-0.46) (-0.49) (-0.35) (-0.44)
CEO/Chairman duality - 0.0240 0.0221 0.0213 0.0209 0.0192
(1.35) (1.23) (1.18) (1.15) (1.02)
Network
Busy CEO +/- -0.0282** -0.0299** -0.0298** -0.0297** -0.0299**
(-2.43) (-2.53) (-2.49) (-2.49) (-2.46)
Bidder ownership characteristics (largest shareholder)
Bidder ownership concentration +/- 0.0243 0.0227
(0.77) (0.71)
Family/Individual +/- 0.0914 0.0904
(1.61) (1.57)
Financial Firm +/- 0.0212 0.0231
(0.43) (0.45)
Company +/- 0.0078 0.0072
(0.22) (0.20)
Private Equity Company +/- 0.1332 0.1201
(0.93) (0.82)
Foundation +/- -0.0181 0.0845
(-0.11) (0.35)
Corporate Governance Characteristics (bidder country level)
Shareholder Protection + 0.0170 0.0207
(0.84) (0.75)
Minority Shareh. Protection + -0.0002 -0.0089
(0.001) (-0.12)
Creditor Protection + -0.1768 -0.11690
(-0.40) (-0.36)

28
Table 7, continued. CEO Compensation and Bidder Returns.
Independent variables Dep. variable: CARs (-2,2)
Expected
sign (1) (2) (3) (4) (5) (6)
Firm Characteristics
Growth opportunities (MTB) +/- -0.0047 -0.0043 -0.0032 -0.0033 -0.0028 -0.0029
(-0.83) (-0.74) (-0.54) (-0.54) (-0.46) (-0.47)
Free cash flow - 0.0416 0.0295 0.0268 0.0310 0.0283 0.0303
(1.23) (0.85) (0.77) (0.86) (0.80) (0.83)
Leverage + -0.0251 -0.0240 -0.0211 -0.0278 -0.0208 -0.0262
(-0.62) (-0.58) (-0.51) (-0.66) (-0.50) (-0.61)
Run-up +/- 0.6033* 0.5709* 0.5594* 0.5635* 0.4996 0.5112
(1.88) (1.75) (1.71) (1.70) (1.49) (1.51)
Bidder size - 0.0094 0.0142 0.0134 0.0141 0.0134 0.0145
(0.69) (0.91) (0.85) (0.89) (0.84) (0.90)
Relative target size + 0.0368** 0.0336* 0.0339* 0.0354* 0.0348* 0.0356*
(2.05) (1.87) (1.88) (1.95) (1.90) (1.93)
Deal characteristics
Method of payment (Stock) - 0.0008 -0.0028 -0.0059 -0.0037 -0.0050 -0.0040
(0.04) (-0.14) (-0.29) (-0.18) (-0.24) (-0.18)
Target firm status (Unlisted) + -0.0002 -0.0020 -0.0024 -0.0037 0.0001 -0.0029
(-0.01) (-0.10) (-0.11) (-0.17) (0) (-0.13)
Diversification + 0.0105 0.0128 0.0108 0.0106 0.0116 0.0109
(0.94) (1.12) (0.92) (0.988) (0.98) (0.89)
Cross-border +/- -0.0172 -0.0239 -0.0243 -0.0185 -0.0225 -0.0168
(-1.03) (-1.34) (-1.37) (-1.01) (-1.18) (-0.85)
Takeover attitude (friendly) + 0.1852** 0.1869** 0.1780* 0.1676* 0.1796* 0.1664*
(2.07) (2.03) (1.91) (1.76) (1.91) (1.71)
Multiple bidder - -0.0099 -0.0053 -0.0045 -0.0051 -0.0051 -0.0046
(-0.30) (-0.16) (-0.14) (-0.15) (-0.15) (-0.14)
Full acquisition + -0.0354 -0.0373 -0.0298 -0.0246 -0.0285 -0.0212
(-0.70) (-0.72) (-0.56) (-0.45) (-0.53) (-0.38)
Tender offer - -0.0165 -0.0144 -0.0140 -0.0133 -0.0139 -0.0140
(-0.83) (-0.68) (-0.66) (-0.61) (-0.65) (-0.63)
Intercept -0.1206 -0.0699 -0.0593 -0.0581 0.5689 0.5908
(-0.85) (-0.46) (-0.39) (-0.37) (0.30) (0.29)
Industry fixed effects YES YES YES YES YES YES
Country fixed effects YES YES YES YES NO NO
Year fixed effects YES YES YES YES YES YES
R-squared 0.2711 0.3129 0.3159 0.3299 0.3222 0.3349
Observations 216 214 214 214 214 214
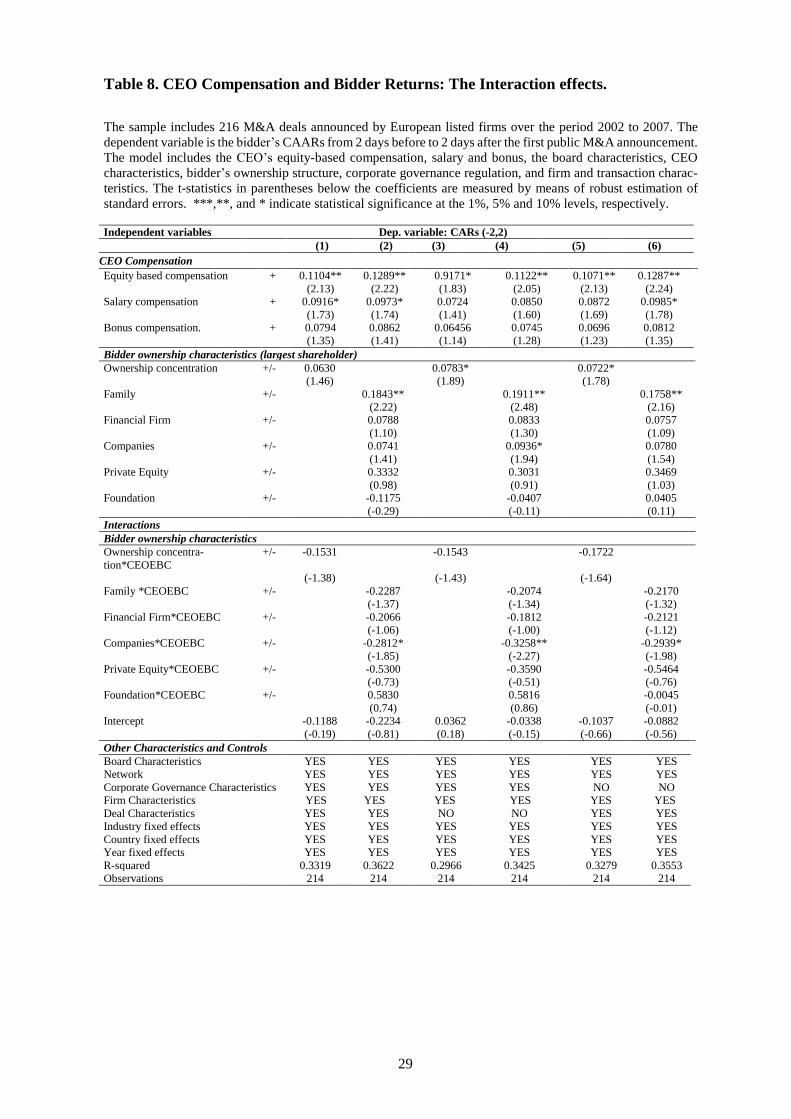
29
Table 8. CEO Compensation and Bidder Returns: The Interaction effects.
The sample includes 216 M&A deals announced by European listed firms over the period 2002 to 2007. The
dependent variable is the bidder’s CAARs from 2 days before to 2 days after the first public M&A announcement.
The model includes the CEO’s equity-based compensation, salary and bonus, the board characteristics, CEO
characteristics, bidder’s ownership structure, corporate governance regulation, and firm and transaction charac-
teristics. The t-statistics in parentheses below the coefficients are measured by means of robust estimation of
standard errors. ***,**, and * indicate statistical significance at the 1%, 5% and 10% levels, respectively.
Independent variables Dep. variable: CARs (-2,2)
(1) (2) (3) (4) (5) (6)
CEO Compensation
Equity based compensation + 0.1104** 0.1289** 0.9171* 0.1122** 0.1071** 0.1287**
(2.13) (2.22) (1.83) (2.05) (2.13) (2.24)
Salary compensation + 0.0916* 0.0973* 0.0724 0.0850 0.0872 0.0985*
(1.73) (1.74) (1.41) (1.60) (1.69) (1.78)
Bonus compensation. + 0.0794 0.0862 0.06456 0.0745 0.0696 0.0812
(1.35) (1.41) (1.14) (1.28) (1.23) (1.35)
Bidder ownership characteristics (largest shareholder)
Ownership concentration +/- 0.0630 0.0783* 0.0722*
(1.46) (1.89) (1.78)
Family +/- 0.1843** 0.1911** 0.1758**
(2.22) (2.48) (2.16)
Financial Firm +/- 0.0788 0.0833 0.0757
(1.10) (1.30) (1.09)
Companies +/- 0.0741 0.0936* 0.0780
(1.41) (1.94) (1.54)
Private Equity +/- 0.3332 0.3031 0.3469
(0.98) (0.91) (1.03)
Foundation +/- -0.1175 -0.0407 0.0405
(-0.29) (-0.11) (0.11)
Interactions
Bidder ownership characteristics
Ownership concentra-
tion*CEOEBC
+/- -0.1531 -0.1543 -0.1722
(-1.38) (-1.43) (-1.64)
Family *CEOEBC +/- -0.2287 -0.2074 -0.2170
(-1.37) (-1.34) (-1.32)
Financial Firm*CEOEBC +/- -0.2066 -0.1812 -0.2121
(-1.06) (-1.00) (-1.12)
Companies*CEOEBC +/- -0.2812* -0.3258** -0.2939*
(-1.85) (-2.27) (-1.98)
Private Equity*CEOEBC +/- -0.5300 -0.3590 -0.5464
(-0.73) (-0.51) (-0.76)
Foundation*CEOEBC +/- 0.5830 0.5816 -0.0045
(0.74) (0.86) (-0.01)
Intercept -0.1188 -0.2234 0.0362 -0.0338 -0.1037 -0.0882
(-0.19) (-0.81) (0.18) (-0.15) (-0.66) (-0.56)
Other Characteristics and Controls
Board Characteristics YES YES YES YES YES YES
Network YES YES YES YES YES YES
Corporate Governance Characteristics YES YES YES YES NO NO
Firm Characteristics YES YES YES YES YES YES
Deal Characteristics YES YES NO NO YES YES
Industry fixed effects YES YES YES YES YES YES
Country fixed effects YES YES YES YES YES YES
Year fixed effects YES YES YES YES YES YES
R-squared 0.3319 0.3622 0.2966 0.3425 0.3279 0.3553
Observations 214 214 214 214 214 214

30
Table 9. CEO Total Compensation.
Sample includes 216 M&A deals announced by European listed firms over the period 2002 to 2007. The de-
pendent variable is the CEO total compensation. The explanatory variables comprise board characteristics, CEO
characteristics, bidder’s ownership structure, corporate governance regulation, and firm and transaction charac-
teristics. The t-statistics in parentheses below the coefficients are based on robust estimation of standard errors.
***, **, and * indicate statistical significance at the 1%, 5% and 10% levels, respectively.
Independent variables Dep. variable: Total CEO Compensation
(1) (2) (3) (4) (5)
Board Characteristics
Board Size + + 0.4297*** 0.5384*** 0.5345*** 0.5438*** 0.5423***
(4.28) (5.48) (5.43) (5.54) (5.45)
Executives - -3.0203 -3.5329* -3.0930 -3.2727 -2.9686
(-1.38) (-1.69) (-1.48) (-1.58) (-1.42)
Independent board - 3.1876** 1.6173 1.5246 1.8963 1.7455
(2.08) (1.08) (1.02) (1.26) (1.15)
CEO/Chairman duality + 0.7148 0.9624 0.9730 1.0734 1.0290
(0.88) (1.24) (1.27) (1.39) (1.34)
Network
CEO busy + 0.2769 0.5613 0.5773 0.6001 0.6087
(0.54) (1.14) (1.16) (1.22) (1.22)
CEO Characteristics
CEO tenure +/- 0.0364 0.0389 0.0310 0.0371 0.0326
(0.90) (1.01) (0.80) (0.96) (0.85)
CEO age - -0.0221 -0.0291 -0.0204 -0.0282 -0.0213
(-0.67) (-0.92) (-0.65) (-0.90) (-0.67)
CEO founder - -1.0269 -1.3651* -1.4679** -1.4217* -1.4896**
(-1.33) (-1.85) (-1.99) (-1.93) (-2.02)
Bidder ownership characteristics
Ownership concentration - -5.6894*** -5.6405***
(-4.55) (-4.51)
Family - -5.8596*** -5.9165***
(-2.98) (-3.02)
Financial Firm - -6.3554*** -6.4418***
(-3.27) (-3.28)
Companies - -5.1582*** -5.2494***
(-3.61) (-3.62)
Private Equity - -8.4267 -9.1371*
(-1.59) (-1.71)
Foundation - 8.6649 6.3860
(1.09) (0.50)
Corporate Governance Characteristics (bidder country level)
Shareholder Protection - -1.2228 -0.2955
(-1.58) (-0.24)
Minority Shar. Protection - 2.7438 1.7026
(1.25) (0.65)
Creditor Protection - -4.0258 -7.4185
(-0.22) (-0.40)
Firm Characteristics
Growth opportunities + 0.4343 0.3105 0.2657 0.2660 0.2581
(1.88) (1.41) (1.20) (1.20) (1.17)
Free cash flow + 0.0938 0.3943 0.2407 0.1877 0.1382
(0.06) (0.27) (0.16) (0.13) (0.09)
Bidder size + 0.2960 0.2305 0.3148 0.2465 0.3015
(0.47) (0.38) (0.52) (0.41) (0.50)
Intercept -1.8398 -0.7021 -1.2745 -11.95 -10.38
(-0.60) (-0.24) (-0.44) (-0.85) (-0.73)
Industry fixed effects YES YES YES YES YES
Country fixed effects YES YES YES NO NO
Year fixed effects YES YES YES YES YES
LR chi2 144.26 (34) 163.92 (35) 168.30 (39) 167.19 (38) 169.21 (42)
Prob>chi2 0.0000 0.0000 0.0000 0.0000 0,0000
Pseudo R-squared 0.1280 0.1454 0.1493 0.1483 0.1501
Observations 198 198 198 198 198

31
Table 10. Excess CEO Total Compensation and on Bidder Returns.
The sample includes 216 M&A deals announced by European listed firms over the period 2002 to 2007. The
dependent variable consists of bidder CARs from 2 days before to 2 days after the M&A announcement. The
explanatory variables are the excess CEO total compensation, board characteristics, CEO characteristics, bidder
ownership structure, corporate governance regulation, and firm and transaction characteristics as control varia-
bles, all of which are explained in Appendix A. The t-statistics in parentheses below the coefficients are based
on robust estimation of standard errors. ***, **, and * indicate significance at the 1%, 5% and 10% levels,
respectively.
Independent variables Dep. variable: CARs (-2,2)
(1) (2) (3) (4) (5)
CEO Compensation
Excess Total Compensation - -1.8939** -0.5020** -0.7539** -0.5302* -0.7748**
(-2.26) (-2.16) (-2.44) (-1.93) (-2.36)
Board Characteristics
Board Size - 0.0002 -0.0007 -0.0002 -0.0010 -0.0008
(0.07) (-0.28) (-0.06) (-0.37) (-0.30)
Executives + -0.0623 -0.0436 -0.0665 -0.0371 -0.0580
(-1.12) (-0.79) (-1.18) (-0.67) (-1.02)
Independent board + -0.0210 -0.0223 -0.0270 -0.0166 -0.0196
(-0.53) (-0.54) (-0.66) (-0.39) (-0.46)
CEO/Chairman duality - 0.03878* 0.0405* 0.0355* 0.0383* 0.0307
(1.95) (1.98) (1.73) (1.84) (1.46)
Network
CEO busy - -0.0282** -0.0280** -0.0283* -0.0284** -0.0299**
(-2.23) (-2.15) (1.74) (-2.14) (-2.24)
Bidder ownership characteristics
Bidder ownership +/- 0.0106 0.0076
(0.30) (0.21)
Family + 0.1104* 0.1131*
(1.74) (1.77)
Financial Firm + -0.0062 0.0028
(-0.11) (0.05)
Companies + -0.0161 -0.0200
(-0.40) (-0.48)
Private Equity + 0.1337 -0.1464
(0.93) (0.99)
Foundation + -0.0477 0.3734
(-0.24) (1.07)
Corporate Governance Characteristics (bidder country level)
Shareholder Protection + 0.0244 0.0549
(1.13) (1.51)
Minority Shar. Protection + -0.0258 -0.0702
(-0.37) (-0.85)
Creditor Protection + -0.1056 -0.1596
(-0.18) (-0.26)
Intercept -0.0310 -0.0304 0.0036 0.0018 -0.0521
(-0.20) (-0.02) (0.02) (0.01) (-0.16)
Other characteristics and controls

32
Firm Characteristics YES YES YES YES YES
Deal Characteristics YES YES YES YES YES
Industry fixed effects YES YES YES YES YES
Country fixed effects YES YES YES NO NO
Year fixed effects YES YES YES YES YES
R-squared 0.3399 0.3402 0.3668 0.3455 0.3765
Observations 198 198 198 198 198
Table 11. CEO Compensation, Bidder Returns, and Ownership Concentration.
The sample includes 214 M&A deals announced by European listed firms over the period 2002 to 2007. The
dependent variable is the bidder’s CAARs from 2 days before to 2 days after the first public M&A announcement.
The model includes the CEO’s equity-based compensation, salary and bonus, the board characteristics, CEO
characteristics, bidder’s ownership structure, corporate governance regulation, and firm and transaction charac-
teristics. The ownership variables capture different degrees of ownership concentration and are defined in Ap-
pendix A. The t-statistics in parentheses below the coefficients are measured by means of robust estimation of
standard errors. ***,**, and * indicate statistical significance at the 1%, 5% and 10% levels, respectively.
Independent variables Dep. variable: CARs (-2,2)
CEO Compensation
Equity based compensation + 0.1267**
(2.31)
Salary compensation + 0.0887*
(1.69)
Bonus compensation. + 0.0502
(0.84)
Bidder ownership characteristics (largest shareholder)
Ownership5/10 +/- 0.0171
(0.73)
Ownership10/20 +/- 0.0129
(0.59)
Ownership20/60 +/- 0.0739**
(2.49)
Ownership60 +/- 0.0622*
(1.88)
Interactions
Bidder ownership characteristics
Ownership5/10*CEOEBC +/- -0.0544
(-0.90)
Ownership10/20 *CEOEBC +/- -0.0541
(-1.04)
Ownership20/60*CEOEBC +/- -0.1380*
(-1.88)
Ownership60*CEOEBC +/- -0.1672**
(-2.12)
Intercept -0.1000
(-0.62)
Other Characteristics and Controls

33
Board Characteristics YES
Network YES
Deal Characteristics YES
Firm Characteristics YES
Industry fixed effects YES
Country fixed effects YES
Year fixed effects YES
R-squared 0.36
Observations 214

34
Table 12. CEO Compensation, Bidder Returns, and Dominant and Minority Sharehold-
ers.
The sample includes 214 M&A deals announced by European listed firms over the period 2002 to 2007. The
dependent variable is the bidder’s CAARs from 2 days before to 2 days after the first public M&A announcement.
The model includes the CEO’s equity-based compensation, salary and bonus, the board characteristics, CEO
characteristics, bidder’s ownership structure, corporate governance regulation, and firm and transaction charac-
teristics. The ownership variables capture different degrees of ownership concentration and are defined in Ap-
pendix A. The t-statistics in parentheses below the coefficients are measured by means of robust estimation of
standard errors. ***,**, and * indicate statistical significance at the 1%, 5% and 10% levels, respectively.
Independent variables Dep. variable: CARs (-2,2)
Equity based compensation 0.1135*
(1.70)
Salary compensation 0.0879
(1.23)
Bonus compensation. 0.0868
(1.12)
Bidder ownership characteristics (largest shareholder)
Dominant Family Stake 0.2317**
(2.32)
with Minority Institut. blocks -0.3819
(-0.66)
with Minority Corporate blocks -0.0678
(-1.19)
Dominant Institutional Stake 0.5003
(0.49)
with Minority Family blocks -0.0005
(-0.04)
with Minority Corporate blocks -0.013
(-0.08)
with Minority Gov. blocks -0.0867
(-1.34)
Dominant Corporate Stake 0.09005
(1.51)
with Minority Family blocks -0.0052
(-0.16)
with Minority Institut. blocks -0.059
(-0.16)
Interactions
Bidder ownership characteristics
Dominant Family*CEOEBC -0.3362
(-1.61)
Dominant Institutional *CEOEBC -0.3965
(-1.30)
Dominant Corporate*CEOEBC -0.3504*
(-2.30)
Other Characteristics and Controls
Board Characteristics YES
Network YES
Firm Characteristics YES
Deal Characteristics YES
Industry fixed effects YES
Country fixed effects YES
Year fixed effects YES
R-squared 0.41
Observations 191

35
Appendix A. Variable Definitions
Variable Definition Source
Dependent Variables
CAAR Cumulative Average Abnormal Return of the bidding firm (by
interval around the M&A announcement date).
Datastream
Explanatory Variables
CEO (or executive) Compensation
Equity-based Compen-
sation (EBC)
Natural logarithm of 1 plus the total CEO equity-based
compensation divided by total CEO compensation
BoardEx
Salary Compensation Natural logarithm of 1 plus the total CEO salary compen-
sation divided by total CEO compensation
BoardEx
Bonus Compensation Natural logarithm of 1 plus the total CEO bonus compen-
sation divided by total CEO compensation
BoardEx
Excess Compensation The predicted total compensation is a predicted variable
taken as a result of adding the coefficient of Board Char-
acteristics, Network, CEO Characteristics and Bidder
Ownership multiplying for each variable obtained in
equation 2.
Core et al. (1999)
Board Characteristics
Board Size Number of executive and non-executives directors in the
board.
BoardEx
Executives Proportion of executives on the board (in the case of a
two-tier board structure, the ‘board’ is the combination
of the management and supervisor boards).
BoardEx
Independent Board Proportion of independent directors on the board. BoardEx
CEO/Chairman Duality Dummy equals 1 if the positions of CEO and Chairman
are held by the same person.
BoardEx
Network
Busy CEO
Dummy equals 1 when the CEO hold more than one ex-
ternal directorship.
BoardEx
CEO characteristics
CEO tenure Number of years that CEO has held CEO position. BoardEx
CEO age Age of CEO BoardEx
CEO founder Dummy equals 1 if CEO is a founder. BoardEx
CEO turnover risk The risk that the CEO is to be replaced, measured follow-
ing Peters and Wagner (2014)
Own calculations
CEO pay slice The proportion of total compensation of the CEO relative
to the top 5 best paid executive directors (Bebchuk,
Cremers and Peyer, 2011)

36
Bidder’s Ownership Concentration
Ownership by type
of shareholder:
Percentage of ownership (voting rights) held by the largest
shareholder at the end of the year prior to the bid. We dis-
tinguish between the following types of shareholders Fam-
ily/individual (not related to an exec. or non-exec. director);
Institutional investors (banks, mutual funds, pension funds,
unit trusts, Financial firm); Corporation; Private Equity;
Foundation; Government.
Amadeus Bureau
Van Dijk Data-
base
Ownership 5/10
Ownership 10/20 Ow-
nership 20/60 Ow-
nership60
Dummy variable equal to 1 when the ownership stake of
the largest shareholder is between 5 and 10%, 10 and 20%,
20 and 60% and above 60%, respecitively
Ídem
Dominant Family/ Institu-
tional/ Corporate Stake
These variables are dummy variables set to one if the larg-
est blockholder is of this type of shareholder (Fidrmuc et
al., 2006).
Ídem
With Minority Family/
Corporate / Institutional /
Government Blocks
These variables are interaction terms of the dummy cap-
turing the presence of a minority block of this type with
the presence of a dominant shareholder of the types men-
tioned above (Fidrmuc et al., 2006).
idem
Corporate Governance (at country level)
Shareholder Protec-
tion
Shareholder right index (of Martynova and Renneboog,
20011b) divided by the Rule of Law index of the World
Bank.
Martynova and
Renneboog
(2008)
Minority share-
holder protection
Minority shareholder rights index(of Martynova and
Renneboog, 2011b) divided by the Rule of Law index of
the World Bank.
Martynova and
Renneboog
(2008)
Creditor protection Creditor right index (of Martynova and Renneboog, 2011b)
divided by the Rule of Law index of the World Bank.
Martynova and
Renneboog
(2008)
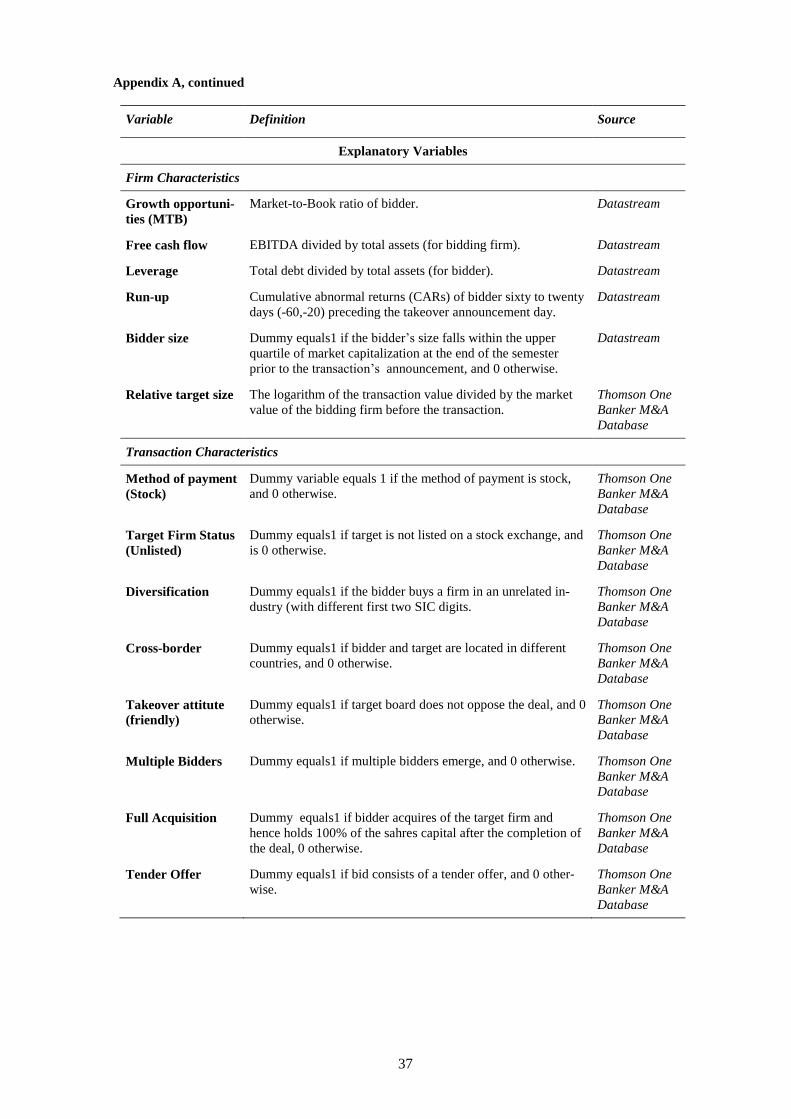
37
Appendix A, continued
Variable Definition Source
Explanatory Variables
Firm Characteristics
Growth opportuni-
ties (MTB)
Market-to-Book ratio of bidder. Datastream
Free cash flow EBITDA divided by total assets (for bidding firm). Datastream
Leverage Total debt divided by total assets (for bidder). Datastream
Run-up Cumulative abnormal returns (CARs) of bidder sixty to twenty
days (-60,-20) preceding the takeover announcement day.
Datastream
Bidder size Dummy equals1 if the bidder’s size falls within the upper
quartile of market capitalization at the end of the semester
prior to the transaction’s announcement, and 0 otherwise.
Datastream
Relative target size The logarithm of the transaction value divided by the market
value of the bidding firm before the transaction.
Thomson One
Banker M&A
Database
Transaction Characteristics
Method of payment
(Stock)
Dummy variable equals 1 if the method of payment is stock,
and 0 otherwise.
Thomson One
Banker M&A
Database
Target Firm Status
(Unlisted)
Dummy equals1 if target is not listed on a stock exchange, and
is 0 otherwise.
Thomson One
Banker M&A
Database
Diversification Dummy equals1 if the bidder buys a firm in an unrelated in-
dustry (with different first two SIC digits.
Thomson One
Banker M&A
Database
Cross-border Dummy equals1 if bidder and target are located in different
countries, and 0 otherwise.
Thomson One
Banker M&A
Database
Takeover attitute
(friendly)
Dummy equals1 if target board does not oppose the deal, and 0
otherwise.
Thomson One
Banker M&A
Database
Multiple Bidders Dummy equals1 if multiple bidders emerge, and 0 otherwise. Thomson One
Banker M&A
Database
Full Acquisition Dummy equals1 if bidder acquires of the target firm and
hence holds 100% of the sahres capital after the completion of
the deal, 0 otherwise.
Thomson One
Banker M&A
Database
Tender Offer Dummy equals1 if bid consists of a tender offer, and 0 other-
wise.
Thomson One
Banker M&A
Database
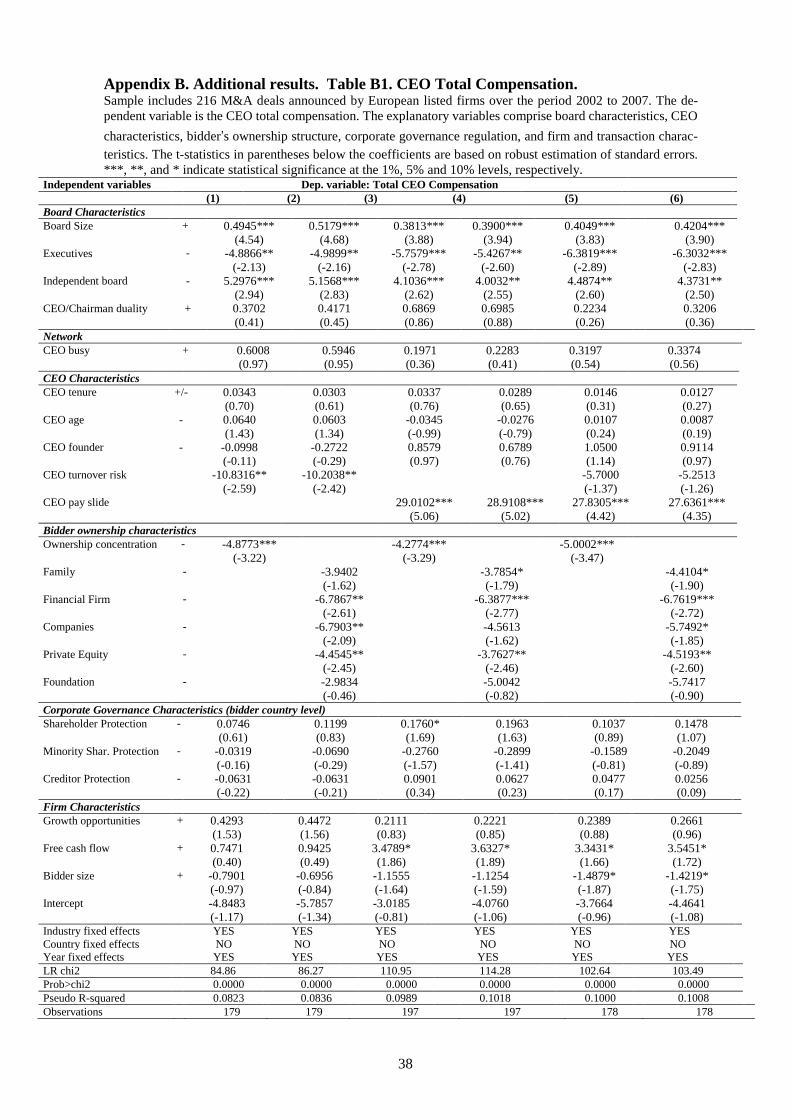
38
Appendix B. Additional results. Table B1. CEO Total Compensation. Sample includes 216 M&A deals announced by European listed firms over the period 2002 to 2007. The de-
pendent variable is the CEO total compensation. The explanatory variables comprise board characteristics, CEO
characteristics, bidder’s ownership structure, corporate governance regulation, and firm and transaction charac-
teristics. The t-statistics in parentheses below the coefficients are based on robust estimation of standard errors.
***, **, and * indicate statistical significance at the 1%, 5% and 10% levels, respectively. Independent variables Dep. variable: Total CEO Compensation
(1) (2) (3) (4) (5) (6)
Board Characteristics
Board Size + + 0.4945*** 0.5179*** 0.3813*** 0.3900*** 0.4049*** 0.4204***
(4.54) (4.68) (3.88) (3.94) (3.83) (3.90) Executives - -4.8866** -4.9899** -5.7579*** -5.4267** -6.3819*** -6.3032***
(-2.13) (-2.16) (-2.78) (-2.60) (-2.89) (-2.83) Independent board - 5.2976*** 5.1568*** 4.1036*** 4.0032** 4.4874** 4.3731**
(2.94) (2.83) (2.62) (2.55) (2.60) (2.50) CEO/Chairman duality + 0.3702 0.4171 0.6869 0.6985 0.2234 0.3206
(0.41) (0.45) (0.86) (0.88) (0.26) (0.36)
Network
CEO busy + 0.6008 0.5946 0.1971 0.2283 0.3197 0.3374
(0.97) (0.95) (0.36) (0.41) (0.54) (0.56)
CEO Characteristics
CEO tenure +/- 0.0343 0.0303 0.0337 0.0289 0.0146 0.0127
(0.70) (0.61) (0.76) (0.65) (0.31) (0.27) CEO age - 0.0640 0.0603 -0.0345 -0.0276 0.0107 0.0087
(1.43) (1.34) (-0.99) (-0.79) (0.24) (0.19) CEO founder - -0.0998 -0.2722 0.8579 0.6789 1.0500 0.9114
(-0.11) (-0.29) (0.97) (0.76) (1.14) (0.97) CEO turnover risk -10.8316** -10.2038** -5.7000 -5.2513
(-2.59) (-2.42) (-1.37) (-1.26) CEO pay slide 29.0102*** 28.9108*** 27.8305*** 27.6361***
(5.06) (5.02) (4.42) (4.35)
Bidder ownership characteristics
Ownership concentration - -4.8773*** -4.2774*** -5.0002***
(-3.22) (-3.29) (-3.47)
Family - -3.9402 -3.7854* -4.4104*
(-1.62) (-1.79) (-1.90) Financial Firm - -6.7867** -6.3877*** -6.7619***
(-2.61) (-2.77) (-2.72) Companies - -6.7903** -4.5613 -5.7492*
(-2.09) (-1.62) (-1.85) Private Equity - -4.4545** -3.7627** -4.5193**
(-2.45) (-2.46) (-2.60) Foundation - -2.9834 -5.0042 -5.7417
(-0.46) (-0.82) (-0.90)
Corporate Governance Characteristics (bidder country level)
Shareholder Protection - 0.0746 0.1199 0.1760* 0.1963 0.1037 0.1478
(0.61) (0.83) (1.69) (1.63) (0.89) (1.07) Minority Shar. Protection - -0.0319 -0.0690 -0.2760 -0.2899 -0.1589 -0.2049
(-0.16) (-0.29) (-1.57) (-1.41) (-0.81) (-0.89) Creditor Protection - -0.0631 -0.0631 0.0901 0.0627 0.0477 0.0256
(-0.22) (-0.21) (0.34) (0.23) (0.17) (0.09)
Firm Characteristics
Growth opportunities + 0.4293 0.4472 0.2111 0.2221 0.2389 0.2661
(1.53) (1.56) (0.83) (0.85) (0.88) (0.96) Free cash flow + 0.7471 0.9425 3.4789* 3.6327* 3.3431* 3.5451*
(0.40) (0.49) (1.86) (1.89) (1.66) (1.72) Bidder size + -0.7901 -0.6956 -1.1555 -1.1254 -1.4879* -1.4219*
(-0.97) (-0.84) (-1.64) (-1.59) (-1.87) (-1.75) Intercept -4.8483 -5.7857 -3.0185 -4.0760 -3.7664 -4.4641
(-1.17) (-1.34) (-0.81) (-1.06) (-0.96) (-1.08)
Industry fixed effects YES YES YES YES YES YES
Country fixed effects NO NO NO NO NO NO
Year fixed effects YES YES YES YES YES YES
LR chi2 84.86 86.27 110.95 114.28 102.64 103.49
Prob>chi2 0.0000 0.0000 0.0000 0.0000 0.0000 0.0000
Pseudo R-squared 0.0823 0.0836 0.0989 0.1018 0.1000 0.1008
Observations 179 179 197 197 178 178
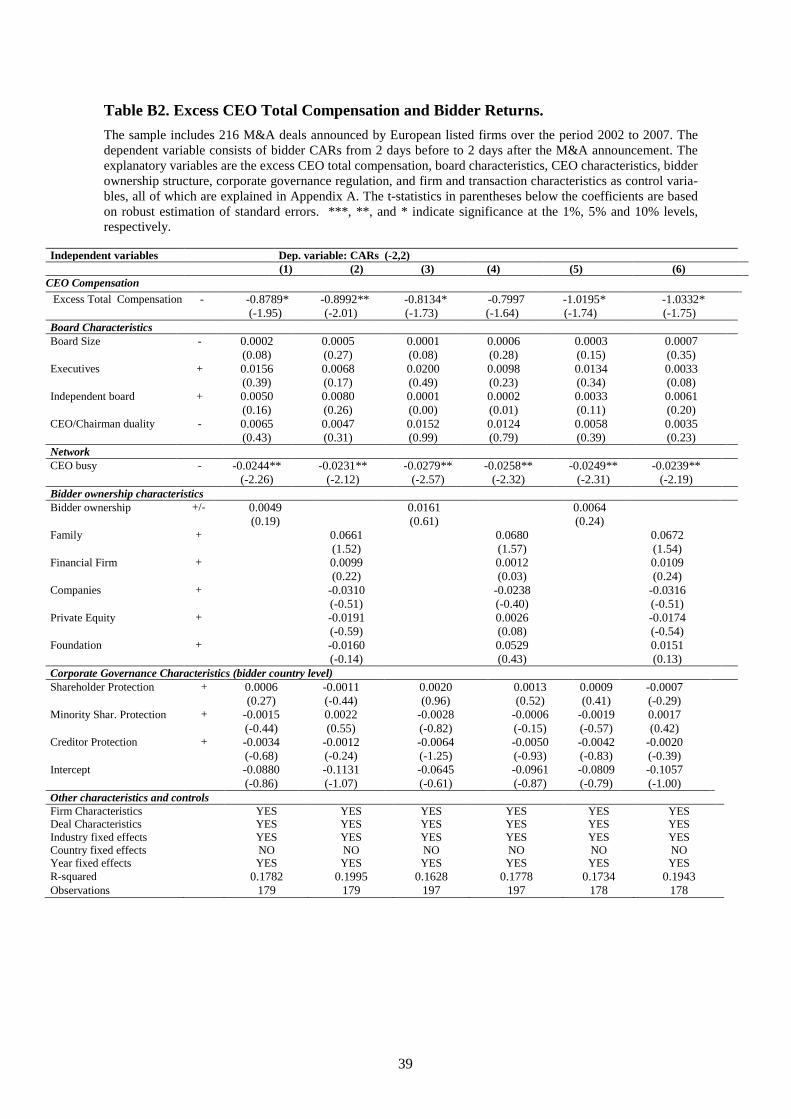
39
Table B2. Excess CEO Total Compensation and Bidder Returns.
The sample includes 216 M&A deals announced by European listed firms over the period 2002 to 2007. The
dependent variable consists of bidder CARs from 2 days before to 2 days after the M&A announcement. The
explanatory variables are the excess CEO total compensation, board characteristics, CEO characteristics, bidder
ownership structure, corporate governance regulation, and firm and transaction characteristics as control varia-
bles, all of which are explained in Appendix A. The t-statistics in parentheses below the coefficients are based
on robust estimation of standard errors. ***, **, and * indicate significance at the 1%, 5% and 10% levels,
respectively.
Independent variables Dep. variable: CARs (-2,2)
(1) (2) (3) (4) (5) (6)
CEO Compensation
Excess Total Compensation - -0.8789* -0.8992** -0.8134* -0.7997 -1.0195* -1.0332*
(-1.95) (-2.01) (-1.73) (-1.64) (-1.74) (-1.75)
Board Characteristics
Board Size - 0.0002 0.0005 0.0001 0.0006 0.0003 0.0007
(0.08) (0.27) (0.08) (0.28) (0.15) (0.35) Executives + 0.0156 0.0068 0.0200 0.0098 0.0134 0.0033
(0.39) (0.17) (0.49) (0.23) (0.34) (0.08) Independent board + 0.0050 0.0080 0.0001 0.0002 0.0033 0.0061
(0.16) (0.26) (0.00) (0.01) (0.11) (0.20) CEO/Chairman duality - 0.0065 0.0047 0.0152 0.0124 0.0058 0.0035
(0.43) (0.31) (0.99) (0.79) (0.39) (0.23)
Network
CEO busy - -0.0244** -0.0231** -0.0279** -0.0258** -0.0249** -0.0239**
(-2.26) (-2.12) (-2.57) (-2.32) (-2.31) (-2.19)
Bidder ownership characteristics
Bidder ownership +/- 0.0049 0.0161 0.0064
(0.19) (0.61) (0.24)
Family + 0.0661 0.0680 0.0672
(1.52) (1.57) (1.54) Financial Firm + 0.0099 0.0012 0.0109
(0.22) (0.03) (0.24) Companies + -0.0310 -0.0238 -0.0316
(-0.51) (-0.40) (-0.51) Private Equity + -0.0191 0.0026 -0.0174
(-0.59) (0.08) (-0.54) Foundation + -0.0160 0.0529 0.0151
(-0.14) (0.43) (0.13)
Corporate Governance Characteristics (bidder country level)
Shareholder Protection + 0.0006 -0.0011 0.0020 0.0013 0.0009 -0.0007
(0.27) (-0.44) (0.96) (0.52) (0.41) (-0.29) Minority Shar. Protection + -0.0015 0.0022 -0.0028 -0.0006 -0.0019 0.0017
(-0.44) (0.55) (-0.82) (-0.15) (-0.57) (0.42) Creditor Protection + -0.0034 -0.0012 -0.0064 -0.0050 -0.0042 -0.0020
(-0.68) (-0.24) (-1.25) (-0.93) (-0.83) (-0.39) Intercept -0.0880 -0.1131 -0.0645 -0.0961 -0.0809 -0.1057
(-0.86) (-1.07) (-0.61) (-0.87) (-0.79) (-1.00)
Other characteristics and controls
Firm Characteristics YES YES YES YES YES YES
Deal Characteristics YES YES YES YES YES YES
Industry fixed effects YES YES YES YES YES YES
Country fixed effects NO NO NO NO NO NO
Year fixed effects YES YES YES YES YES YES
R-squared 0.1782 0.1995 0.1628 0.1778 0.1734 0.1943
Observations 179 179 197 197 178 178

40
Table B3. CEO Compensation and Bidder Returns (Heckman model).
Sample includes European listed firms (2002-2007). The dependent variable is the bidders’ CARs from 2 days before to
2 days after the M&A announcement (2nd Stage) and the M&A probability (1st Stage). The explanatory variables comprise
CEO equity-based compensation, the bidders’ acquiring ownership structures, corporate governance characteristics, and
firm and transaction characteristics. The t-statistics in parentheses below the coefficients are based on a robust estimation
of standard errors. ***,**, and * indicate significance at the 1%, 5% and 10% levels, respectively.
Independent variables Dep.variables: CARs (-2,2) (2nd Stage) and M&A probability (1st Stage)
(1) (2) (3) (4) (5) (6)
CARs
(2nd Stage)
M&A prob.
(1st Stage)
CARs
(2nd Stage)
M&A prob.
(1st Stage)
CARs
(2nd Stage)
M&A prob.
(1st Stage)
CEO Compensation
Equity based compensation 0.0378* -2.4744*** 0.0428* -2.5177*** 0.0438* -2.2900**
(1.76) (-2.77) (1.94) (-3.76) (1.76) (-2.32)
Bidder ownership characteristics Ownership concentration 0.0674** 0.0256 0.0730*** -1.9606*** 0.0620* 0.1882
(2.39) (0.02) (2.69) (-2.92) (1.70) (0.17)
Firm Characteristics
Growth opportunities (MTB) 0.0044 -1.5118*** 0.0053 -0.9379*** 0.0070 -1.4561***
(0.65) (-4.16) (0.75) (-4.98) (0.90) (-4.16) Free cash flow 0.0583* 3.9424*** 0.0539* 2.8338*** 0.0689* 4.6870***
(1.81) (2.71) (1.67) (2.89) (1.82) (2.99) Leverage 0.0485 2.6967 0.0656 -1.4419 0.0454 -0.9907
(1.16) (0.98) (1.62) (-0.79) (0.87) (-0.35) Run-up 0.3768 0.3083 0.5590*
(1.49) (1.24) (1.92) Bidder size -0.0064* -0.4002** -0.0067** -0.0564 -0.0093** -0.1188
(-1.96) (-2.32) (-2.10) (-0.54) (-2.19) (-0.75) Relative target size 0.0359** 0.0351** 0.0324*
(2.26) (2.26) (1.80)
Deal characteristics
Method of payment (Stock) -0.0076 -0.0067 -0.0070
(-0.53) (-0.47) (-0.40) Target firm status (Unlisted) -0.0043 -0.0097 -0.0097
(-0.29) (-0.65) (-0.54) Diversification 0.0061 0.0046 0.0160
(0.62) (0.47) (1.36) Cross-border 0.0112 0.0101 0.0106
(1.07) (0.99) (0.86) Takeover attitude (friendly) 0.1095* 0.1420** 0.1410*
(1.69) (2.20) (1.76) Multiple bidder 0.0054 -0.0004 0.0082
(0.19) (-0.01) (0.25) Full acquisition -0.0135 -0.0191 -0.0343
(-0.44) (-0.65) (-0.85) Tender offer -0.0336** -0.0415** -0.0397*
(-1.99) (-2.46) (-1.96)
Corporate Governance Characteristics (bidder country level)
Shareholder Protection 0.0001 0.3987***
(0.07) (3.78) Minority Shar. Protection -0.0001 -0.3512***
(-0.04) (-2.59)
Creditor Protection -0.0050 -0.5519**
(-1.15) (-2.04) Perc_cross_border M&As -6.6676 9.6468*** -8.8992 (-0.98) (3.77) (-0.46) Lambda -0.0519*** -0.0353** -0.0581***
(-2.68) (-2.12) (-2.89) Intercept -0.0176 13.1707 -0.0715 9.2608*** -0.0403 14.9646
(-0.17) (1.44) (-0.75) (3.59) (-0.35) (0.10) Industry fixed effects YES YES YES YES YES YES
Country fixed effects NO NO NO NO YES YES
Year fixed effects YES YES YES YES YES YES
Observations 90 274 114 298 114 298

41
Table B4. CEO Compensation and Bidder Returns (Heckman model).
Sample includes European listed firms (2002-2007). The dependent variable is the bidders’ CARs from 2 days before to
2 days after the M&A announcement (2nd Stage) and the M&A probability (1st Stage). The explanatory variables comprise
CEO equity-based compensation, the bidders’ acquiring ownership structures, corporate governance characteristics, and
firm and transaction characteristics. The t-statistics in parentheses below the coefficients are based on a robust estimation
of standard errors. ***,**, and * indicate significance at the 1%, 5% and 10% levels, respectively.
Independent Variables Dep.variables: CARs (-2,2) (2nd Stage) and M&A probability (1st Stage)
(1) (2) (3) (4) (5) (6)
CARs
(2nd Stage)
M&A prob.
(1st Stage)
CARs
(2nd Stage)
M&A prob.
(1st Stage)
CARs
(2nd Stage)
M&A prob.
(1st Stage)
CEO Compensation
Equity based compensation 0.0367* -2.1583** 0.0421* -2.3703*** 0.0435* -2.1541**
(1.74) (-2.39) (1.87) (-3.50) (1.77) (-2.20)
Bidder ownership characteristics Ownership concentration 0.0609** -0.3821 0.0656** -2.0459*** 0.0443 0.0644
(2.01) (-0.32) (2.20) (-2.99) (1.09) (0.06)
Board Characteristics
Board Size 0.0015 0.0020 0.0026
(0.65) (0.91) (0.91) Executives 0.0219 0.0175 -0.0020
(0.54) (0.49) (-0.04) Independent board -0.0148 -0.0139 -0.0008
(-0.47) (-0.47) (-0.02) CEO/Chairman duality -0.0007 -0.0027 0.0039
(-0.04) (-0.21) (0.21)
Network
Busy CEO -0.0177 -0.0180* -0.0136
(-1.57) (-1.66) (-1.02)
Firm Characteristics
Growth opportunities (MTB) 0.0037 -1.6502*** 0.0046 -0.9714*** 0.0055 -1.4858***
(0.54) (-4.14) (0.65) (-5.01) (0.72) (-4.20) Free cash flow 0.0562* 3.8171*** 0.0559* 2.7357*** 0.0652 4.5293***
(1.69) (2.65) (1.65) (2.77) (1.64) (2.89) Leverage 0.0364 2.8377 0.0519 -1.1014 0.0411 -0.7420
(0.87) (1.07) (1.27) (-0.59) (0.80) (-0.26) Run-up 0.3553 0.3021 0.5815**
(1.40) (1.20) (2.00) Bidder size -0.0052 -0.4377** -0.0062 -0.0723 -0.0105* -0.1393
(-1.17) (-2.49) (-1.42) (-0.67) (-1.88) (-0.86) Relative target size 0.0325** 0.0314** 0.0288
(2.07) (2.02) (1.62)
Corporate Governance Characteristics (bidder country level)
Shareholder Protection 0.0006 0.3993***
(0.27) (3.78) Minority Shar. Protection -0.0013 -0.3662***
(-0.40) (-2.67) Creditor Protection -0.0042 -0.5704**
(-0.89) (-2.04) Perc_cross_border M&As -7.1939 9.5043*** -5.8822 (-1.04) (3.70) (-0.30) lambda -0.0457** -0.0287 -0.0569***
(-2.28) (-1.62) (-2.80) Intercept -0.0236 14.8726 -0.0804 9.5613*** -0.0058 14.5837
(-0.22) (0.09) (-0.78) (3.73) (-0.05) (0.12)
Other characteristics and controls
Deal Characteristics YES YES YES YES YES YES
Industry fixed effects YES YES YES YES YES YES
Country fixed effects NO NO NO NO YES YES
Year fixed effects YES YES YES YES YES YES
Observations 92 272 114 296 114 296