
Tilburg University Corporate Governance and Bank ... · No. 2014-053 CORPORATE GOVERNANCE AND BANK...
53
Tilburg University Corporate Governance and Bank Insolvency Risk Anginer, D.; Demirguc-Kunt, A.; Huizinga, Harry; Ma, K. Document version: Early version, also known as pre-print Publication date: 2014 Link to publication Citation for published version (APA): Anginer, D., Demirguc-Kunt, A., Huizinga, H. P., & Ma, K. (2014). Corporate Governance and Bank Insolvency Risk: International Evidence. (EBC Discussion Paper; Vol. 2014-010). Tilburg: EBC. General rights Copyright and moral rights for the publications made accessible in the public portal are retained by the authors and/or other copyright owners and it is a condition of accessing publications that users recognise and abide by the legal requirements associated with these rights. - Users may download and print one copy of any publication from the public portal for the purpose of private study or research - You may not further distribute the material or use it for any profit-making activity or commercial gain - You may freely distribute the URL identifying the publication in the public portal Take down policy If you believe that this document breaches copyright, please contact us providing details, and we will remove access to the work immediately and investigate your claim. Download date: 02. Feb. 2019
Transcript of Tilburg University Corporate Governance and Bank ... · No. 2014-053 CORPORATE GOVERNANCE AND BANK...
Tilburg University
Corporate Governance and Bank Insolvency Risk
Anginer, D.; Demirguc-Kunt, A.; Huizinga, Harry; Ma, K.
Document version:Early version, also known as pre-print
Publication date:2014
Link to publication
Citation for published version (APA):Anginer, D., Demirguc-Kunt, A., Huizinga, H. P., & Ma, K. (2014). Corporate Governance and Bank InsolvencyRisk: International Evidence. (EBC Discussion Paper; Vol. 2014-010). Tilburg: EBC.
General rightsCopyright and moral rights for the publications made accessible in the public portal are retained by the authors and/or other copyright ownersand it is a condition of accessing publications that users recognise and abide by the legal requirements associated with these rights.
- Users may download and print one copy of any publication from the public portal for the purpose of private study or research - You may not further distribute the material or use it for any profit-making activity or commercial gain - You may freely distribute the URL identifying the publication in the public portal
Take down policyIf you believe that this document breaches copyright, please contact us providing details, and we will remove access to the work immediatelyand investigate your claim.
Download date: 02. Feb. 2019
No. 2014-053
CORPORATE GOVERNANCE AND BANK
INSOLVENCY RISK: INTERNATIONAL EVIDENCE
By
Deniz Anginer, Asli Demirguc-Kunt, Harry Huizinga, Kebin Ma
This is also a EBC Discussion Paper No. 2014-010
4 September, 2014
ISSN 0924-7815 ISSN 2213-9532
1
Corporate Governance and Bank Insolvency Risk:
International Evidence1
Deniz Anginer
Virginia Tech, Pamplin College of Business
Asli Demirguc-Kunt
Word Bank
Harry Huizinga
Tilburg University and CEPR
Kebin Ma
World Bank
This draft: July 2014
Abstract: This paper finds that shareholder-friendly corporate governance is positively
associated with bank insolvency risk, as proxied by the Z-score and the Merton’s distance
to default measure, for an international sample of banks over the 2004-2008 period.
Banks are special in that ‘good’ corporate governance increases bank insolvency risk
relatively more for banks that are large and located in countries with sound public
finances, as banks aim to exploit the financial safety net. ‘Good’ corporate governance is
specifically associated with higher asset volatility, more non-performing loans, and a
lower tangible capital ratio. Furthermore, ‘good’ corporate governance is associated with
more bank risk taking at times of rapid economic expansion. Consistent with increased
risk-taking, ‘good’ corporate governance is associated with a higher valuation of the
implicit insurance provided by the financial safety net, especially in the case of large
banks. These results underline the importance of the financial safety net and too-big-to-
fail policies in encouraging excessive risk-taking by banks.
Key words: Corporate governance; Bank insolvency; Capitalization; Non-performing
loans
JEL Classification: G21, M21
1 Anginer: [email protected]; Demirguc-Kunt: [email protected]; Huizinga:
[email protected], Ma: [email protected]. This paper’s findings, interpretations, and conclusions are
entirely those of the authors and do not necessarily represent the views of the World Bank, its Executive
Directors, or the countries they represent.
2
1. Introduction
Corporate managers may be more risk averse than shareholders, as corporate
bankruptcy generally causes managers to lose their jobs, part of their personal wealth and
their reputation. ‘Good’ corporate governance - promoting the interests of shareholders –
may serve to counteract managers’ bias against risk taking. In line with this, John, Litov,
and Young (2008) find that ‘better’ corporate governance represented in the form of
stronger investor protection brings about increased risk-taking and higher growth for an
international sample of non-financial firms.
For financial institutions, the calculus regarding the optimal degree of risk taking
is different than for non-financial firms, as banks tend to be supported by the financial
safety net if they become distressed. Banks, in particular, benefit from deposit insurance
and may receive generous public support to prevent their failure. The financial safety
provides banks with an incentive to take on excessive risks in order to increase the value
of these benefits. Hence, the financial safety net is expected to affect the association
between risk taking and corporate governance (see for example, Laeven, 2013). Large
banks may benefit relatively more from the financial safety net, as they may be deemed
too big to fail by regulators (see Acharya, Anginer and Warburton 2014, , and Bertay,
Demirguc-Kunt, and Huizinga, 2013). For this reason, shareholder-friendly corporate
governance may increase risk taking more in the case of large banks. Similarly, a
country’s financial safety net is more credible if it has sound public finances (Acharya,
Drechsler, and Schnabl, 2013, and Demirguc-Kunt, and Huizinga, 2013). Therefore,
shareholder-friendly corporate governance is likely to increase bank risk taking especially
in fiscally strong countries.
3
This paper empirically examines the relationships between bank risk taking and
corporate governance for an international sample of banks from 22 countries over the
2004-2008 period. Following Aggarwal et al. (2009), we use an overall index of the
shareholder-friendliness of corporate governance, and subindices dealing with board
composition, compensation, auditing and takeover-related issues, based on data from
Institutional Shareholder Services.
We find that a bank’s insolvency risk, proxied by its Z-score or market-based
distance to default, is positively associated with the overall index of the shareholder-
friendliness of its corporate governance. The positive relationships between overall bank
risk and different measures of corporate governance are robust to instrumental variables
estimation, where, as instruments we use the annual country-mean values of the corporate
governance variables over all banks after excluding the pertinent bank.
Furthermore, we find that bank insolvency riskis positively associated with the
shareholder-friendliness of a bank’s corporate governance especially for large banks and
for banks located in fiscally sound countries. These results are consistent with the view
that shareholder-friendly corporate governance increases bank risk more if the additional
bank risk significantly increases a bank’s contingent claim on the financial safety net.
Going beyond measures of insolvency risk, we also examine the ‘channels’
through which a bank takes on more risk, if it has more shareholder-friendly corporate
governance. On the asset side, we find that asset volatility derived from Merton’s option
pricing model, and the share of non-performing loans in total loans, are positively related
to ‘good’ corporate governance. On the liability side, we find a negative relationship
between a bank’s tangible equity ratio and the corporate governance index.
4
Our results also suggest that corporate governance affects the relationship
between bank risk taking and the business cycle. Specifically, lending at banks with more
shareholder-friendly corporate governance is more procyclical as such banks may care
less about the riskiness of expanding credit at the height of the business cycle. In addition,
we find that banks with ‘good’ corporate governance report less non-performing loans at
times of high economic growth. This suggests that banks with ‘good’ corporate
governance bias their reporting of non-performing loans downward during periods of
rapid economic expansion so as to preserve capital to be able to continue to increase
credit. Similarly, we see that banks with ‘good’ corporate governance have relatively low
tangible capital ratios when the economy grows rapidly.
The higher bank risk associated with shareholder-friendly corporate governance
should benefit banks to the extent that this increases the valuation of the implicit
insurance provided by the financial safety net. As an extension, we examine the
relationship between corporate governance and the estimated value of the implicit
insurance provided by the financial safety net. We find that shareholder-friendly
corporate governance is associated with a higher value of the implicit insurance,
especially for large banks. This is consistent with the notion that large banks have an
incentive to increase the value of the implicit insurance by increasing their risk, since
their too-large-to-fail status increases their chances of collecting on this insurance.
Our study fits in an emerging literature that has addressed the impact of corporate
governance on bank risk taking.2 Pathan (2009) finds that small boards and boards that
are not controlled by the CEO lead to additional bank risk as reflected in market
measures of risk and the Z-score for a sample of US bank holding companies over the
2 Recent surveys are offered by Becht, Bolton, and Roell (2011) and Mehran, Morrison and Shapiro (2012).
5
1997-2004 period. Chen, Steiner, and Whyte (2006), in turn, find a positive impact of
option-based executive compensation and wealth on market measures of risk for a sample
of US commercial banks during the period 1992-2000. DeYoung, Peng, and Yan (2013)
further find that CEO risk-taking incentives lead to riskier business policy decisions
(regarding loans to businesses, non-interest based banking activities, and investment in
mortgage-backed securities) at US commercial banks over the 1994-2006 period,
especially in the second half of the sample period after deregulation and for the largest
banks. Calomiris and Carlson (2014) examine bank ownership and risk-taking at US
banks in the 1890s, finding that higher managerial ownership is associated with lower
bank default risk.
Several papers have also examined how banks with different corporate
governance regimes fared during the crisis, with mixed results. Berger, Bjorn, and Rauch
(2012) find that high shareholdings of outside directors and chief officers imply a
substantially lower probability of bank failure for US commercial banks over the 2007-
2010 period. Fahlenbrach and Stulz (2011) find some evidence that US banks with CEOs
whose incentives were better aligned with the interests of shareholders in 2006 had worse
share price performance during the subsequent crisis. Ellul and Yerramilli (2013) report
that US bank holding companies that had a strong and independent risk management
function in place before the onset of the financial crisis fared better in terms of operating
and stock performance during the crisis.
However, multi-country studies of bank corporate governance and risk taking are
relatively scarce. Laeven and Levine (2009) examine the relationship between bank
ownership and bank risk taking for an international sample of banks. They find that

6
greater cash flow rights of large owners are associated with greater bank risk, consistent
with the hypothesis that bank shareholders favor risk-taking relative to managers and
creditors. These authors also consider the interaction between bank regulation and
ownership, finding that deposit insurance is associated with an increase in risk only when
the bank has a large equity holder. More recently, using international data, Erkens, Hung,
and Matos (2012) find that financial institutions with more independent boards and
higher institutional ownership experienced worse stock returns during the global financial
crisis.
Our contribution to this literature is three-fold. First, we use international bank-
level data for 22 countries to study the association between bank risk and corporate
governance, adding to a literature which has mostly relied on US data. Second, using
multi-country data allows us to exploit differences across country safety-nets to study
how the relationship between bank risk-taking and corporate governance varies with the
generosity and credibility of the safety net and banks’ ability to engage in risk-shifting.
Third, we are able to study how banks increase their risk-taking with more share-holder
friendly corporate governance, identifying increased asset risk, reduced capitalization,
and the pursuit of more pro-cyclical lending policies as potential channels.
Overall, our findings on the interaction of bank-level corporate governance
variables and the financial safety net has important implications for corporate governance
reforms in the banking sector, as policy makers question the extent to which governance
failures have contributed to excessive risk taking and financial instability. In particular,
our results suggest that one has to be cautious to call for ‘better’ corporate governance at
banks as long as generous financial safety nets and too-big-to-fail policies are in place, as
7
this may actually induce banks to take on more risk with potentially negative
repercussions for the stability of the financial system.
In the remainder, section 2 discusses the data, and section 3 presents the empirical
results. Section 3 starts with an analysis of the relationships between corporate
governance and overall bank insolvency risk and bank returns. Then it considers the
‘channels’ on the assets and liabilities sides of the bank’s balance sheet through which
corporate governance affects overall bank risk. Finally, it considers the relationship
between corporate governance and bank risk taking over the business cycle. Section 4
concludes with policy implications.
2. The data
In this study, we relate measures of bank risk to summary indicators of corporate
governance for an international sample of banks over the 2004-2008 period. Accounting
and market data necessary to construct our bank risk measures are taken from Bankscope
of Bureau Van Dijk, CRSP and Compustat Global. Data on bank corporate governance
are from the Corporate Governance Quotient data base assembled by Institutional
Shareholder Services (ISS).
We examine two main measures of bank insolvency risk. First, the Z-score represents
the number of standard deviations that a bank’s rate of return on assets has to fall for the
bank to become insolvent. The Z-score is constructed as the sum of the rate of return on
assets and the equity to assets ratio divided by the standard deviation of the return on
assets. Table A1 in the Appendix describes variable definitions and data sources. A
higher Z-score signals that a bank has lower insolvency risk. We calculate a Z-score for a
8
bank, if at least three annual observations of its rate of return on assets are available.
Second, the distance to default measures the difference between the asset value of the
bank and the face value its debt, scaled by the standard deviation of the bank’s asset
value (see Campbell, Hilscher and Szilagyi, 2008, p. 2899). The distance to default
variable is computed as an annual average of weekly values (see the Appendix for details
on how the distance to default is estimated).
Next, we collect several variables to capture different aspects of a bank’s overall risk
strategy. These variables reflect a bank’s asset allocation and income mix strategies, its
capitalization and funding strategies, and its overall asset growth strategy.
To start, asset volatility is the annualized standard deviation of the asset returns
computed from the Merton’s option pricing model. The asset volatility variable has mean
of 0.048.Asset risk weight is an indicator of the average riskiness of a bank’s assets, and
is computed as the ratio of risk-weighted assets to total assets, using the risk weights as
defined in the Basle capital adequacy framework. Lower values of asset risk weight
indicate less risky assets. The asset risk weight variable has a mean of 0.70.
Bank loans are generally riskier than other investments, such as holdings of
government securities. We use the loans variable, computed as the ratio of loans to total
assets, as a proxy for asset risk. The loans variable has a mean of 70.3%.
The non-performing loans variable, computed as the ratio of non-performing loans to
total loans, is an index of loan quality. On average, 1.2% of loans are non-performing.
A bank’s asset allocation affects the composition of its income which generally can
include interest income, fees, commissions and trading income. The fee income variable,

9
constructed as the ratio of net interest income to total operating income, is an index of the
riskiness of a bank’s income. It has a mean of 0.30.
Turning to bank capitalization, we can divide a bank’s common equity into tangible
common equity and non-tangible common equity. The latter category includes tax
deferred assets and mortgage servicing rights, which are capital categories with only
limited loss absorption capacity. Excluding these, we construct the tangible capital ratio
as the ratio of tangible equity divided by tangible assets (i.e., total assets minus non-
tangible assets). The tangible equity ratio has a mean of 7.8%.
A bank’s short-term funding comprises customer and other deposits and non-deposits
such as short-term borrowing in the interbank market. The non-deposit funding variable,
computed as the share of non-deposit, short-term funding in total short-term funding, is
an index of the riskiness of a bank’s short-term funding. It has a mean of 0.17.
High bank asset growth may signal higher bank risk, as a bank may only be able to
grow fast by investing in riskier assets, for instance by lending to riskier loan customers.
Our asset growth variable is the growth rate of total assets, with a mean value of 7.5%.
In addition, banks with highly procyclical lending may be more risky, as such banks
may be overly optimistic about their customers’ creditworthiness at the peak of the
business cycle. We construct the lending procyclicality variable as the correlation
between a bank’s loan growth rate and the GDP growth rate. The mean lending
procyclicality variable is 0.10.
Bank risk is beneficial to the banks to the extent that it increases the value of their
contingent claim on the financial safety net. As an indicator of this, we consider the fair
value of the implicit insurance of a bank’s liabilities provided by the financial safety net.

10
Following Hovakimian, Kane and Laeven (2003) and Bushman and Williams (2012), we
construct the IPP variable as the estimated fair-value insurance premium of a dollar of
bank liabilities expressed in cents (see the Appendix for details).
Our corporate governance variables are indices that summarize extensive information
on detailed governance attributes that are indicative of increased power of minority
shareholders. We use the indices as formulated by Aggarwal, Erel, Stulz, and Williamson
(2009) based on individual governance attributes assembled by Institutional Shareholder
Services. The individual attributes are dummy variables that take on a value of 1 if the
characteristic is relatively shareholder-friendly, and a value of zero otherwise. An overall
index, called corporate governance, summarizes information on 44 attributes. In addition,
there are four sub-indices, called board, compensation and ownership, auditing and
takeover that summarize information on 25, 10, 3 and 6 attributes related to these various
aspects of corporate governance, respectively. The takeover sub-index, for instance, has a
higher score, if there are fewer corporate governance-related barriers to takeovers. A
listing of the individual attributes that are represented by the overall index, and the four
sub-indices, is provided in Table A2 in the Appendix. This detailed information on
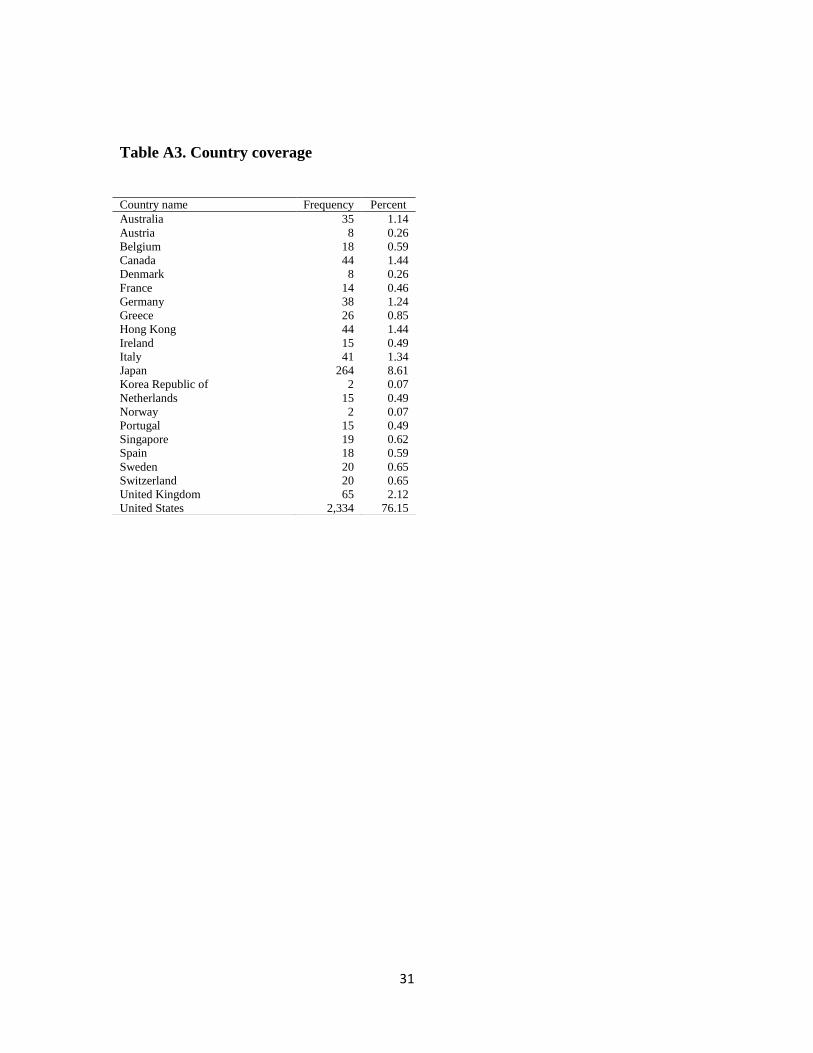
corporate governance is available for banks located in 22 countries. For the country
coverage, see Table A3 in the Appendix.
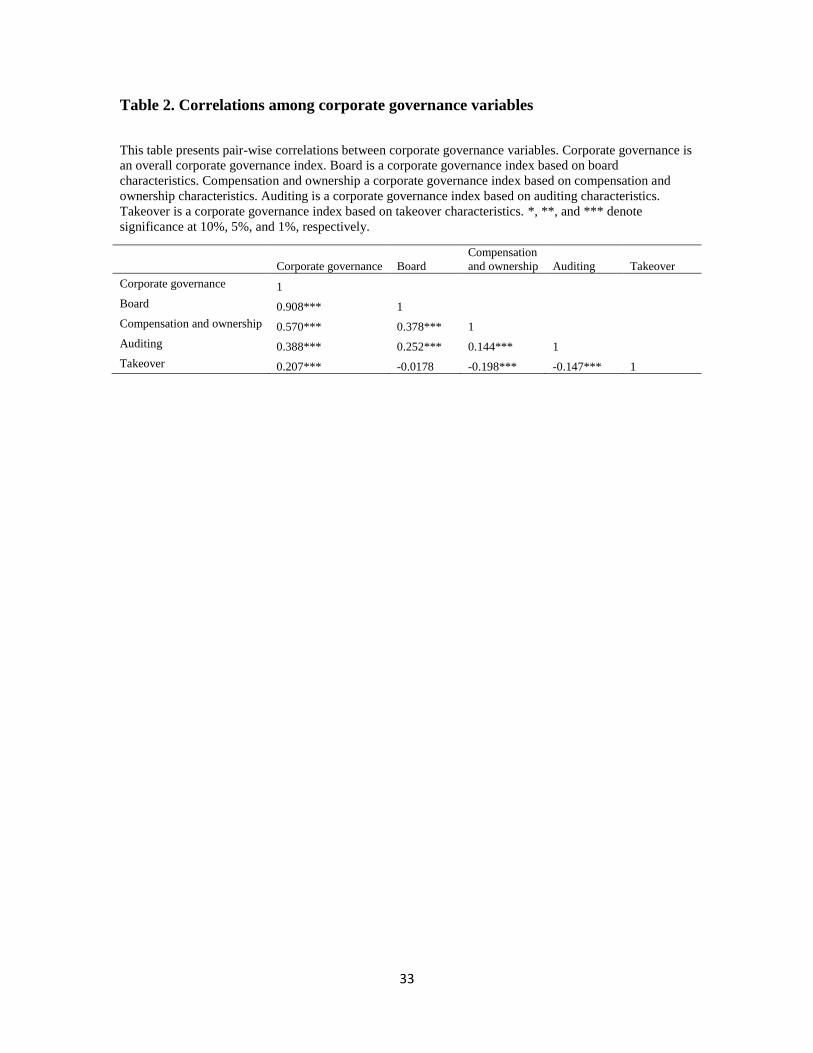
Table 2 displays information on the correlations among the overall corporate
governance index and the four sub-indices. Not surprisingly, the overall index is positive
and significantly correlated to the four sub-indices. The correlation between the overall
index and the board index is high at 0.91, which no doubt reflects 25 attributes in the
overall index (out of 44) are board attributes. Correlations among the four sub-indices are
11
positive and significant, with the exception that the takeover index is negatively
correlated with the other three sub-indices (and significantly in the case of the
compensation and ownership, and auditing indices). Apparently, corporate governance
regimes at banks that are relatively shareholder friendly in terms of posing few takeover
barriers are less shareholder-friendly in other respects.
Overall corporate governance has become more shareholder-friendly over the 2003-
2007 period. As seen in Figure 1, Part A, the overall index increased from 23.31 in 2003
to 26.45 in 2007 for US banks in part due to the passage of the Sarbanes-Oxley Act of
2002. It increased from 24.36 to 24.75 for non-US banks. These differential trends in
corporate governance for US and non-US banks (and, therefore, also for individual banks)
allows us to estimate relationships between bank risk variables and corporate governance
in specifications that include bank fixed effects. Figure 1, Parts B-E provide time trends
for the four sub-indices related to board, compensation and ownership, auditing, and
takeover attributes, respectively. Part A shows that board characteristics became
materially more shareholder-friendly for US banks, but only slightly so for non-US banks.
In Part B, we see that the sub-index related to compensation and ownership increased
about equally for US and non-US banks. The auditing subindex, in turn, went up for US
banks, and declined for non-US banks, as seen in Part C. Finally, the takeover sub-index
increased about the same for US banks and non-US banks, as evident in Part C of the
figure.
In the analysis, we use several bank-level control variables. The assets variable,
constructed as the log of a bank’s total assets, proxies for the bank’s absolute size. As an
alternative index of absolute size, the Big bank variable is a dummy variable that signals
12
a bank with total assets exceeding 50 billion dollars. In addition, the assets to GDP
variable, or total bank assets divided by GDP, represents the bank’s size relative to the
national economy. Larger banks may pursue riskier banking strategies, if they are
considered to be too big to fail. The overhead variable is constructed as overhead
expenses divided by total assets. Inefficient banks with large overhead expenses may
choose relatively risky bank strategies to maintain a certain expected return on assets.
Finally, the collateral variable is the ratio of assets that can be easily used as collateral
divided by total assets. Banks with assets that can be used as collateral may find it easier
to pursue risky banking strategies, as their financial costs may be less sensitive to overall
bank risk.
Finally, we include several macroeconomic and country-level institutional control
variables. Inflation is the consumer price inflation rate. GDP growth is the rate of real
GDP growth. GDP per capita is GDP per capita in thousands of constant U.S. dollars.
Fiscal balance represents the government budget balance as a percentage of GDP. The
variable restrict is a composite index of regulatory restrictions on bank activities from
Barth et al. (2004). Specifically, it is an indicator of the degree to which banks face
regulatory restrictions on their activities in securities markets, insurance, real estate, and
owning shares in non-financial firms. It ranges from 0 to 4 with higher values indicating
greater restrictions. Capital stringency is an index of regulatory oversight of bank capital,
summarizing information about the nature and the magnitude of bank capital
requirements, with higher values indicating greater diversification. Official is an index of
the power of the commercial bank supervisory agency to undertake specific actions to
prevent and correct problems at a bank, with higher values indicating greater power.
13
Diversification is an index of loan diversification guidelines imposed on banks. Finally,
financial freedom is an index of financial market freedoms from the Heritage Foundation.
3. Empirical results
A. Bank insolvency risk and corporate governance
Table 3 considers the relationships between corporate governance indices on the
one hand and the Z-score and the distance to default as proxies for bank insolvency risk
on the other.3 The regressions include bank and year fixed effects, and errors are
clustered at the bank level. All independent variables are lagged one year to reduce
endogeneity concerns.
In regression (1), where Z-score is the dependent variable, the overall corporate
governance index has a negative coefficient -0.027 that is significant at the 5% level,
suggesting that more shareholder-friendly corporate governance increases bank
insolvency risk. Among the controls, we find that the Z-score is negatively and
significantly related to the assets and assets to GDP variables, indicating that larger
absolute and relative bank size are associated with higher bank insolvency risk. This
suggests that larger banks take on more risk as they benefit from a too-big-to-fail status.
The Z-score is also negatively and significantly related to GDP per capita. This result
may reflect the fact that banks in wealthier countries benefit from a more credible
financial safety net, which allows them to take on more risk. Furthermore, the Z-score is
3 We also considered the relationships between a bank’s return on assets and its return on equity with
corporate governance. The relationship between a bank’s return on assets and the overall corporate
governance index is estimated to be negative and significant at 10 percent (unreported). This negative
relationship possibly reflects that the 2004-2008 sample period includes a major financial crisis.

14
negatively and significantly related to the diversification variable, suggesting that
guidelines promoting diversification contribute to bank safety.
In regression 2, we replace the overall corporate governance index by the four
subindices. In this regression, the board subindex has a negative coefficient that is
significant at 5%, while the compensation and ownership, auditing and takeover indices
have insignificant coefficients. Thus, a more shareholder-friendly board is found to be
associated with higher bank insolvency risk.
In regressions 3 and 4, the dependent variable is the distance to default measure.
Otherwise,
these regressions are analogous to regressions 1 and 2. In regression 3, the overall
corporate governance index is estimated with a negative coefficient that is significant at
5%. Iin regression 4 the board index has a negative coefficient that is also significant at
5%. This is further evidence that a bank’s insolvency risk is positively associated with
shareholder-friendly corporate governance.
Bigger banks may be riskier, because they expect to receive a more generous
treatment by bank regulators in case of insolvency on account of their too-big-to-fail
status. Hence the positive relationship between bank risk and good corporate governance
may be driven by the larger banks in the sample. To see whether the relationship between
bank insolvency risk and corporate governance depends on bank size, we include
interaction terms between the corporate governance variables and the assets variable in
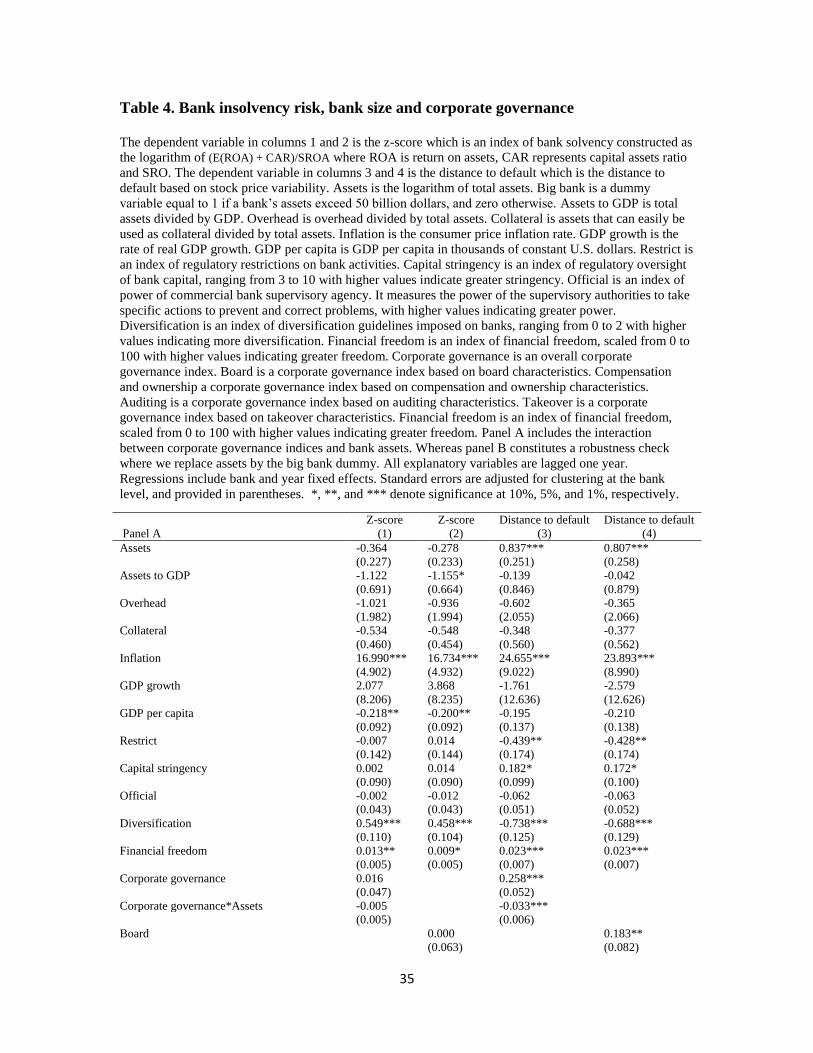
the regressions of Table 3. The results are reported in Panel A of Table 4. The results are
particularly stark for distance to default regressions in 3 and 4. While the overall
corporate governance index and its components have positive and significant coefficients
15
in the regressions, indicating that “good” corporate governance is associated with a
reduction in risk-taking, the interaction terms of the overall index and board and
compensation and ownership variables with bank size have negative and significant
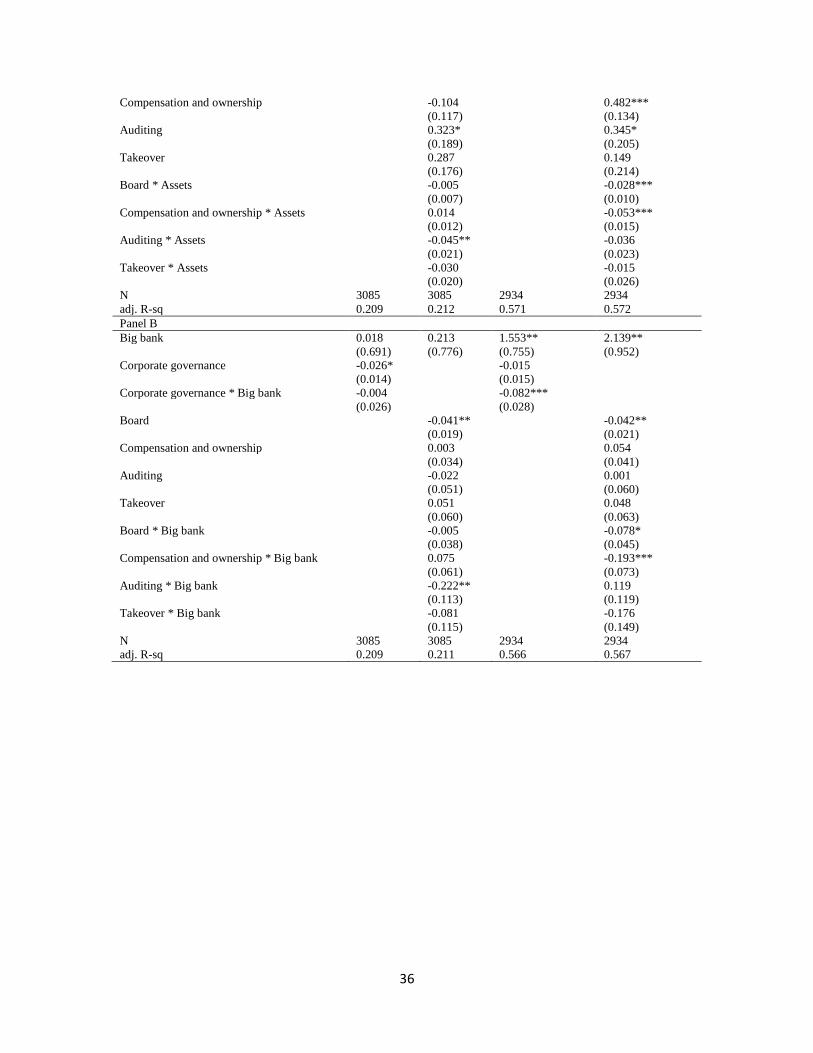
coefficients. In Panel B of Table 4, we replace the assets variable as an index of absolute
bank size by the big bank dummy. The results are similar to those using absolute size.
We find negative coefficients for the interactions of the big bank variable with the overall
corporate governance variable and the board and compensation and ownership subindices
in regressions 3 and 4. Overall, these results suggest that the adverse effects of good
corporate governance on bank risk-taking are more important for larger banks that are
able to shift their risk onto the safety net.
To further investigate risk-shifting by larger banks, we also examine how the impact
of corporate governance on bank risk varies with the credibility of the safety net.
Countries with strong finances are more likely to be able to bail out distressed banks that
are deemed too big to fail. Thus banks with shareholder-friendly corporate governance
may have higher insolvency risk if they are located in countries with a high fiscal balance
relative to GDP.4 To examine this, we estimate regressions interacting the fiscal balance-
to-GDP ratio with corporate governance indices. The results are reported in in Panel A of
Table 5. In the distance to default regression 3, the overall corporate governance index
and its interaction with the fiscal balance both have negative and significant coefficients.
Similarly, the distance to default is negatively and significantly related to the
compensation and ownership variables and their interaction with the fiscal balance in
4 Previously Demirguc-Kunt and Huizinga (2013) have found that a bank’s market-to-book value is
negatively related to the size of its liabilities-to-GDP ratio, especially in countries running large public
deficits.
16
regression 4. These results provide evidence that shareholder-friendly corporate
governance increases bank insolvency risk more in countries with strong public finances.
Taken together, the results of Table 4 and Panels A of Table 5 suggest that ‘good’
corporate governance will increase risk taking especially at banks that are both large and
located in countries with sound public finances. To test this, the regressions in Panel B of
Table 5 include interactions of corporate governance variables with the assets variable,
interactions of corporate governance variables with the fiscal balance variable, and triple
interactions of corporate governance, assets and fiscal balance variables. In the Z-score
regression 1, the triple interaction involving the overall corporate governance index has a
negative and significant coefficient. In the distance to default regression 3, this triple
interaction variable also has a negative coefficient that is significant. In the regressions of
Panel C of Table 5, we replace the assets variable by the big bank variable, again yielding
negative and significant coefficients for the triple interaction variables in regressions 1
and 3. Overall, these results indicate that shareholder-friendly corporate governance
increases risk taking at large banks located in countries with sound public finances that
are in a position to engage in risk-shifting towards the financial safety net.
B. Endogeneity
We recognize that corporate governance may to some extent be endogenously
determined. For instance, a strong preference for risk on the part of a bank’s shareholders
may jointly give rise to both considerable bank risk taking and shareholder-friendly
corporate governance. To alleviate concerns about endogeneity, we include bank fixed
effects in all regressions in the paper, thereby controlling for any time-invariant
17
unobservable bank characteristics that affect both bank corporate governance and bank
risk. Going beyond this, we analyze the relationship between corporate governance and
bank insolvency risk using an instrumental variables approach. In particular, we
instrument for a bank’s corporate governance variables by using the country and year
averages of these variables for all banks in the country excluding the bank itself.
Country-year averages are good instruments to use, because a shock to the risk of one
bank is unlikely to affect the corporate governance of other banks. This IV approach was
previously used by John, Litov, and Yeung, 2008, Aggarwal et al., 2009 and Laeven and
Levine, 2009. The IV results, reported in Table 6, are very similar to those reported in
Table 3. Specifically, the Z-score and the distance to default are negatively related to the
overall corporate governance index in regressions 1 and 3.The IV regressions thus
provide additional evidence that shareholder-friendly corporate governance increased
bank insolvency risk over the sample period covering the years 2004-2008.
C. Bank risk strategies
A bank’s Z-score and its distance to default are summary measures that reflect a
range of bank risk-related strategies associated with its asset allocation, income mix, and
capitalization and funding strategy. Next, we consider the impact of corporate
governance on a range of indicators that reflect a bank’s broader risk strategy. To start,
Table 7 reports results on the associations between a bank’s asset and income strategies
and indices of corporate governance. In regression 1, the asset volatility variable is
positively and significantly related to the overall corporate governance index, while in
regression 2 it is positively and significantly related to the board variable. This indicates
that more shareholder-friendly corporate governance is associated with more asset risk. In
18
regression 4, the assets risk weight variable is positively and significantly related to the
board and takeover variables, but it is negatively and significantly related to the auditing
index. The latter result could mean that shareholder-friendly auditing regimes lead banks
to take on less asset risk, or alternatively that they cause the bank to manipulate
downward the reported asset risk weight.
Regressions 5 and 6 relate the loans variable to corporate governance indices.
This variable is positively and significantly related to the takeover variable in regression
6, providing some evidence that banks with shareholder-friendly corporate governance
regimes allocate a larger share of their assets to loans which are expected to be relatively
risky.
Next, we find that the loan loss provisioning variable is positively and
significantly related to the overall corporate governance index in regression 7, while it is
positively and significantly related to the board and auditing subindices in regression 8,
suggesting that banks with shareholder-friendly corporate governance provider riskier
loans.
Finally, we see in regressions 9 and 10 that the fee income variable is not
significantly related to the corporate governance indices.
Overall, we find some evidence that asset risk, and in particular loan performance
risk, is positively associated with shareholder-friendly corporate governance.
Next, we consider whether corporate governance is associated with risky
capitalization, funding and growth strategies. In regression 1 of Table 8, the tangible
capital ratio is negatively and significantly related to the overall corporate governance
index, and in regression 2 it is negatively and significantly related to the board index.
19
This provides some evidence that bank capitalization is negatively related to shareholder-
friendly corporate governance.5 We do not find that the non-deposit funding variable is
significantly related to corporate governance variables in regressions 3 and 4, while also
the assets growth variable is not significantly related to corporate governance in
regressions 5 and 6. The finding that a bank’s intangible equity is negatively associated
with shareholder-friendly corporate governance is in line with our earlier finding that
bank insolvency risk is positively related to shareholder-friendly corporate governance.
D. Banking procyclicality
Next, we consider how corporate governance affects the cyclicality of bank
lending and other proxies of bank-risk taking. Banks with shareholder-friendly corporate
governance may take on additional risk by expanding credit during economic booms. To
test this, we relate the lending procyclicality variable, which is the correlation between
bank loan growth and GDP growth, to the overall corporate governance index in
regression 1 of Table 9. The estimated coefficient is positive and significant at 10%,
providing some evidence that lending is more procyclical at banks with greater
shareholder-friendly corporate governance. However, none of the individual corporate
governance subindices obtain significant coefficients.
Similar to the analyses described above, we also calculate correlation coefficients
between non-performing loans and GDP growth and tangible capital ratio and GDP
growth, and estimate similar procyclicality regressions as reported in columns 1 and 2.
We obtain significant results for regressions of non-performing loans procyclicality and
tangible equity procyclicality reported in Table 9. Specifically, in regression 3 the non-
5 Anginer, Demirguc-Kunt, Huizinga and Ma (2013) consider in detail how board-related and takeover-
related corporate governance features and executive compensation affect capitalization strategies for an
international sample of banks over the 2003-2011 period.
20
performing loans procyclicality variable is negatively and significantly related to the
overall corporate governance variable. In regression 4 it is negatively and significantly
related to the board subindex. Banks with greater shareholder-friendly corporate
governance report less non-performing loans during economic booms. This may reflect
the fact that these banks manipulate the reporting of non-performing loans downward in
order to preserve capital and continue to be able to expand credit. In regression 5 and 6,
we see that the tangible equity procyclicality variable is negatively and significantly
related to the overall corporate governance index and the board index. That is, banks with
shareholder-friendly corporate governance reduce their tangible capital ratio more during
economic upswings, probably due to large credit expansion during these periods. Overall,
we find that banks with shareholder-friendly corporate governance expand credit more
during economic booms, and that they tend to reduce the reporting of non-performing
loans and to reduce tangible equity.
E. The valuation of the implicit insurance offered by the financial safety net
Higher bank insolvency risk is beneficial to bank shareholders to the extent that
this increases the valuation of the implicit insurance provided by the financial safety net.
The IPP variable is an estimate of the value of this insurance, measured as cents per
dollar of total bank liabilities over a one-year horizon. In Table 10, we report regressions
of IPP on corporate governance indices, the assets variable and their interactions,
analogously to the bank insolvency risk regressions of Table 4. In regression 1, IPP is
positively and significantly related to the overall corporate governance variable, which
suggests that banks with shareholder-friendly corporate governance engage in more risk-
shifting towards the financial safety net. In regression 2, we interact corporate
21
governance with assets. The interaction term is positive and significant. This is
consistent with large banks with shareholder-friendly corporate governance engaging in
greater risk-shifting. Similarly, the board, auditing and takeover indices are estimated
with negative and significant coefficients in regression 3, and the interaction of the board
and assets variables is estimated with a positive and significant coefficient in regression 4.
The results of Tables 4 and 7 together suggest that large banks with ‘good’ corporate
governance are able to shift risk on the financial safety by increasing their insolvency risk.
4. Conclusion
This paper provides evidence that more shareholder-friendly corporate governance is
associated with increased bank insolvency risk, as proxied by the bank Z-score and the
market based distance to default variables. This empirical relationship is robust to
including bank fixed effects and instrumental variable estimation, alleviating endogeneity
concerns. We further find that ‘good’ corporate governance is associated with increased
asset volatility, more non-performing loans, and a lower tangible equity ratio.
Our findings that ‘good’ corporate governance is associated with increased risk
taking at financial firms are consistent with earlier research showing that better investor
protection reduces excessive risk-avoidance at non-financial firms explained by the fact
that managers earn private benefits from reducing risk. Banks, however, are special in
that they benefit from the financial safety net. The financial safety net provides banks
with an incentive to take on too much risk, as banks receive financial support from the
financial safety if they become distressed.
22
This suggests that risk taking at banks is determined by the interaction of
corporate governance regimes and the financial safety net. We find empirical support for
this hypothesis by showing that ‘good’ corporate governance increases bank risk taking
especially for banks that are large and located in countries with strong public finances.
For these banks, more risk can be expected to increase their contingent claim on the
financial safety net. ‘Good’ corporate governance thus reinforces the tendency for banks
to exploit the financial safety net, if they are in a position to do so.
Consistent with our results on bank risk taking, we find that ‘good’ corporate
governance is associated with a higher valuation of the implicit insurance offered by the
financial safety net especially in the case of large banks. This reflects that large banks
have a relatively strong incentive to increase the value of the implicit insurance, as they
stand a much better chance to collect on the insurance given their too-big-to-fail status.
The interaction of corporate governance and the financial safety net in
determining bank insolvency risk has important implications for public policy towards
corporate governance at large banks. In particular, the case for more shareholder-friendly
corporate governance at banks is much weaker than in the case of non-financial firms. In
the case of banks, particularly large ones, ‘better’ corporate governance may only
exacerbate the excessive risk taking resulting from the banks’ incentives to exploit the
financial safety net. In the second-best world where mispriced financial safety nets and
too-big-to-fail policies exist, ‘better’ corporate governance thus may actually produce
worse outcomes. To prevent this, a first priority should be regulatory and safety net
reform to address too-big-to-fail issues and reduce moral hazard leading to excess risk

23
taking of banks. Only after these reforms, the case for ‘better’ corporate governance at
banks would become much stronger.
24
References
Acharya, V., I. Drechsler, and P. Schnabl, 2013, A Pyrrhic victory? Bank bailouts and
sovereign credit risk, forthcoming in Journal of Finance.
Aggarwal, R., I. Erel, R. Stulz, and R. Williamson, 2009, Differences in governance
practices between U.S. and foreign firms: Measurement, causes, and consequences,
Review of Financial Studies 22, 3131–3169.
Anginer, D., A. Demirguc-Kunt, H. Huizinga and K. Ma, 2013, How does corporate
governance affect bank capitalization strategies, Policy Research WPS 6636, World Bank.
Barth, J.., G. Caprio Jr., and R. Levine, 2004, Bank regulation and supervision: what
works best?, Journal of Financial Intermediation 13, 205-248.
Becht, M., P. Bolton, and A. Röell, 2011, Why bank governance is different, Oxford
Review of Economic Policy 27, 437–463.
Berger, A., B. Imbierowicz, and C. Rauch, 2012, The roles of corporate governance in
bank failures during the recent financial crisis,
Bertay, A., A. Demirguc-Kunt, and H. Huizinga, 2013, Do we need big banks? Evidence
on performance, strategy, and market discipline, Journal of Financial Intermediation 22,
532-558.
Bushman, R., and C. Williams, 2012, Accounting discretion, loan loss provisioning, and
discipline of banks’ risk-taking, Journal of Accounting and Economics 54, 1–18.
Calomiris, C., and M. Carlson, 2014, Corporate governance and risk management at
unprotected banks: National banks in the 1890s, NBER WP 19806.
Campbell, J., J. Hilscher, and J. Szilagyi, 2008, In search of distress risk, Journal of
Finance 63, 2899–2939.
Chen, C., T. Steiner, and A. Whyte, 2006, Does stock option-based executive
compensation induce risk-taking? An analysis of the banking industry, Journal of
Banking and Finance 30, 915-945.
Demirguc-Kunt, A, and H. Huizinga, 2013, International evidence from equity prices and
CDS spreads, Journal of Banking and Finance 37, 875-894.
DeYoung, R., E. Peng, and M. Yan, 2013, Executive compensation and business policy
choices at U.S. commercial banks, Journal of Financial and Quantitative Analysis 48,
165-196.
Ellul, A., and V. Yerramilli, 2013, Stronger risk controls, lower risk: Evidence from U.S.
bank holding companies, Journal of Finance 68, 1757–1803.

25
Erkens, D., M. Hung, and P. Matos, 2012, Corporate governance in the 2007-2008
financial crisis: Evidence from financial institutions Worldwide, Journal of Corporate
Finance 18, 389-411.
Fahlenbrach, R., and R. Stulz, 2011, Bank CEO incentives and the credit crisis, Journal
of Financial Economics 99, 11-26.
Hillegeist, S., E. Keating, D. Cram, and K. Lundstedt, 2004, Assessing the probability of
bankruptcy, Review of Accounting Studies 9, 5–34.
Hovakimian, A., E. Kane, and L. Laeven, 2003, How country and safety-net
characteristics affect bank risk-shifting, Journal of Financial Services Research 23, 177–
204.
John, K., L. Litov, and B. Yeung, 2008, Corporate governance and risk-taking, Journal of
Finance 63, 1679–1728.
Laeven, L., 2013, Corporate governance: What’s special about banks?, Annual Review of
Financial Economics 5, 63-92.
Laeven, L. and R. Levine, 2009, Bank governance, regulation and risk taking, Journal of
Financial Economics 93, 259–275.
Mehran, H., A. Morrison, and J. Shapiro, 2011, Corporate governance and banks: What
have we learned from the financial crisis?, Federal Reserve Bank of New York Staff
Report no. 502.
Merton, R., 1974, On the pricing of corporate debt: the risk structure of interest rates,
Journal of Finance 29, 449–70.
Pathan, S., 2009, Strong boards, CEO power and bank risk-taking, Journal of Banking
and Finance 33, 1340–1350.
26
Appendix
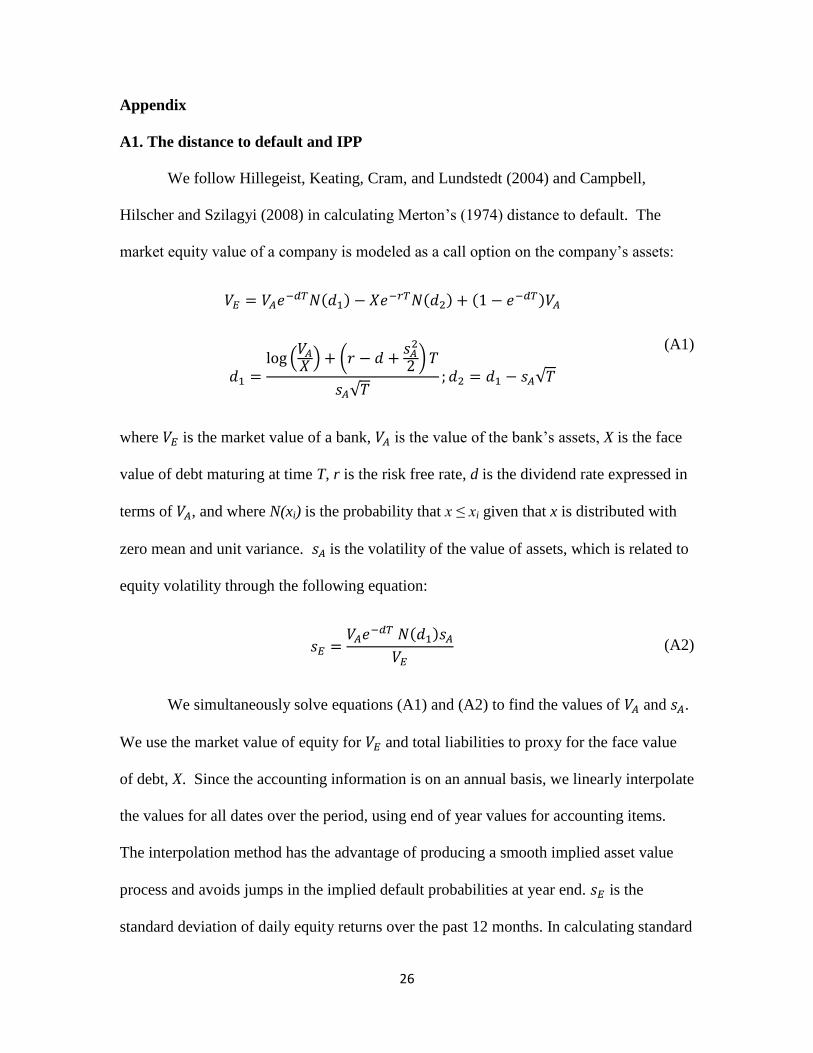
A1. The distance to default and IPP
We follow Hillegeist, Keating, Cram, and Lundstedt (2004) and Campbell,
Hilscher and Szilagyi (2008) in calculating Merton’s (1974) distance to default. The
market equity value of a company is modeled as a call option on the company’s assets:
( )
( ) ( )
(
) (
)
√ √
(A1)
where is the market value of a bank, is the value of the bank’s assets, X is the face
value of debt maturing at time T, r is the risk free rate, d is the dividend rate expressed in
terms of , and where N(xi) is the probability that x ≤ xi given that x is distributed with
zero mean and unit variance. is the volatility of the value of assets, which is related to
equity volatility through the following equation:
( )
(A2)
We simultaneously solve equations (A1) and (A2) to find the values of and .
We use the market value of equity for and total liabilities to proxy for the face value
of debt, X. Since the accounting information is on an annual basis, we linearly interpolate
the values for all dates over the period, using end of year values for accounting items.
The interpolation method has the advantage of producing a smooth implied asset value
process and avoids jumps in the implied default probabilities at year end. is the
standard deviation of daily equity returns over the past 12 months. In calculating standard
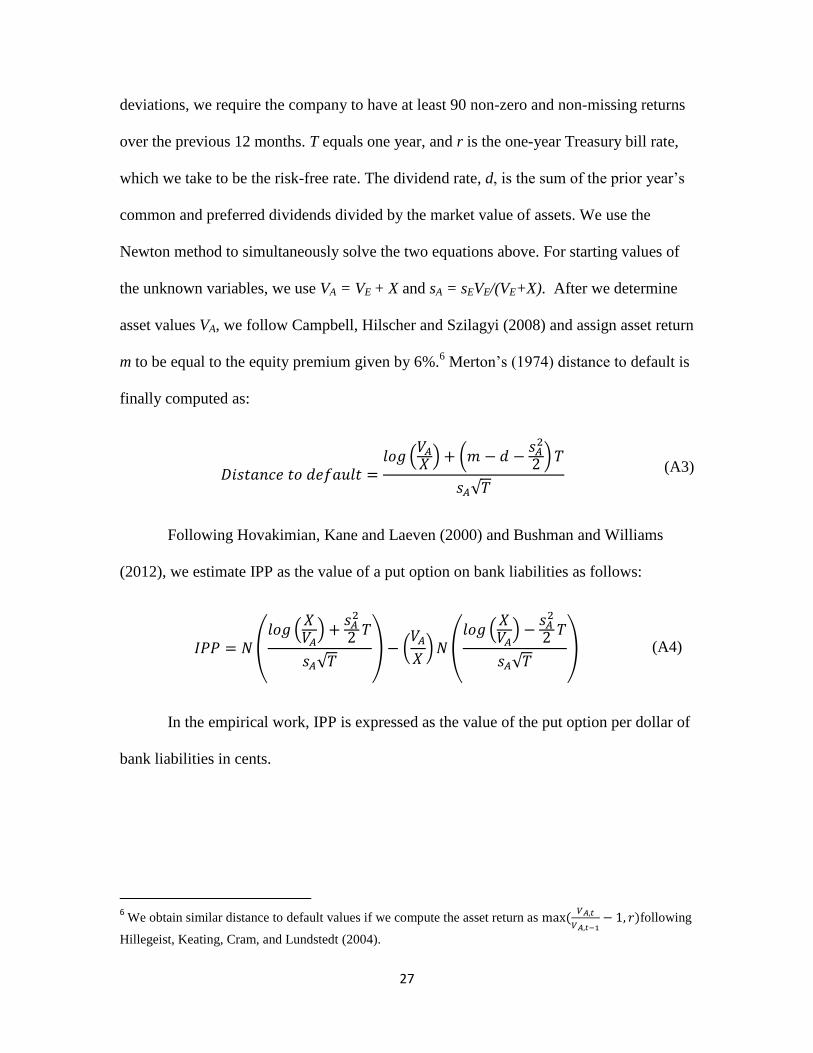
27
deviations, we require the company to have at least 90 non-zero and non-missing returns
over the previous 12 months. T equals one year, and r is the one-year Treasury bill rate,
which we take to be the risk-free rate. The dividend rate, d, is the sum of the prior year’s
common and preferred dividends divided by the market value of assets. We use the
Newton method to simultaneously solve the two equations above. For starting values of
the unknown variables, we use VA = VE + X and sA = sEVE/(VE+X). After we determine
asset values VA, we follow Campbell, Hilscher and Szilagyi (2008) and assign asset return
m to be equal to the equity premium given by 6%.6 Merton’s (1974) distance to default is
finally computed as:
(
) (
)
√
(A3)
Following Hovakimian, Kane and Laeven (2000) and Bushman and Williams
(2012), we estimate IPP as the value of a put option on bank liabilities as follows:
( (
)
√ ) (
) (
( )
√ ) (A4)
In the empirical work, IPP is expressed as the value of the put option per dollar of
bank liabilities in cents.
6 We obtain similar distance to default values if we compute the asset return as (
)following
Hillegeist, Keating, Cram, and Lundstedt (2004).
28
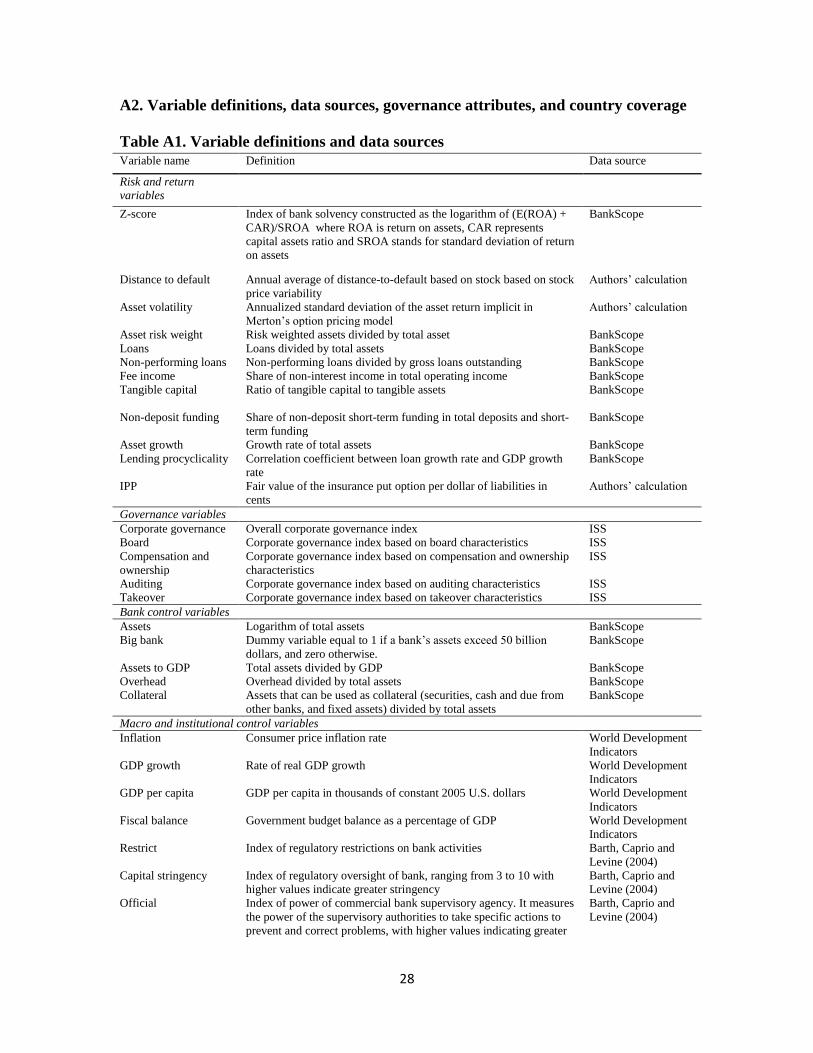
A2. Variable definitions, data sources, governance attributes, and country coverage
Table A1. Variable definitions and data sources Variable name Definition Data source
Risk and return
variables
Z-score Index of bank solvency constructed as the logarithm of (E(ROA) +
CAR)/SROA where ROA is return on assets, CAR represents
capital assets ratio and SROA stands for standard deviation of return
on assets
BankScope
Distance to default
Annual average of distance-to-default based on stock based on stock
price variability
Authors’ calculation
Asset volatility Annualized standard deviation of the asset return implicit in
Merton’s option pricing model
Authors’ calculation
Asset risk weight Risk weighted assets divided by total asset BankScope
Loans Loans divided by total assets BankScope
Non-performing loans Non-performing loans divided by gross loans outstanding BankScope
Fee income Share of non-interest income in total operating income BankScope
Tangible capital
Ratio of tangible capital to tangible assets BankScope
Non-deposit funding Share of non-deposit short-term funding in total deposits and short-
term funding
BankScope
Asset growth Growth rate of total assets BankScope
Lending procyclicality Correlation coefficient between loan growth rate and GDP growth
rate
BankScope
IPP Fair value of the insurance put option per dollar of liabilities in
cents
Authors’ calculation
Governance variables
Corporate governance Overall corporate governance index ISS
Board Corporate governance index based on board characteristics ISS
Compensation and
ownership
Corporate governance index based on compensation and ownership
characteristics
ISS
Auditing Corporate governance index based on auditing characteristics ISS
Takeover Corporate governance index based on takeover characteristics ISS
Bank control variables
Assets Logarithm of total assets BankScope
Big bank Dummy variable equal to 1 if a bank’s assets exceed 50 billion
dollars, and zero otherwise.
BankScope
Assets to GDP Total assets divided by GDP BankScope
Overhead Overhead divided by total assets BankScope
Collateral Assets that can be used as collateral (securities, cash and due from
other banks, and fixed assets) divided by total assets
BankScope
Macro and institutional control variables
Inflation Consumer price inflation rate World Development
Indicators
GDP growth Rate of real GDP growth World Development
Indicators
GDP per capita GDP per capita in thousands of constant 2005 U.S. dollars World Development
Indicators
Fiscal balance Government budget balance as a percentage of GDP World Development
Indicators
Restrict Index of regulatory restrictions on bank activities Barth, Caprio and
Levine (2004)
Capital stringency Index of regulatory oversight of bank, ranging from 3 to 10 with
higher values indicate greater stringency
Barth, Caprio and
Levine (2004)
Official Index of power of commercial bank supervisory agency. It measures
the power of the supervisory authorities to take specific actions to
prevent and correct problems, with higher values indicating greater
Barth, Caprio and
Levine (2004)

29
power.
Diversification Index of diversification guidelines imposed on banks, ranging from
0 to 2 with higher values indicating more diversification.
Barth, Caprio and
Levine (2004)
Financial freedom Index of financial freedom, scaled from 0 to 100 with higher values
indicating greater freedom.
Heritage Foundation

30
Table A2. Corporate governance attributes
Board attributes
1. All directors attended 75% of board meetings or had a valid excuse
2. CEO serves on the boards of two or fewer public companies
3. Board is controlled by more than 50% independent outside directors
4. Board size is greater than 5 but less than 16
5. CEO is not listed as having a related-party transaction
6. No former CEO on the board
7. Compensation committee composed solely of independent outsiders
8. Chairman and CEO are separated or there is a lead director
9.Nominating committee composed solely of independent outsiders
10.Governance committee exists and met in the past year
11.Shareholders vote on directors selected to fill vacancies
12.Governance guidelines are publicly disclosed
13.Annually elected board (no staggered board)
14.Policy exists on outside directorships (four or fewer boards is the limit)
15.Shareholders have cumulative voting rights
16.Shareholder approval is required to increase/decrease board size
17.Majority vote requirement to amend charter/bylaws
18.Board has the express authority to hire its own advisors
19.Performance of the board is reviewed regularly
20.Board-approved succession plan in place for the CEO
21.Outside directors meet without CEO and disclose number of times met
22.Directors are required to submit resignation upon a change in job
23.Board cannot amend bylaws without shareholder approval or can do so only under limited circumstances
24.Does not ignore shareholder proposal
25.Qualifies for proxy contest defenses combination points
Compensation and ownership attributes
26.Directors are subject to stock ownership requirements
27.Executives are subject to stock ownership guidelines
28.No interlocks among compensation committee members
29.Directors receive all or a portion of their fees in stock
30.All stock-incentive plans adopted with shareholder approval
31.Options grants align with company performance and reasonable burn rate
32.Company expenses stock options
33.All directors with more than one year of service own stock
34.Officers' and directors' stock ownership is at least 1% but not over 30% of total shares outstanding
35.Repricing is prohibited
Auditing attributes
36.Board independence: Audit committee
37.Consulting fees paid to auditors are less than audit fees paid to auditors
38.Auditors ratified at most recent annual meeting
Antitakeover attributes
39.Single class, common
40.Majority vote requirement to approve mergers (not supermajority)
41.Shareholders may call special meetings
42.Shareholder may act by written consent
43.Company either has no poison pill or a pill that was shareholder approved
44.Company is not authorized to issue blank check preferred
Source: Aggarwal, Erel, Stulz, and Williamson (2009)
31
Table A3. Country coverage
Country name Frequency Percent
Australia 35 1.14
Austria 8 0.26
Belgium 18 0.59
Canada 44 1.44
Denmark 8 0.26
France 14 0.46
Germany 38 1.24
Greece 26 0.85
Hong Kong 44 1.44
Ireland 15 0.49
Italy 41 1.34
Japan 264 8.61
Korea Republic of 2 0.07
Netherlands 15 0.49
Norway 2 0.07
Portugal 15 0.49
Singapore 19 0.62
Spain 18 0.59
Sweden 20 0.65
Switzerland 20 0.65
United Kingdom 65 2.12
United States 2,334 76.15

32
Table 1. Summary statistics Z-score is an index of bank solvency constructed as the logarithm of (E(ROA) + CAR)/SROA where ROA is return on
assets, CAR represents capital assets ratio and SRO. Distance to default is the annual average of distance to default
based on stock price variability. Asset volatility is the annualized standard deviation of the asset return implicit in
Merton’s option pricing model. Asset risk is risk weighted assets divided by total assets. Loans is total loans divided by
total assets. Non-performing loans is non-performing loans divided by gross loans outstanding. Fee income is the share
of non-interest income in total operating income. Tangible capital is the ratio of tangible capital to tangible assets. Non-
deposit funding is the share of non-deposit short-term funding in total deposits and short-term funding. Asset growth is
the growth rate of total assets. Lending procyclicality is the correlation coefficient between loan growth rate and GDP
growth rate. IPP is the fair value of the insurance put option per dollar of liabilities in cents. Corporate governance is an
overall corporate governance index. Board is a corporate governance index based on board characteristics.
Compensation and ownership a corporate governance index based on compensation and ownership characteristics.
Auditing is a corporate governance index based on auditing characteristics. Takeover is a corporate governance index
based on takeover characteristics. Assets is the logarithm of total assets. Big bank is a dummy variable equal to 1 if a
bank’s assets exceed 50 billion dollars, and zero otherwise. Assets to GDP is total assets divided by GDP. Overhead is
overhead divided by total assets. Collateral is assets that can easily be used as collateral divided by total assets.
Inflation is the consumer price inflation rate. GDP growth is the rate of real GDP growth. GDP per capita is GDP per
capita in thousands of constant U.S. dollars. Fiscal balance is the government budget balance as a percentage of GDP.
Restrict is an index of regulatory restrictions on bank activities. Capital stringency is an index of regulatory oversight
of bank capital, ranging from 3 to 10 with higher values indicate greater stringency. Official is an index of power of
commercial bank supervisory agency. It measures the power of the supervisory authorities to take specific actions to
prevent and correct problems, with higher values indicating greater power. Diversification is an index of diversification
guidelines imposed on banks, ranging from 0 to 2 with higher values indicating more diversification. Financial freedom
is an index of financial freedom, scaled from 0 to 100 with higher values indicating greater freedom.
Variable Obs. Mean Std. Dev. Min Max
Z-score 3209 4.184962 1.093369 -0.9347929 8.550281
Distance to default 3244 6.285612 1.954979 1.249333 12
Asset volatility 2858 0.048106 0.035787 0.003987 0.402628
Asset risk weight 2307 0.6973368 0.1499069 0.0840349 0.9988244
Loans 3149 0.703366 0.201349 0 1
Non-performing loans 3072 0.0116643 0.0174703 0 0.1
Fee income 3371 0.3023819 0.2061754 0 1
Tangible capital 3372 0.0776388 0.0422173 0 0.3997
Non-deposit funding 3418 0.1670455 0.2600481 0 1.004587
Asset growth 3387 0.0746193 0.1331773 -0.6931472 0.6931472
Lending procyclicality 3381 0.0969869 0.417961 -1 1
IPP 2858 0.0428959 0.1250289 0 1.458718
Corporate governance 3627 25.03364 3.598887 15 39
Board 3627 12.87869 2.673573 6 21
Compensation and ownership 3627 6.25834 1.15688 3 10
Auditing 3627 2.241798 0.7190849 0 3
Takeover 3627 3.654811 1.124837 0 6
Assets 3412 8.332414 2.270508 1.386294 14.85713
Big bank 3412 0.1769499 0.3816819 0 1
Assets to GDP 3412 0.0615769 0.2448429 3.39E-07 2.790281
Overhead 3399 0.033921 0.0522931 0.0007951 0.8771428
Collateral 3411 0.268855 0.1520512 0.0051394 0.9978418
Inflation 3614 0.0253839 0.0093389 -0.025 0.0487992
GDP growth 3627 0.0275575 0.0096054 -0.0091112 0.091591
GDP per capita 3627 40.79125 4.983224 17.95289 81.3538
Fiscal balance 3564 -2.689619 1.823869 -7.350887 18.37307
Restrict 3614 7.65689 1.120296 3 9
Capital stringency 3614 4.957665 0.6045594 2 8
Official 3614 12.40786 1.538042 5 14
Diversification 3614 1.429441 0.505028 0 2
Financial freedom 3614 82.49032 14.69674 30 90
33
Table 2. Correlations among corporate governance variables
This table presents pair-wise correlations between corporate governance variables. Corporate governance is
an overall corporate governance index. Board is a corporate governance index based on board
characteristics. Compensation and ownership a corporate governance index based on compensation and
ownership characteristics. Auditing is a corporate governance index based on auditing characteristics.
Takeover is a corporate governance index based on takeover characteristics. *, **, and *** denote
significance at 10%, 5%, and 1%, respectively.
Corporate governance Board
Compensation
and ownership Auditing Takeover
Corporate governance 1
Board 0.908*** 1
Compensation and ownership 0.570*** 0.378*** 1
Auditing 0.388*** 0.252*** 0.144*** 1
Takeover 0.207*** -0.0178 -0.198*** -0.147*** 1

34
Table 3. Bank insolvency risk and corporate governance The dependent variable in columns 1 and 2 is the z-score, and the dependent variable in column 3 and 4 is
the distance to default. Z-score is an index of bank solvency constructed as the logarithm of (E(ROA) +
CAR)/SROA where ROA is return on assets, CAR represents capital assets ratio and SRO. Distance to
default is the annual average of distance to default based on stock price variability. Assets is the logarithm
of total assets. Assets to GDP is total assets divided by GDP. Overhead is overhead divided by total assets.
Collateral is assets that can easily be used as collateral divided by total assets. Inflation is the consumer
price inflation rate. GDP growth is the rate of real GDP growth. GDP per capita is GDP per capita in
thousands of constant U.S. dollars. Restrict is an index of regulatory restrictions on bank activities. Capital
stringency is an index of regulatory oversight of bank capital, ranging from 3 to 10 with higher values
indicate greater stringency. Official is an index of power of commercial bank supervisory agency. It
measures the power of the supervisory authorities to take specific actions to prevent and correct problems,
with higher values indicating greater power. Diversification is an index of diversification guidelines
imposed on banks, ranging from 0 to 2 with higher values indicating more diversification. Corporate
governance is an overall corporate governance index. Board is a corporate governance index based on
board characteristics. Compensation and ownership a corporate governance index based on compensation
and ownership characteristics. Auditing is a corporate governance index based on auditing characteristics.
Takeover is a corporate governance index based on takeover characteristics. Financial freedom is an index
of financial freedom, scaled from 0 to 100 with higher values indicating greater freedom. Regressions
include bank and year fixed effects. Standard errors are adjusted for clustering at the bank level, and
provided in parentheses. *, **, and *** denote significance at 10%, 5%, and 1%, respectively.
Z-score
(1)
Z-score
(2)
Distance to default
(3)
Distance to default
(4)
Assets -0.493*** -0.486*** -0.039 -0.046
(0.185) (0.184) (0.199) (0.200)
Assets to GDP -1.224* -1.146* -0.736 -0.703
(0.680) (0.660) (0.805) (0.804)
Overhead -1.088 -0.872 -0.968 -0.860
(1.984) (1.974) (2.112) (2.116)
Collateral -0.560 -0.566 -0.486 -0.516
(0.459) (0.457) (0.563) (0.561)
Inflation 16.776*** 16.538*** 24.233*** 23.809***
(4.905) (4.901) (8.878) (8.897)
GDP growth 2.058 2.005 -3.673 -3.893
(8.242) (8.210) (12.470) (12.519)
GDP per capita -0.216** -0.214** -0.176 -0.182
(0.091) (0.091) (0.137) (0.136)
Restrict 0.002 0.014 -0.399** -0.393**
(0.141) (0.141) (0.171) (0.171)
Capital stringency -0.006 -0.009 0.131 0.130
(0.089) (0.088) (0.100) (0.100)
Official 0.002 -0.005 -0.031 -0.028
(0.043) (0.042) (0.051) (0.052)
Diversification 0.543*** 0.513*** -0.767*** -0.736***
(0.110) (0.108) (0.122) (0.125)
Financial freedom 0.012** 0.011** 0.020*** 0.020***
(0.005) (0.005) (0.007) (0.007)
Corporate governance -0.027**
-0.029**
(0.012)
(0.014)
Board
-0.040**
-0.052***
(0.017)
(0.020)
Compensation and ownership
0.020
0.001
(0.029)
(0.037)
Auditing
-0.070
0.029
(0.047)
(0.054)
Takeover
0.038
0.017
(0.054)
(0.061)
N 3085 3085 2934 2934
adj. R-sq 0.209 0.210 0.563 0.563
35
Table 4. Bank insolvency risk, bank size and corporate governance The dependent variable in columns 1 and 2 is the z-score which is an index of bank solvency constructed as
the logarithm of (E(ROA) + CAR)/SROA where ROA is return on assets, CAR represents capital assets ratio
and SRO. The dependent variable in columns 3 and 4 is the distance to default which is the distance to
default based on stock price variability. Assets is the logarithm of total assets. Big bank is a dummy
variable equal to 1 if a bank’s assets exceed 50 billion dollars, and zero otherwise. Assets to GDP is total
assets divided by GDP. Overhead is overhead divided by total assets. Collateral is assets that can easily be
used as collateral divided by total assets. Inflation is the consumer price inflation rate. GDP growth is the
rate of real GDP growth. GDP per capita is GDP per capita in thousands of constant U.S. dollars. Restrict is
an index of regulatory restrictions on bank activities. Capital stringency is an index of regulatory oversight
of bank capital, ranging from 3 to 10 with higher values indicate greater stringency. Official is an index of
power of commercial bank supervisory agency. It measures the power of the supervisory authorities to take
specific actions to prevent and correct problems, with higher values indicating greater power.
Diversification is an index of diversification guidelines imposed on banks, ranging from 0 to 2 with higher
values indicating more diversification. Financial freedom is an index of financial freedom, scaled from 0 to
100 with higher values indicating greater freedom. Corporate governance is an overall corporate
governance index. Board is a corporate governance index based on board characteristics. Compensation
and ownership a corporate governance index based on compensation and ownership characteristics.
Auditing is a corporate governance index based on auditing characteristics. Takeover is a corporate
governance index based on takeover characteristics. Financial freedom is an index of financial freedom,
scaled from 0 to 100 with higher values indicating greater freedom. Panel A includes the interaction
between corporate governance indices and bank assets. Whereas panel B constitutes a robustness check
where we replace assets by the big bank dummy. All explanatory variables are lagged one year.
Regressions include bank and year fixed effects. Standard errors are adjusted for clustering at the bank
level, and provided in parentheses. *, **, and *** denote significance at 10%, 5%, and 1%, respectively.
Panel A
Z-score
(1)
Z-score
(2)
Distance to default
(3)
Distance to default
(4)
Assets -0.364 -0.278 0.837*** 0.807***
(0.227) (0.233) (0.251) (0.258)
Assets to GDP -1.122 -1.155* -0.139 -0.042
(0.691) (0.664) (0.846) (0.879)
Overhead -1.021 -0.936 -0.602 -0.365
(1.982) (1.994) (2.055) (2.066)
Collateral -0.534 -0.548 -0.348 -0.377
(0.460) (0.454) (0.560) (0.562)
Inflation 16.990*** 16.734*** 24.655*** 23.893***
(4.902) (4.932) (9.022) (8.990)
GDP growth 2.077 3.868 -1.761 -2.579
(8.206) (8.235) (12.636) (12.626)
GDP per capita -0.218** -0.200** -0.195 -0.210
(0.092) (0.092) (0.137) (0.138)
Restrict -0.007 0.014 -0.439** -0.428**
(0.142) (0.144) (0.174) (0.174)
Capital stringency 0.002 0.014 0.182* 0.172*
(0.090) (0.090) (0.099) (0.100)
Official -0.002 -0.012 -0.062 -0.063
(0.043) (0.043) (0.051) (0.052)
Diversification 0.549*** 0.458*** -0.738*** -0.688***
(0.110) (0.104) (0.125) (0.129)
Financial freedom 0.013** 0.009* 0.023*** 0.023***
(0.005) (0.005) (0.007) (0.007)
Corporate governance 0.016
0.258***
(0.047)
(0.052)
Corporate governance*Assets -0.005
-0.033***
(0.005)
(0.006)
Board
0.000
0.183**
(0.063)
(0.082)
36
Compensation and ownership
-0.104
0.482***
(0.117)
(0.134)
Auditing
0.323*
0.345*
(0.189)
(0.205)
Takeover
0.287
0.149
(0.176)
(0.214)
Board * Assets
-0.005
-0.028***
(0.007)
(0.010)
Compensation and ownership * Assets
0.014
-0.053***
(0.012)
(0.015)
Auditing * Assets
-0.045**
-0.036
(0.021)
(0.023)
Takeover * Assets
-0.030
-0.015
(0.020)
(0.026)
N 3085 3085 2934 2934
adj. R-sq 0.209 0.212 0.571 0.572
Panel B
Big bank 0.018 0.213 1.553** 2.139**
(0.691) (0.776) (0.755) (0.952)
Corporate governance -0.026*
-0.015
(0.014)
(0.015)
Corporate governance * Big bank -0.004
-0.082***
(0.026)
(0.028)
Board
-0.041**
-0.042**
(0.019)
(0.021)
Compensation and ownership
0.003
0.054
(0.034)
(0.041)
Auditing
-0.022
0.001
(0.051)
(0.060)
Takeover
0.051
0.048
(0.060)
(0.063)
Board * Big bank
-0.005
-0.078*
(0.038)
(0.045)
Compensation and ownership * Big bank
0.075
-0.193***
(0.061)
(0.073)
Auditing * Big bank
-0.222**
0.119
(0.113)
(0.119)
Takeover * Big bank
-0.081
-0.176
(0.115)
(0.149)
N 3085 3085 2934 2934
adj. R-sq 0.209 0.211 0.566 0.567

37
Table 5. Bank insolvency risk, the fiscal balance and corporate governance The dependent variable in columns 1 and 2 is the z-score which is an index of bank solvency constructed as
the logarithm of (E(ROA) + CAR)/SROA where ROA is return on assets, CAR represents capital assets
ratio and SRO. The dependent variable in columns 3 and 4 is the distance to default which is the distance to
default based on stock price variability. The dependent variable in columns 5 and 6 is the return on assets
which is pre-tax profits divided by assets. Assets is the logarithm of total assets. Big bank is a dummy
variable equal to 1 if a bank’s assets exceed 50 billion dollars, and zero otherwise. Assets to GDP is total
assets divided by GDP. Overhead is overhead divided by total assets. Collateral is assets that can easily be
used as collateral divided by total assets. Inflation is the consumer price inflation rate. GDP growth is the
rate of real GDP growth. GDP per capita is GDP per capita in thousands of constant U.S. dollars. Restrict is
an index of regulatory restrictions on bank activities. Capital stringency is an index of regulatory oversight
of bank capital, ranging from 3 to 10 with higher values indicate greater stringency. Official is an index of
power of commercial bank supervisory agency. It measures the power of the supervisory authorities to take
specific actions to prevent and correct problems, with higher values indicating greater power.
Diversification is an index of diversification guidelines imposed on banks, ranging from 0 to 2 with higher
values indicating more diversification. Financial freedom is an index of financial freedom, scaled from 0 to
100 with higher values indicating greater freedom. Fiscal balance is the government budget balance as a
percentage of GDP. Corporate governance is an overall corporate governance index. Board is a corporate
governance index based on board characteristics. Compensation and ownership a corporate governance
index based on compensation and ownership characteristics. Auditing is a corporate governance index
based on auditing characteristics. Takeover is a corporate governance index based on takeover
characteristics. Financial freedom is an index of financial freedom, scaled from 0 to 100 with higher values
indicating greater freedom. Panel A includes interaction of corporate governance indices and the fiscal
balance of the country where the bank is incorporated. Panel B and C include triple interactions of
corporate governance indices, the fiscal balance, and bank size measured by the assets and big bank
variables, respectively. All explanatory variables are lagged one year. Regressions include bank and year
fixed effects. Standard errors are adjusted for clustering at the bank level, and provided in parentheses. *,
**, and *** denote significance at 10%, 5%, and 1%, respectively.
Panel A
Z-score
(1)
Z-score
(2)
Distance to
default
(3)
Distance to
default
(4)
Assets -0.337* -0.330* -0.004 -0.033
(0.181) (0.180) (0.201) (0.200)
Assets to GDP -0.442 -0.409 -0.172 -0.109
(0.665) (0.659) (0.889) (0.908)
Overhead -0.424 -0.297 -0.645 -0.662
(1.882) (1.882) (1.983) (2.016)
Collateral -0.822* -0.835* -0.634 -0.673
(0.464) (0.460) (0.571) (0.571)
Inflation 19.801*** 19.592*** 16.287* 15.796*
(4.874) (4.976) (9.178) (9.020)
GDP growth 4.944 4.099 -20.199* -17.734
(8.725) (8.810) (11.962) (12.076)
GDP per capita -0.111 -0.101 -0.195 -0.218
(0.103) (0.105) (0.160) (0.162)
Restrict 0.091 0.092 -0.384** -0.342**
(0.122) (0.124) (0.166) (0.166)
Capital stringency -0.062 -0.076 0.115 0.130
(0.085) (0.087) (0.100) (0.101)
Official -0.054 -0.051 -0.051 -0.046
(0.039) (0.040) (0.055) (0.056)
Diversification 0.136 0.168 -0.865*** -0.877***
(0.097) (0.104) (0.144) (0.147)
Financial freedom 0.012** 0.013** 0.043*** 0.041***
(0.006) (0.006) (0.008) (0.009)
Fiscal balance 0.085 0.120 0.776*** 0.726***
(0.143) (0.164) (0.191) (0.200)

38
Corporate governance -0.027
-0.089***
(0.019)
(0.024)
Corporate governance * Fiscal balance -0.005
-0.027***
(0.006)
(0.007)
Board
-0.060**
-0.076**
(0.025)
(0.035)
Compensation and ownership
0.018
-0.124**
(0.036)
(0.059)
Auditing
0.043
-0.085
(0.067)
(0.107)
Takeover
0.016
-0.004
(0.081)
(0.091)
Board * Fiscal balance
-0.010
-0.014
(0.007)
(0.011)
Compensation and ownership * Fiscal balance
0.001
-0.056***
(0.010)
(0.018)
Auditing * Fiscal balance
0.013
-0.049
(0.019)
(0.031)
Takeover * Fiscal balance
-0.013
-0.009
(0.021)
(0.024)
N 3001 3001 2855 2855
adj. R-sq 0.218 0.218 0.577 0.579
Panel B
Assets 0.378 0.257 -0.399* -0.340
(0.268) (0.269) (0.233) (0.241)
Fiscal balance 0.413** 0.633*** 0.041 -0.030
(0.208) (0.242) (0.153) (0.181)
Corporate governance 0.217***
-0.001
(0.067)
(0.057)
Corporate governance * Fiscal balance 0.042***
0.013
(0.011)
(0.010)
Corporate governance * Assets -0.025***
-0.001
(0.006)
(0.005)
Corporate governance * Fiscal balance * Assets -0.005***
-0.001**
(0.001)
(0.001)
Board
0.229
0.088
(0.153)
(0.112)
Compensation and ownership
0.401
-0.028
(0.304)
(0.222)
Auditing
-0.458
0.289
(0.559)
(0.443)
Takeover
0.093
-0.218
(0.305)
(0.258)
Board * Fiscal balance
0.035
0.047
(0.041)
(0.031)
Compensation and ownership * Fiscal balance
0.106
0.036
(0.085)
(0.059)
Auditing * Fiscal balance
-0.171
0.091
(0.157)
(0.120)
Takeover * Fiscal balance
0.081
-0.151**
(0.076)
(0.061)
Board * Assets
-0.025
-0.012
(0.015)
(0.010)
Compensation and ownership * Assets
-0.040
0.009
(0.027)
(0.020)
Auditing * Assets
0.035
-0.023
(0.050)
(0.040)
Takeover * Assets
-0.017
0.021
(0.031)
(0.026)
Board * Fiscal balance * Assets
-0.002
-0.005*
(0.004)
(0.003)
Compensation and ownership * Fiscal balance *
-0.013*
-0.003
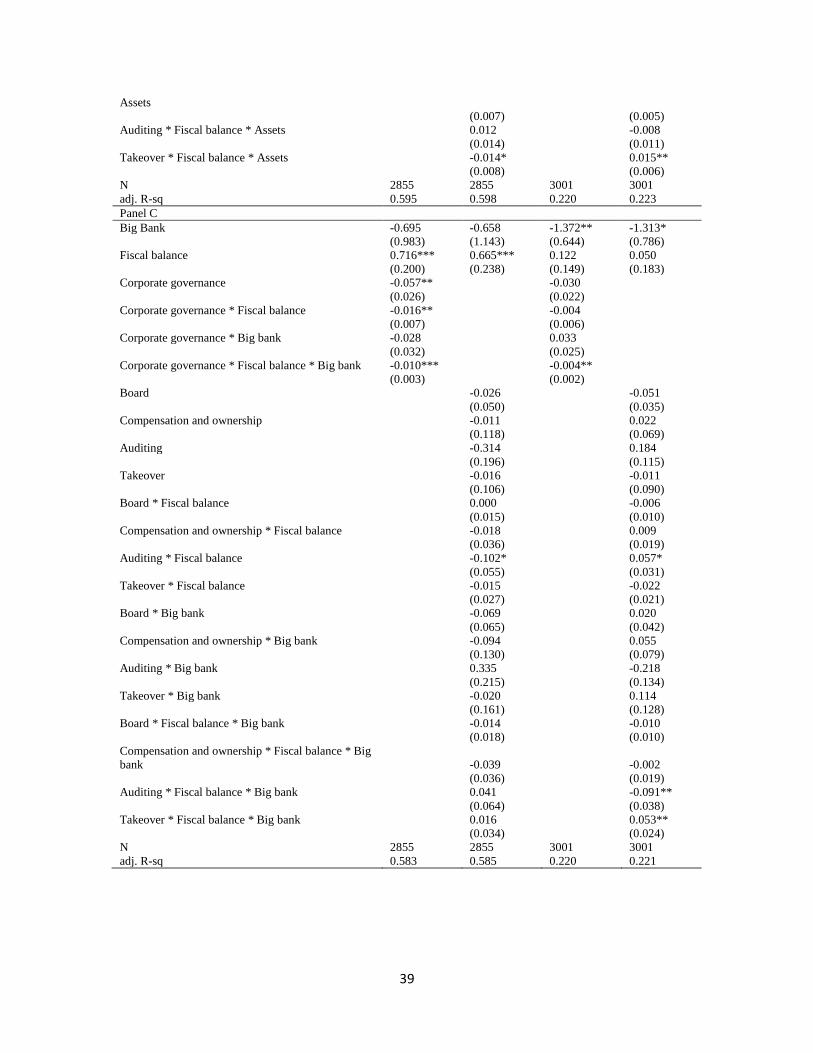
39
Assets
(0.007)
(0.005)
Auditing * Fiscal balance * Assets
0.012
-0.008
(0.014)
(0.011)
Takeover * Fiscal balance * Assets
-0.014*
0.015**
(0.008)
(0.006)
N 2855 2855 3001 3001
adj. R-sq 0.595 0.598 0.220 0.223
Panel C
Big Bank -0.695 -0.658 -1.372** -1.313*
(0.983) (1.143) (0.644) (0.786)
Fiscal balance 0.716*** 0.665*** 0.122 0.050
(0.200) (0.238) (0.149) (0.183)
Corporate governance -0.057**
-0.030
(0.026)
(0.022)
Corporate governance * Fiscal balance -0.016**
-0.004
(0.007)
(0.006)
Corporate governance * Big bank -0.028
0.033
(0.032)
(0.025)
Corporate governance * Fiscal balance * Big bank -0.010***
-0.004**
(0.003)
(0.002)
Board
-0.026
-0.051
(0.050)
(0.035)
Compensation and ownership
-0.011
0.022
(0.118)
(0.069)
Auditing
-0.314
0.184
(0.196)
(0.115)
Takeover
-0.016
-0.011
(0.106)
(0.090)
Board * Fiscal balance
0.000
-0.006
(0.015)
(0.010)
Compensation and ownership * Fiscal balance
-0.018
0.009
(0.036)
(0.019)
Auditing * Fiscal balance
-0.102*
0.057*
(0.055)
(0.031)
Takeover * Fiscal balance
-0.015
-0.022
(0.027)
(0.021)
Board * Big bank
-0.069
0.020
(0.065)
(0.042)
Compensation and ownership * Big bank
-0.094
0.055
(0.130)
(0.079)
Auditing * Big bank
0.335
-0.218
(0.215)
(0.134)
Takeover * Big bank
-0.020
0.114
(0.161)
(0.128)
Board * Fiscal balance * Big bank
-0.014
-0.010
(0.018)
(0.010)
Compensation and ownership * Fiscal balance * Big
bank
-0.039
-0.002
(0.036)
(0.019)
Auditing * Fiscal balance * Big bank
0.041
-0.091**
(0.064)
(0.038)
Takeover * Fiscal balance * Big bank
0.016
0.053**
(0.034)
(0.024)
N 2855 2855 3001 3001
adj. R-sq 0.583 0.585 0.220 0.221
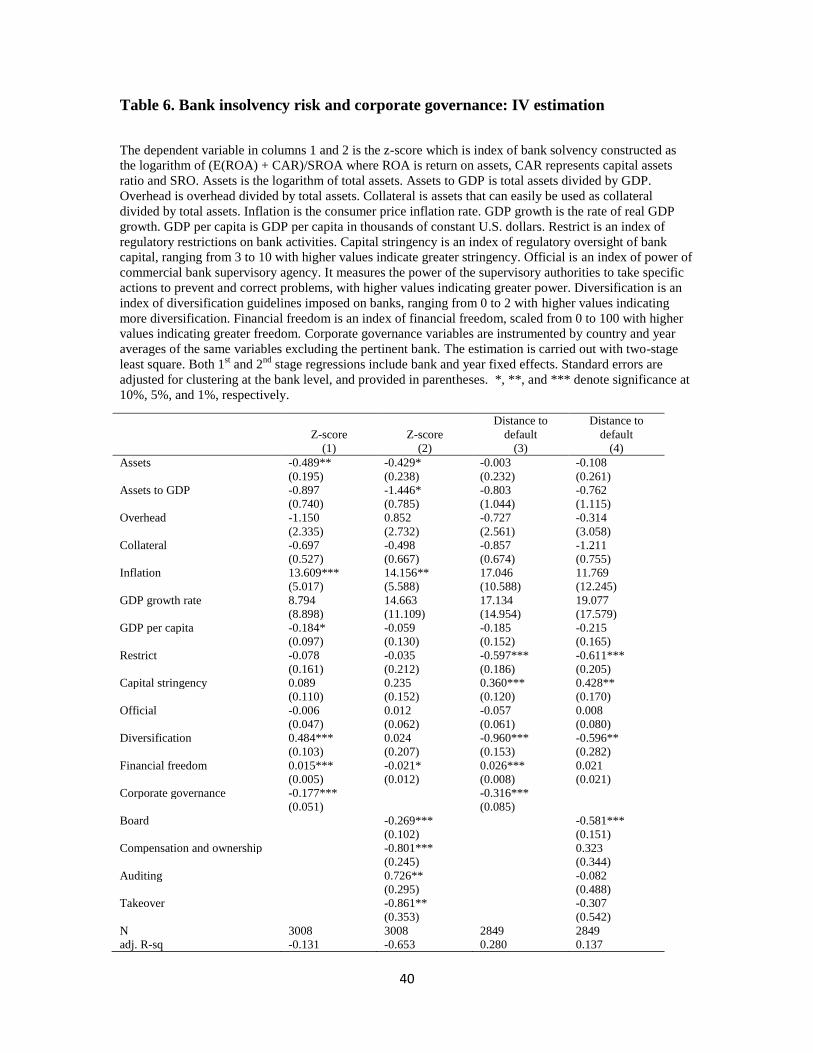
40
Table 6. Bank insolvency risk and corporate governance: IV estimation
The dependent variable in columns 1 and 2 is the z-score which is index of bank solvency constructed as
the logarithm of (E(ROA) + CAR)/SROA where ROA is return on assets, CAR represents capital assets
ratio and SRO. Assets is the logarithm of total assets. Assets to GDP is total assets divided by GDP.
Overhead is overhead divided by total assets. Collateral is assets that can easily be used as collateral
divided by total assets. Inflation is the consumer price inflation rate. GDP growth is the rate of real GDP
growth. GDP per capita is GDP per capita in thousands of constant U.S. dollars. Restrict is an index of
regulatory restrictions on bank activities. Capital stringency is an index of regulatory oversight of bank
capital, ranging from 3 to 10 with higher values indicate greater stringency. Official is an index of power of
commercial bank supervisory agency. It measures the power of the supervisory authorities to take specific
actions to prevent and correct problems, with higher values indicating greater power. Diversification is an
index of diversification guidelines imposed on banks, ranging from 0 to 2 with higher values indicating
more diversification. Financial freedom is an index of financial freedom, scaled from 0 to 100 with higher
values indicating greater freedom. Corporate governance variables are instrumented by country and year
averages of the same variables excluding the pertinent bank. The estimation is carried out with two-stage
least square. Both 1st and 2
nd stage regressions include bank and year fixed effects. Standard errors are
adjusted for clustering at the bank level, and provided in parentheses. *, **, and *** denote significance at
10%, 5%, and 1%, respectively.
Z-score
(1)
Z-score
(2)
Distance to
default
(3)
Distance to
default
(4)
Assets -0.489** -0.429* -0.003 -0.108
(0.195) (0.238) (0.232) (0.261)
Assets to GDP -0.897 -1.446* -0.803 -0.762
(0.740) (0.785) (1.044) (1.115)
Overhead -1.150 0.852 -0.727 -0.314
(2.335) (2.732) (2.561) (3.058)
Collateral -0.697 -0.498 -0.857 -1.211
(0.527) (0.667) (0.674) (0.755)
Inflation 13.609*** 14.156** 17.046 11.769
(5.017) (5.588) (10.588) (12.245)
GDP growth rate 8.794 14.663 17.134 19.077
(8.898) (11.109) (14.954) (17.579)
GDP per capita -0.184* -0.059 -0.185 -0.215
(0.097) (0.130) (0.152) (0.165)
Restrict -0.078 -0.035 -0.597*** -0.611***
(0.161) (0.212) (0.186) (0.205)
Capital stringency 0.089 0.235 0.360*** 0.428**
(0.110) (0.152) (0.120) (0.170)
Official -0.006 0.012 -0.057 0.008
(0.047) (0.062) (0.061) (0.080)
Diversification 0.484*** 0.024 -0.960*** -0.596**
(0.103) (0.207) (0.153) (0.282)
Financial freedom 0.015*** -0.021* 0.026*** 0.021
(0.005) (0.012) (0.008) (0.021)
Corporate governance -0.177***
-0.316***
(0.051)
(0.085)
Board
-0.269***
-0.581***
(0.102)
(0.151)
Compensation and ownership
-0.801***
0.323
(0.245)
(0.344)
Auditing
0.726**
-0.082
(0.295)
(0.488)
Takeover
-0.861**
-0.307
(0.353)
(0.542)
N 3008 3008 2849 2849
adj. R-sq -0.131 -0.653 0.280 0.137
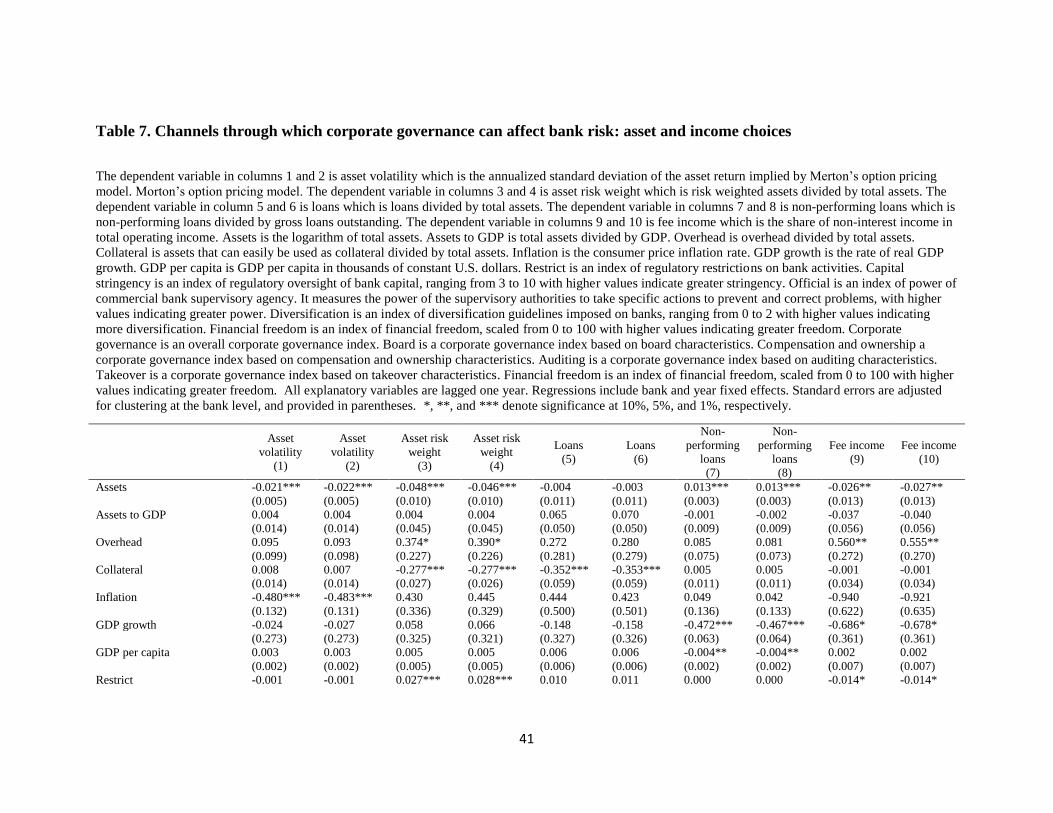
41
Table 7. Channels through which corporate governance can affect bank risk: asset and income choices
The dependent variable in columns 1 and 2 is asset volatility which is the annualized standard deviation of the asset return implied by Merton’s option pricing
model. Morton’s option pricing model. The dependent variable in columns 3 and 4 is asset risk weight which is risk weighted assets divided by total assets. The
dependent variable in column 5 and 6 is loans which is loans divided by total assets. The dependent variable in columns 7 and 8 is non-performing loans which is
non-performing loans divided by gross loans outstanding. The dependent variable in columns 9 and 10 is fee income which is the share of non-interest income in
total operating income. Assets is the logarithm of total assets. Assets to GDP is total assets divided by GDP. Overhead is overhead divided by total assets.
Collateral is assets that can easily be used as collateral divided by total assets. Inflation is the consumer price inflation rate. GDP growth is the rate of real GDP
growth. GDP per capita is GDP per capita in thousands of constant U.S. dollars. Restrict is an index of regulatory restrictions on bank activities. Capital
stringency is an index of regulatory oversight of bank capital, ranging from 3 to 10 with higher values indicate greater stringency. Official is an index of power of
commercial bank supervisory agency. It measures the power of the supervisory authorities to take specific actions to prevent and correct problems, with higher
values indicating greater power. Diversification is an index of diversification guidelines imposed on banks, ranging from 0 to 2 with higher values indicating
more diversification. Financial freedom is an index of financial freedom, scaled from 0 to 100 with higher values indicating greater freedom. Corporate
governance is an overall corporate governance index. Board is a corporate governance index based on board characteristics. Compensation and ownership a
corporate governance index based on compensation and ownership characteristics. Auditing is a corporate governance index based on auditing characteristics.
Takeover is a corporate governance index based on takeover characteristics. Financial freedom is an index of financial freedom, scaled from 0 to 100 with higher
values indicating greater freedom. All explanatory variables are lagged one year. Regressions include bank and year fixed effects. Standard errors are adjusted
for clustering at the bank level, and provided in parentheses. *, **, and *** denote significance at 10%, 5%, and 1%, respectively.
Asset
volatility
(1)
Asset
volatility
(2)
Asset risk
weight
(3)
Asset risk
weight
(4)
Loans
(5)
Loans
(6)
Non-
performing
loans
(7)
Non-
performing
loans
(8)
Fee income
(9)
Fee income
(10)
Assets -0.021*** -0.022*** -0.048*** -0.046*** -0.004 -0.003 0.013*** 0.013*** -0.026** -0.027**
(0.005) (0.005) (0.010) (0.010) (0.011) (0.011) (0.003) (0.003) (0.013) (0.013)
Assets to GDP 0.004 0.004 0.004 0.004 0.065 0.070 -0.001 -0.002 -0.037 -0.040
(0.014) (0.014) (0.045) (0.045) (0.050) (0.050) (0.009) (0.009) (0.056) (0.056)
Overhead 0.095 0.093 0.374* 0.390* 0.272 0.280 0.085 0.081 0.560** 0.555**
(0.099) (0.098) (0.227) (0.226) (0.281) (0.279) (0.075) (0.073) (0.272) (0.270)
Collateral 0.008 0.007 -0.277*** -0.277*** -0.352*** -0.353*** 0.005 0.005 -0.001 -0.001
(0.014) (0.014) (0.027) (0.026) (0.059) (0.059) (0.011) (0.011) (0.034) (0.034)
Inflation -0.480*** -0.483*** 0.430 0.445 0.444 0.423 0.049 0.042 -0.940 -0.921
(0.132) (0.131) (0.336) (0.329) (0.500) (0.501) (0.136) (0.133) (0.622) (0.635)
GDP growth -0.024 -0.027 0.058 0.066 -0.148 -0.158 -0.472*** -0.467*** -0.686* -0.678*
(0.273) (0.273) (0.325) (0.321) (0.327) (0.326) (0.063) (0.064) (0.361) (0.361)
GDP per capita 0.003 0.003 0.005 0.005 0.006 0.006 -0.004** -0.004** 0.002 0.002
(0.002) (0.002) (0.005) (0.005) (0.006) (0.006) (0.002) (0.002) (0.007) (0.007)
Restrict -0.001 -0.001 0.027*** 0.028*** 0.010 0.011 0.000 0.000 -0.014* -0.014*
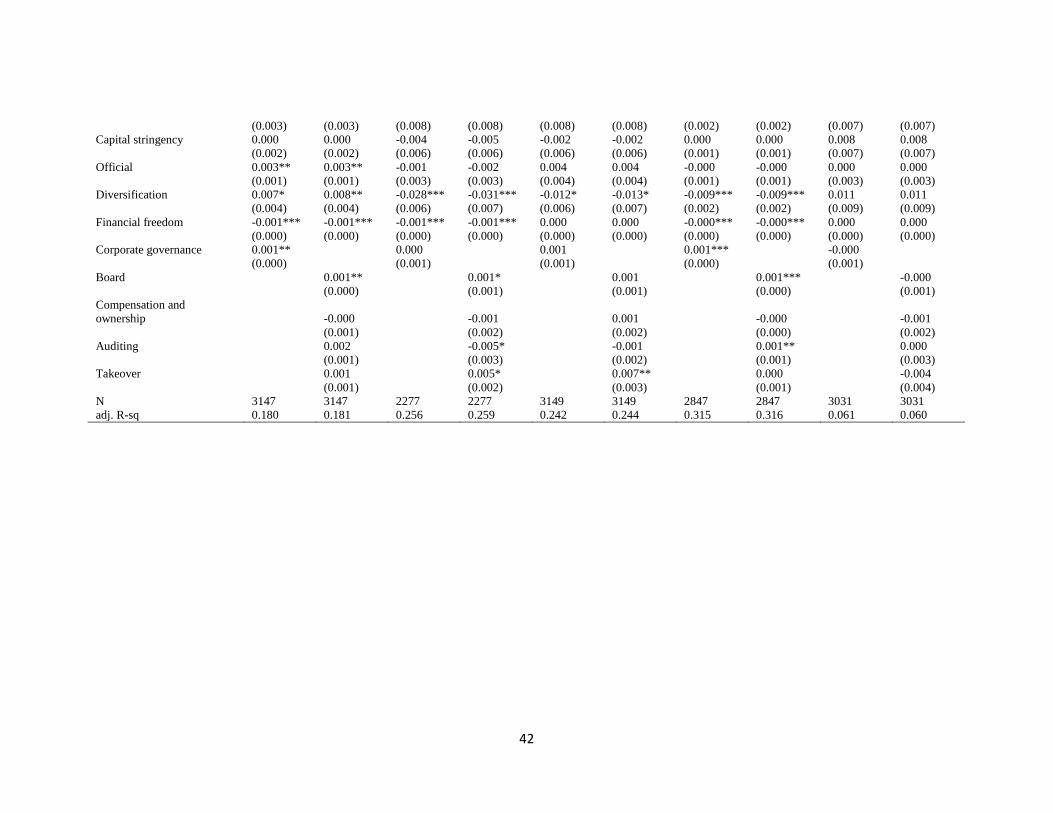
42
(0.003) (0.003) (0.008) (0.008) (0.008) (0.008) (0.002) (0.002) (0.007) (0.007)
Capital stringency 0.000 0.000 -0.004 -0.005 -0.002 -0.002 0.000 0.000 0.008 0.008
(0.002) (0.002) (0.006) (0.006) (0.006) (0.006) (0.001) (0.001) (0.007) (0.007)
Official 0.003** 0.003** -0.001 -0.002 0.004 0.004 -0.000 -0.000 0.000 0.000
(0.001) (0.001) (0.003) (0.003) (0.004) (0.004) (0.001) (0.001) (0.003) (0.003)
Diversification 0.007* 0.008** -0.028*** -0.031*** -0.012* -0.013* -0.009*** -0.009*** 0.011 0.011
(0.004) (0.004) (0.006) (0.007) (0.006) (0.007) (0.002) (0.002) (0.009) (0.009)
Financial freedom -0.001*** -0.001*** -0.001*** -0.001*** 0.000 0.000 -0.000*** -0.000*** 0.000 0.000
(0.000) (0.000) (0.000) (0.000) (0.000) (0.000) (0.000) (0.000) (0.000) (0.000)
Corporate governance 0.001** 0.000
0.001 0.001***
-0.000
(0.000) (0.001)
(0.001) (0.000)
(0.001)
Board 0.001**
0.001* 0.001
0.001*** -0.000
(0.000)
(0.001) (0.001)
(0.000) (0.001)
Compensation and
ownership -0.000
-0.001 0.001
-0.000 -0.001
(0.001)
(0.002) (0.002)
(0.000) (0.002)
Auditing 0.002
-0.005* -0.001
0.001** 0.000
(0.001)
(0.003) (0.002)
(0.001) (0.003)
Takeover 0.001
0.005* 0.007**
0.000 -0.004
(0.001)
(0.002) (0.003)
(0.001) (0.004)
N 3147 3147 2277 2277 3149 3149 2847 2847 3031 3031
adj. R-sq 0.180 0.181 0.256 0.259 0.242 0.244 0.315 0.316 0.061 0.060
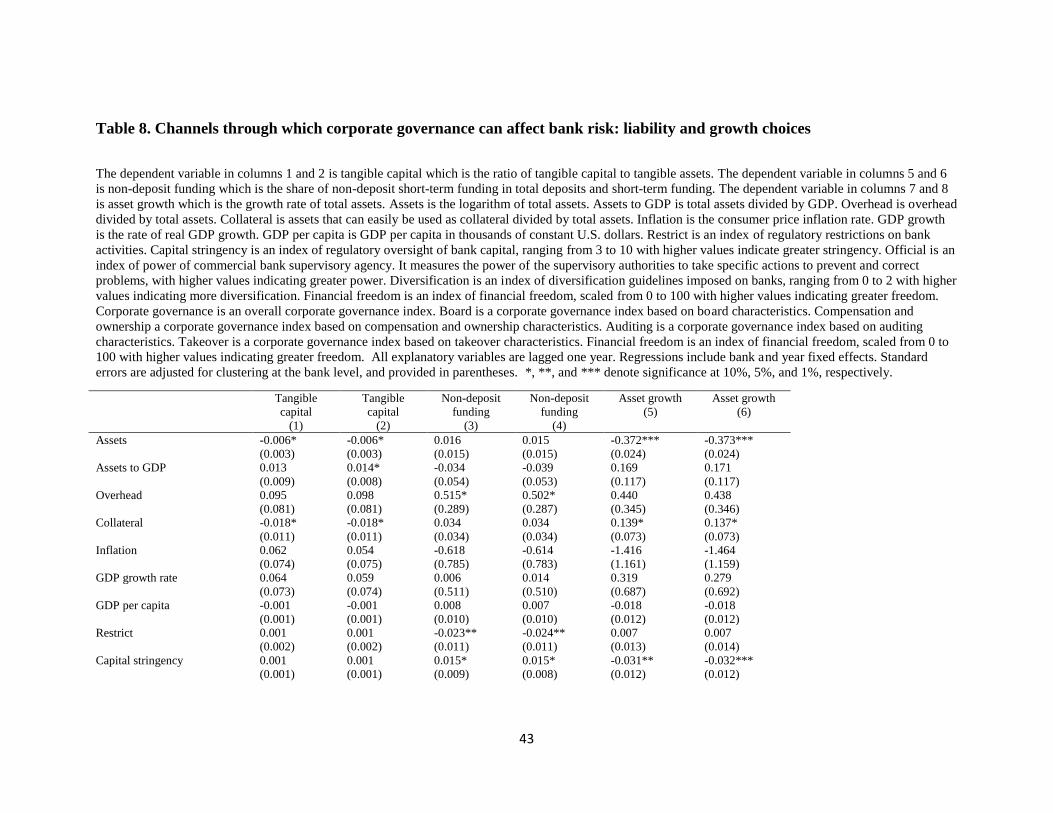
43
Table 8. Channels through which corporate governance can affect bank risk: liability and growth choices
The dependent variable in columns 1 and 2 is tangible capital which is the ratio of tangible capital to tangible assets. The dependent variable in columns 5 and 6
is non-deposit funding which is the share of non-deposit short-term funding in total deposits and short-term funding. The dependent variable in columns 7 and 8
is asset growth which is the growth rate of total assets. Assets is the logarithm of total assets. Assets to GDP is total assets divided by GDP. Overhead is overhead
divided by total assets. Collateral is assets that can easily be used as collateral divided by total assets. Inflation is the consumer price inflation rate. GDP growth
is the rate of real GDP growth. GDP per capita is GDP per capita in thousands of constant U.S. dollars. Restrict is an index of regulatory restrictions on bank
activities. Capital stringency is an index of regulatory oversight of bank capital, ranging from 3 to 10 with higher values indicate greater stringency. Official is an
index of power of commercial bank supervisory agency. It measures the power of the supervisory authorities to take specific actions to prevent and correct
problems, with higher values indicating greater power. Diversification is an index of diversification guidelines imposed on banks, ranging from 0 to 2 with higher
values indicating more diversification. Financial freedom is an index of financial freedom, scaled from 0 to 100 with higher values indicating greater freedom.
Corporate governance is an overall corporate governance index. Board is a corporate governance index based on board characteristics. Compensation and
ownership a corporate governance index based on compensation and ownership characteristics. Auditing is a corporate governance index based on auditing
characteristics. Takeover is a corporate governance index based on takeover characteristics. Financial freedom is an index of financial freedom, scaled from 0 to
100 with higher values indicating greater freedom. All explanatory variables are lagged one year. Regressions include bank and year fixed effects. Standard
errors are adjusted for clustering at the bank level, and provided in parentheses. *, **, and *** denote significance at 10%, 5%, and 1%, respectively.
Tangible
capital
(1)
Tangible
capital
(2)
Non-deposit
funding
(3)
Non-deposit
funding
(4)
Asset growth
(5)
Asset growth
(6)
Assets -0.006* -0.006* 0.016 0.015 -0.372*** -0.373***
(0.003) (0.003) (0.015) (0.015) (0.024) (0.024)
Assets to GDP 0.013 0.014* -0.034 -0.039 0.169 0.171
(0.009) (0.008) (0.054) (0.053) (0.117) (0.117)
Overhead 0.095 0.098 0.515* 0.502* 0.440 0.438
(0.081) (0.081) (0.289) (0.287) (0.345) (0.346)
Collateral -0.018* -0.018* 0.034 0.034 0.139* 0.137*
(0.011) (0.011) (0.034) (0.034) (0.073) (0.073)
Inflation 0.062 0.054 -0.618 -0.614 -1.416 -1.464
(0.074) (0.075) (0.785) (0.783) (1.161) (1.159)
GDP growth rate 0.064 0.059 0.006 0.014 0.319 0.279
(0.073) (0.074) (0.511) (0.510) (0.687) (0.692)
GDP per capita -0.001 -0.001 0.008 0.007 -0.018 -0.018
(0.001) (0.001) (0.010) (0.010) (0.012) (0.012)
Restrict 0.001 0.001 -0.023** -0.024** 0.007 0.007
(0.002) (0.002) (0.011) (0.011) (0.013) (0.014)
Capital stringency 0.001 0.001 0.015* 0.015* -0.031** -0.032***
(0.001) (0.001) (0.009) (0.008) (0.012) (0.012)

44
Official -0.001** -0.002** 0.001 0.001 -0.013* -0.012*
(0.001) (0.001) (0.004) (0.004) (0.006) (0.007)
Diversification 0.001 0.001 -0.005 -0.003 0.003 0.007
(0.001) (0.001) (0.006) (0.006) (0.015) (0.015)
Financial freedom 0.000 0.000 -0.000 0.000 -0.003*** -0.003***
(0.000) (0.000) (0.000) (0.000) (0.001) (0.001)
Corporate governance -0.000** 0.000
-0.000
(0.000) (0.001)
(0.002)
Board -0.001**
0.001
-0.002
(0.000)
(0.001)
(0.002)
Compensation and ownership -0.000
-0.002
0.000
(0.000) (0.002) (0.004)
Auditing -0.001 0.003 0.006
(0.001)
(0.003)
(0.006)
Takeover 0.001 -0.003 0.005
(0.001)
(0.004)
(0.006)
N 3091 3091 3131 3131 3156 3156
adj. R-sq 0.128 0.129 0.046 0.047 0.266 0.267
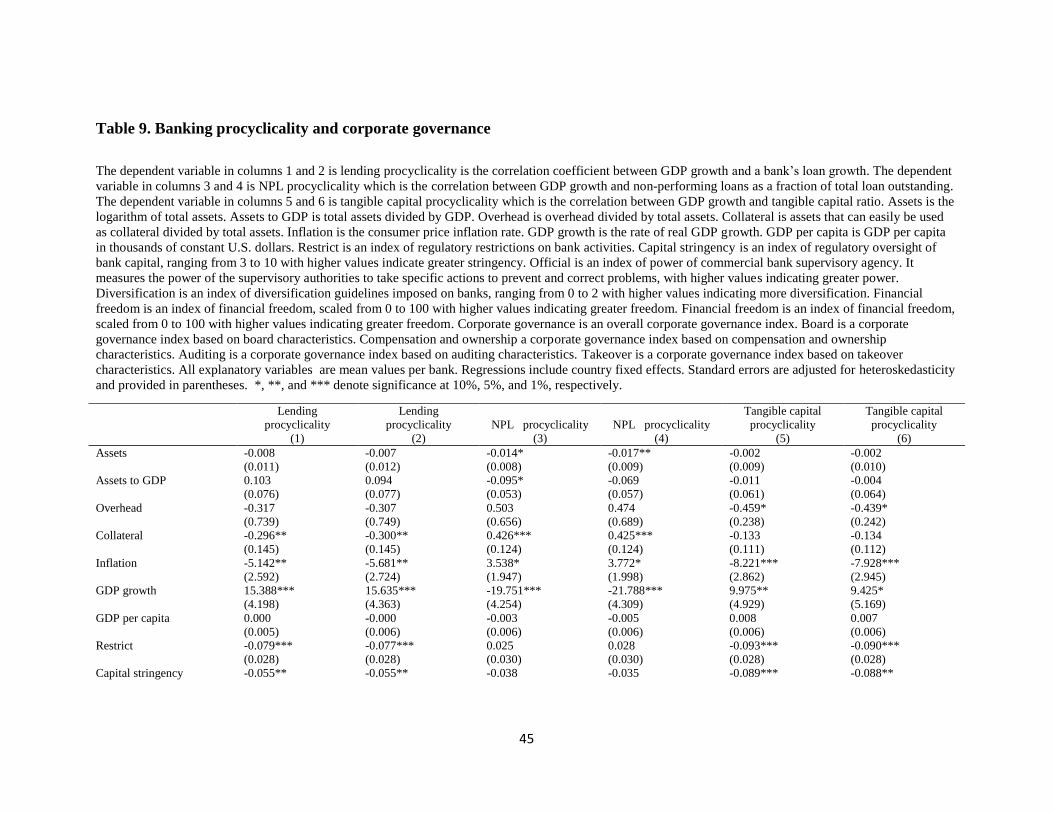
45
Table 9. Banking procyclicality and corporate governance
The dependent variable in columns 1 and 2 is lending procyclicality is the correlation coefficient between GDP growth and a bank’s loan growth. The dependent
variable in columns 3 and 4 is NPL procyclicality which is the correlation between GDP growth and non-performing loans as a fraction of total loan outstanding.
The dependent variable in columns 5 and 6 is tangible capital procyclicality which is the correlation between GDP growth and tangible capital ratio. Assets is the
logarithm of total assets. Assets to GDP is total assets divided by GDP. Overhead is overhead divided by total assets. Collateral is assets that can easily be used
as collateral divided by total assets. Inflation is the consumer price inflation rate. GDP growth is the rate of real GDP growth. GDP per capita is GDP per capita
in thousands of constant U.S. dollars. Restrict is an index of regulatory restrictions on bank activities. Capital stringency is an index of regulatory oversight of
bank capital, ranging from 3 to 10 with higher values indicate greater stringency. Official is an index of power of commercial bank supervisory agency. It
measures the power of the supervisory authorities to take specific actions to prevent and correct problems, with higher values indicating greater power.
Diversification is an index of diversification guidelines imposed on banks, ranging from 0 to 2 with higher values indicating more diversification. Financial
freedom is an index of financial freedom, scaled from 0 to 100 with higher values indicating greater freedom. Financial freedom is an index of financial freedom,
scaled from 0 to 100 with higher values indicating greater freedom. Corporate governance is an overall corporate governance index. Board is a corporate
governance index based on board characteristics. Compensation and ownership a corporate governance index based on compensation and ownership
characteristics. Auditing is a corporate governance index based on auditing characteristics. Takeover is a corporate governance index based on takeover
characteristics. All explanatory variables are mean values per bank. Regressions include country fixed effects. Standard errors are adjusted for heteroskedasticity
and provided in parentheses. *, **, and *** denote significance at 10%, 5%, and 1%, respectively.
Lending
procyclicality
(1)
Lending
procyclicality
(2)
NPL procyclicality
(3)
NPL procyclicality
(4)
Tangible capital
procyclicality
(5)
Tangible capital
procyclicality
(6)
Assets -0.008 -0.007 -0.014* -0.017** -0.002 -0.002
(0.011) (0.012) (0.008) (0.009) (0.009) (0.010)
Assets to GDP 0.103 0.094 -0.095* -0.069 -0.011 -0.004
(0.076) (0.077) (0.053) (0.057) (0.061) (0.064)
Overhead -0.317 -0.307 0.503 0.474 -0.459* -0.439*
(0.739) (0.749) (0.656) (0.689) (0.238) (0.242)
Collateral -0.296** -0.300** 0.426*** 0.425*** -0.133 -0.134
(0.145) (0.145) (0.124) (0.124) (0.111) (0.112)
Inflation -5.142** -5.681** 3.538* 3.772* -8.221*** -7.928***
(2.592) (2.724) (1.947) (1.998) (2.862) (2.945)
GDP growth 15.388*** 15.635*** -19.751*** -21.788*** 9.975** 9.425*
(4.198) (4.363) (4.254) (4.309) (4.929) (5.169)
GDP per capita 0.000 -0.000 -0.003 -0.005 0.008 0.007
(0.005) (0.006) (0.006) (0.006) (0.006) (0.006)
Restrict -0.079*** -0.077*** 0.025 0.028 -0.093*** -0.090***
(0.028) (0.028) (0.030) (0.030) (0.028) (0.028)
Capital stringency -0.055** -0.055** -0.038 -0.035 -0.089*** -0.088**
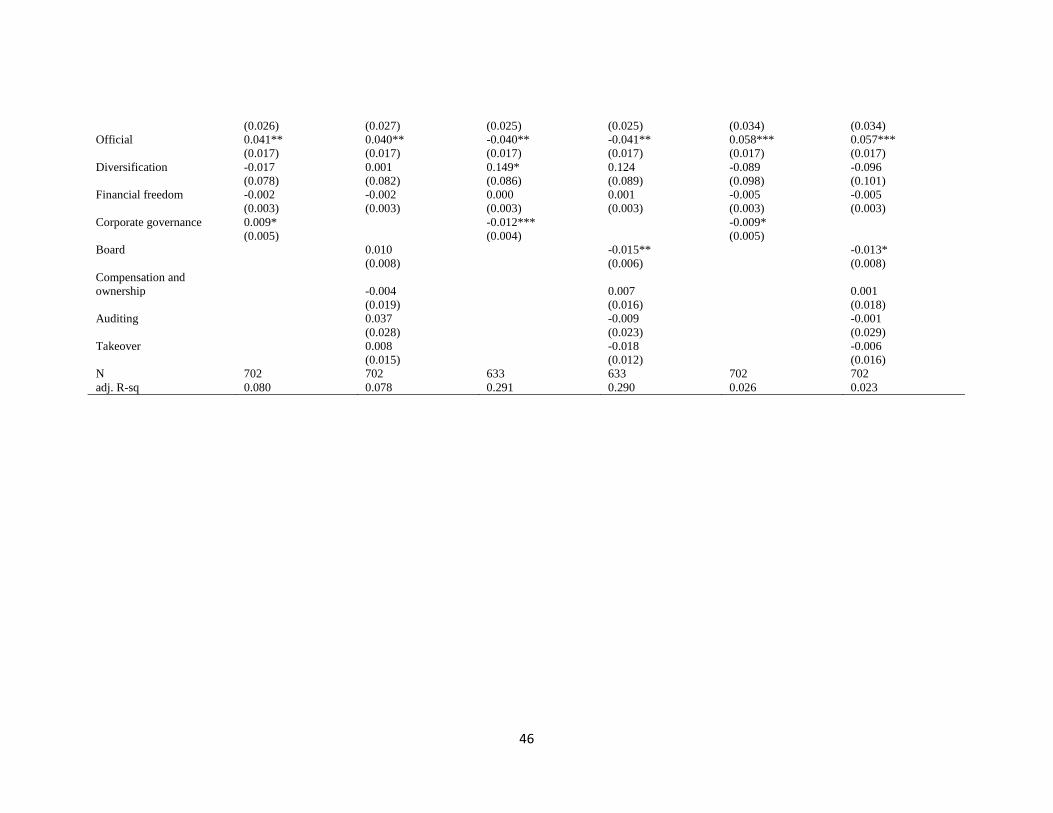
46
(0.026) (0.027) (0.025) (0.025) (0.034) (0.034)
Official 0.041** 0.040** -0.040** -0.041** 0.058*** 0.057***
(0.017) (0.017) (0.017) (0.017) (0.017) (0.017)
Diversification -0.017 0.001 0.149* 0.124 -0.089 -0.096
(0.078) (0.082) (0.086) (0.089) (0.098) (0.101)
Financial freedom -0.002 -0.002 0.000 0.001 -0.005 -0.005
(0.003) (0.003) (0.003) (0.003) (0.003) (0.003)
Corporate governance 0.009*
-0.012***
-0.009*
(0.005)
(0.004)
(0.005)
Board
0.010
-0.015**
-0.013*
(0.008)
(0.006)
(0.008)
Compensation and
ownership
-0.004
0.007
0.001
(0.019)
(0.016)
(0.018)
Auditing
0.037
-0.009
-0.001
(0.028)
(0.023)
(0.029)
Takeover
0.008
-0.018
-0.006
(0.015)
(0.012)
(0.016)
N 702 702 633 633 702 702
adj. R-sq 0.080 0.078 0.291 0.290 0.026 0.023
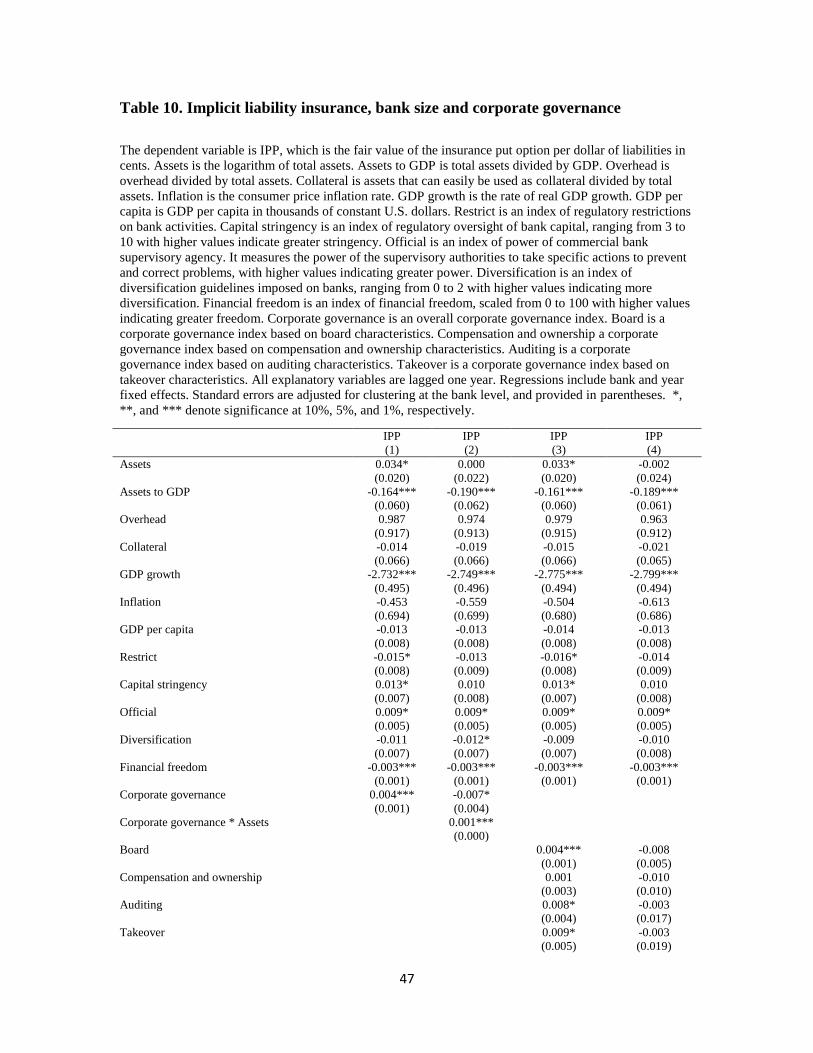
47
Table 10. Implicit liability insurance, bank size and corporate governance
The dependent variable is IPP, which is the fair value of the insurance put option per dollar of liabilities in
cents. Assets is the logarithm of total assets. Assets to GDP is total assets divided by GDP. Overhead is
overhead divided by total assets. Collateral is assets that can easily be used as collateral divided by total
assets. Inflation is the consumer price inflation rate. GDP growth is the rate of real GDP growth. GDP per
capita is GDP per capita in thousands of constant U.S. dollars. Restrict is an index of regulatory restrictions
on bank activities. Capital stringency is an index of regulatory oversight of bank capital, ranging from 3 to
10 with higher values indicate greater stringency. Official is an index of power of commercial bank
supervisory agency. It measures the power of the supervisory authorities to take specific actions to prevent
and correct problems, with higher values indicating greater power. Diversification is an index of
diversification guidelines imposed on banks, ranging from 0 to 2 with higher values indicating more
diversification. Financial freedom is an index of financial freedom, scaled from 0 to 100 with higher values
indicating greater freedom. Corporate governance is an overall corporate governance index. Board is a
corporate governance index based on board characteristics. Compensation and ownership a corporate
governance index based on compensation and ownership characteristics. Auditing is a corporate
governance index based on auditing characteristics. Takeover is a corporate governance index based on
takeover characteristics. All explanatory variables are lagged one year. Regressions include bank and year
fixed effects. Standard errors are adjusted for clustering at the bank level, and provided in parentheses. *,
**, and *** denote significance at 10%, 5%, and 1%, respectively.
IPP
(1)
IPP
(2)
IPP
(3)
IPP
(4)
Assets 0.034* 0.000 0.033* -0.002
(0.020) (0.022) (0.020) (0.024)
Assets to GDP -0.164*** -0.190*** -0.161*** -0.189***
(0.060) (0.062) (0.060) (0.061)
Overhead 0.987 0.974 0.979 0.963
(0.917) (0.913) (0.915) (0.912)
Collateral -0.014 -0.019 -0.015 -0.021
(0.066) (0.066) (0.066) (0.065)
GDP growth -2.732*** -2.749*** -2.775*** -2.799***
(0.495) (0.496) (0.494) (0.494)
Inflation -0.453 -0.559 -0.504 -0.613
(0.694) (0.699) (0.680) (0.686)
GDP per capita -0.013 -0.013 -0.014 -0.013
(0.008) (0.008) (0.008) (0.008)
Restrict -0.015* -0.013 -0.016* -0.014
(0.008) (0.009) (0.008) (0.009)
Capital stringency 0.013* 0.010 0.013* 0.010
(0.007) (0.008) (0.007) (0.008)
Official 0.009* 0.009* 0.009* 0.009*
(0.005) (0.005) (0.005) (0.005)
Diversification -0.011 -0.012* -0.009 -0.010
(0.007) (0.007) (0.007) (0.008)
Financial freedom -0.003*** -0.003*** -0.003*** -0.003***
(0.001) (0.001) (0.001) (0.001)
Corporate governance 0.004*** -0.007*
(0.001) (0.004)
Corporate governance * Assets
0.001***
(0.000)
Board
0.004*** -0.008
(0.001) (0.005)
Compensation and ownership
0.001 -0.010
(0.003) (0.010)
Auditing
0.008* -0.003
(0.004) (0.017)
Takeover
0.009* -0.003
(0.005) (0.019)

48
Board * Assets
0.001***
(0.001)
Compensation and ownership * Assets
0.001
(0.001)
Auditing * Assets
0.001
(0.002)
Takeover * Assets
0.001
(0.002)
N 2858 2858 2858 2858
adj. R-sq 0.523 0.525 0.523 0.524

49
Figure 1. The evolution of governance finance variables
Part A. Overall corporate governance index
Part B. Board index
23
24
25
26
27
Mean
2003 2004 2005 2006 2007Year
US firms Non-US firms
11.5
12
12.5
13
13.5
14
Mean
2003 2004 2005 2006 2007Year
US firms Non-US firms
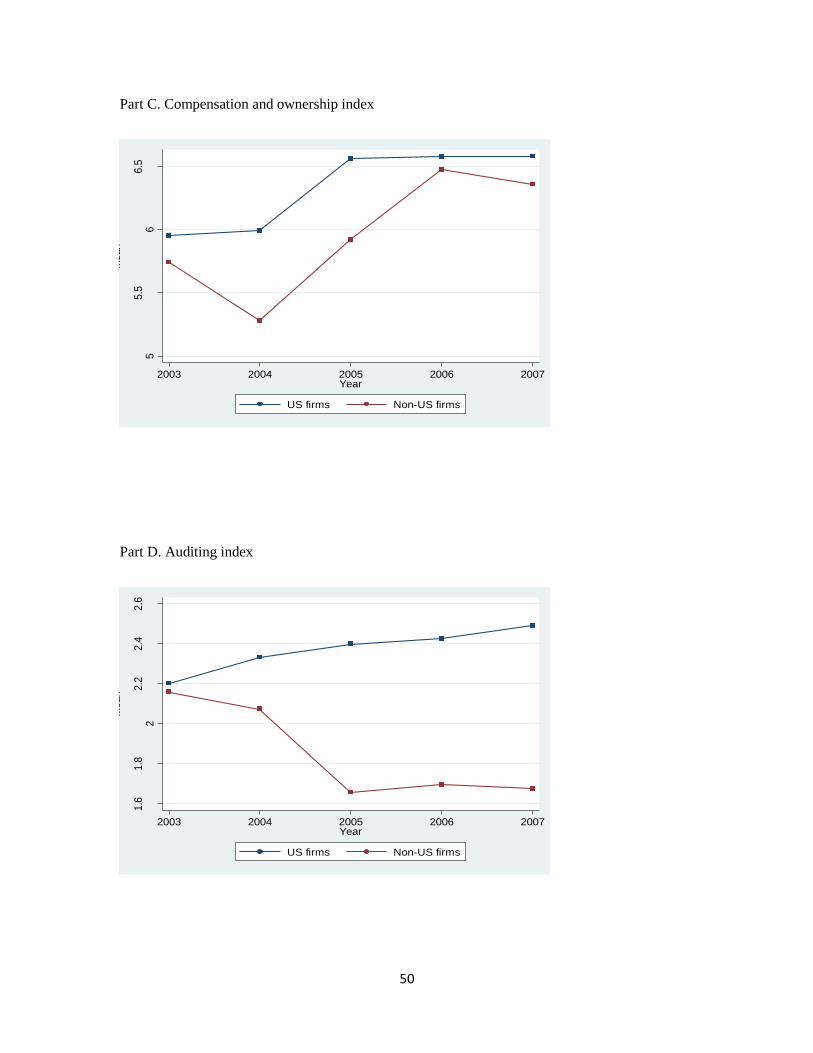
50
Part C. Compensation and ownership index
Part D. Auditing index
55.5
66.5
Mean
2003 2004 2005 2006 2007Year
US firms Non-US firms
1.6
1.8
22.2
2.4
2.6
Mean
2003 2004 2005 2006 2007Year
US firms Non-US firms

51
Part E. Takeover index
3.4
3.6
3.8
44.2
Mean
2003 2004 2005 2006 2007Year
US firms Non-US firms