Tilapia - Seafood Watch...3 Executive Summary Tilapia production accounts for 20%–25% of total...
52
1 Disclaimer Seafood Watch® strives to have all Seafood Reports reviewed for accuracy and completeness by external scientists with expertise in ecology, fisheries science and aquaculture. Scientific review, however, does not constitute an endorsement of the Seafood Watch® program or its recommendations on the part of the reviewing scientists. Seafood Watch® is solely responsible for the conclusions reached in this report. Tilapia Tilapia (Oreochromis spp.) (© Monterey Bay Aquarium) Taiwan Ponds Aquaculture Standard Version A2 February 6, 2016 Seafood Watch Consulting Researcher
Transcript of Tilapia - Seafood Watch...3 Executive Summary Tilapia production accounts for 20%–25% of total...
1
Disclaimer Seafood Watch® strives to have all Seafood Reports reviewed for accuracy and completeness by external scientists with expertise in ecology, fisheries science and aquaculture. Scientific review, however, does not constitute an endorsement of the Seafood Watch® program or its recommendations on the part of the reviewing scientists. Seafood Watch® is solely responsible for the conclusions reached in this report.
Tilapia Tilapia (Oreochromis spp.)
(© Monterey Bay Aquarium)
Taiwan Ponds
Aquaculture Standard Version A2
February 6, 2016 Seafood Watch Consulting Researcher
2
FINAL RANK
YELLOW
OVERALL RANKING
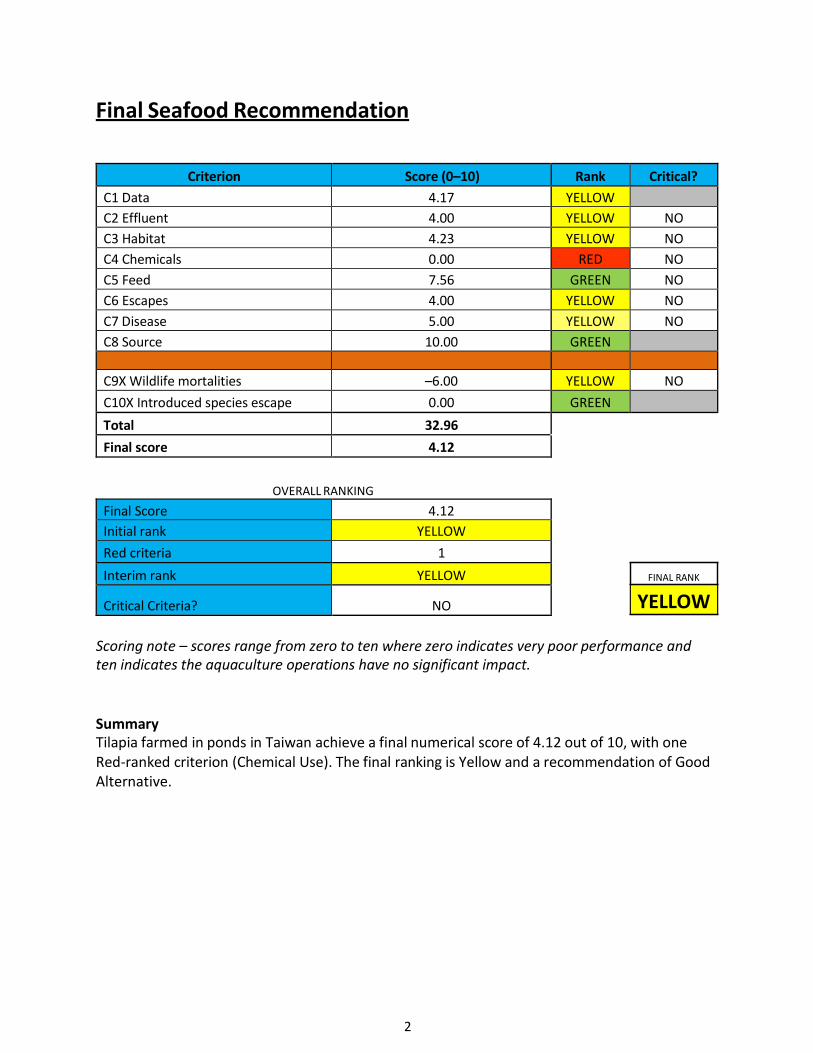
Scoring note – scores range from zero to ten where zero indicates very poor performance and ten indicates the aquaculture operations have no significant impact.
Summary Tilapia farmed in ponds in Taiwan achieve a final numerical score of 4.12 out of 10, with one Red-ranked criterion (Chemical Use). The final ranking is Yellow and a recommendation of Good Alternative.
Final Seafood Recommendation
Criterion Score (0–10) Rank Critical?
C1 Data 4.17 YELLOW
C2 Effluent 4.00 YELLOW NO
C3 Habitat 4.23 YELLOW NO
C4 Chemicals 0.00 RED NO
C5 Feed 7.56 GREEN NO
C6 Escapes 4.00 YELLOW NO
C7 Disease 5.00 YELLOW NO
C8 Source 10.00 GREEN
C9X Wildlife mortalities –6.00 YELLOW NO
C10X Introduced species escape 0.00 GREEN
Total 32.96
Final score 4.12
Final Score 4.12
Initial rank YELLOW
Red criteria 1
Interim rank YELLOW
Critical Criteria? NO
3
Executive Summary
Tilapia production accounts for 20%–25% of total aquaculture production in Taiwan. In 2012, the annual production of tilapia in Taiwan was 73,342 metric tons (MT) valued at USD 104 million, and more than half of it was exported to the U.S. Tilapia is farmed in outdoor freshwater ponds, but some production is also harvested from brackish and seawater ponds.
Data. Information on tilapia production in Taiwan is quite scarce. Updated aquaculture production statistics are published yearly by the Taiwanese Fisheries Bureau; the most recent was published in 2012. But research on tilapia production and its impacts on the environment is scarce and generally available only in Chinese. In 2013, 11 Taiwanese tilapia farms were awarded an Aquaculture Stewardship Council (ASC) certificate; i.e., in conformance to the ASC Tilapia Standard. This event marked the first such certification for Taiwanese farms. The ASC certificate provides detailed information about the practices on site and the impact of the farm on the environment. But these farms do not represent the general state of tilapia farming in Taiwan and will not be taken into consideration. Given the broad base of literature regarding tilapia aquaculture globally but the general lack of information specific to Taiwan, data quality and availability is considered to be moderate and is scored 4.17 out of 10.
Effluent. The Effluent criterion is divided into two factors: an estimate of the amount of nitrogen wastes discharged per ton of harvested fish, and the cumulative impact of multiple farms through an evaluation of the regulatory structure and its enforcement. Effluent discharge is estimated through nitrogen wastes released per ton of harvested tilapia. The combination of an average feed protein content of 26%, eFCR of 1.8, and protein content of harvested tilapia of 14% results in the production of 52.48 kg of nitrogen waste per ton of production. Because ponds are assumed to have daily water exchange rates of 10%–150%, and effluent is typically discharged without treatment, an estimated 51% of nitrogenous waste, equaling 27 kg N per ton of production, is discharged to the receiving waterbody. Regulations regarding effluent discharge from aquaculture in Taiwan are considered to be poor, and despite incentives to improve fish farming practices, their implementation and regulations are not adequately enforced. This results in a low score for the regulatory and management effectiveness factor of 0.6 out of 10. The combination of the waste discharge score and the regulatory or management effectiveness score results in a final score for Effluent of 4 out of 10.
Habitat. Tilapia operations in Taiwan are located primarily in the south of the country, and occupy diverse habitats. Historical land conversion for tilapia aquaculture and the often illegal use of groundwater for pond filling has resulted in land subsidence, reduced water storage capacity of aquifers, and impacts to soil salinity—resulting in a loss of ecosystem services from moderately valuable land. But legislation aimed at restoring impacted ecosystems has shown promise. Ultimately, the score for Factor 3.1 is 5 out of 10. The impact at the farm level is combined with the existence and enforcement of management and regulations that limit the expansion and cumulative impact of multiple farms on the provision of ecosystem services. These regulations are considered to be weak in Taiwan. The lack of aquaculture planning and regulation has resulted in the massive proliferation of earthen ponds, and the over-pumping of
4
groundwater. Still, many aquaculture farms in Taiwan are not regulated - branded “black” - and they are illegally pumping groundwater. Taiwanese government policies aiming to control these impacts had been historically ineffective, though there are signs of improved management and regulation taking place. The combination of the moderate habitat conversion and function score (5 out of 10) and the low regulatory or management effectiveness score (2.70 out of 10) results in a final score of 4.23 out of 10 for Criterion 3 – Habitat.
Chemical Use. A wide range of chemicals is used in aquaculture systems for a variety of purposes, but most importantly they are applied for disease treatment and pest management. The potential effects of chemical use on natural ecosystems and human health have raised growing awareness about the need for responsible practices. There is evidence that Taiwanese tilapia farms have applied illegal chemicals such as malachite green and gentian violet. Tilapia fry are fed feeds that incorporate the male hormone 17-alpha-methyltestosterone in order to obtain 100% male tilapia populations, but the ecological impact of this use is considered minimal. The use of illegal chemicals in Taiwanese tilapia production is a serious concern and results in a final score of 0 out of 10 for Criterion 4 – Chemical Use.
Feed. The Feed criterion comprises three factors: wild fish use, protein net gain or loss, and feed footprint. The wild fish use factor uses the FIFO (Fish In:Fish Out) ratio to calculate the amount of wild fish required per ton of harvested tilapia. Tilapia diets have a low inclusion level of marine ingredients (1.5% fishmeal, and 0% fish oil), and an average eFCR (economic Feed Conversion Ratio) of 1.8. These combine to result in a FIFO value of 0.12 and a FIFO score of 9.70 out of 10. Because the source of marine ingredients is unknown (–6 out of –10), the final Factor 5.1 score is 9.63 out of 10. The balance between protein inputs (i.e., feed, 26% protein) and outputs (i.e., the protein in the harvested fish and percent of utilized byproducts) results in the loss of 71.5% of protein. Therefore, Factor 5.2 earns a score of 2 out of 10. The low level of marine ingredients and the dominance of crop-derived ingredients such as soybean meal, wheat products, and rice bran determine a low feed footprint (1.37 hectares per ton of production), and a high score for the feed footprint factor of 9 out of 10. The three factor scores combine in a high overall score for Criterion 5 – Feed of 7.56 out of 10.
Escapes. The Escapes criterion comprises two factors: the risk of escape and the potential ecological impact of the escapees. The risk of escape is considered to be high in ponds with high water exchange rates (>10% per day); although no direct evidence of exchange rates is available for Taiwanese tilapia production, evidence from other regions indicates that semi- intensive and intensive tilapia ponds are often exchanged at 10% and 150%. Thus, the score for Factor 6.1a Escape Risk is 2 out of 10. Tilapia is often considered a highly invasive species and is an exotic species in Taiwan. The first tilapia species was introduced to Taiwan in 1946, and in the following decades, many others were successfully introduced and cultured. Currently, tilapia populations are fully established in the wild. There is currently no direct evidence of impact of Taiwanese tilapia escapees on receiving ecosystems, but because it is a species group known to be highly invasive, the potential impacts of ongoing escapes on wild populations are considered to be moderate, and are related to habitat alteration and resource competition; the score for Factor 6.1b Invasiveness is 6 out of 10. The combination of Factors 6.1a and 6.1b results in a final score of 4 out of 10 for Criterion 6 – Escapes.
5
Disease. Though tilapia are resilient to disease, they do occasionally suffer from pathogenic infections; the most common diseases in tilapia production in Taiwan are Streptococcus, Francisellosis, and Vibriosis. Animal health regulations require farmers to report disease occurrence, and subsequent inspections may occur, but no reporting or monitoring data are available to determine the on-farm disease incidence. In addition, tilapia farms discharge water without relevant treatment. The data available are insufficient to determine whether on-farm diseases impact wild populations around the fish farms. Therefore, the risk of diseases is considered to be moderate, and the overall score for Criterion 7 – Disease is 5 out of 10.
Source of Stock. Taiwanese tilapia production is fully independent of wild seed because 100% of tilapia fingerlings are produced in hatcheries from domesticated broodstock. Furthermore, Taiwanese tilapia production is self-sufficient in terms of broodstock and fingerling production and does not involve any international or trans-waterbody live animal shipments.
Wildlife and Predator Mortalities. Data regarding wildlife and predator mortalities due to the operation of tilapia farms in Taiwan are considered to be very poor. The single wildlife protection law allows the killing of wildlife—including otherwise protected species—in extreme cases, and no reporting or monitoring data are available to determine the actual number of animals killed. Therefore, the score for Criterion 9X: Wildlife and Predator Mortalities is –6 out of 10.
Unintentional Species Introductions. Production of tilapia in Taiwan is fully independent and does not involve international or trans-waterbody live animal shipments. Therefore, there is no risk of unintentionally introducing non-native species. The final score for Criterion 10X – Escape of Unintentionally Introduced Species is 0 out of –10.
Summary Overall, Taiwanese tilapia pond production achieves a numerical score of 4.12 out of 10, with one Red-ranked criteria (Chemical Use). The overall ranking is “Yellow” and a recommendation of “Good Alternative.”
6
Table of Contents
Final Seafood Recommendation ..................................................................................................... 2
Executive Summary ......................................................................................................................... 3
Introduction .................................................................................................................................... 7
Scope of the analysis and ensuing recommendation ............................................................. 7
Analysis ........................................................................................................................................... 9
Scoring guide .......................................................................................................................... 9
Criterion 1: Data quality and availability ...............................................................................10
Criterion 2: Effluents .............................................................................................................13
Criterion 3: Habitat ...............................................................................................................16
Criterion 4: Evidence or Risk of Chemical Use ......................................................................20
Criterion 5: Feed....................................................................................................................23
Criterion 6: Escapes ...............................................................................................................27
Criterion 7: Disease; pathogen and parasite interactions .....................................................30
Criterion 8: Source of Stock ...................................................................................................... 32
Criterion 9X: Wildlife and Predator Mortalities ....................................................................33
Criterion 10X: Escape of Unintentionally Introduced Species ...............................................34
Overall Recommendation ..............................................................................................................35
Acknowledgements ........................................................................................................................36
References .....................................................................................................................................37
About Seafood Watch® ..................................................................................................................46
Guiding Principles ...........................................................................................................................47
Data points and all scoring calculations .........................................................................................48
7
Introduction
Scope of the analysis and ensuing recommendation Species Tilapia (Oreochromis spp.), Mozambique tilapia (Oreochromis mossambicus), red hybrid tilapia (O. spp.) and Nile tilapia (O. niloticus) are the most important cultured species; however, eight tilapia species are being cultured in Taiwan. Other species are blue tilapia (O. aureus), Wami tilapia (O. urolepis hornorum) and Sabaki tilapia (O. spilurus spilurus).
Geographic coverage Taiwan
Production Methods Ponds
Species Overview
Tilapia are prolific, fast-growing tropical species, native to Africa but introduced elsewhere as a valuable food fish. Tilapia is a common name applied to three genera: Oreochromis (maternal mouthbrooders), Sarotherodon (paternal mouthbrooders), and Tilapia (substrate spawners). Most species are unable to survive at temperatures below 50°F. Tilapia can live in either fresh or salt water. They are omnivores, feeding mainly on algae, aquatic macrophytes, detritus, and associated bacterial films (Fitzsimmons and Watanabe 2010). Tilapia are also known in the market as Saint Peter fish and Izumidai (Fitzsimmons 2006).
Production statistics Tilapia is the second most-produced group of farmed fish after carp. In 2014, farmed tilapia production exceeded 4.8 million metric tons (MT). Tilapia is produced in more than 100 nations, surpassing any other farmed fish (Fitzsimmons 2015). According to the National Fisheries Institute (2011), tilapia is the fourth most consumed fish in the United States after shrimp, tuna, and salmon. During 2010, the average consumption of tilapia (1.5 pounds) increased 20% compared to 2009.
Tilapia accounts for 20%–25% of total aquaculture production in Taiwan (Grabacki 2011). Tainan County, in the south, produces almost one-third of Taiwanese tilapia in 2,260 hectares of ponds. Other counties that contribute to aquaculture production in Taiwan are Chiayi, Yulin, Kaohsiung, and Pintung. The largest exporter of tilapia in Taiwan is the Kouhu Fisheries Cooperative, which comprises more than 200 fish farmers (+2,300 hectares) in southern Taiwan counties. Tilapia in Taiwan is mostly farmed in outdoor freshwater ponds (> 80%), but some production is also harvested from brackish and seawater ponds (Chen et al. 2006). In 2010, the annual production of tilapia in Taiwan was 74,896 metric tons (MT) valued at USD 117 million (Taiwan Fisheries Yearbook 2011). In 2012, production was 73,342 MT, accounting for 5.84% of the total fish production for the year (Taiwan Fisheries Yearbook 2014).
8
Import and export statistics The United States is the leading importer of tilapia, and consumes 225,000 MT of tilapia annually (Bacharach et al. 2016). The tilapia market in the United States can be divided into two segments: frozen and fresh products (Norman-López and Bjørndal 2009). Chinese products dominate the frozen sector of the U.S. market, providing about 68% of the whole tilapia and 86% of the tilapia fillets (USDA 2012). Latin American countries dominate the market of fresh products. In 2011, Honduras and Ecuador supplied 74% of imported fresh fillets to the U.S. market. During 2011, the United States imported more than 30.68 million pounds of tilapia, valued at USD 36.89 million, from Taiwan, and more than 87% were in the form of whole frozen (USDA 2012). By-products from tilapia are used for leather goods, gelatin, and medicines.
Tilapia production in Taiwan is export-oriented, mostly to the United States. Taiwan exported a total of 37,361 MT of tilapia in 2013, which is approximately half of national production and 28% more than in 2012. Nearly 91% of this was whole frozen exports directed to the United States (58%), Canada (8%), and the Middle East (25%). Taiwanese tilapia is also exported to the European Union, South Korea, Japan, and the Middle East (Globefish 2011).
9
Analysis
Scoring guide With the exclusion of the exceptional criteria (9X and 10X), all scores result in a zero to ten
final score for the criterion and the overall final rank. A zero score indicates poor performance, while a score of ten indicates high performance. In contrast, the two exceptional criteria result in negative scores from zero to minus ten, and in these cases zero indicates no negative impact.
The full Seafood Watch Aquaculture Criteria that the following scores relate to are available here.
The full data values and scoring calculations are available in Annex 1.
10
Criterion 1: Data quality and availability
Impact, unit of sustainability and principle Impact: Poor data quality and availability limits the ability to assess and understand the
impacts of aquaculture production. It also does not enable informed choices for seafood purchasers, nor enable businesses to be held accountable for their impacts.
Sustainability unit: The ability to make a robust sustainability assessment. Principle: Robust and up-to-date information on production practices and their impacts is
available to relevant stakeholders.
Criterion 1 Summary
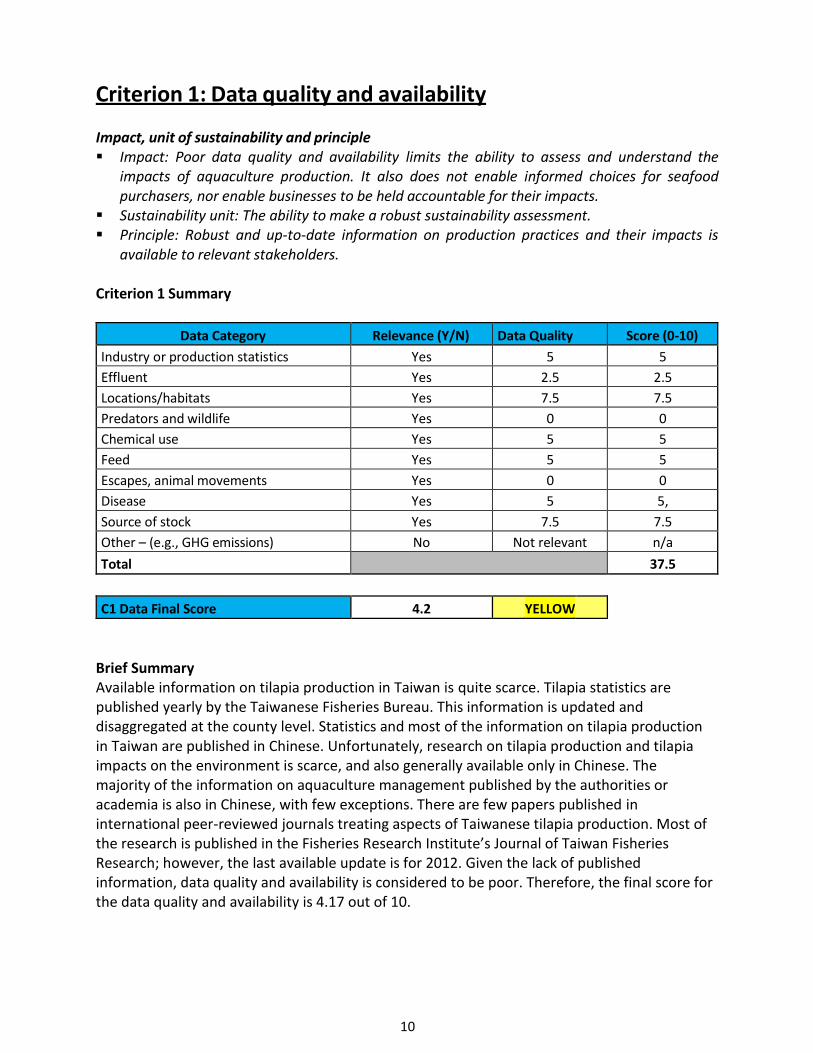
Data Category Relevance (Y/N) Data Quality Score (0-10)
Industry or production statistics Yes 5 5
Effluent Yes 2.5 2.5
Locations/habitats Yes 7.5 7.5
Predators and wildlife Yes 0 0
Chemical use Yes 5 5
Feed Yes 5 5
Escapes, animal movements Yes 0 0
Disease Yes 5 5,
Source of stock Yes 7.5 7.5
Other – (e.g., GHG emissions) No Not relevant n/a
Total 37.5
C1 Data Final Score 4.2 YELLOW
Brief Summary Available information on tilapia production in Taiwan is quite scarce. Tilapia statistics are published yearly by the Taiwanese Fisheries Bureau. This information is updated and disaggregated at the county level. Statistics and most of the information on tilapia production in Taiwan are published in Chinese. Unfortunately, research on tilapia production and tilapia impacts on the environment is scarce, and also generally available only in Chinese. The majority of the information on aquaculture management published by the authorities or academia is also in Chinese, with few exceptions. There are few papers published in international peer-reviewed journals treating aspects of Taiwanese tilapia production. Most of the research is published in the Fisheries Research Institute’s Journal of Taiwan Fisheries Research; however, the last available update is for 2012. Given the lack of published information, data quality and availability is considered to be poor. Therefore, the final score for the data quality and availability is 4.17 out of 10.
11
Justification of Ranking Industry or production statistics. The majority of the data for production of tilapia comes from the Taiwan Fisheries Yearbook. An annual report is published, with the most recent one available for 2012 giving information about the total production for the year and the breakdown of production for each region in the country. The lack of recent updates determines the Data score to be 5 out of 10.
Effluent. There is limited information available regarding the management of effluents in Taiwanese tilapia production and no information about waste discharge per ton of tilapia produced, which necessitated the use of the Risk-Based assessment method. Feed-related data were mostly specific to Taiwanese tilapia, though somewhat dated, and there is poor availability of information regarding regulatory and management structure and efficacy. Overall, the Data score for this criterion is 2.5 out of 10.
Locations/habitats. The impact of tilapia production on the habitats in Taiwan is clearly described in a number of peer-reviewed articles. Furthermore, the legislation regarding habitat conservation is available in a number of government-released laws and articles as well as international law websites. But there is limited information regarding the enforcement of the law. This lack of data determines a final Data score of 7.5 out of 10.
Chemical Use. Data regarding chemical use management is mainly available in Taiwanese legislation. A number of laws govern the use of chemicals and the consequences if the regulations are not followed; however, there is no reliable information on the enforcement of these laws and statistics supporting the published results. International government bodies and newspapers release statements regarding chemical use in Taiwanese tilapia upon testing the imported fish for banned substances. This results in a final Data score of 5 out of 10.
Feed. Few data specific to feeds used in Taiwanese tilapia production are available. Range and mean eFCR values, as well as fishmeal and fish oil inclusion rates specific to the industry, were available from academic literature that is now becoming dated, though the total protein content of feed was informed by more recent literature. There is information regarding the use of byproducts, but data about other protein sources or ingredients are not apparent. Thus, the Data score is 5 out of 10.
Escapes, animal movement. No data are available regarding the escapes of farmed tilapia in Taiwan. Indirect evidence from peer-reviewed articles suggest that such escapes are a possibility, but there is no statistical backing of these claims. Therefore, the Data score for escapes and animal movement is 0 out of 10.
Disease. There are data available in peer-reviewed papers regarding diseases occurring in Taiwanese tilapia operations. But these data are already dated, and no recent publications could support these findings. The Taiwanese government has promulgated laws that address disease prevention and management, but once again, there are no data to support the enforcement of the laws. The Data score for this criterion of 5 out of 10.
12
Source of stock. The Taiwanese government annually releases data about tilapia production in the country. As with the other criteria, the latest available update is dated 2012, therefore the Data score is 7.5 out of 10.
Predators and wildlife. Data available regarding the impact of tilapia farms on wildlife are quite limited. One wildlife conservation law is available on the website of the Taiwanese government and it addresses the potential impact of wildlife on aquaculture production. No data are available regarding loss of wildlife due to tilapia operations. This lack of information determines the Data score as 0 out of 10.
Conclusions and Final Score The majority of production data is available exclusively in Chinese. Information about the other criteria is quite scarce and usually cannot be verified from more than one source. The general lack of peer-reviewed articles and published statistics regarding tilapia operations in Taiwan determines a final score of 4.17 out of 10 for Criterion Data quality and availability.
13
Criterion 2: Effluents
Impact, unit of sustainability and principle Impact: Aquaculture species, production systems and management methods vary in the
amount of waste produced and discharged per unit of production. The combined discharge of farms, groups of farms or industries contributes to local and regional nutrient loads.
Sustainability unit: The carrying or assimilative capacity of the local and regional receiving waters beyond the farm or its allowable zone of effect.
Principle: Aquaculture operations minimize or avoid the production and discharge of wastes at the farm level in combination with an effective management or regulatory system to control the location, scale and cumulative impacts of the industry’s waste discharges beyond the immediate vicinity of the farm.
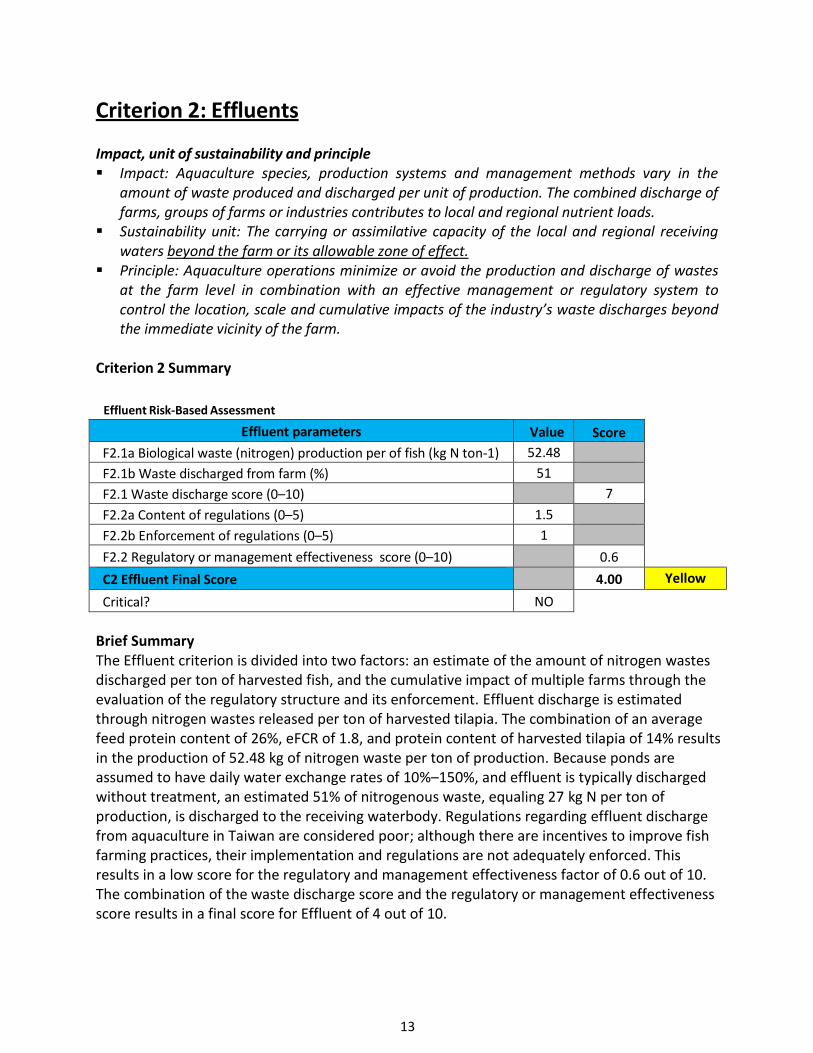
Criterion 2 Summary
Effluent Risk-Based Assessment
Effluent parameters Value Score
F2.1a Biological waste (nitrogen) production per of fish (kg N ton-1) 52.48
F2.1b Waste discharged from farm (%) 51
F2.1 Waste discharge score (0–10) 7
F2.2a Content of regulations (0–5) 1.5
F2.2b Enforcement of regulations (0–5) 1
F2.2 Regulatory or management effectiveness score (0–10) 0.6
C2 Effluent Final Score 4.00 Yellow
Critical? NO
Brief Summary The Effluent criterion is divided into two factors: an estimate of the amount of nitrogen wastes discharged per ton of harvested fish, and the cumulative impact of multiple farms through the evaluation of the regulatory structure and its enforcement. Effluent discharge is estimated through nitrogen wastes released per ton of harvested tilapia. The combination of an average feed protein content of 26%, eFCR of 1.8, and protein content of harvested tilapia of 14% results in the production of 52.48 kg of nitrogen waste per ton of production. Because ponds are assumed to have daily water exchange rates of 10%–150%, and effluent is typically discharged without treatment, an estimated 51% of nitrogenous waste, equaling 27 kg N per ton of production, is discharged to the receiving waterbody. Regulations regarding effluent discharge from aquaculture in Taiwan are considered poor; although there are incentives to improve fish farming practices, their implementation and regulations are not adequately enforced. This results in a low score for the regulatory and management effectiveness factor of 0.6 out of 10. The combination of the waste discharge score and the regulatory or management effectiveness score results in a final score for Effluent of 4 out of 10.
14
Justification of Ranking In instances of poor data availability on the impact of farm effluent, the Effluent criterion calculates the production and discharge of nitrogen, and the regulatory and management framework that govern it, to assess the effluent impact of aquaculture operations. For Taiwanese tilapia production, the Risk-Based Assessment Method is used.
Factor 2.1 Waste Discharged Per Ton of Tilapia In the case of Taiwanese tilapia, nitrogen inputs are calculated using the protein content of feed and the eFCR, and use the protein content of whole, harvested tilapia to estimate the amount of waste nitrogen generated per ton of tilapia production. During grow-out, the protein content of feed is approximately 26% (20%–30% reported by FAO, 26% by Lin and Wu 2014); although Tacon and Metian (2008) report that the FCR ranges from 1.5 to 2.0, their average value of 1.8 is used here. The protein content in whole, harvested tilapia is ≈14% (Boyd et al. 2007). The balance results in the production of 52.48 kg of wasted nitrogen per ton of harvested tilapia.
Without a robust estimation of the exchange rate of ponds used to produce tilapia in Taiwan, data from similar productions must be used. Exchange rates for semi-intensive and intensive tilapia ponds in other regions (i.e., outside Taiwan) have been shown to be anywhere from 10%–20% daily (FAO 2005) (Verdegem 2007) (Verdegem 2006) (Munro 2014) to as much as 150% daily (FAO 2005). A study conducted by Herbeck et al. (2013) in the Hainan Province of China analyzed the effluent discharge from shrimp and fish ponds; although their experimental design included all “fish” ponds, Hainan is a major tilapia-producing region and can therefore be considered at least moderately representative of tilapia production in neighboring Taiwan. Similar to the aforementioned studies, Herbeck et al. demonstrated that a fish pond discharges water many times during the course of a production cycle. Specifically, they found that 25% of pondwater was exchanged 20 times during a production cycle (i.e., 500% of pond volume over the course of a cycle) and the whole pond is drained at harvest. Because it is clear that Taiwanese tilapia ponds are likely exchanged throughout the growing cycle, and certainly more than just at harvest, a realistic worst-case scenario is that daily exchange is occurring. Therefore, along with indications that effluents are released without treatment (Herbeck et al. 2013), it is estimated that 51% of generated nitrogenous wastes are released to the environment. As a result, 26.76 kg of nitrogen wastes are released from tilapia ponds per ton of harvested fish, leading to a score of 7 out of 10 for Factor 2.1, waste discharge.
Factor 2.2 Management of Farm-Level and Cumulative Impacts The amount of nitrogen waste discharged per ton of production is combined with the effectiveness of the management or regulatory structure to control the total farm discharge and the cumulative impact of multiple farms affecting the same receiving waterbody.
The regulatory structure regarding effluent discharge from tilapia farms in Taiwan is considered poor. According to Liao and Chao (2007), “laws and regulations regarding aquaculture production are inappropriate.” The major law governing aquaculture in Taiwan, the Fisheries Act (COA 2008), does not require the treatment of wastewater from ponds. But in 2004, the Good Aquaculture Practices (GAP) certification was made available; among other
15
attributes, it requires that any effluent waters from fish farms are treated before being released. Although applying for this certification is voluntary, the fish farmers have incentive to have their products GAP certified, which allows them to access markets with strict food regulations (Chen and Qiu 2014). There are no available statistics indicating the percentage of the farms in Taiwan that are GAP certified, and one study suggests that there are few GAP-certified products on the market (Chen and Qiu 2014). Additionally, water quality standards for aquaculture farm effluents do not consider nitrogen or phosphorus concentrations among the monitored parameters (Lin et al. 2010). The lack of data on this topic and the lack of appropriate regulations (from the information available) to control the cumulative impact of multiple farm effluents on receiving waterbodies result in a score of 0.6 out of 10 for Factor 2.2, regulatory or management effectiveness.
Conclusions and Final Score Although the waste discharge score was 7 out of 10, suggesting that waste discharge from farms is not high, the management and regulations in Taiwan are considered poor quality and poorly enforced, resulting in a score of 0.6 out of 10 for management efficacy. Factors 2.1 and 2.2 combine to result in a final score for Effluent of 4 out of 10.
16
Criterion 3: Habitat
Impact, unit of sustainability and principle Impact: Aquaculture farms can be located in a wide variety of aquatic and terrestrial habitat
types and have greatly varying levels of impact to both pristine and previously modified habitats and to the critical “ecosystem services” they provide.
Sustainability unit: The ability to maintain the critical ecosystem services relevant to the habitat type.
Principle: Aquaculture operations are located at sites, scales and intensities that cumulatively maintain the functionality of ecologically valuable habitats.
Criterion 3 Summary
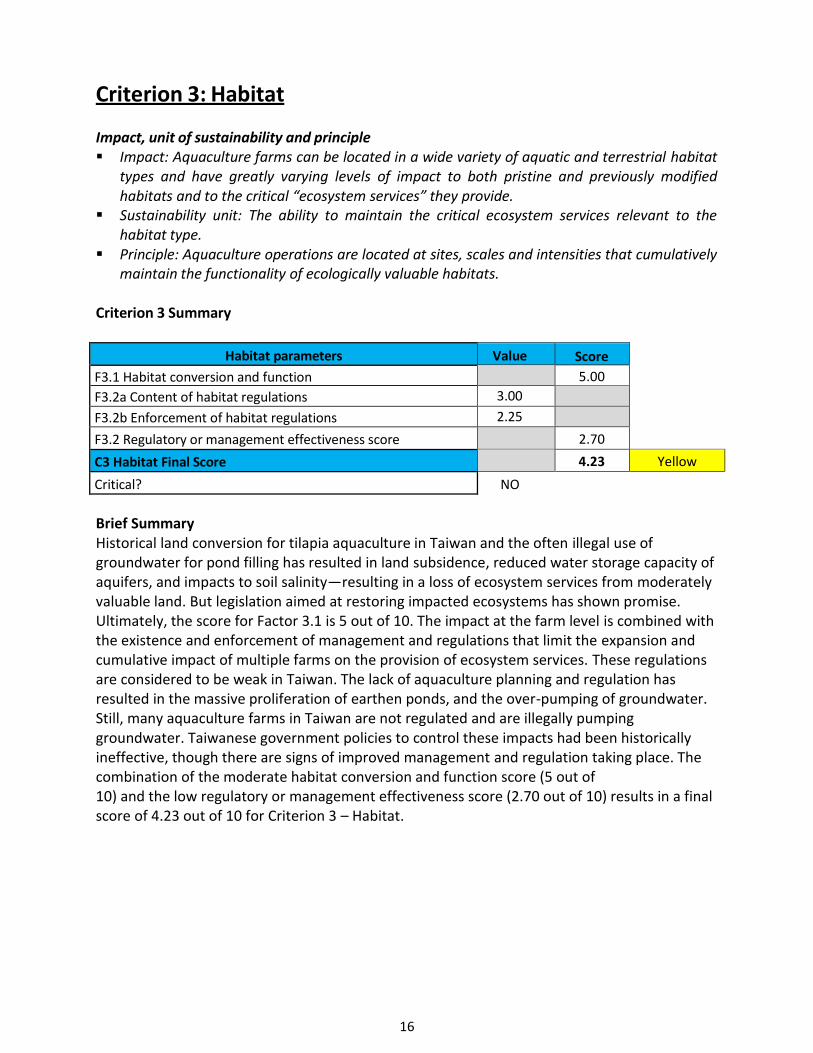
Habitat parameters Value Score
F3.1 Habitat conversion and function 5.00
F3.2a Content of habitat regulations 3.00
F3.2b Enforcement of habitat regulations 2.25
F3.2 Regulatory or management effectiveness score 2.70
C3 Habitat Final Score 4.23 Yellow
Critical? NO
Brief Summary Historical land conversion for tilapia aquaculture in Taiwan and the often illegal use of groundwater for pond filling has resulted in land subsidence, reduced water storage capacity of aquifers, and impacts to soil salinity—resulting in a loss of ecosystem services from moderately valuable land. But legislation aimed at restoring impacted ecosystems has shown promise. Ultimately, the score for Factor 3.1 is 5 out of 10. The impact at the farm level is combined with the existence and enforcement of management and regulations that limit the expansion and cumulative impact of multiple farms on the provision of ecosystem services. These regulations are considered to be weak in Taiwan. The lack of aquaculture planning and regulation has resulted in the massive proliferation of earthen ponds, and the over-pumping of groundwater. Still, many aquaculture farms in Taiwan are not regulated and are illegally pumping groundwater. Taiwanese government policies to control these impacts had been historically ineffective, though there are signs of improved management and regulation taking place. The combination of the moderate habitat conversion and function score (5 out of 10) and the low regulatory or management effectiveness score (2.70 out of 10) results in a final score of 4.23 out of 10 for Criterion 3 – Habitat.
17
Justification of Ranking Factor 3.1. Habitat conversion and function
Tilapia operations are primarily located in the south of the country. Most tilapia farms in Taiwan were established during the 1980s, replacing a wide range of habitat uses such as agricultural areas and coastal ecosystems. The impacts of land use change are considered to be historical (> 10 years) because total pond surface in Taiwan has been steadily decreasing during the last decade (Statistical Yearbook of the Republic of China 2011). Once established, aquaculture farms comprise earthen ponds (Lin et al. 2010). Because surface water is polluted and not suitable for use in aquaculture, most tilapia ponds (>95%) are filled with groundwater. This water is generally illegally pumped and has resulted in groundwater overdraft, which has led to the compression of aquifer layers. Beyond reducing the water storage capacity of the aquifers, groundwater overdraft has caused land subsidence, and increases in soil salinity in coastal zones due to saltwater intrusion (Ferng 2007). Subsided land area in Taiwan is estimated to be around 2,000 km2, representing 20% of the total plains area. Southwest coastal areas of Taiwan are the most affected by groundwater withdrawal, and these areas are now less resilient to flooding after heavy rainfalls.
In 1992, to mitigate the impact of groundwater overdraft, the Fisheries Agency implemented a long-term plan that was focused on research, development, and promotion of innovative aquaculture techniques, such as the use of outdoor tanks. In 1995, the Fisheries Agency and Water Resource Agency formulated the Land Subsidence Prevention and Reclamation Act. The Act stipulates that the Government is responsible for assisting fish farmers that are using ponds unsuitable for fish farming to establish a different function for these ponds (Ting et al. 2015). An additional initiative aimed to encourage farmers to shift their focus from freshwater to saltwater farming in order to decrease the use of underground fresh water. From 2000 to 2010, the area devoted to aquaculture in Taiwan decreased from 47,882 ha to 40,206 ha, and according to the Taiwan Fisheries Statistical Yearbook, the area of inland fish farms and groundwater use decreased 23.8% and 64%, respectively, between 2001 and 2011, showing improvements regarding habitat impacts.
The reduction in the provision of ecosystem services in moderate-value habitats, such as hazard regulation (e.g., storm protection, flooding control), and water provision due to historical land use change result in a score of 5 out of 10 for Factor 3.1, Habitat conversion and function.
Factor 3.2. Habitat and farm siting management effectiveness (appropriate to the scale of the industry) Individual farms contribute incrementally to effects at the landscape level. The cumulative impact of aquaculture on habitat function is assessed through the existence and enforcement of regulations that control and/or limit aquaculture industry size and concentration. In Taiwan, the central government has dictated most policies related to aquaculture development; the Council of Agriculture administers, plans, and manages the aquaculture activity (Liao 2007). But these policies have been oriented toward the expansion of aquaculture, and environmental impact mitigation has been overlooked in the formulation of laws and regulation (Liao 2007). The proliferation of aquaculture ponds in Taiwan was not regulated, indicating a lack of a siting
18
planning and poor regulatory structure (Liao and Chao 2007). Although the Fisheries Act (2008) establishes that local competent authorities should prescribe rules for registration and management of inland aquaculture, most aquaculture farms currently are not regulated. According to Ferng (2007), “the most important challenge for the aquaculture industry in Taiwan is the formulation and strict implementation of appropriate laws and regulations.” Taiwanese government policies have been ineffective in controlling the cumulative impacts of aquaculture on the environment, such as those caused by water overdraft (Ferng 2007).
To improve the management practices and promote nature conservation, the government has implemented registration system for all inland farms. For a farm to be registered, it needs to conform to two basic requirements: water usage and location. The building of fish farms is allowed only in areas where culture activities are allowed (Chen and Qiu 2014). Taiwanese legislation requires “detailed plans, description of the environmental status quo within the possible impact area covered by the development activities; a description of potential environmental impacts caused by the development activities; a description of environmental damage mitigation measures and alternatives to the proposed development plan; the budget for implementing environmental damage mitigation measures; and a summary of measures designed to prevent and mitigate adverse impacts to the environment caused by development activities” (Faolex 2016). Water usage for fish farming is allowed by obtaining a permit issued by water resource authorities. Any farm that is not registered and does not comply with both rules is labeled illegal, or a “black” farm. Legal farms benefit from different forms of subsidies, such as money for development or low interest loans, while “black” farms are not eligible to apply for certifications and subsidies (Chen and Qiu 2014). Furthermore, the government has launched a project, encouraging fish farms to apply and receive ASC certification, which recognizes the management of the farm and conservation of the surrounding natural habitat, among other attributes (Chen and Qiu 2014). In July 2013, the Wetland Conservation Law was passed, making Taiwan the second Asian country with a wetland conservation protection law. Any farm existing on the territory of a wetland will be audited and must comply with the new legislation (Su 2014). Although much effort is being put into improving farming practices, many farms still remain unregistered, suggesting that nature conservation policies are not being effectively enforced. The lack of an appropriate regulatory structure determines a regulatory or management effectiveness score of 2.70 out of 10 for Factor 3.2, Habitat and farm siting management effectiveness.
Conclusions and Final Score Historical land conversion for aquaculture and the often illegal use of groundwater for pond filling has resulted in a loss of ecosystem services from moderately valuable land. But legislation aimed at restoring impacted ecosystems has shown promise. Ultimately, the score for Factor 3.1 is 5 out of 10. Additionally, there is evidence that many farms operate unregistered, highlighting the poor regulatory structure and enforcement efficacy in Taiwan; the score for Factor 3.2 is 2.7 out of 10. The final score for Criterion 3 – Habitat is 4.23 out of 10.
21
Criterion 4: Evidence or Risk of Chemical Use
Impact, unit of sustainability and principle Impact: Improper use of chemical treatments impacts non-target organisms and leads to
production losses and human health concerns due to the development of chemical-resistant organisms.
Sustainability unit: Non-target organisms in the local or regional environment, presence of pathogens or parasites resistant to important treatments.
Principle: Aquaculture operations by design, management or regulation avoid the discharge of chemicals toxic to aquatic life, and/or effectively control the frequency, risk of environmental impact and risk to human health of their use.
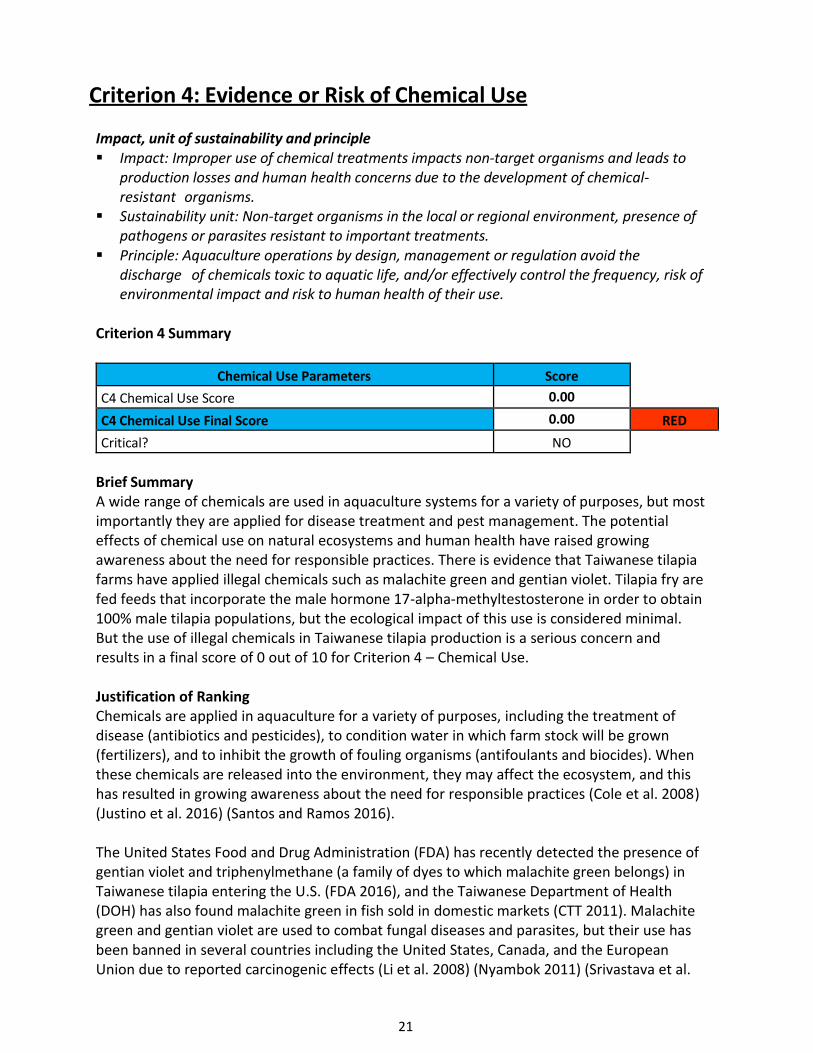
Criterion 4 Summary
Chemical Use Parameters Score
C4 Chemical Use Score 0.00
C4 Chemical Use Final Score 0.00 RED
Critical? NO
Brief Summary A wide range of chemicals are used in aquaculture systems for a variety of purposes, but most importantly they are applied for disease treatment and pest management. The potential effects of chemical use on natural ecosystems and human health have raised growing awareness about the need for responsible practices. There is evidence that Taiwanese tilapia farms have applied illegal chemicals such as malachite green and gentian violet. Tilapia fry are fed feeds that incorporate the male hormone 17-alpha-methyltestosterone in order to obtain 100% male tilapia populations, but the ecological impact of this use is considered minimal. But the use of illegal chemicals in Taiwanese tilapia production is a serious concern and results in a final score of 0 out of 10 for Criterion 4 – Chemical Use.
Justification of Ranking Chemicals are applied in aquaculture for a variety of purposes, including the treatment of disease (antibiotics and pesticides), to condition water in which farm stock will be grown (fertilizers), and to inhibit the growth of fouling organisms (antifoulants and biocides). When these chemicals are released into the environment, they may affect the ecosystem, and this has resulted in growing awareness about the need for responsible practices (Cole et al. 2008) (Justino et al. 2016) (Santos and Ramos 2016).
The United States Food and Drug Administration (FDA) has recently detected the presence of gentian violet and triphenylmethane (a family of dyes to which malachite green belongs) in Taiwanese tilapia entering the U.S. (FDA 2016), and the Taiwanese Department of Health (DOH) has also found malachite green in fish sold in domestic markets (CTT 2011). Malachite green and gentian violet are used to combat fungal diseases and parasites, but their use has been banned in several countries including the United States, Canada, and the European Union due to reported carcinogenic effects (Li et al. 2008) (Nyambok 2011) (Srivastava et al.
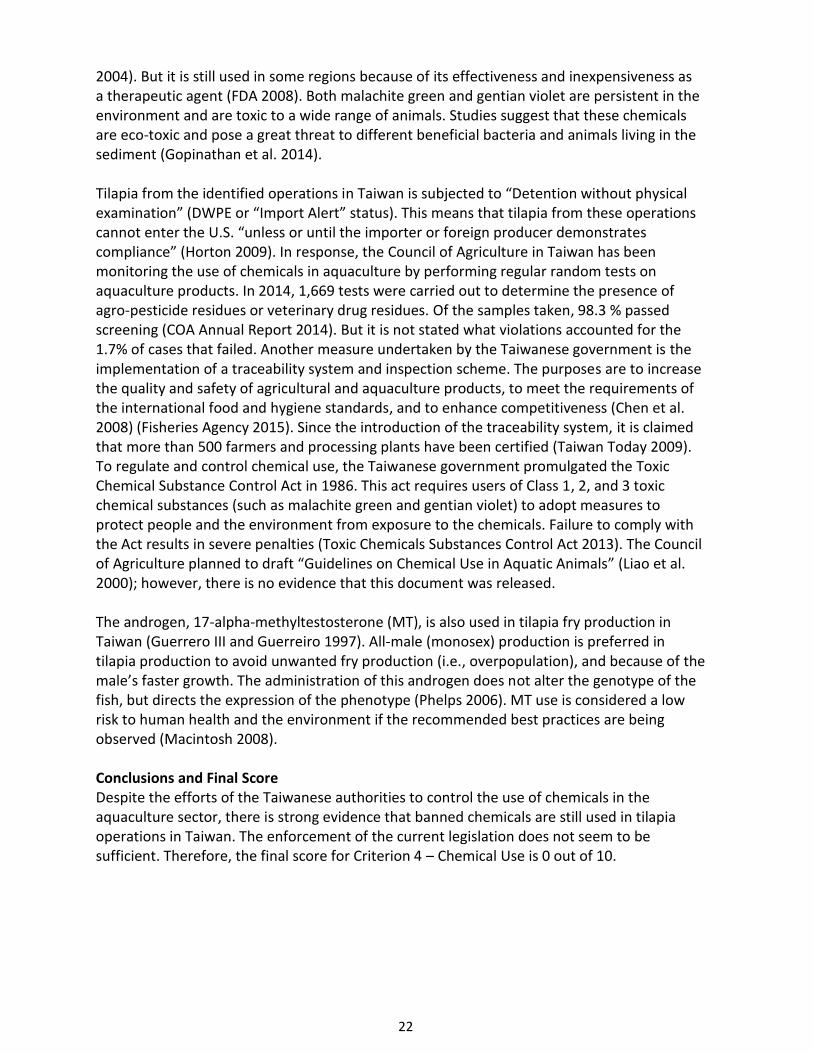
22
2004). But it is still used in some regions because of its effectiveness and inexpensiveness as a therapeutic agent (FDA 2008). Both malachite green and gentian violet are persistent in the environment and are toxic to a wide range of animals. Studies suggest that these chemicals are eco-toxic and pose a great threat to different beneficial bacteria and animals living in the sediment (Gopinathan et al. 2014).
Tilapia from the identified operations in Taiwan is subjected to “Detention without physical examination” (DWPE or “Import Alert” status). This means that tilapia from these operations cannot enter the U.S. “unless or until the importer or foreign producer demonstrates compliance” (Horton 2009). In response, the Council of Agriculture in Taiwan has been monitoring the use of chemicals in aquaculture by performing regular random tests on aquaculture products. In 2014, 1,669 tests were carried out to determine the presence of agro-pesticide residues or veterinary drug residues. Of the samples taken, 98.3 % passed screening (COA Annual Report 2014). But it is not stated what violations accounted for the 1.7% of cases that failed. Another measure undertaken by the Taiwanese government is the implementation of a traceability system and inspection scheme. The purposes are to increase the quality and safety of agricultural and aquaculture products, to meet the requirements of the international food and hygiene standards, and to enhance competitiveness (Chen et al. 2008) (Fisheries Agency 2015). Since the introduction of the traceability system, it is claimed that more than 500 farmers and processing plants have been certified (Taiwan Today 2009). To regulate and control chemical use, the Taiwanese government promulgated the Toxic Chemical Substance Control Act in 1986. This act requires users of Class 1, 2, and 3 toxic chemical substances (such as malachite green and gentian violet) to adopt measures to protect people and the environment from exposure to the chemicals. Failure to comply with the Act results in severe penalties (Toxic Chemicals Substances Control Act 2013). The Council of Agriculture planned to draft “Guidelines on Chemical Use in Aquatic Animals” (Liao et al. 2000); however, there is no evidence that this document was released.
The androgen, 17-alpha-methyltestosterone (MT), is also used in tilapia fry production in Taiwan (Guerrero III and Guerreiro 1997). All-male (monosex) production is preferred in tilapia production to avoid unwanted fry production (i.e., overpopulation), and because of the male’s faster growth. The administration of this androgen does not alter the genotype of the fish, but directs the expression of the phenotype (Phelps 2006). MT use is considered a low risk to human health and the environment if the recommended best practices are being observed (Macintosh 2008).
Conclusions and Final Score Despite the efforts of the Taiwanese authorities to control the use of chemicals in the aquaculture sector, there is strong evidence that banned chemicals are still used in tilapia operations in Taiwan. The enforcement of the current legislation does not seem to be sufficient. Therefore, the final score for Criterion 4 – Chemical Use is 0 out of 10.
23
Criterion 5: Feed
Impact, unit of sustainability and principle Impact: Feed consumption, feed type, ingredients used and the net nutritional gains or losses
vary dramatically between farmed species and production systems. Producing feeds and their ingredients has complex global ecological impacts, and their efficiency of conversion can result in net food gains, or dramatic net losses of nutrients. Feed use is considered to be one of the defining factors of aquaculture sustainability.
Sustainability unit: The amount and sustainability of wild fish caught for feeding to farmed fish, the global impacts of harvesting or cultivating feed ingredients, and the net nutritional gains or losses from the farming operation.
Principle: Aquaculture operations source only sustainable feed ingredients, convert them efficiently and responsibly, and minimize and utilize the non-edible portion of farmed fish.
Criterion 5 Summary
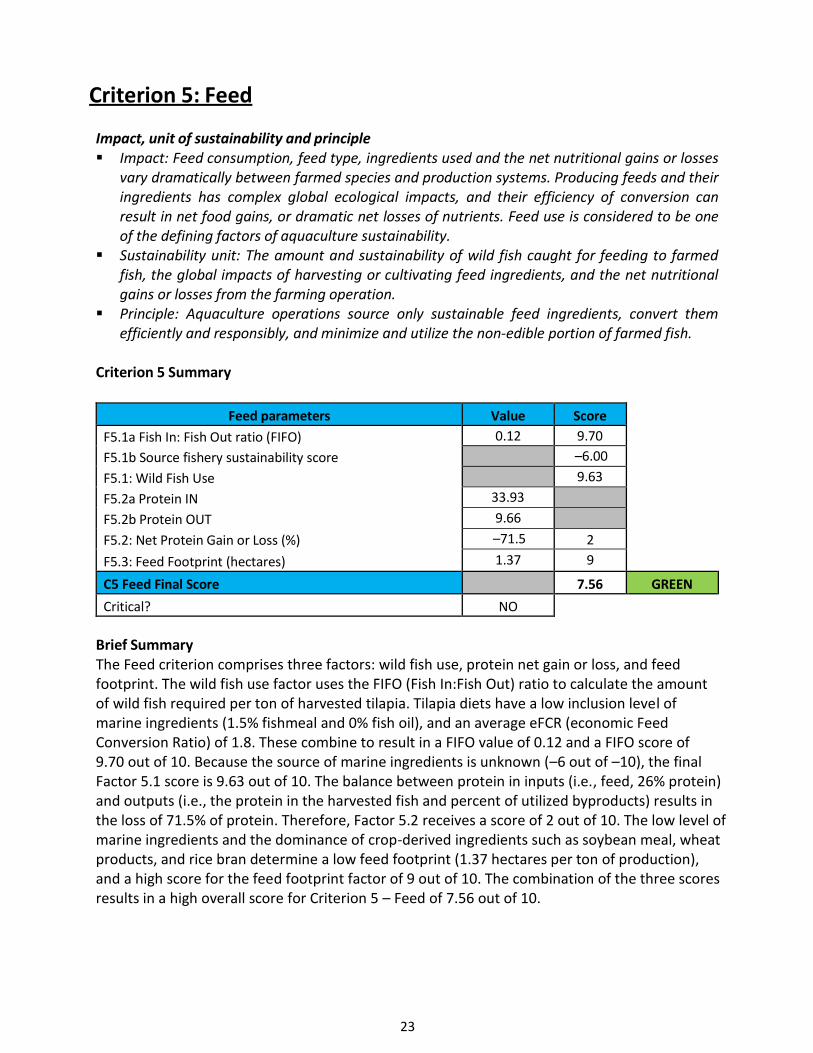
Feed parameters Value Score
F5.1a Fish In: Fish Out ratio (FIFO) 0.12 9.70
F5.1b Source fishery sustainability score –6.00
F5.1: Wild Fish Use 9.63
F5.2a Protein IN 33.93
F5.2b Protein OUT 9.66
F5.2: Net Protein Gain or Loss (%) –71.5 2
F5.3: Feed Footprint (hectares) 1.37 9
C5 Feed Final Score 7.56 GREEN
Critical? NO
Brief Summary The Feed criterion comprises three factors: wild fish use, protein net gain or loss, and feed footprint. The wild fish use factor uses the FIFO (Fish In:Fish Out) ratio to calculate the amount of wild fish required per ton of harvested tilapia. Tilapia diets have a low inclusion level of marine ingredients (1.5% fishmeal and 0% fish oil), and an average eFCR (economic Feed Conversion Ratio) of 1.8. These combine to result in a FIFO value of 0.12 and a FIFO score of 9.70 out of 10. Because the source of marine ingredients is unknown (–6 out of –10), the final Factor 5.1 score is 9.63 out of 10. The balance between protein in inputs (i.e., feed, 26% protein) and outputs (i.e., the protein in the harvested fish and percent of utilized byproducts) results in the loss of 71.5% of protein. Therefore, Factor 5.2 receives a score of 2 out of 10. The low level of marine ingredients and the dominance of crop-derived ingredients such as soybean meal, wheat products, and rice bran determine a low feed footprint (1.37 hectares per ton of production), and a high score for the feed footprint factor of 9 out of 10. The combination of the three scores results in a high overall score for Criterion 5 – Feed of 7.56 out of 10.
24
Justification of Ranking
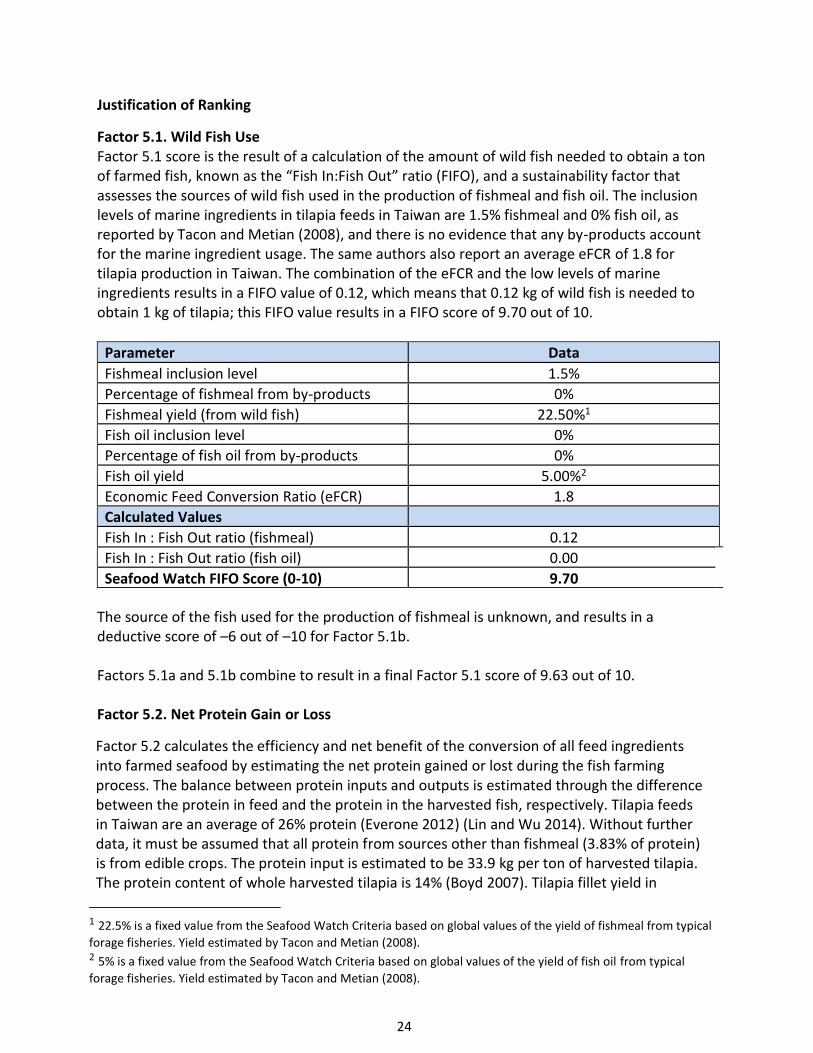
Factor 5.1. Wild Fish Use Factor 5.1 score is the result of a calculation of the amount of wild fish needed to obtain a ton of farmed fish, known as the “Fish In:Fish Out” ratio (FIFO), and a sustainability factor that assesses the sources of wild fish used in the production of fishmeal and fish oil. The inclusion levels of marine ingredients in tilapia feeds in Taiwan are 1.5% fishmeal and 0% fish oil, as reported by Tacon and Metian (2008), and there is no evidence that any by-products account for the marine ingredient usage. The same authors also report an average eFCR of 1.8 for tilapia production in Taiwan. The combination of the eFCR and the low levels of marine ingredients results in a FIFO value of 0.12, which means that 0.12 kg of wild fish is needed to obtain 1 kg of tilapia; this FIFO value results in a FIFO score of 9.70 out of 10.
Parameter Data
Fishmeal inclusion level 1.5%
Percentage of fishmeal from by-products 0%
Fishmeal yield (from wild fish) 22.50%1
Fish oil inclusion level 0%
Percentage of fish oil from by-products 0%
Fish oil yield 5.00%2
Economic Feed Conversion Ratio (eFCR) 1.8
Calculated Values
Fish In : Fish Out ratio (fishmeal) 0.12
Fish In : Fish Out ratio (fish oil) 0.00
Seafood Watch FIFO Score (0-10) 9.70
The source of the fish used for the production of fishmeal is unknown, and results in a deductive score of –6 out of –10 for Factor 5.1b.
Factors 5.1a and 5.1b combine to result in a final Factor 5.1 score of 9.63 out of 10.
Factor 5.2. Net Protein Gain or Loss
Factor 5.2 calculates the efficiency and net benefit of the conversion of all feed ingredients into farmed seafood by estimating the net protein gained or lost during the fish farming process. The balance between protein inputs and outputs is estimated through the difference between the protein in feed and the protein in the harvested fish, respectively. Tilapia feeds in Taiwan are an average of 26% protein (Everone 2012) (Lin and Wu 2014). Without further data, it must be assumed that all protein from sources other than fishmeal (3.83% of protein) is from edible crops. The protein input is estimated to be 33.9 kg per ton of harvested tilapia. The protein content of whole harvested tilapia is 14% (Boyd 2007). Tilapia fillet yield in
1 22.5% is a fixed value from the Seafood Watch Criteria based on global values of the yield of fishmeal from typical
forage fisheries. Yield estimated by Tacon and Metian (2008). 2 5% is a fixed value from the Seafood Watch Criteria based on global values of the yield of fish oil from typical
forage fisheries. Yield estimated by Tacon and Metian (2008).
25
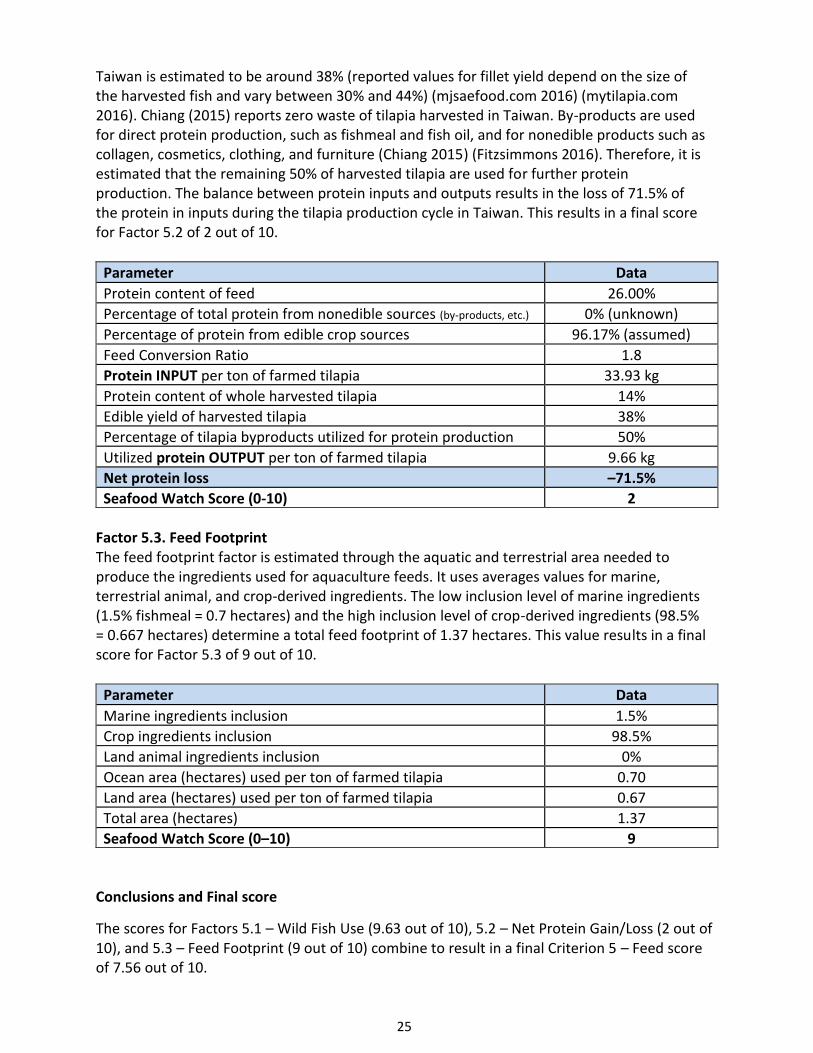
Taiwan is estimated to be around 38% (reported values for fillet yield depend on the size of the harvested fish and vary between 30% and 44%) (mjsaefood.com 2016) (mytilapia.com 2016). Chiang (2015) reports zero waste of tilapia harvested in Taiwan. By-products are used for direct protein production, such as fishmeal and fish oil, and for nonedible products such as collagen, cosmetics, clothing, and furniture (Chiang 2015) (Fitzsimmons 2016). Therefore, it is estimated that the remaining 50% of harvested tilapia are used for further protein production. The balance between protein inputs and outputs results in the loss of 71.5% of the protein in inputs during the tilapia production cycle in Taiwan. This results in a final score for Factor 5.2 of 2 out of 10.
Parameter Data
Protein content of feed 26.00%
Percentage of total protein from nonedible sources (by-products, etc.) 0% (unknown)
Percentage of protein from edible crop sources 96.17% (assumed)
Feed Conversion Ratio 1.8
Protein INPUT per ton of farmed tilapia 33.93 kg
Protein content of whole harvested tilapia 14%
Edible yield of harvested tilapia 38%
Percentage of tilapia byproducts utilized for protein production 50%
Utilized protein OUTPUT per ton of farmed tilapia 9.66 kg
Net protein loss –71.5%
Seafood Watch Score (0-10) 2
Factor 5.3. Feed Footprint The feed footprint factor is estimated through the aquatic and terrestrial area needed to produce the ingredients used for aquaculture feeds. It uses averages values for marine, terrestrial animal, and crop-derived ingredients. The low inclusion level of marine ingredients (1.5% fishmeal = 0.7 hectares) and the high inclusion level of crop-derived ingredients (98.5% = 0.667 hectares) determine a total feed footprint of 1.37 hectares. This value results in a final score for Factor 5.3 of 9 out of 10.
Parameter Data
Marine ingredients inclusion 1.5%
Crop ingredients inclusion 98.5%
Land animal ingredients inclusion 0%
Ocean area (hectares) used per ton of farmed tilapia 0.70
Land area (hectares) used per ton of farmed tilapia 0.67
Total area (hectares) 1.37
Seafood Watch Score (0–10) 9
Conclusions and Final score
The scores for Factors 5.1 – Wild Fish Use (9.63 out of 10), 5.2 – Net Protein Gain/Loss (2 out of 10), and 5.3 – Feed Footprint (9 out of 10) combine to result in a final Criterion 5 – Feed score of 7.56 out of 10.
26
Criterion 6: Escapes
Impact, unit of sustainability and principle Impact: Competition, genetic loss, predation, habitat damage, spawning disruption, and other
impacts on wild fish and ecosystems resulting from the escape of native, non-native and/or genetically distinct fish or other unintended species from aquaculture operations.
Sustainability unit: Affected ecosystems and/or associated wild populations. Principle: Aquaculture operations pose no substantial risk of deleterious effects to wild
populations associated with the escape of farmed fish or other unintentionally introduced species.
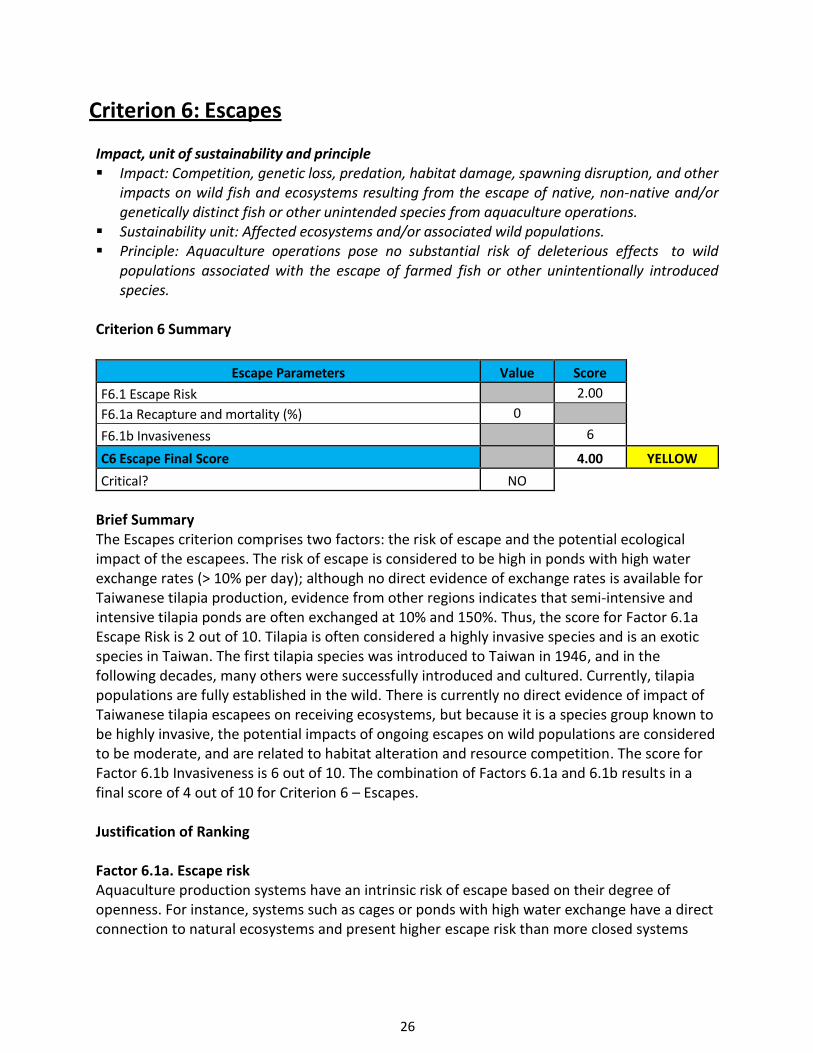
Criterion 6 Summary
Escape Parameters Value Score
F6.1 Escape Risk 2.00
F6.1a Recapture and mortality (%) 0
F6.1b Invasiveness 6
C6 Escape Final Score 4.00 YELLOW
Critical? NO
Brief Summary The Escapes criterion comprises two factors: the risk of escape and the potential ecological impact of the escapees. The risk of escape is considered to be high in ponds with high water exchange rates (> 10% per day); although no direct evidence of exchange rates is available for Taiwanese tilapia production, evidence from other regions indicates that semi-intensive and intensive tilapia ponds are often exchanged at 10% and 150%. Thus, the score for Factor 6.1a Escape Risk is 2 out of 10. Tilapia is often considered a highly invasive species and is an exotic species in Taiwan. The first tilapia species was introduced to Taiwan in 1946, and in the following decades, many others were successfully introduced and cultured. Currently, tilapia populations are fully established in the wild. There is currently no direct evidence of impact of Taiwanese tilapia escapees on receiving ecosystems, but because it is a species group known to be highly invasive, the potential impacts of ongoing escapes on wild populations are considered to be moderate, and are related to habitat alteration and resource competition. The score for Factor 6.1b Invasiveness is 6 out of 10. The combination of Factors 6.1a and 6.1b results in a final score of 4 out of 10 for Criterion 6 – Escapes.
Justification of Ranking Factor 6.1a. Escape risk Aquaculture production systems have an intrinsic risk of escape based on their degree of openness. For instance, systems such as cages or ponds with high water exchange have a direct connection to natural ecosystems and present higher escape risk than more closed systems
27
such as recirculating systems, where more robust barriers can be effectively installed and managed.
As discussed in Criterion 2 – Effluent, there is no direct evidence of the exchange rate of ponds used to farm tilapia in Taiwan. As a result, it must be assumed that pondwater is exchanged daily, because exchange rates for semi-intensive and intensive tilapia ponds in other regions have been shown to be anywhere from 10%–20% daily (FAO 2005) (Verdegem 2007) (Verdegem 2006) (Munro 2014) to as much as 150% daily (FAO 2005). These systems (i.e., ponds with > 10% daily exchange) present a moderate–high risk of escape. Further, as discussed in Criterion 3 – Habitat, there are a number of unregistered farms that do not comply with the existing nature conservation policies. Although the laws require nature conservation polices to be enforced, they do not specify fish escape management. Reviewing available literature did not result in finding evidence that Taiwanese legislation requires any precautionary actions for preventing and mitigating fish escape. Besides the fact that there are already tilapia populations established in the wild, which suggests that escapes do or did occur, no other information regarding fish escapes in Taiwanese tilapia farms could be found.
It was also discussed that farms located in the southwest of the country are less resilient to flooding because of excessive pumping of underground water and consequent land subsidence. Moreover, Taiwan is frequently hit by typhoons, which often result in floods. A flood presents an opportunity for a fish to escape the area of the farm, and if the environmental conditions allow it, to survive and establish in the receiving ecosystem. Between 1991 and 2015, 360 typhoons have affected Taiwan, with some causing severe floods (Central Weather Bureau 2016). These factors collectively lead to a moderate–high risk of escape and a Factor 6.1a score of 2 out of 10.
Factor 6.1b. Invasiveness Invasiveness is defined as “…the degree to which an organism is able to spread from site of primary introduction, to establish a viable population in the ecosystem, to negatively affect biodiversity on the individual, community, or ecosystem level and cause adverse socioeconomic consequence” (Panov et al. 2008). According to its definition, invasiveness considers the phases of the invasion process that follow the escape itself: establishment and ecological impacts.
Tilapia is not native to Taiwan, though tilapia populations are fully established in natural water bodies such as rivers and streams (Meng et al. 2009) (Sun and Tsai 2009). Several tilapia species have been brought to Taiwan since Mozambique tilapia (O. mossambicus) was first imported from Singapore in 1946 (Taiwan Panorama 2004). In 1966, O. nilotica was introduced from Japan, and in the following decade more species made their way to Taiwanese farms: O. mosambicus albino, O. aurea, O. hornorum, and O. rendalli (Yu et al. 2011).
Reports of the invasive potential of tilapia and their impact are polarized in existing literature. Some authors argue (e.g., Diana 2009) that tilapia is a highly invasive species group, and studies have indicated that the majority of tilapia species colonize easily in different
28
waterbodies around the world (Gu et al. 2015) (Pullin et al. 1997) (Deines et al. 2016). Furthermore, tilapia can affect habitats in different ways: competition with native species for food and habitat, consuming the eggs of native species to cause declining numbers of the population, and changing the production of the local ecosystem, resulting in eutrophication and poor water quality (Gu et al. 2015). Habitat destruction (Crutchfield 1995) and biotic and abiotic changes associated with eutrophication (Figueredo and Giani 2005) have been linked to the establishment of feral tilapia populations, and these likely affect the fish species that are endemic to those ecosystems. Broadly, Deines et al. (2016) cite the conclusion by Canonico et al. (2005) that expansion of tilapia aquaculture has caused population decreases in harvestable native species, which has led to a loss in recreational and cultural ecosystem services supported by those native species. Research has suggested that introduced tilapia have been key drivers in declines of native fish in the Philippines (Gindelberger 1981), India (Sugunan 1995) (Sugunan 2000), the United States (Black 1980) (Varela-Romero et al. 2000), Lake Nicaragua (McKaye et al. 1995), and Lake Victoria (Ogutu-Ohwayo 1990) (Mkumbo and Ligtvoet 1992) (Goudswaard et al. 2002).
In contrast, some researchers (e.g., (De Silva et al. 2005) (De Silva et al. 2006)) have suggested that there has been little evidence of impacts on biodiversity from commonly introduced exotic fish in Asia. A study in Southeast Asia suggests that the introduction of non-native tilapia accounts for an increase of the total biomass in the study area without displacing the native species or significantly affecting their biomass. But the authors suggest that the results of their study could have been different if the experiment had been conducted in a different geographic region (Arthur et al. 2010).
The history of full ecological establishment of tilapia in Taiwan results in a score of 2.5 out of 5 for Factor 6.1b Part B. Although there is no direct evidence of tilapia escapees impacting wild populations in Taiwan, evidence from other regions and results from experimental trials can be used within a precautionary approach. Tilapia presents many traits that favor its invasion, such as a broad environmental tolerance, resistance to disease and poor water quality, continuous reproduction, and rapid growth (Diana 2009) (FAO 2016). Tilapia establishment has been suggested to have the potentially positive effects of increases in species diversity and productivity (Senanan and Bart 2010), but the likely negative impacts of their escape are related to habitat alteration and resource competition (Canonico et al. 2005) (Martin et al. 2010). Therefore, the score for Factor 6.1b Part C is 3.5 out of 5. The final score for Factor 6.1b Invasiveness is 6 out of 10. Conclusions and Final Score The escape risk is considered to be high because of the likely high pond exchange rates, the lack of escape prevention and mitigation management, and exposure to floods of tilapia farms, resulting in a score of 2 out of 10 for Factor 6.1a Escape Risk. Feral populations of tilapia are already established in Taiwan and there is no evidence that they have affected ecological functionality. But tilapia’s biological traits suggest that it can be an invasive species, resulting in a score of 6 out of 10 for Factor 6.1b Invasiveness. The final score for Criterion 6 – Escapes is 4 out of 10.
29
Criterion 7: Disease; pathogen and parasite interactions
Impact, unit of sustainability and principle Impact: Amplification of local pathogens and parasites on fish farms and their
retransmission to local wild species that share the same water body. Sustainability unit: Wild populations susceptible to elevated levels of pathogens and
parasites. Principle: Aquaculture operations pose no substantial risk of deleterious effects to wild
populations through the amplification and retransmission of pathogens or parasites.
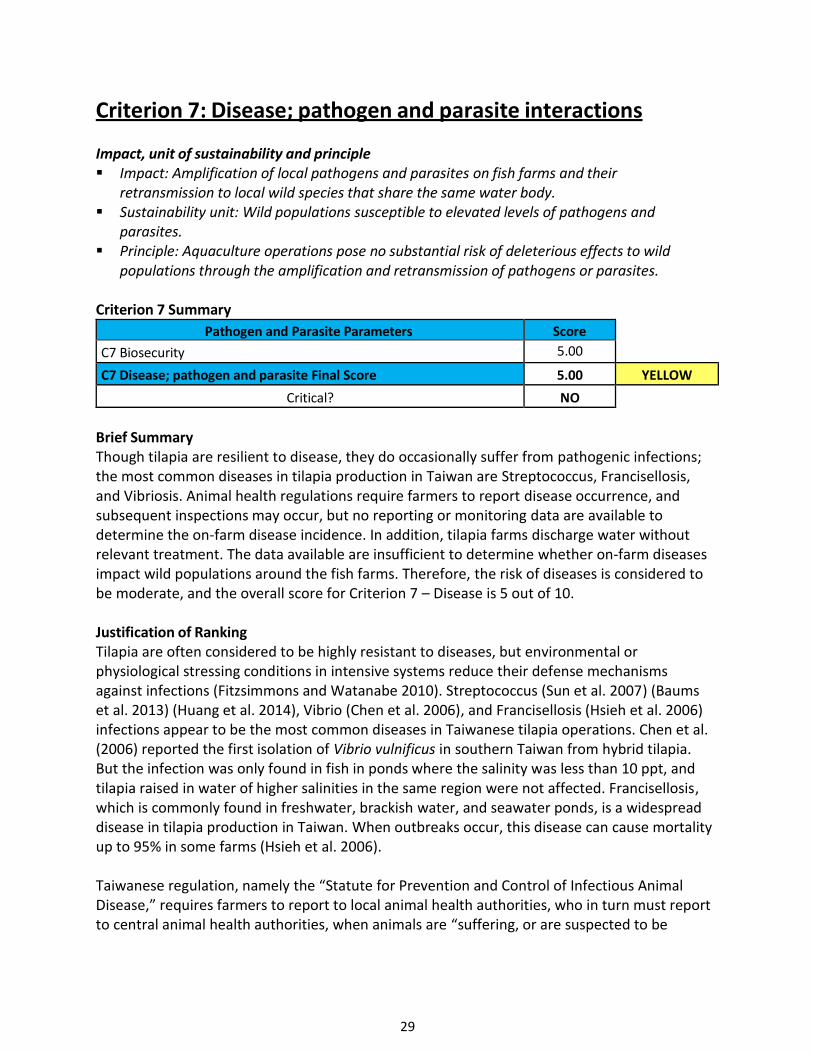
Criterion 7 Summary
Pathogen and Parasite Parameters Score
C7 Biosecurity 5.00
C7 Disease; pathogen and parasite Final Score 5.00 YELLOW
Critical? NO
Brief Summary Though tilapia are resilient to disease, they do occasionally suffer from pathogenic infections; the most common diseases in tilapia production in Taiwan are Streptococcus, Francisellosis, and Vibriosis. Animal health regulations require farmers to report disease occurrence, and subsequent inspections may occur, but no reporting or monitoring data are available to determine the on-farm disease incidence. In addition, tilapia farms discharge water without relevant treatment. The data available are insufficient to determine whether on-farm diseases impact wild populations around the fish farms. Therefore, the risk of diseases is considered to be moderate, and the overall score for Criterion 7 – Disease is 5 out of 10.
Justification of Ranking Tilapia are often considered to be highly resistant to diseases, but environmental or physiological stressing conditions in intensive systems reduce their defense mechanisms against infections (Fitzsimmons and Watanabe 2010). Streptococcus (Sun et al. 2007) (Baums et al. 2013) (Huang et al. 2014), Vibrio (Chen et al. 2006), and Francisellosis (Hsieh et al. 2006) infections appear to be the most common diseases in Taiwanese tilapia operations. Chen et al. (2006) reported the first isolation of Vibrio vulnificus in southern Taiwan from hybrid tilapia. But the infection was only found in fish in ponds where the salinity was less than 10 ppt, and tilapia raised in water of higher salinities in the same region were not affected. Francisellosis, which is commonly found in freshwater, brackish water, and seawater ponds, is a widespread disease in tilapia production in Taiwan. When outbreaks occur, this disease can cause mortality up to 95% in some farms (Hsieh et al. 2006).
Taiwanese regulation, namely the “Statute for Prevention and Control of Infectious Animal Disease,” requires farmers to report to local animal health authorities, who in turn must report to central animal health authorities, when animals are “suffering, or are suspected to be
31
suffering from infectious animal disease; or when their animals die of unknown causes.” After receiving such reports, local or central government officials may conduct inspections of the facility. Prevention and control of diseases include physical examination of animals by inspectors, immunizations, vaccinations, and other medical treatments. The Drugs Control Act binds the governmental officers to strictly control the drug use. Vaccine application is used when eradication of an infectious disease is required. Such procedures are carried out by veterinarians and government officials. Upon discovery of an infectious disease, the infected animals must be quarantined and inspections are performed in compliance with biosafety biosecurity protocols (Statute for Prevention and Control of Infectious Animal Diseases 2014). Veterinarian officials are obliged to instruct farmers about disinfection and quarantine procedures when “notifiable infectious animal diseases” occur (Veterinary Act 2015).
But no disease monitoring or reporting data or information are available to determine the incidence and/or severity of disease outbreaks on Taiwanese tilapia farms. Even though the legislation requires farmers to report the presence of sick animals, many farms operate unregistered and are therefore not likely to report disease incidents. The water discharge from such farms is under no regulation and the presence or absence of pathogens released from the farms cannot be assessed. Although there is no evidence of impacts on wild species outside of the farms, the disease risk is considered moderate–high.
Conclusions and Final Score The final score for Criterion 7 – Disease is 5 out of 10. The risk of disease outbreak and consequent release in the environment is considered moderate–high because the farms in Taiwan discharge water without relevant treatment, and a number of farms are considered to be operating without registration and are not in compliance with any monitoring or reporting requirements.
32
Criterion 8: Source of Stock
Impact, unit of sustainability and principle Impact: The removal of fish from wild populations for on-growing to harvest size in farms. Sustainability unit: Wild fish populations. Principle: Aquaculture operations use eggs, larvae, or juvenile fish produced from farm-
raised broodstocks thereby avoiding the need for wild capture. Criterion 8 Summary
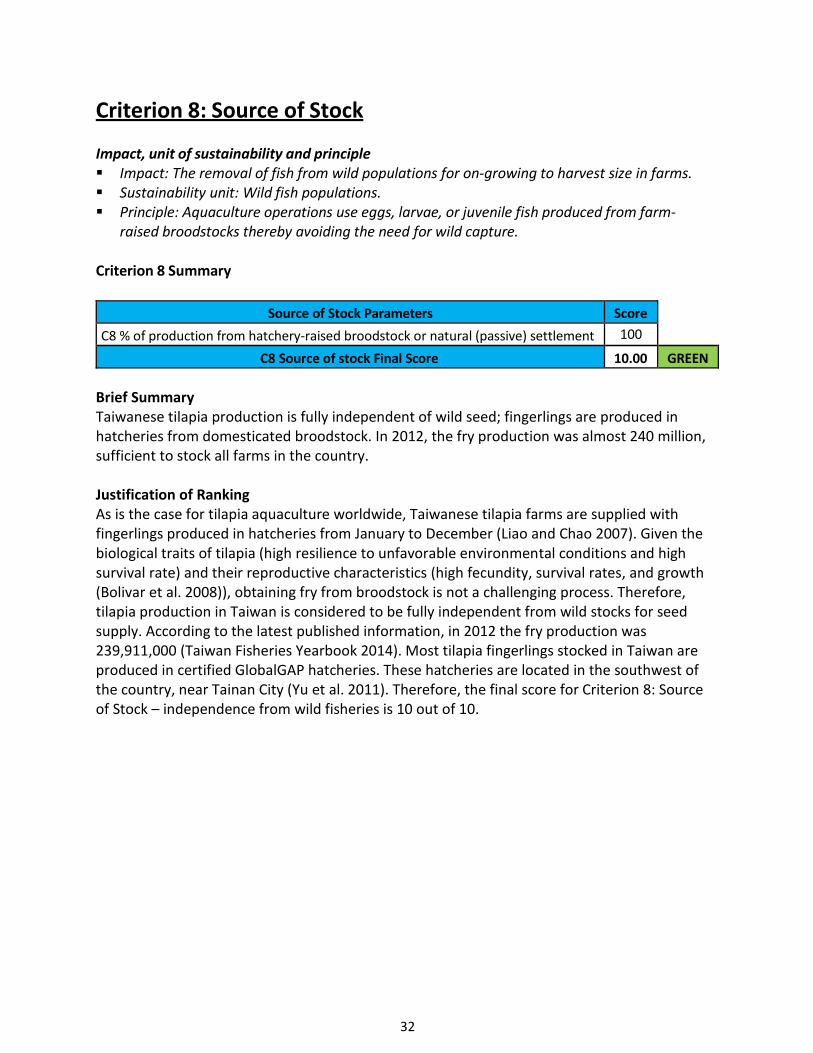
Source of Stock Parameters Score
C8 % of production from hatchery-raised broodstock or natural (passive) settlement 100
C8 Source of stock Final Score 10.00 GREEN
Brief Summary Taiwanese tilapia production is fully independent of wild seed; fingerlings are produced in hatcheries from domesticated broodstock. In 2012, the fry production was almost 240 million, sufficient to stock all farms in the country.
Justification of Ranking As is the case for tilapia aquaculture worldwide, Taiwanese tilapia farms are supplied with fingerlings produced in hatcheries from January to December (Liao and Chao 2007). Given the biological traits of tilapia (high resilience to unfavorable environmental conditions and high survival rate) and their reproductive characteristics (high fecundity, survival rates, and growth (Bolivar et al. 2008)), obtaining fry from broodstock is not a challenging process. Therefore, tilapia production in Taiwan is considered to be fully independent from wild stocks for seed supply. According to the latest published information, in 2012 the fry production was 239,911,000 (Taiwan Fisheries Yearbook 2014). Most tilapia fingerlings stocked in Taiwan are produced in certified GlobalGAP hatcheries. These hatcheries are located in the southwest of the country, near Tainan City (Yu et al. 2011). Therefore, the final score for Criterion 8: Source of Stock – independence from wild fisheries is 10 out of 10.
33
Criterion 9X: Wildlife and Predator Mortalities
A measure of the effects of deliberate or accidental mortality on the populations of affected species of predators or other wildlife. This is an “exceptional” criteria that may not apply in many circumstances. It generates a negative score that is deducted from the overall final score. A score of zero means there is no impact.
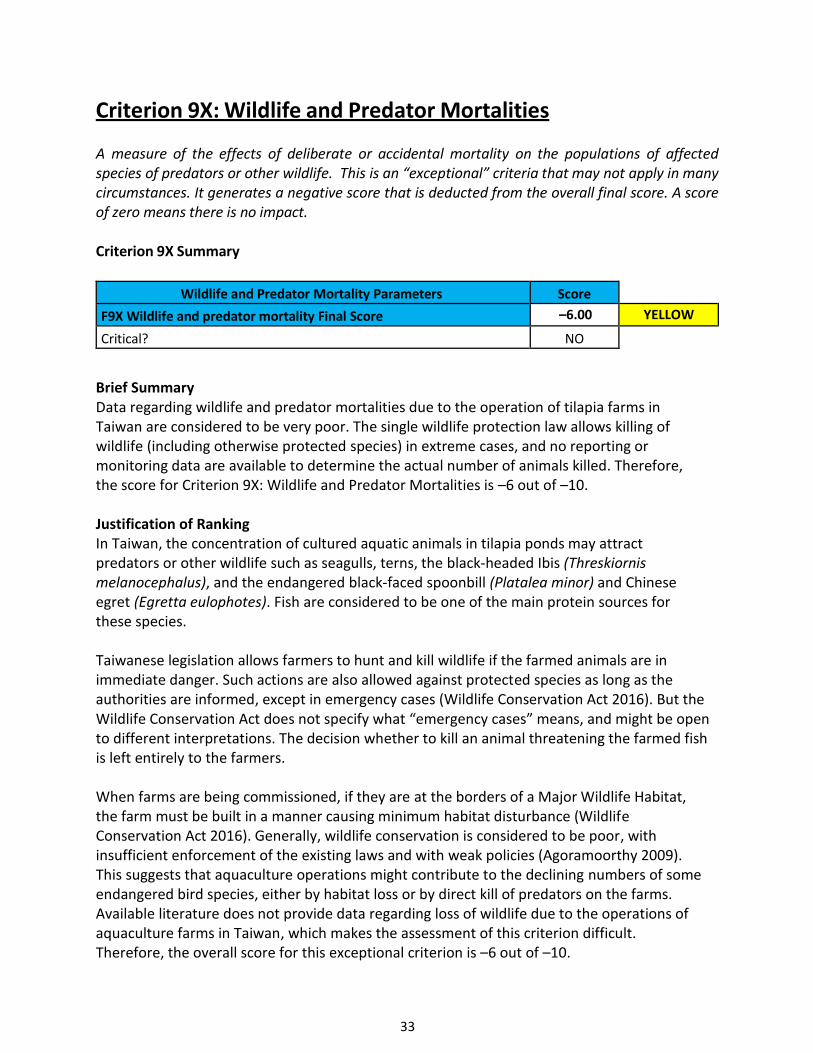
Criterion 9X Summary
Wildlife and Predator Mortality Parameters Score
F9X Wildlife and predator mortality Final Score –6.00 YELLOW
Critical? NO
Brief Summary Data regarding wildlife and predator mortalities due to the operation of tilapia farms in Taiwan are considered to be very poor. The single wildlife protection law allows killing of wildlife (including otherwise protected species) in extreme cases, and no reporting or monitoring data are available to determine the actual number of animals killed. Therefore, the score for Criterion 9X: Wildlife and Predator Mortalities is –6 out of –10.
Justification of Ranking In Taiwan, the concentration of cultured aquatic animals in tilapia ponds may attract predators or other wildlife such as seagulls, terns, the black-headed Ibis (Threskiornis melanocephalus), and the endangered black-faced spoonbill (Platalea minor) and Chinese egret (Egretta eulophotes). Fish are considered to be one of the main protein sources for these species. Taiwanese legislation allows farmers to hunt and kill wildlife if the farmed animals are in immediate danger. Such actions are also allowed against protected species as long as the authorities are informed, except in emergency cases (Wildlife Conservation Act 2016). But the Wildlife Conservation Act does not specify what “emergency cases” means, and might be open to different interpretations. The decision whether to kill an animal threatening the farmed fish is left entirely to the farmers.
When farms are being commissioned, if they are at the borders of a Major Wildlife Habitat, the farm must be built in a manner causing minimum habitat disturbance (Wildlife Conservation Act 2016). Generally, wildlife conservation is considered to be poor, with insufficient enforcement of the existing laws and with weak policies (Agoramoorthy 2009). This suggests that aquaculture operations might contribute to the declining numbers of some endangered bird species, either by habitat loss or by direct kill of predators on the farms. Available literature does not provide data regarding loss of wildlife due to the operations of aquaculture farms in Taiwan, which makes the assessment of this criterion difficult. Therefore, the overall score for this exceptional criterion is –6 out of –10.
34
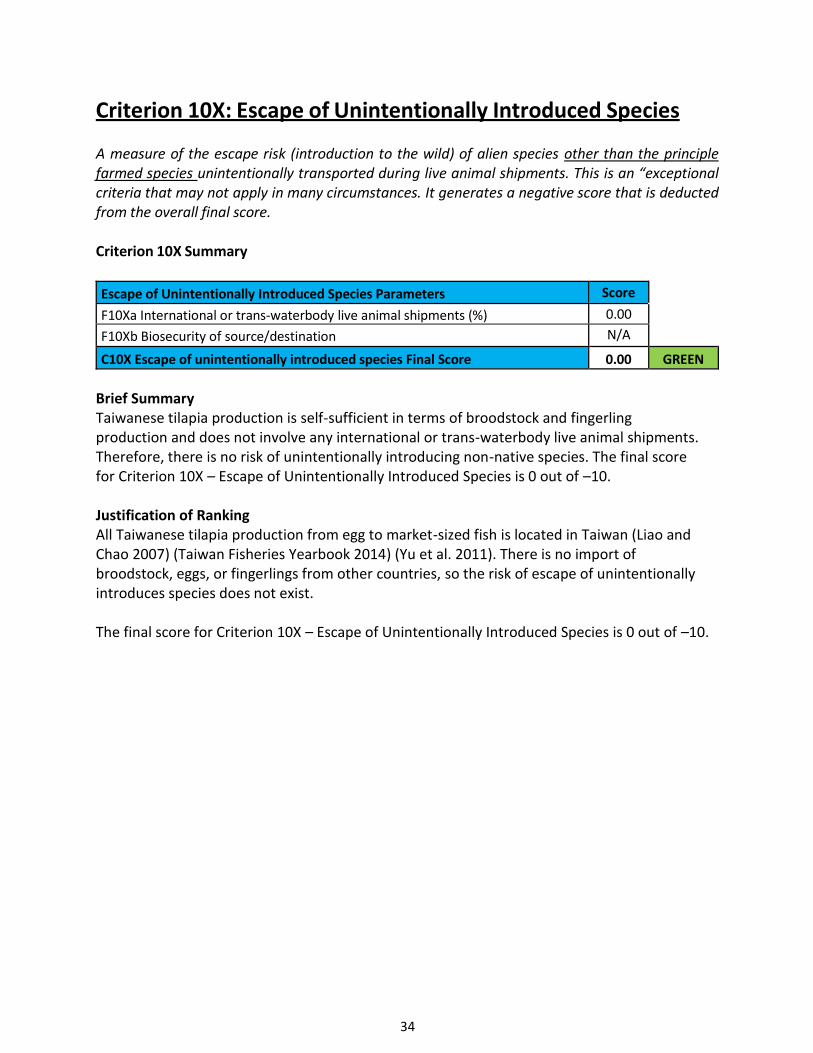
Criterion 10X: Escape of Unintentionally Introduced Species
A measure of the escape risk (introduction to the wild) of alien species other than the principle farmed species unintentionally transported during live animal shipments. This is an “exceptional criteria that may not apply in many circumstances. It generates a negative score that is deducted from the overall final score.
Criterion 10X Summary
Escape of Unintentionally Introduced Species Parameters Score
F10Xa International or trans-waterbody live animal shipments (%) 0.00
F10Xb Biosecurity of source/destination N/A
C10X Escape of unintentionally introduced species Final Score 0.00 GREEN
Brief Summary Taiwanese tilapia production is self-sufficient in terms of broodstock and fingerling production and does not involve any international or trans-waterbody live animal shipments. Therefore, there is no risk of unintentionally introducing non-native species. The final score for Criterion 10X – Escape of Unintentionally Introduced Species is 0 out of –10.
Justification of Ranking All Taiwanese tilapia production from egg to market-sized fish is located in Taiwan (Liao and Chao 2007) (Taiwan Fisheries Yearbook 2014) (Yu et al. 2011). There is no import of broodstock, eggs, or fingerlings from other countries, so the risk of escape of unintentionally introduces species does not exist.
The final score for Criterion 10X – Escape of Unintentionally Introduced Species is 0 out of –10.
35
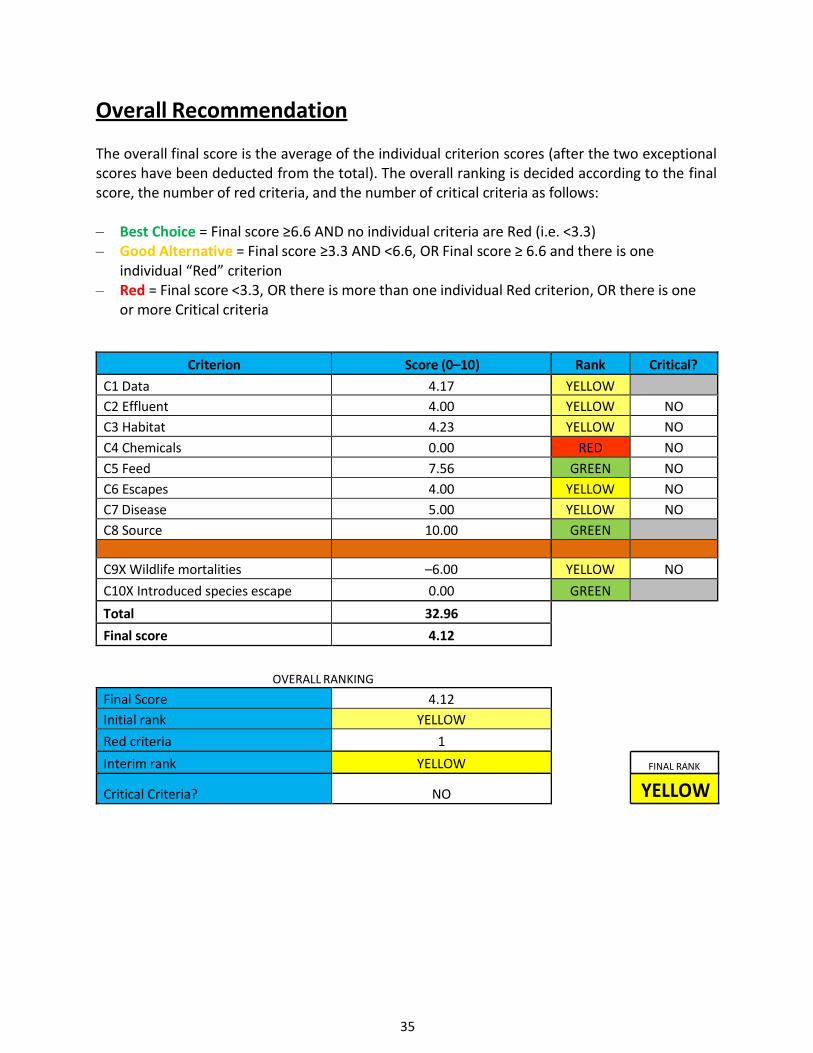
Overall Recommendation
The overall final score is the average of the individual criterion scores (after the two exceptional scores have been deducted from the total). The overall ranking is decided according to the final score, the number of red criteria, and the number of critical criteria as follows:
– Best Choice = Final score ≥6.6 AND no individual criteria are Red (i.e. <3.3) – Good Alternative = Final score ≥3.3 AND <6.6, OR Final score ≥ 6.6 and there is one
individual “Red” criterion – Red = Final score <3.3, OR there is more than one individual Red criterion, OR there is one
or more Critical criteria
Criterion Score (0–10) Rank Critical?
C1 Data 4.17 YELLOW
C2 Effluent 4.00 YELLOW NO
C3 Habitat 4.23 YELLOW NO
C4 Chemicals 0.00 RED NO
C5 Feed 7.56 GREEN NO
C6 Escapes 4.00 YELLOW NO
C7 Disease 5.00 YELLOW NO
C8 Source 10.00 GREEN
C9X Wildlife mortalities –6.00 YELLOW NO
C10X Introduced species escape 0.00 GREEN
Total 32.96
Final score 4.12
OVERALL RANKING
FINAL RANK
YELLOW
Final Score 4.12
Initial rank YELLOW
Red criteria 1
Interim rank YELLOW
Critical Criteria? NO
36
Acknowledgements
Scientific review does not constitute an endorsement of the Seafood Watch® program, or its seafood recommendations, on the part of the reviewing scientists. Seafood Watch® is solely responsible for the conclusions reached in this report.
Seafood Watch would like to thank the consulting researcher and author of this report, Ivan Tankovski, as well as Kevin Fitzsimmons of the University of Arizona, Jenny Budiati of PT Suri Tani Pemuka, and Corey Peet of Postelsia for graciously reviewing this report for scientific accuracy.
37
References
Agoramoorthy, G. (2009) Enforcement challenges of Taiwan’s Wildlife Conservation and Animal Protection Laws. Journal of International Wildlife Law & Policy, 12: 190-209.
Arthur, R.I., Lorenzen, K., Homekingkeo, P., Sidavong, K., Sengvilaikham, B. and Garaway, C.J. (2010). Assessing impacts of introduced aquaculture species on native fish communities: Nile tilapia and major carp in SE Asia freshwater. Aquaculture, 299: 81-88.
Baums, G.G., Hermeyer, K., Leimbach, S., Adamek, M., Czerny, G.-P., Horstgen-Schwark, G., Valentin-Weigand, P., Baumgartner, W. and Steinhagen, D. (2013). Establishment of a Model of Streptococcus iniae Meningoencephalitis in Nile Tilapia (Oreochromis niloticus). Journal of Comparative Pathology 149(1): 94-102.
Black, G. F. (1980). Status of the Desert Pupfish, Cyprinodon Macularius (baird and Girard), in California (p. 42). State of California, the Resources Agency, Department of Fish and Game.
Bolivar, R.B., Bolivar, H.L., Sayco, R.M.V., Jimenez, E.B.T., Argueza, R.L.B., Dadag, L.B., Taduan, A.G. and Borski, R.J. (2008). Growth evaluation, sex conversion rate and percent of survival of Nile tilapia (Orechromis niloticus L.) fingerlings in earthen ponds. 8th International symposium on tilapia in aquaculture 2008.
Boyd, C.E. and Tucker, C.S. (1998) Pond Aquaculture Water Quality Management. Springer Science & Business Media.
Boyd, C.E., Tuckers, C., McNevin, A., Bostick, K. and Clay, J. (2007). Indicators of resource use efficiency and environmental performance in fish and crustacean aquaculture. Reviews in Fisheries Science, 15: 327-360.
Canonico, G.C., A. Arthington, J.K. McCrary and M.L. Thieme (2005) The effects of introduced tilapias on native biodiversity. Aquatic conservation: marine and freshwater ecosystems 15: 463– 483.
Central Weather Bureau (2016). Accessed July 2016. http://www.cwb.gov.tw/V7e/knowledge/encyclopedia/ty014.htm
Chen, C.-L. and Qiu G.-H. (2014) The long and bumpy journey: Taiwan’s aquaculture development and management. Marine Policy 48 (2014), 152-161.
Chen, C.-Y., Chao, C.-B. and Bowser, P. R. (2006) Infection of Tilapia Oreochromis sp. by Vibrio vulnificus in Freshwater and Low-salinity Environments. Journal of the World Aquaculture Society 37(1): 82-88.
38
Chen, S.-C., Nan F.-H. and Chuang, C.-T. (2008). The harmonization of food safety and traceability in farmed fish production – an example of Taiwan. IIFET 2008 Vietnam proceedings.
Chiang, F.-S. (2015). Reflections and Current Processes: Whole Fish Utilization in the Tilapia Industry in Chinese Taipei. APEC Seminar on Strengthening Public-Private Partnership to Reduce Food Losses in the Supply Chain of Fishery and Livestock, Sept. 27, 2015.
Chiang, F.-S. (2004). Taiwan Tilapia Production Zone Exclusive for Exporting. In: R.B. Bolivar, G.C. Mair, and K. Fitzsimmons (Eds.) Proceedings of the 6th International Symposium on Tilapia in Aquaculture Philippine International Convention Center Roxas Boulevard, Manila, Philippines, September 12-16, 2004.
Cole, D.W., Cole, R., Gaydos, S.J., Gray, J., Hyland, G., Jacques, M.L., Powell-Dunford, N., Sawhney, C. and Au, W.W. (2008). Aquaculture: Environmental, toxicological, and health issues. International Journal of Hygiene and Environmental Health 212 (4): 369-377.
CTT (2011) Taiwan Sampling Inspection on Aquatic Showed Malachite Green in 40% fish. Consumers Techniques Technology. Accessed March 2016. http://www.cttlab.com/en/news_show.php?serial=252
Council of Agriculture 2014. Annual report: Ensuring Food security and Food safety. Accessed June 2016. http://eng.coa.gov.tw/content_view.php?catid=2504063&hot_new=2504046
Council of Agriculture (2008) Fisheries Act. Accessed May 2016. http://www.coa.gov.tw/view.php?catid=8985&print=1
Crutchfield, J. U. J. Establishment and expansion of redbelly tilapia and blue tilapia in a power plant cooling reservoir (1995). Am. Fish. Soc. Symp., 15: 452–461.
CTT (2011) Taiwan Sampling Inspection on Aquatic Showed Malachite Green in 40% fish. Consumers Techniques Technology. Accessed March 2016. http://www.cttlab.com/en/news_show.php?serial=252
De Silva, S.S. (2009). Tilapias are Alien to Asia: But are they Friend or Foe? Online presentation. Accessed November 2016. http://www.spc.int/
Deines, A. M., Wittmann, M. E., Deines, J. M., & Lodge, D. M. (2016). Tradeoffs among Ecosystem Services Associated with Global Tilapia Introductions. Reviews in Fisheries Science & Aquaculture, 24(2): 178-191.
39
Diana, J.S. (2009) Aquaculture Production and Biodiversity Conservation. Bioscience 59 (1): 27- 38.
Everone (2012) Taiwan Tilapia Feed. Accessed May 2016. http://everone-hu.ezcity.com.tw/homeweb_en/catalog_detail.php?infoscatid=6&ifid=10
FDA (2008) Enhanced Aquaculture and Seafood Inspection - Report to Congress. Food and Drug Administration Amendments Act of 2007, Public Law 110-85. http://www.fda.gov/Food/FoodSafety/Product- SpecificInformation/Seafood/SeafoodRegulatoryProgram/ucm150954.htm
FDA (2016) Detention Without Physical Examination Of Aquaculture Seafood Products Due To Unapproved Drugs. Accessed June 2016. http://www.accessdata.fda.gov/cms_ia/importalert_27.html
Ferng, J-J. (2007) Biophysical assessments in evaluating industrial development: An experience from Taiwan freshwater aquaculture. Ecological Economics 63 (2-3): 427-434.
FAO legal office (2016). Accessed May 2016. faolex.fao.org/docs/texts/tw40372.doc
FAO Fisheries and Aquaculture department (2016). Accessed May 2016. http://www.fao.org/fishery/culturedspecies/Oreochromis_niloticus/en
FAO (2005) Cultured Aquatic Species Information Programme. Oreochromis niloticus. Cultured Aquatic Species Information Programme. Text by Rakocy, J. E. In: FAO Fisheries and Aquaculture Department [online]. Rome. Updated 18 February 2005.
Figueredo, C. C., and Giani, A. Ecological interactions between Nile tilapia (Oreochromis niloticus, L.) and the phytoplanktonic community of the Furnas Reservoir (Brazil) (2005). Freshwater Biol., 50(8): 1391–1403.
Fitzsimmons, K. (2006) Prospect and potential for global production: Chapter 2. In: C. Lim and C.D. Webster (Eds.) Tilapia: Biology, Culture and Nutrition. Food Product Press, New York, pp. 51- 72.
Fitzsimmons, K. and Watanabe, W.O. (2010) Tilapia (Family: Cichlidae). In: N.R. Le Francois, M. Jobling, C. Carter and P.U. Blier (Eds.) Finfish Aquaculture Diversification. CABI, Wallingford, UK, pp. 374-396.
Fitzsimmons, K. (2015). Tilapia global supply and demand. Online presentation. New Orleans, 2015. Accessed June 2016. http://slideplayer.com/slide/4898256/
40
Fitzsimmons, K. (2016). Supply and demand in global tilapia markets 2015. Presentation: World Aquaculture Society Annual Meeting 2016. Las Vegas, USA. February 2016. https://www.was.org/documents/MeetingPresentations/AQ2016/AQ2016_0005.pdf
Gindelberger, B. Why Sinarapan almost Disappered from Lake Buhi (1981). Naga, 4: 3–5.
GIO (2011) The Republic of China Yearbook 2011. Accessed March 2016. http://www.gio.gov.tw/taiwan-website/5-gp/yearbook/docs/ch10.pdf
Globefish (2011) Tilapia Global Market Report. Accessed August 2011. http://www.globefish.org/tilapia-february-2011.html
Gopinathan, R., Kanhere, J. and Banerjee, J. (2014). Effect of malachite green toxicity on non target soil organisms. Chemosphere 120: 637-644.
Goudswaard, P. C., F. Witte, and E. F. B. Katunzi. The tilapiine fish stock of Lake Victoria before and after the Nile perch upsurge (2002). J. Fish Biol., 60: 838–856.
Grabacki, S.T. (2011) Environmental Limitations and General Impact on Properties of the Catch. In: E.G. Daczkowska-Kozon and B. Sun-pan (Eds.) Environmental Effects on Seafood Availability and Qualities. CRC Press, Boca Raton, pp. 39-56.
Gu, D.E., Ma, G. M., Zhu, Y. J., Xu, M., Luo, D., Li, Y. Y., Wei, H., Mu, X. D., Luo, J. R. and Hu, Y. C. (2015). The impacts of invasive Nile tilapia (Oreochromis niloticus) on the fisheries in the main rivers of Guangdong Province, China. Biochemical Systematics and Ecology 59 (2015): 1-7.
Guerrero III, R. D., Guerreiro, L.A. (1997). Effects of Androstenedione and methyltestosterone on Oreochromis niloticus fry treated for sex reversal in outdoor net enclosure. In: INTERNATIONAL SYMPOSIUM ON TILAPIA IN AQUACULTURE, 4., 1997, Orlando, Florida. Proceedings... Orlando, 1997. v. 12: 772-777.
Herbeck, L.S., Unger, D., Wu, Y. and Jennerjahn, T.C. (2013). Effluent, nutrient and organic matter export from shrimp and fish ponds causing eutrophication in coastal and back-reef waters of NE Hainan, tropical China. Continental Shelf Research 57: 92-104.
Horton, L. (2009) US FDA Authority over Imports. RAJ Pharma (May): 293-294. Hsieh, C.Y., Tung, M.C., Tu, C., Chang, C.D. and Tsai, S.S. (2006) Enzootics of visceral granulomas associated with Francisella-like organism infection in tilapia (Oreochromis spp.). Aquaculture 254: 129–138.
Huang, T.-M., Hsu, C.-C. and Chen M.-M. (2014) Antimicrobial susceptibility of fish Streptococcaceae and drug resistance determinants of erythromycin- and tetracycline-resistant Lactococcus isolated in Taiwan. Taiwan Veterinary Journal, 40(3): 131-138.
41
Justino, C.I.L., Duarte, K.R., Freitas, A.C., Panteleitchouk, T.S.L., Duarte, A.C. and Rocha-Santos, T.A.P. (2016) Contaminants in aquaculture: Overview of analytical techniques for their determination. Trends in Analytical Chemistry 80: 293-310.
Lan, C-C., Yu, H-S. and Ko, Y-C. (2011) Chronic arsenic exposure and its adverse health effects in Taiwan: A paradigm for management of a global environmental problem. Kaohsiung Journal of Medical Sciences 27: 411-416.
Li, Y., Yang, T., Qi, X., Qiao, Y. and Deng, A. (2008) Development of a group selective molecularly imprinted polymers based solid phase extraction of malachite green from fish water and fish feed samples. Analytica Chimica Acta 624(2): 317–325.
Liao, D.S. (2007) Public Policies for Sustainable Development of Shrimp Aquaculture in Taiwan. In: P. Leung, C-S. Lee and P.J. O’Bryen (Eds.) Species & System Selection: For Sustainable Aquaculture, Blackwell Publishing, pp. 243-253.
Liao, I.C. and Chao, N.-H. (2007) Taiwanese Aquaculture at the Crossroads. In: P. Leung, C-S. Lee and J. O’Bryen (Eds.) Species & System Selection: For Sustainable Aquaculture. Blackwell, pp. 161- 178.
Liao, I. C., Guo, J.J. and Su, M.-S. (2000) The use of chemicals in aquaculture in Taiwan, Province of China. Use of Chemicals in Aquaculture in Asia: Proceedings of the Meeting on the Use of Chemicals in Aquaculture in Asia 20-22 May 1996, Tigbauan, Iloilo, Philippines pp. 193-205.
Lin, Y.-F., Jing, S.-R., Lee D.-Y., Chang, Y.-F. and Sui, H.-Y. (2010) Constructed Wetlands for Water Pollution Management of Aquaculture Farms Conducting Earthen Pond Culture. Water Environmental Research 82: 759-768.
Lin, Y-H. and Wu, A.M-H. (2014) Protein sparing in Tilapia through the supplementation of a digestive/metabolic enhancer. Aquafeed: Advances in processing and formulation: Vol. 6(3): 20- 26.
Martin, C.W., Valentine, M.M. and Valentine, J.F. (2010) Competitive Interactions between Invasive Nile Tilapia and Native Fish: The Potential for Altered Trophic Exchange and Modification of Food Webs. Plos one online journal. Accessed March 2016. http://journals.plos.org/plosone/article?id=10.1371/journal.pone.0014395
Macintosh, J. (2008). Risks Associated with Using Methyl Testosterone in Tilapia Farming. Accessed March 2016. http://cmsdevelopment.sustainablefish.org.s3.amazonaws.com/2013/02/28/SFP%20MT%20pa per-b3d73fec.pdf
42
McKaye, K. R., Ryan, J. D., Stauffer, J. Jay R., Perez, L. J. L., Vega, G. I., and van den Berghe, E. P. African Tilapia in Lake Nicaragua (1995). Bioscience, 45(6): 406–411.
Meng, P.-J., Lin, J. and Liu, L.-L. (2009) Aquatic organotin pollution in Taiwan-- Implications of organotins in marine environment and their prohibition. Journal of Environmental Management 90(1): S8-S15.
Mjseafood.com. (2016). Accessed June 2016. http://mjseafood.com.
Mkumbo, O. C., and Ligtvoet, W. Changes in the diet of Nile perch, lates niloticus (L), in the Mwanza Gulf, Lake Victoria (1992). Hydrobiologia, 232: 79–83.
Munro, L.I. (2014). Development and application of dynamic models for environmental management of aquaculture in South East Asia. PhD Dissertation. University of Stirling, Institute of Aquaculture. March 2014.
Mytilapia.com. (2016). Accessed June 2016. http://mytilapia.com.
National Fisheries Institute (2011) Top 10 consumed seafood. Accessed June 2016. http://www.aboutseafood.com/about/about-seafood/top-10-consumed-seafoods
Norman-López, A. and Bjørndal, T. (2009) Is tilapia the same product worldwide or are markets segmented? Aquaculture Economics & Management 13(2). DOI:10.1080/13657300902885360.
Nyambok, E.O. (2011) Chemical Contaminants in Chinese Aquaculture Imports, U.S. Import Security, and Exposure Assessment amongst Vulnerable Sub-Populations. PhD dissertation, Kansas State University, Manhattan, Kansas.
Ogutu-Ohwayo, R. (1990). The decline of the native fishes of lakes Victoria and Kyoga (East Africa) and the impact of introduced species, especially the Nile perch, Lates niloticus, and the Nile tilapia, Oreochromis niloticus. Environmental biology of fishes, 27(2): 81-96.
Panov, V.E., B. Alexandrov, K. Arbaciauskas, R. Binimelis, F. Lucy, R.S.E.W. Leuven, S. Nehring, M. Paunovic, V. Semenchenko and M.O. Son (2008) Assessing the Risks of Aquatic Species Invasions via European Inland Waterways: From Concepts to Environmental Indicators. Integrated Environmental Assessment and Management 5 (1): 110–126.
Phelps, R.P. (2006) Hormone Manipulation of Sex. In: C. Lim and C.D. Webster (Eds.) Tilapia- Biology, Culture, and Nutrition. Food Product Press, New York, pp. 211-252.
Pullin, R. S. V., Palomares, M. L., Casal, C. V., Dey, M. M., and Pauly, D. Environmental impacts of tilapias (1997). In Proceedings from the Fourth International Symposium on Tilapia in
43
Aquaculture, Coronado Springs Resort, Walt Disney World. Orlando, Florida: International Center for Living Aquatic Resources management (ICLARM), pp. 553–570.
Santos, L. and Ramos, F. (2016) Analytical strategies for the detection and quantification of antibiotic residues in aquaculture fisheries: A review. Trends in Food Science and Technology 52: 16-30.
Senanan, W. and Bart, A.N. (2010). The Potential Risks from Farm Escaped Tilapias. Accessed April 2016. http://media.sustainablefish.org/Tilapia_escapes_WP.pdf
Sonnenholzer, S. (2008) Effluent impact assessment: water quality monitoring vs nutrient budget. WWF Shrimp Aquaculture Dialogue, Guayaquil, Ecuador. Accessed May 2016. http://www.worldwildlife.org/what/globalmarkets/aquaculture/WWFBinaryitem10352.pdf
Srivastava, S., Sinha, R. and Roya, D. (2004) Toxicological effects of malachite green. Aquatic Toxicology 66(3): 319–329.
Statue for prevention and Control of Infectious Animal Diseases (2014). Accessed August 2016. http://law.coa.gov.tw/GLRSnewsout/EngLawContent.aspx?Type=E&id=169
Su, Y.Y. (2014) The legal structure of Taiwan’s Wetland Conservation Act. Sustainability 6: 9418- 9427.
Sugunan, V. V Reservoir fisheries of India (1995). FAO Fisheries Technical Paper 345: 423.
Sugunan, V. V Ecology and fishery management of reservoirs in India (2000). Hydrobiologia, 430: 121–147.
Sun, S.S., Yan, J.-C., Yeh C.-Y., Lee, S.-Y. and Lu, J.-J.(2007) Invasive infection with Streptococcus iniae in Taiwan. Journal of Medical Microbiology 56: 1246–1249.
Sun, S.S. and Tsai, P.L. (2009) Intersex Tilapia (Oreochromis spp.) from a Contaminated River in Taiwan: A Case Study. Toxins 1: 14-24.
Tacon, A.G.J. and Metian, M. (2008) Global overview on the use of fish meal and fish oil in industrially compounded aquafeeds: Trends and future prospects. Aquaculture 285: 146–158.
Taiwan Panorama (2004) Taiwan Tilapia – The Fish that Became a National Treasure. Accessed May 2016. http://www.taiwan- panorama.com/en/show_issue.php?id=200469306068E.TXT&table=3&cur_page=1&distype=te xt
44
Taiwan Today (2009). Accessed March 2016. http://taiwantoday.tw/ct.asp?xItem=89904&ctNode=427
Ting, K-H., Lin, K-L., Jhan, H-T., Huang, T-J., Wang, C-M. and Liu, W-H. (2015) Application of a Sustainable Fisheries Development Indicator System for Taiwan’s Aquaculture Industry. Aquaculture 437: 398-407.
Toxic Chemical Substance Control Act. Accessed July 2016. https://cdn.chemlinked.com/file/Taiwan%20TCSCA_2013_EN.pdf
USDA (2012) Aquaculture Data. USDA Economic Research Center. Accessed July 2016. http://www.ers.usda.gov/data/aquaculture/TilapiaImportsValue.htm
Varela-Romero, A., Ruiz-Campos, G., Yepiz-Velazquez, L. M., and Alaniz-Garcia, J. (2000). Distribution, habitat and conservation status of desert pupfish (Cyprinodon macularius) in the Lower Colorado River Basin, Mexico (2000). Rev. Fish Biol. Fisheries, 12(2): 157–165.
Verdegen, M. (2006) Improved resource use efficiency in Asian integrated pond-dike systems – PONDLIVE. Summary of the final report. POND-LIVE Project. Accessed July 2016. ftp://ftp.cordis.europa.eu/pub/inco/docs/aquaculture2/17cat_2001_10026pondlivefin_en.pdf
Verdegem, M.C.J. (2007) 'Nutrient balances in ponds'. In: Van der Zijpp, A.J., Verreth, J.A.J., Le Quang Tre, Van Mensvoort, M.E.F., Bosma, R.H. and Beveridge, M.C.M (Ed), Fishponds in farming systems. 1st Ed. The Netherlands: Wageningen Academic Publishers. Pp.71-78.
Veterinary Act (2015). Accessed August 2016. http://law.coa.gov.tw/GLRSnewsout/EngLawContent.aspx?Type=E&id=216
Veterinary Drugs Control Act (2013). Accessed July 2016. http://law.coa.gov.tw/GLRSnewsout/EngLawContent.aspx?Type=E&id=147
Wang, S-W., Lin, K-H., Hsueh, Y-M. and Liu, C-W. (2007) Arsenic Distribution in a Tilapia (Oreochromis mossambicus) Water-Sediment Aquacultural Ecosystem in Blackfoot Disease Hyperendemic Areas. Bulletin of Environmental Contamination and Toxicology 78(2): 147-151.
Wildlife Conservation Act (2009). Accessed August 2016. http://eng.coa.gov.tw/content_view.php?catid=9005&hot_new=8870
World Health Organization. Water related diseases. Arsenicosis. Accessed May 2016. http://www.who.int/water_sanitation_health/diseases/arsenicosis/en/
Yu, C.-H., Huang, C.-J., Kao, C.-J., Haung, J.-L., Sung, C.-H. and Chen, T-H. (2011) Taiwan Tilapia Production History, Traceability in Seafood Supply, and Transfer Pricing in the Global Market.
45
Presented at the 19th Annual Conference on Pacific Basin Finance, Economics, Accounting, and Management, Taipei, Taiwan.
46
About Seafood Watch®
Monterey Bay Aquarium’s Seafood Watch® program evaluates the ecological sustainability of wild-caught and farmed seafood commonly found in the United States marketplace. Seafood Watch® defines sustainable seafood as originating from sources, whether wild-caught or farmed, which can maintain or increase production in the long-term without jeopardizing the structure or function of affected ecosystems. Seafood Watch® makes its science-based recommendations available to the public in the form of regional pocket guides that can be downloaded from www.seafoodwatch.org. The program’s goals are to raise awareness of important ocean conservation issues and empower seafood consumers and businesses to make choices for healthy oceans.
Each sustainability recommendation on the regional pocket guides is supported by a Seafood Report. Each report synthesizes and analyzes the most current ecological, fisheries and ecosystem science on a species, then evaluates this information against the program’s conservation ethic to arrive at a recommendation of “Best Choices,” “Good Alternatives” or “Avoid.” The detailed evaluation methodology is available upon request. In producing the Seafood Reports, Seafood Watch® seeks out research published in academic, peer-reviewed journals whenever possible. Other sources of information include government technical publications, fishery management plans and supporting documents, and other scientific reviews of ecological sustainability. Seafood Watch® research analysts also communicate regularly with ecologists, fisheries and aquaculture scientists, and members of industry and conservation organizations when evaluating fisheries and aquaculture practices. Capture fisheries and aquaculture practices are highly dynamic; as the scientific information on each species changes, Seafood Watch®’s sustainability recommendations and the underlying Seafood Reports will be updated to reflect these changes.
Parties interested in capture fisheries, aquaculture practices and the sustainability of ocean ecosystems are welcome to use Seafood Reports in any way they find useful. For more information about Seafood Watch® and Seafood Reports, please contact the Seafood Watch® program at Monterey Bay Aquarium by calling 1-877-229-9990.
Disclaimer Seafood Watch® strives to have all Seafood Reports reviewed for accuracy and completeness by external scientists with expertise in ecology, fisheries science and aquaculture. Scientific review, however, does not constitute an endorsement of the Seafood Watch® program or its recommendations on the part of the reviewing scientists. Seafood Watch® is solely responsible for the conclusions reached in this report.
Seafood Watch® and Seafood Reports are made possible through a grant from the David and Lucile Packard Foundation.
47
Guiding Principles
Seafood Watchdefines sustainable seafood as originating from sources, whether fished3 or farmed, that can maintain or increase production in the long-term without jeopardizing the structure or function of affected ecosystems.
The following guiding principles illustrate the qualities that aquaculture must possess to be considered sustainable by the Seafood Watch program:
Seafood Watch will: Support data transparency and therefore aquaculture producers or industries that make
information and data on production practices and their impacts available to relevant
stakeholders.
Promote aquaculture production that minimizes or avoids the discharge of wastes at the
farm level in combination with an effective management or regulatory system to control
the location, scale and cumulative impacts of the industry’s waste discharges beyond the
immediate vicinity of the farm.
Promote aquaculture production at locations, scales and intensities that cumulatively
maintain the functionality of ecologically valuable habitats without unreasonably penalizing
historic habitat damage.
Promote aquaculture production that by design, management or regulation avoids the use
and discharge of chemicals toxic to aquatic life, and/or effectively controls the frequency,
risk of environmental impact and risk to human health of their use.
Within the typically limited data availability, use understandable quantitative and relative
indicators to recognize the global impacts of feed production and the efficiency of
conversion of feed ingredients to farmed seafood.
Promote aquaculture operations that pose no substantial risk of deleterious effects to wild
fish or shellfish populations through competition, habitat damage, genetic introgression,
hybridization, spawning disruption, changes in trophic structure or other impacts associated
with the escape of farmed fish or other unintentionally introduced species.
Promote aquaculture operations that pose no substantial risk of deleterious effects to wild
populations through the amplification and retransmission of pathogens or parasites.
Promote the use of eggs, larvae, or juvenile fish produced in hatcheries using domesticated
broodstocks thereby avoiding the need for wild capture.
Recognize that energy use varies greatly among different production systems and can be a
major impact category for some aquaculture operations, and also recognize that improving
3 “Fish” is used throughout this document to refer to finfish, shellfish and other invertebrates.
48
practices for some criteria may lead to more energy intensive production systems (e.g.
promoting more energy intensive closed recirculation systems).
Once a score and rank has been assigned to each criterion, an overall seafood recommendation is developed on additional evaluation guidelines. Criteria ranks and the overall recommendation are color-coded to correspond to the categories on the Seafood Watch pocket guide:
Best Choices/Green: Are well managed and caught or farmed in environmentally friendly ways.
Good Alternatives/Yellow: Buy, but be aware there are concerns with how they’re caught or farmed.
Avoid/Red: Take a pass on these. These items are overfished or caught or farmed in ways that harm other marine life or the environment.
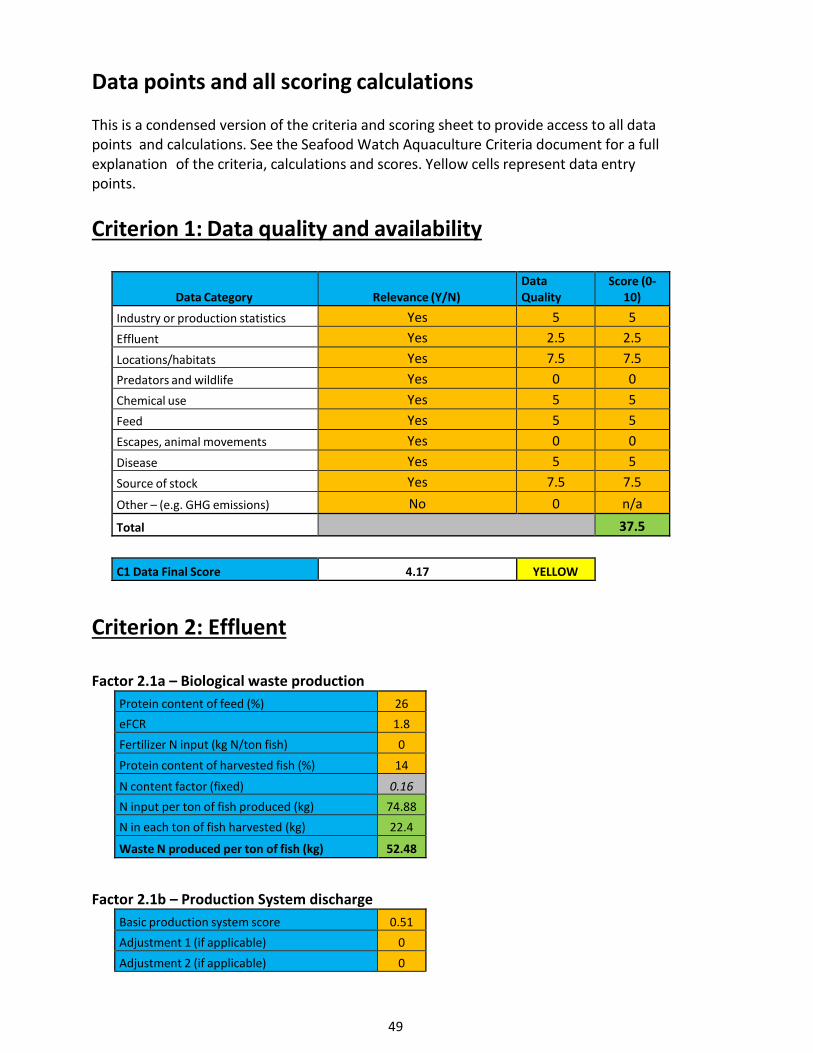
49
Data points and all scoring calculations
This is a condensed version of the criteria and scoring sheet to provide access to all data points and calculations. See the Seafood Watch Aquaculture Criteria document for a full explanation of the criteria, calculations and scores. Yellow cells represent data entry points.
Criterion 1: Data quality and availability
Data Category
Relevance (Y/N) Data Quality
Score (0- 10)
Industry or production statistics Yes 5 5
Effluent Yes 2.5 2.5
Locations/habitats Yes 7.5 7.5
Predators and wildlife Yes 0 0
Chemical use Yes 5 5
Feed Yes 5 5
Escapes, animal movements Yes 0 0
Disease Yes 5 5
Source of stock Yes 7.5 7.5
Other – (e.g. GHG emissions) No 0 n/a
Total 37.5
C1 Data Final Score 4.17 YELLOW
Criterion 2: Effluent Factor 2.1a – Biological waste production
Protein content of feed (%) 26
eFCR 1.8
Fertilizer N input (kg N/ton fish) 0
Protein content of harvested fish (%) 14
N content factor (fixed) 0.16
N input per ton of fish produced (kg) 74.88
N in each ton of fish harvested (kg) 22.4
Waste N produced per ton of fish (kg) 52.48
Factor 2.1b – Production System discharge
Basic production system score 0.51
Adjustment 1 (if applicable) 0
Adjustment 2 (if applicable) 0
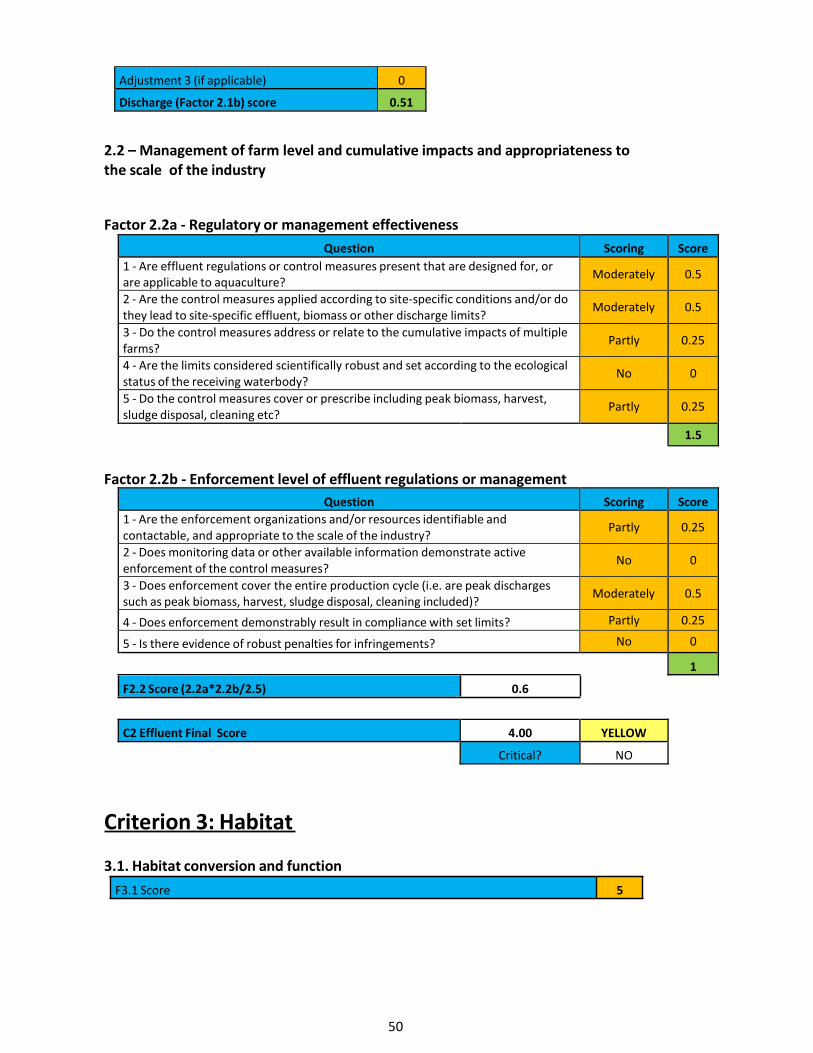
50
F2.2 Score (2.2a*2.2b/2.5) 0.6
F3.1 Score 5
Factor 2.2b - Enforcement level of effluent regulations or management
Criterion 3: Habitat
3.1. Habitat conversion and function
Adjustment 3 (if applicable) 0
Discharge (Factor 2.1b) score 0.51
2.2 – Management of farm level and cumulative impacts and appropriateness to the scale of the industry
Factor 2.2a - Regulatory or management effectiveness
Question Scoring Score
1 - Are effluent regulations or control measures present that are designed for, or are applicable to aquaculture?
Moderately 0.5
2 - Are the control measures applied according to site-specific conditions and/or do they lead to site-specific effluent, biomass or other discharge limits?
Moderately 0.5
3 - Do the control measures address or relate to the cumulative impacts of multiple farms?
Partly 0.25
4 - Are the limits considered scientifically robust and set according to the ecological status of the receiving waterbody?
No 0
5 - Do the control measures cover or prescribe including peak biomass, harvest, sludge disposal, cleaning etc?
Partly 0.25
1.5
Question Scoring Score
1 - Are the enforcement organizations and/or resources identifiable and contactable, and appropriate to the scale of the industry?
Partly 0.25
2 - Does monitoring data or other available information demonstrate active enforcement of the control measures?
No 0
3 - Does enforcement cover the entire production cycle (i.e. are peak discharges such as peak biomass, harvest, sludge disposal, cleaning included)?
Moderately 0.5
4 - Does enforcement demonstrably result in compliance with set limits? Partly 0.25
5 - Is there evidence of robust penalties for infringements? No 0
1
C2 Effluent Final Score 4.00 YELLOW
Critical? NO
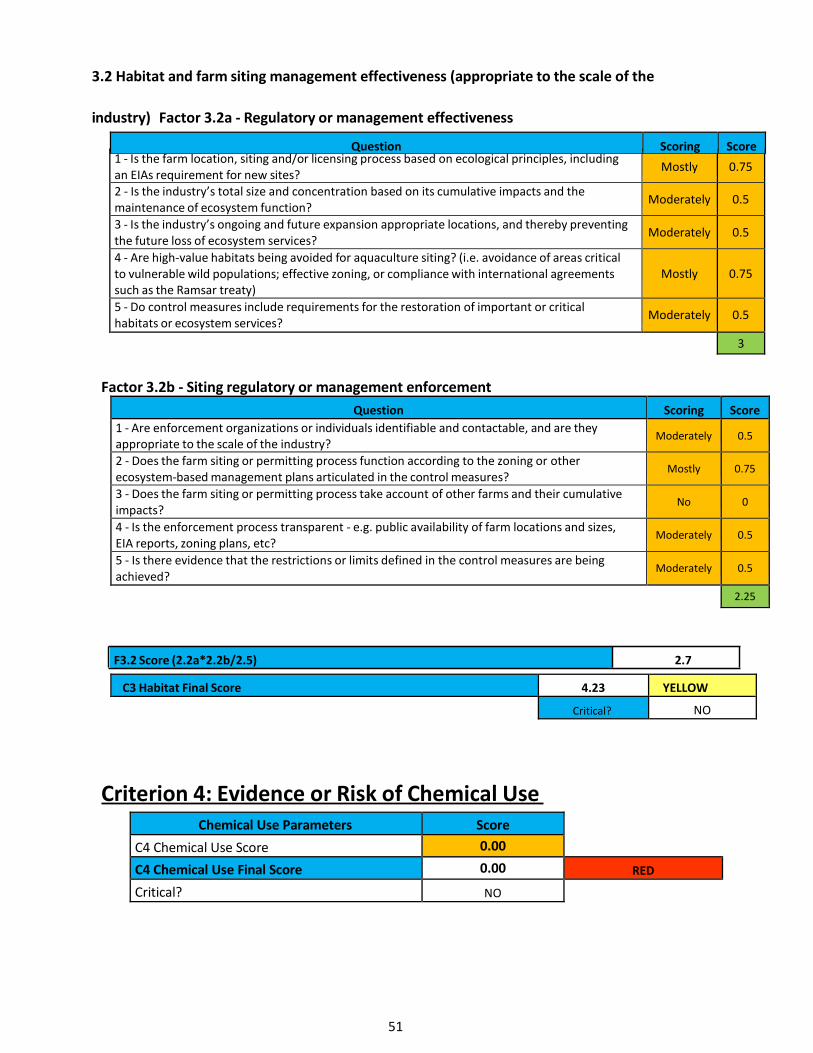
51
F3.2 Score (2.2a*2.2b/2.5) 2.7
Factor 3.2b - Siting regulatory or management enforcement
Criterion 4: Evidence or Risk of Chemical Use
3.2 Habitat and farm siting management effectiveness (appropriate to the scale of the
industry) Factor 3.2a - Regulatory or management effectiveness
1 - Is the farm location, siting and/or licensing process based on ecological principles, including an EIAs requirement for new sites?
Mostly 0.75
2 - Is the industry’s total size and concentration based on its cumulative impacts and the maintenance of ecosystem function?
Moderately 0.5
3 - Is the industry’s ongoing and future expansion appropriate locations, and thereby preventing the future loss of ecosystem services?
Moderately 0.5
4 - Are high-value habitats being avoided for aquaculture siting? (i.e. avoidance of areas critical to vulnerable wild populations; effective zoning, or compliance with international agreements such as the Ramsar treaty)
Mostly
0.75
5 - Do control measures include requirements for the restoration of important or critical habitats or ecosystem services?
Moderately 0.5
3
Question Scoring Score
1 - Are enforcement organizations or individuals identifiable and contactable, and are they appropriate to the scale of the industry?
Moderately 0.5
2 - Does the farm siting or permitting process function according to the zoning or other ecosystem-based management plans articulated in the control measures?
Mostly 0.75
3 - Does the farm siting or permitting process take account of other farms and their cumulative impacts?
No 0
4 - Is the enforcement process transparent - e.g. public availability of farm locations and sizes, EIA reports, zoning plans, etc?
Moderately 0.5
5 - Is there evidence that the restrictions or limits defined in the control measures are being achieved?
Moderately 0.5
2.25
C3 Habitat Final Score 4.23 YELLOW
Critical? NO
Chemical Use Parameters Score
C4 Chemical Use Score 0.00
C4 Chemical Use Final Score 0.00 RED
Critical? NO
Question Scoring Score
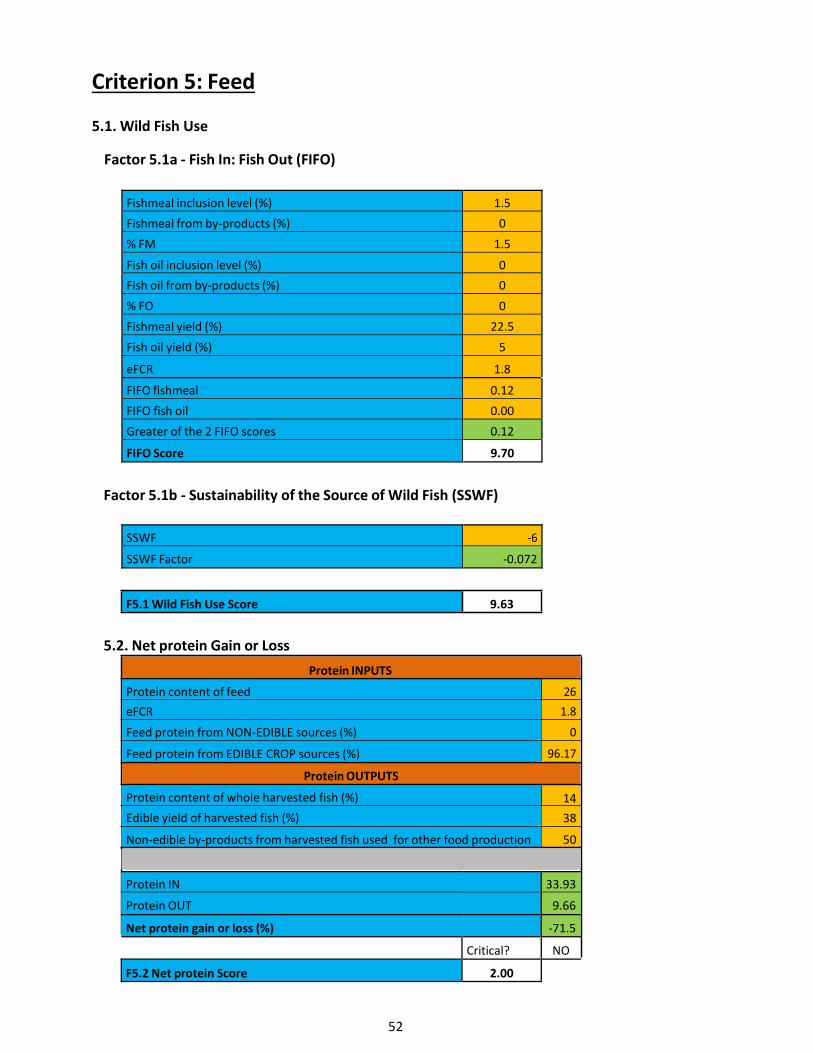
52
F5.1 Wild Fish Use Score 9.63
Factor 5.1b - Sustainability of the Source of Wild Fish (SSWF)
5.2. Net protein Gain or Loss
Protein INPUTS
Protein content of feed
eFCR
Feed protein from NON-EDIBLE sources (%)
Feed protein from EDIBLE CROP sources (%)
Protein OUTPUTS
Protein content of whole harvested fish (%)
Edible yield of harvested fish (%)
Non-edible by-products from harvested fish used for other food production
14
38
50
Criterion 5: Feed
5.1. Wild Fish Use
Factor 5.1a - Fish In: Fish Out (FIFO)
Fishmeal inclusion level (%) 1.5
Fishmeal from by-products (%) 0
% FM 1.5
Fish oil inclusion level (%) 0
Fish oil from by-products (%) 0
% FO 0
Fishmeal yield (%) 22.5
Fish oil yield (%) 5
eFCR 1.8
FIFO fishmeal 0.12
FIFO fish oil 0.00
Greater of the 2 FIFO scores 0.12
FIFO Score 9.70
SSWF -6
SSWF Factor -0.072
Protein IN 33.93
Protein OUT 9.66
Net protein gain or loss (%) -71.5
Critical? NO
F5.2 Net protein Score 2.00
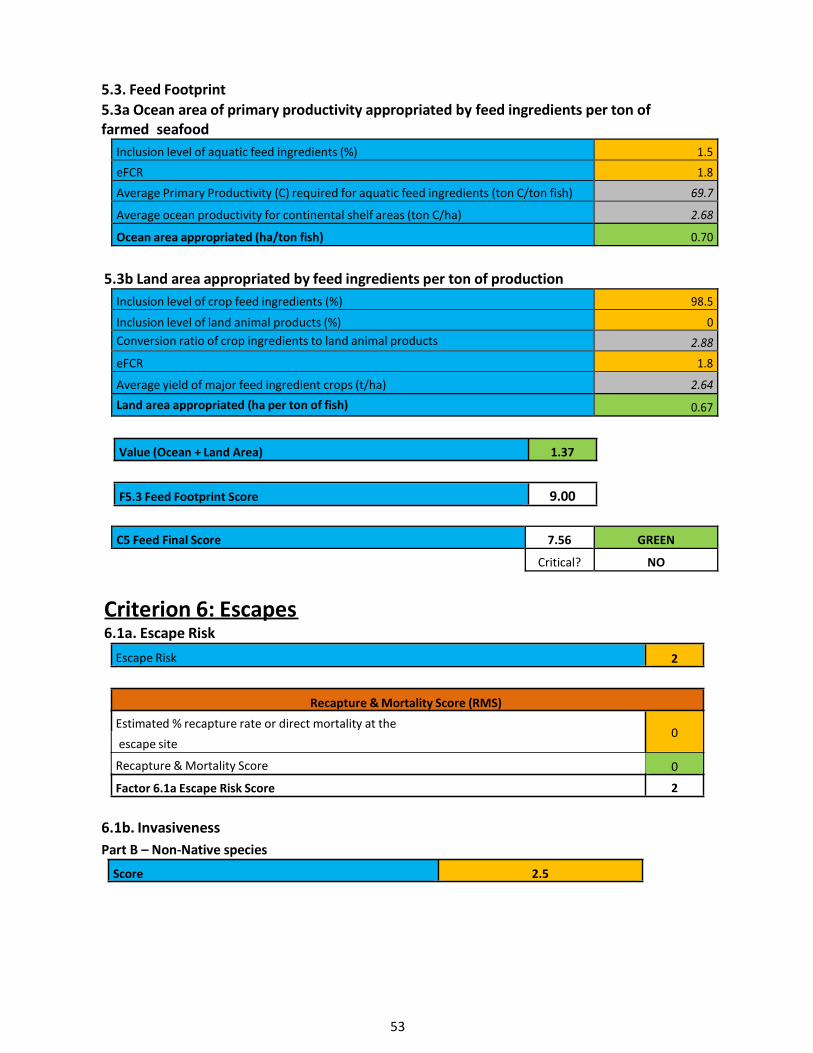
53
Value (Ocean + Land Area) 1.37
F5.3 Feed Footprint Score 9.00
5.3b Land area appropriated by feed ingredients per ton of production
Criterion 6: Escapes 6.1a. Escape Risk
Escape Risk 2
Recapture & Mortality Score (RMS)
Estimated % recapture rate or direct mortality at the
escape site
Recapture & Mortality Score
Factor 6.1a Escape Risk Score
0
0
2
5.3. Feed Footprint
5.3a Ocean area of primary productivity appropriated by feed ingredients per ton of farmed seafood
Inclusion level of aquatic feed ingredients (%) 1.5
eFCR 1.8
Average Primary Productivity (C) required for aquatic feed ingredients (ton C/ton fish) 69.7
Average ocean productivity for continental shelf areas (ton C/ha) 2.68
Ocean area appropriated (ha/ton fish) 0.70
Inclusion level of crop feed ingredients (%) 98.5
Inclusion level of land animal products (%) 0
Conversion ratio of crop ingredients to land animal products 2.88
eFCR 1.8
Average yield of major feed ingredient crops (t/ha) 2.64
Land area appropriated (ha per ton of fish) 0.67
C5 Feed Final Score 7.56 GREEN
Critical? NO
6.1b. Invasiveness
Part B – Non-Native species
Score 2.5
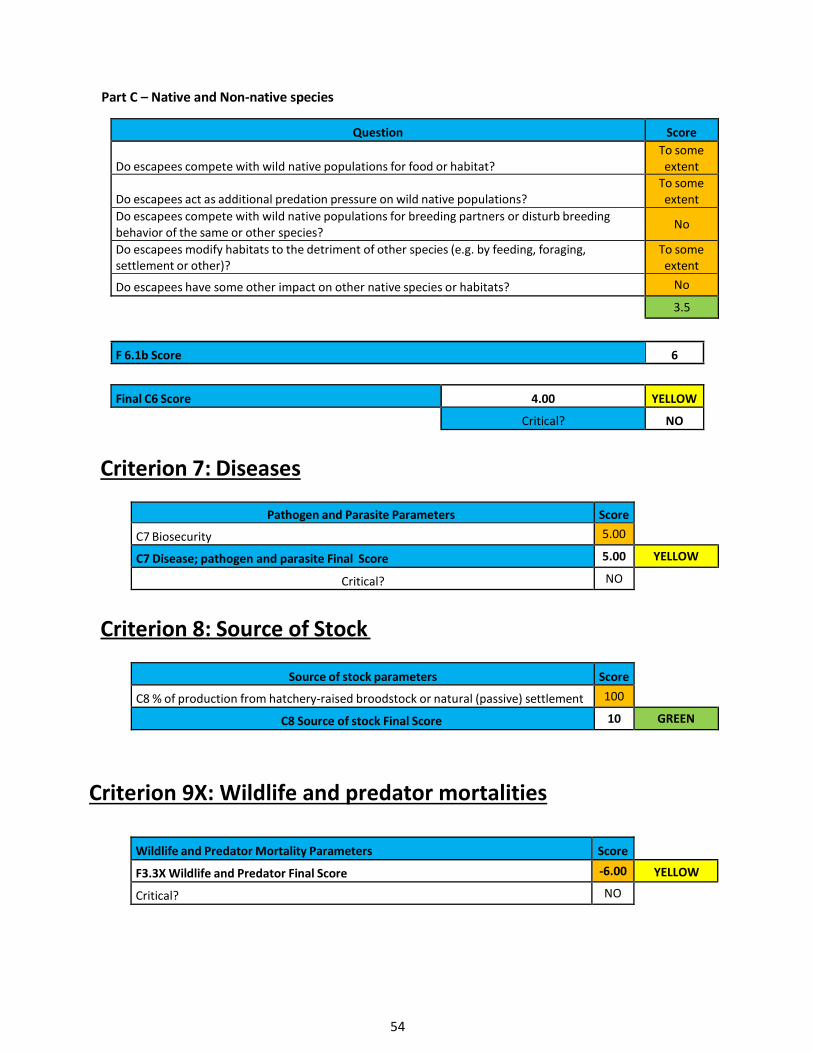
54
F 6.1b Score 6
Criterion 7: Diseases
Criterion 8: Source of Stock
Part C – Native and Non-native species
Question Score
Do escapees compete with wild native populations for food or habitat? To some extent
Do escapees act as additional predation pressure on wild native populations? To some extent
Do escapees compete with wild native populations for breeding partners or disturb breeding behavior of the same or other species?
No
Do escapees modify habitats to the detriment of other species (e.g. by feeding, foraging, settlement or other)?
To some extent
Do escapees have some other impact on other native species or habitats? No
3.5
Final C6 Score 4.00 YELLOW
Critical? NO
Pathogen and Parasite Parameters Score
C7 Biosecurity 5.00
C7 Disease; pathogen and parasite Final Score 5.00 YELLOW
Critical? NO
Source of stock parameters Score
C8 % of production from hatchery-raised broodstock or natural (passive) settlement 100
C8 Source of stock Final Score 10 GREEN
Criterion 9X: Wildlife and predator mortalities
Wildlife and Predator Mortality Parameters Score
F3.3X Wildlife and Predator Final Score -6.00 YELLOW
Critical? NO
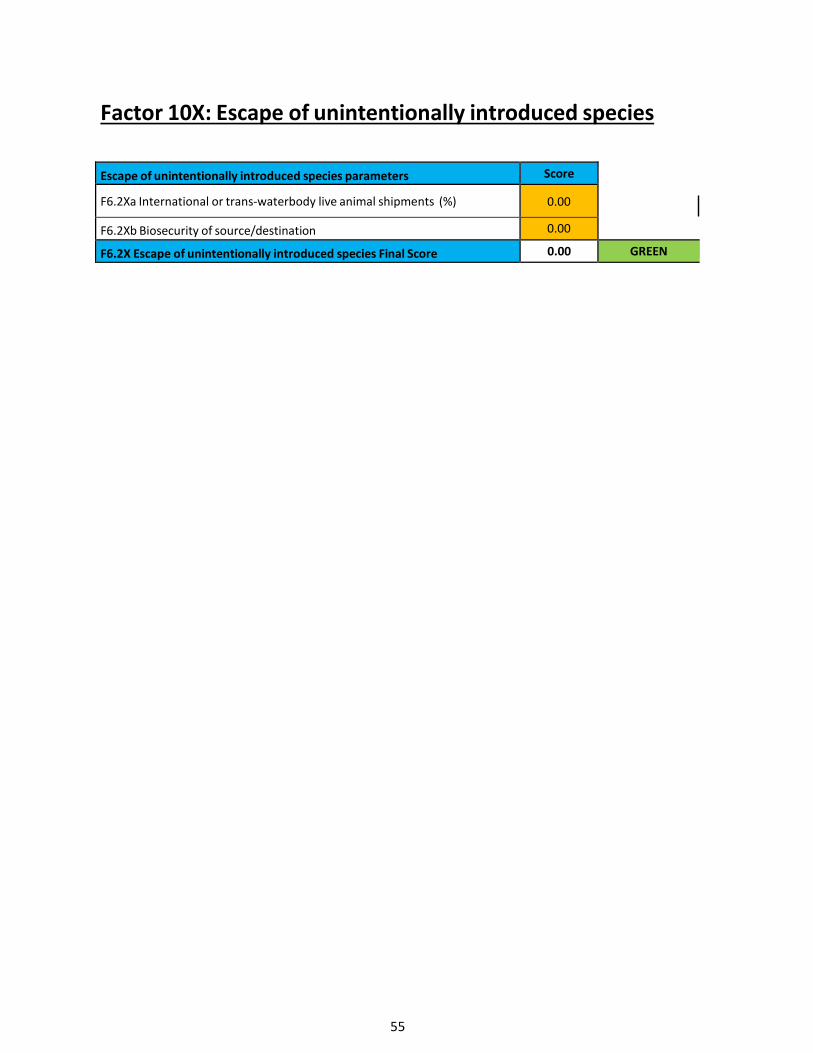
55
Factor 10X: Escape of unintentionally introduced species
Escape of unintentionally introduced species parameters Score
F6.2Xa International or trans-waterbody live animal shipments (%) 0.00
F6.2Xb Biosecurity of source/destination 0.00
F6.2X Escape of unintentionally introduced species Final Score 0.00 GREEN


![Tilapia Production Systems in the Americas-Technological Advances, Trends, And Challenges[1]](https://static.fdocuments.in/doc/165x107/577d23241a28ab4e1e99163e/tilapia-production-systems-in-the-americas-technological-advances-trends.jpg)