TIIClE-TEMPERATURE-TRANSFORMATION 725 Special … · Results and Discussion H:wdness and Tensile...
12
TIIClE-TEMPERATURE-TRANSFORMATION DIAGRAM OF ALLOY 725 Sanvan Mannan and Frank Veltry Special Metals Corporation 3200, Riverside Drive. Huntington. WV 25705 Abstract Commercially produced INCONEL" alloy 725 was annealed and heat-treated in the temperature range of 650LC to 1093°C for the times of 15 minutes to 100 hours Heat-treated specimens were tested for hardness and room temperature tensile properties To develop an understanding of the obsen ed mechanical properties, tested specimens were examined using optical metallography, scanning electron microscopy, transmission electron microscopy, and X-ray diffraction Data generated from these analytical techniques is presented in the form of a t~me-temperature- transformation diagram O lNCONEL is a registered trademark of the Special Metals Corporation group of companies Superallo!.~ 718. 625. 706 and Various Dcri\ativt,s Editril b> E.A. Loria PhIS (Tlw Minerals, hletals LP: blatcriais Societ! ). 2001
Transcript of TIIClE-TEMPERATURE-TRANSFORMATION 725 Special … · Results and Discussion H:wdness and Tensile...

TIIClE-TEMPERATURE-TRANSFORMATION DIAGRAM OF ALLOY 725
Sanvan Mannan and Frank Veltry Special Metals Corporation
3200, Riverside Drive. Huntington. WV 25705
Abstract
Commercially produced INCONEL" alloy 725 was annealed and heat-treated in the temperature range of 650LC to 1093°C for the times of 15 minutes to 100 hours Heat-treated specimens were tested for hardness and room temperature tensile properties To develop an understanding of the obsen ed mechanical properties, tested specimens were examined using optical metallography, scanning electron microscopy, transmission electron microscopy, and X-ray diffraction Data generated from these analytical techniques is presented in the form of a t~me-temperature- transformation diagram
O lNCONEL is a registered trademark of the Special Metals Corporation group of companies
Superallo!.~ 718. 625. 706 and Various Dcri\ativt,s Editril b> E.A. Loria
PhIS (Tlw Minerals, hletals LP: blatcriais Societ! ). 2001

Introduction
IhCONELO Alloy 725 is a highly corrosion resistant nickel-based alloy which can be age- hardened to strength levels comparable to alloys 706 and 718 by the precipitation of ~nternietallic phases yU(Ni3(NbA1Ti), and y' {Ni3(AITi j [I-21 This combination of h ~ g h strengh, duct~lity, and excellent corrosion resistance make the alloy attractive for turbine appllcatlons and also for use in other challenging environments such as sea water, deep sour gas \\ells. and mneral acids [3]
h~lechanical properties and corrosion resistance are governed by the microstructure. To tailor the microstructure for properties, an understanding of phase stability with time and temperature is essential. In this study, commercially produced material was annealed at 1149°C for 2 hours and heat-treated in the temperature range of 650°C to 1093°C for the times of 15 minutes to 100 hours. This was followed by hardness and room temperature tensile testing. Tested specimens were examined using optical metallography, scanning electron microscopy (SEM), transmission electron microscopy (TEM), and X-ray diffraction (XRD) analyses. Data generated using these analvtical techniques is presented in the form of a time-temperature-transformation diagram.
Experimental Procedure
.-' commercial heat of alloy 725 produced by vacuum induction melting and vacuum arc remeltiny was forged to 152 x 203mm billets which were hot rolled to 25.4mm diameter rod. Specimens were cut from the rod. annealed in the lab at 1149°C for 2 hours, and air cooled. Annealed specimens were heat-treated in the temperature range of 650°C to 1093°C for the times of 15 minutes to 100 hours and tested for hardness and room temperature tensile properties. Hot rolled material was also heat treated at 871°C and 927°C and their microstructure was characterized. Chemical composition of the material is given in Table I.
Table I. Chemical Composition (wt%)
Optical Metallography and X-Ray Diffraction: A two-sta8e procedure was found suitable to reveal the microstructure It involved dipping the specimen In concentrated HC1 for 5 seconds and immersing in 1% Br/CH30H solution for 15-20 seconds Selected specimens were electrolytically etched with a solution containing 6Oml H3P04, 16ml H2SO4, 109 of CrO?, and 12ml of H 2 0 . Polished specimens were subjected to electrolytic extraction in CH30H/HCl and/or Phosphoric acid solution at 0 5A for 4-20 hours uslng standard ASTM practice E963-83. The extracted residue was subjected to XRD, SEM, and Energy Dispersive X-Ray (EDX) analyses
Transmission Electron Microscopy: To prepare specimens for TEM, 400-500pm thick foils were cut with a precision saw. The 3mm discs were mechanically punched from the foils and ground to 150-200pm. The discs were then electrolytically polished by a twin jet thinning apparatus using a solution of 10% perchloric acid in methanol at 28V and at -50°C. Thin foils were examined with a Phillips EM 400 microscope

Results and Discussion
H:wdness and Tensile Properties: Figure I shows Time-Temperature-Hardness (TTH) curve for the specimens exposed in the temperature range of 649°C to 1093°C for the time of 15 minutes to 100 hours. It should be mentioned that hardness was determined on Rockwell B and C scales and converted to Vickers Hardness Numbers to have one hardness scale on the plot. The degree of precipitatiota strengthening is highest in the temperature range of 760°C to 8 16"C, Figure 1 .
E x p o s u r e T i m e , h o u r s
Figure 1 Time Temperature Hardness plot of the material annealed at 1149°C for 2h and air- cooled prior to the heat treatments
Yield strength and elongation for the specimens exposed at 760°C and 871°C are shown in Figures 2a and 2b. Yield strength for 76O0C/100h exposure is roughly double that of 871 'C/100h However, the elongation for the former is half that of latter. Metallographic analyses were carried out to understand the hardness and tensile properties.
Flyuse 3 Yield strength and elongation of the specimens exposed at 760°C and 871°C.

Optical and Scanning Electron Microscopy: The grain size of the material annealed at 1149°C for 2 hours was ASTM #00 Annealed material contained TIN and MC carbides [Ti and (TiNb) carbides] which are typically found in some superalloys [4.5] No additional precipitation could be observed on exposure at 649°C On prolonged exposure at 704"C, grain boundary precipitates were observed
Figures 3 shows photographs of the specimens exposed at 760°C for 4, 25, and 100 hours. At 4 hours exposure time, only partial coverage of grain boundary precipitates is observed. On increasing the exposure time to 25 hours, the grain boundaries are essentially covered with precipitates At 1 OOh exposure, grain boundaries are h l l y covered with heavy precipitates and the matrix has a mottled appearance typical of overaged y'ly" [6]. Specimens exposed at 8 16°C for 4, 25, and 100 hours also show grain boundary precipitates and intragranular mottled appearance. Figure 4.
Exposures at 871 "C for 4h and 25h result in grain boundary precipitates and intragranular mottled appearance, Figure 5a and 5b. However, on 100 hours heat treatment, additional inter and intragranular acicular recipitates are observed, Figure 5c. An exposure at 927°C for 4h re\:ealed grain boundary precipitates only, Figure 6a. However, on increasing the exposure time at 927°C to 25h and 1 OOh, inter- and intragranular acicular precipitates were observed, Figure 6b and 6c. Volume fraction and size of the acicular precipitates for lOOh exposure is larger than 35h exposure. Absence of intragranular mottled appearance suggests that y'ly" precipitates are in solution at 927°C. On increasing the exposure temperature to 982'C, the material contained only intergranular precipitates, Figure 7.
Figure 3: h/licrostructure of the specimens exposed at 760°C: a) 4h, b) 25h, and c) 1OOh
Figure 4. Microstructure of the specimens exposed at 816°C a) 4h, b) 25h, and c) 1OOh

Figure 5 : Microstructure of the specimens exposed at 871 " C : a) 4h, b) 25h, and c) 1OOh
Figure 6: Microstructure of the specimens exposed at 927°C: a) 4h, b) 2511, and c) 1OOh
Figure 7. Microstructure of the specimens exposed at 982°C: a) 4h. b) 25h, and c) 1OOh
349
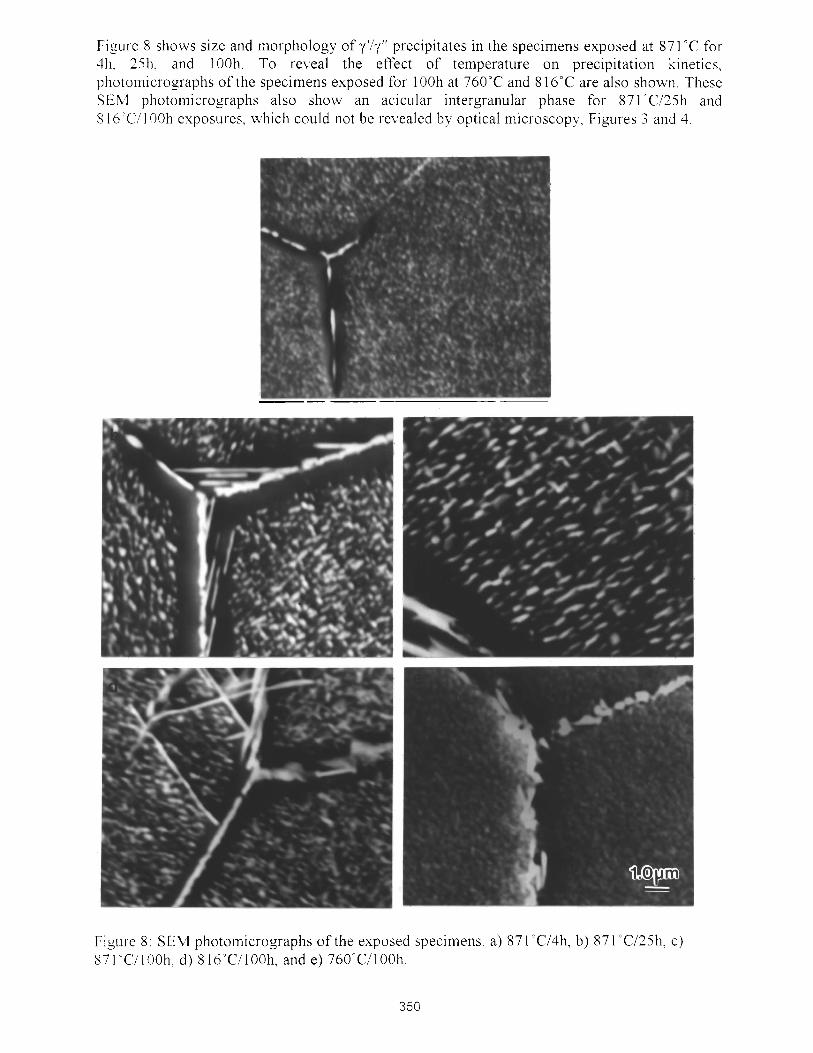
Figure 8 shows size and morphology of y'iy" precipitates in the specimens exposed at 871 "C 411, 25h, and 100h. To reveal the effect of temperature on precipitation kinet photomicrographs of the specimens exposed for 1OOh at 760°C and 816°C are also shown Tk SEbl photomicrographs also show an acicular intergranular phase for 871nC/25h S 16 Ci100h exposures. which could not be revealed by optical microscopy, Figures 3 and 4
for ics, lese and
Fiyure 8 SEM photomicrographs of the exposed specimens a) 871 "C/4h, b) 871LCi25h, c) 871 'CI1 00h, d) 8 16"C/100h, and e) 76O0C/100h

XRD and TEM Analyses: The extracted residues from all specimens contained matrix grain fragments, TIN, and MC (Ti, Nb) carbides. Figures 9a to 9c show morphology and EDX patterns of Ni3Ti-type q precipitates formed at 927'C. Due to the dilution of the X-rays collected from a large matrix area, the EDX patterns from thin needle-like q precipitates and matrix are similar, Figures 9b and 9c. However, EDX pattern from the extracted residue showed definite enrichment in Ti and Ni, Figure 10. The X-Ray diffraction pattern from the residue was similar to JCPDF # 23-1275. Figure 11 shows morphology and EDX pattern of o phase from the extracted residue of specimen annealed at 1149°C for 2h and exposed at 927°C for 50h. Grain boundary M23C6 type carbide morphology and EDX pattern is shown in Figures 12a and 12b. It shows enrichment of Cr and Mo as compared to the matrix shown in Figure 9c. Selected TEM analyses were conducted to confirm the findings of X-Ray diffraction analysis. Sigma phase in a specimen exposed at 927°C for 15 minutes in the hot worked condition is shown in Figure 13. Also, y" in the specimen annealed at 1149°C for 2h and exposed at 760°C for 12h is shown in Figure 14.
Figure 9: SEMEDX analysis of the specimen annealed at 1149'C for 2h and exposed at 927'C for 100h. a) SEM photomicrograph, b) EDX pattern of the matrix, c) EDX pattern from site 1 .

Figure 10: SEWEDX analysis of the residue extracted from the specimen annealed at 1149°C for 2h and exposed at 927°C for 12h. a) SEM photomicrograph, b) EDX pattern from site 1, c) EDX patLe1.11 from site 1
Figure 1 1 . SEM photomicrograph and EDX pattern of o phase from the extracted residue of the specimen annealed at 1149°C for 2h and exposed at 927°C for 50h. The X-Ray diffraction was similar to JCPDF # 9-284
Figure 12: SEM photomicrograph and EDX pattern of MZ3C6 carbide phase from the specimen annealed at 1 149°C for 2h and exposed at 760°C for 100h. The X-Ray diffraction pattern from the extracted residue was similar to JCPDF # 5-980.
352
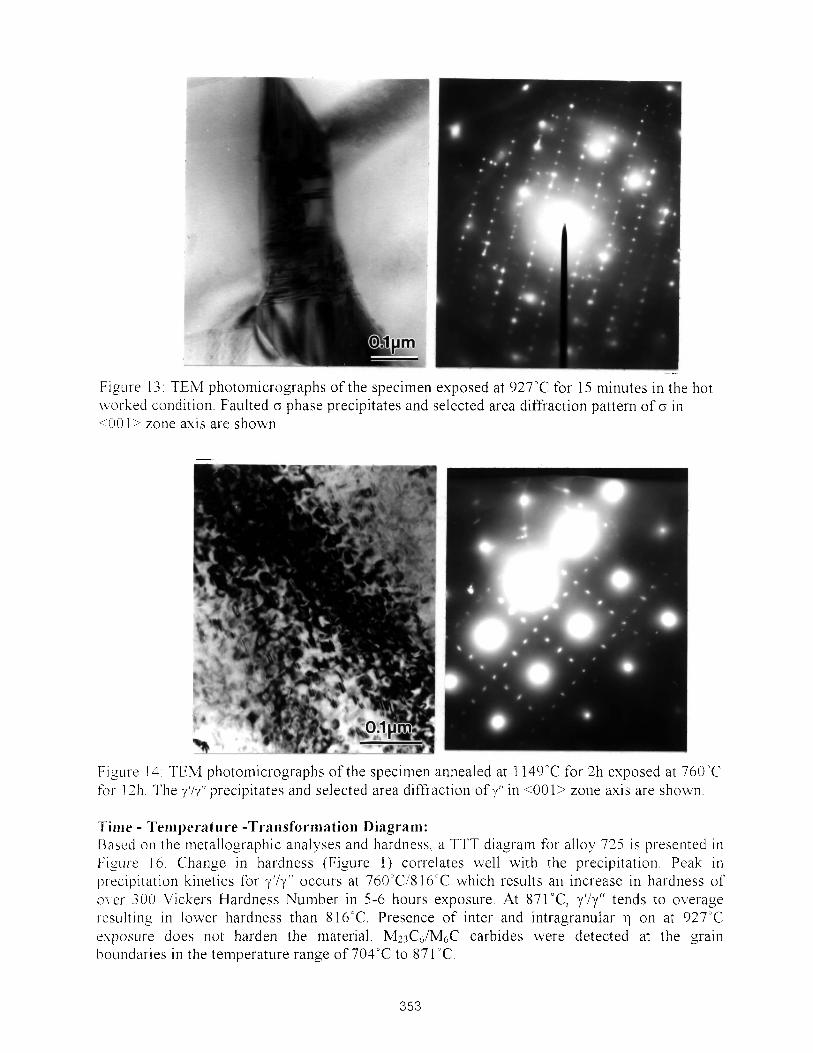
Figure 13: TEM photomicrographs of the specimen exposed at 927°C for 15 minutes in the hot jvorked condition. Faulted o phase precipitates and selected area diffraction pattern of o in *:OOl> zone axis are shown.
I-iyure 13 TEhl photomicrographs of the specimen annealed at 1149°C for 2h exposed at 760°C for 1211 The y'l;lf' precipitates and selected area diffraction ofy" in <001> zone axis are shoun
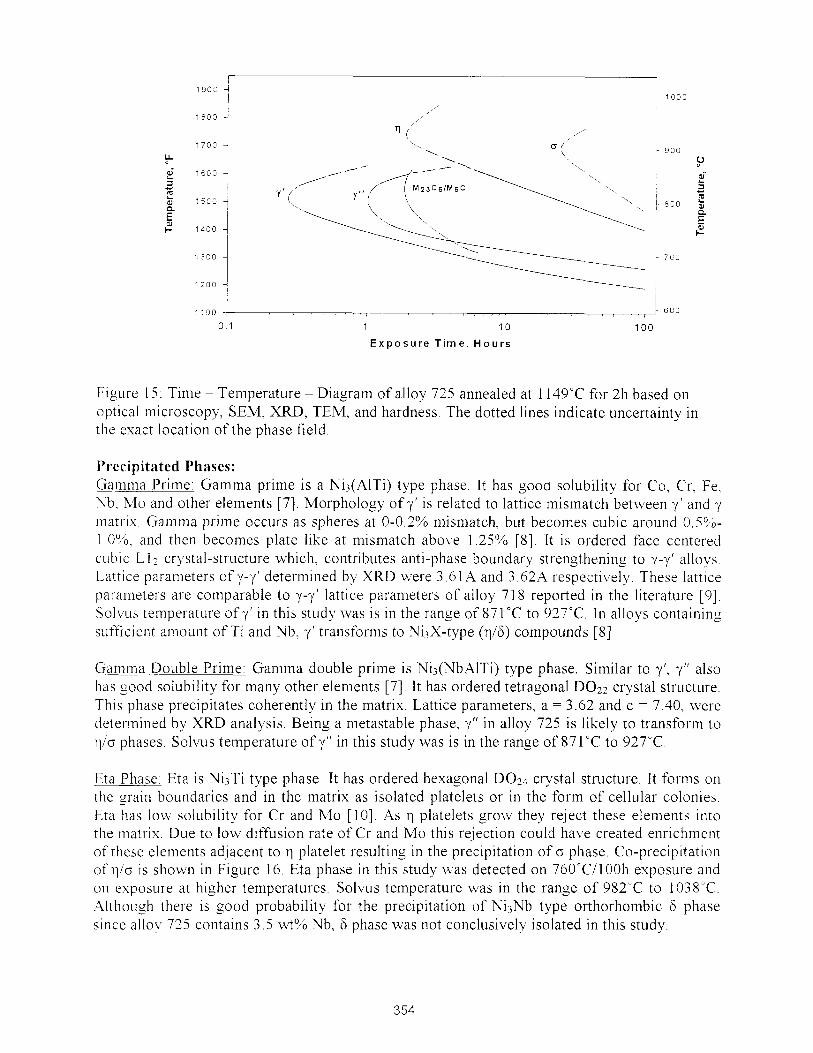
Time - Temperature -Transformation Diagram: Based on the metallographic analyses and hardness. a TTT diagram for alloy 725 is presented i n Figure 16. Change in hardness (Figure 1 ) correlates well with the precipitation. Peak in precipitation kinetics for y ' l y " occurs at 760'C/816"C which results an increase in hardness of m.er 300 Vickers Hardness Number in 5-6 hours exposure. At 871°C, y'ly" tends to overage I-esulting in lower hardness than 816°C. Presence of inter and intragranular on at 927°C e s p o s ~ ~ r e does not harden the material. M23C&4GC carbides were detected at the grain boundaries in the temperature range of 7O4'C to 871 "C.
llD0 t 600
0 1 1 10 100
E x p o s u r e T i m e , Hours
Figure 15: Time - Temperature - Diagram of alloy 725 annealed at 1 149°C for 2h based on optical microscopy, SEM, XRD, TEM, and hardness. The dotted lines indicate uncertainty in the exact location of the phase field.
I'recipitated Phases: &anltm Prime: Gamma prime is a N&(AlTi) type phase. It has good solubility for Co, Cr, Fe, Nb, Mo and other elements [7]. Morphology of y' is related to lattice mismatch between y' and y matrix. Gamma prime occurs as spheres at 0-0.2% mismatch, but becomes cubic around 0.5%- 1 .O06, and then becomes plate like at mismatch above 1.25% [8]. It is ordered face centered cubic L l z crystal-structure which, contributes anti-phase boundary strengthening to y-y' alloys. Lattice parameters of y-y' determined by XRD were 3.61A and 3.62A respectively. These lattice parameters are comparable to y-y' lattice parameters of alloy 71 8 reported in the literature [9]. Solvus temperature of y' in this study was is in the range of 871 "C to 927°C. In alloys containing sufficient amount of Ti and Nb, y' transfortns to NijX-type (1116) compounds [8]
Gamma Double Prime: Gamma double prime is Nii(NbA1Ti) type phase. Similar to y', y" also has ~ o o d solubility for many other elements [7]. It has ordered tetragonal DOz2 crystal structure. This phase precipitates coherently in the matrix. Lattice parameters, a = 3.62 and c = 7.40, were determined by XRD analysis. Being a metastable phase, y" in alloy 725 is likely to transform to 1110 phases. Solvus temperature of y" in this study was is in the range of 871°C to 927°C.
Eta Phase: Eta is NiiTi type phase. It has ordered hexagonal Do24 crystal structure. It forms on the p i n boundaries and in the matrix as isolated platelets or in the form of cellular colonies. Eta has low solubility for Cr and Mo [ lo] . As 7 platelets grow they reject these elements into the matrix Due to low diffusion rate of Cr and Mo this rejection could have created enrichment of these elements adjacent to q platelet resulting in the precipitation of o phase. Co-precipitation of 1110 is shown in Figure 16. Eta phase in this study was detected on 76OoC/100h exposure and on exposure at higher temperatures. Solvus temperature was in the range of 982°C to 1038'C. Aithouyh there is good probability for the precipitation of NiiNb type orthorhombic 6 phase since alloy 725 contains 3.5 wt% Nb, 6 phase was not conclusively isolated in this study.
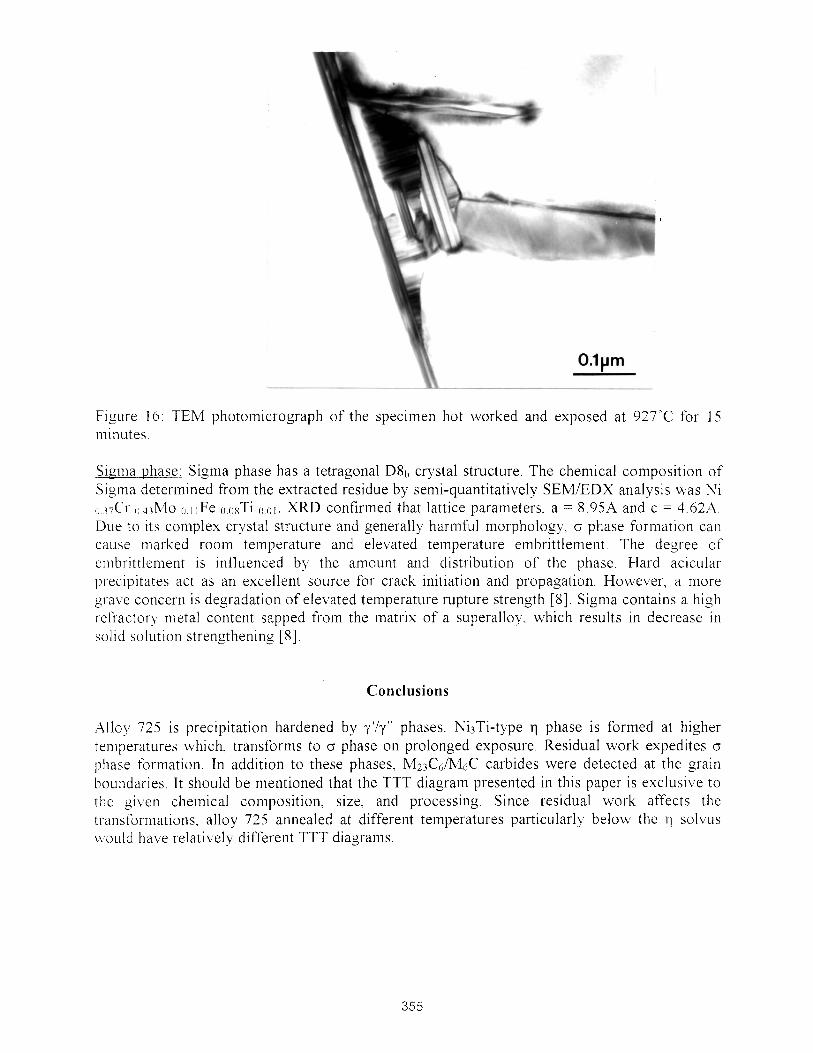
Figure 16 TEM photomicrograph of the specimen hot worked and exposed at 927°C for 15 minutes
Sigma phase; Sigma phase has a tetragonal D81, crystal structure. The chemical composition of Sigma determined from the extracted residue by semi-quantitatively SEMIEDX analysis was Ni (, 37Cs 4.ihlo 0.1 lFe ",oxTi 0 0 1 . XRD confirmed that lattice parameters, a = 8.95A and c = 4.62A. Due to its complex crystal structure and generally harmful morphology, o phase formation can cause marked room temperature and elevated temperature embrittlement. The degree of embrittlement is influenced by the amount and distribution of the phase. Hard acicular precipitates act as an excellent source for crack initiation and propagation. However, a more gsave concern is degradation of elevated temperature rupture strength [8]. Sigma contains a high refractory metal content sapped from the matrix of a superalloy, which results in decrease in solid solution strengthening [S].
Conclusions
Alloy 725 is precipitation hardened by y ' ly " phases. Ni3Ti-type q phase is formed at higher temperatures which, transforms to o phase on prolonged exposure Residual work expedites o phase formation In addition to these phases, M23C6/M6C carbides were detected at the grain boundaries It should be mentioned that the TTT diagram presented in this paper is exclusive to the g i ~ e n chemical composition, size, and processing Since residual work affects the tsansformations, alloy 725 annealed at different temperatures particularly below the 11 solvus ~ o u l d have relatively different TTT diagrams

Acknowledgements
The authors would like to thank Dr Shailesh Patel, Director R&D and Mr. Gaylord Smith, Manager Alloy Development for their encouragement and guidance on carrying out this research. Mr. Christopher Saunders is thanked for his help in extraction X-Ray diffrcation and TEM sample preparation.
References
1 . E. L. Hibner, H. W. Sizek, and S. K. Mannan, "Elevated Temperature Tensile and Creep Properties of INCONEL alloy 725", Superalloys 718, 625, 706, and Various Derivatives, Ed. E . A, Loria, (Warrendale, PA: TMS, 1997), 49 1-501.
3 S K Mannan, S J Patel, J Dong, and X Xie, "Crack Growth and High Temperature Thermal Stabtlity of INCONEL alloy 725", Intermetallics and Superalloys, EUROMAT 99, Vol 10, Ed By D G Morris, S Naka, and P Caron, WILEY-VCH Weinheim, Germany, 2000, 15- 2 1
3 , E. L. Hibner, "A New Age-Hardenable Corrosion Resistant Alloy for Deep Sour Gas Well Service", Superalloys 718, 625, 706, and Various Derivatives, Ed. E. A. Loria, (Warrendale, PA: TMS, 1 WI) , 895-903.
4 P Ganessan. E F Clathorthy, and J A Harris, "Development of a Time -Temperature- Transformation Diagram for Alloy 925". Corrosion, Vol 44, No 11, 1988. 827-835
5 K . A Heck, "The Time- Temperature-Transformation Behavior of Alloy 706", Superalloys 718, 625, 706, and Various Derivatives, Ed. E. A. Loria, (Warrendale , PA: TMS, 1994), 393- 401
6. S. K. Mannan, S. J. Patel, and J. J. deBarbadillo, "Long Term Thermal Stability of INCONEL Alloys 718, 706, 909, and WASPALOY at 593°C and 704"Cn, Superalloys 2000, Ed. T. M ~ o l l o c k et al, (PA: Warrendale, PA: TMS, 2000), 449-458.
7. M. G. Bruke, and M. K. miller, "Precipitation in Alloy 718: A combined AEM and APFIM Investigation", Superallovs 718, 625, 706, and Various Derivatives, Ed. E. A. Loria, (Warrendale, PA: TMS, 1991), 337-350.
8. C. T. Sims, N . S. Stoloff, and W. C. Hagel. Superalloys 11, (John Wiley & Sons, New York, 1987), 105
9 M. Prager. and C. S. Shira, "Welding of Precipitation-Hardening Nickel-Base Alloys", Welding Research Council Bulletin # 128, February 1968.
10. S . T. Wlodek. "The Stability of Superalloys", Long Term Stability of High Temperature Wlaterials, Ed. G. E. Fuchs, K. A. Dannemann, and T. C. Deragon, (Warrendale, PA: TMS, 1999).