Tier 2 Useful Life (120,000 miles) Exhaust Emission ...Presented at the SAE 2006 World Congress,...
14
NREL/CP-540-39010. Posted with permission. Presented at the SAE 2006 World Congress, April 3-6, 2006, Detroit, Michigan 2006-01-0424 Tier 2 Useful Life (120,000 miles) Exhaust Emission Results for a NO x Adsorber and Diesel Particle Filter Equipped Light-Duty Diesel Vehicle Marek Tatur, Dean Tomazic FEV Engine Technology Matthew Thornton National Renewable Energy Laboratory John Orban, Elizabeth Slone Battelle Memorial Institute Copyright © 2006 SAE International ABSTRACT Due to its high efficiency and superior durability, the diesel engine is again becoming a prime candidate for future light-duty vehicle applications within the United States. While in Europe the overall diesel share exceeds 40%, the current diesel share in the United States is 1%. Despite the current situation and the very stringent Tier 2 emission standards, efforts are being made to introduce the diesel engine back into the U.S. market. In order to succeed, these vehicles have to comply with emissions standards over a 120,000 miles distance while maintaining their excellent fuel economy. The availability of technologies—such as high-pressure, common-rail fuel systems; low-sulfur diesel fuel; oxides of nitrogen (NO x ) adsorber catalysts or NACs; and diesel particle filters (DPFs)—allow the development of powertrain systems that have the potential to comply with the light-duty Tier 2 emission requirements. In support of this, the U.S. Department of Energy (DOE) teamed with industry to engage in several testing projects under the Advanced Petroleum Based Fuels – Diesel Emission Controls (APBF-DEC) activity [1; 2; 5; 6; 7; 8]. Three of the APBF-DEC projects evaluated the sulfur tolerance and durability of NAC/DPF systems on various platforms, and one evaluated the performance and durability of a selective catalytic reduction (SCR) system in heavy-duty engines. A fifth project investigated the effects of oil properties on the performance and durability of a NAC. This project investigated the performance of the emission control system and system desulfurization effects on regulated and unregulated emissions in a light-duty diesel engine. Emissions measurements were conducted over the Federal Test Procedure (FTP), the US06 [an aggressive chassis dynamometer emissions test procedure, part of the Supplemental Federal Test Procedure (SFTP)], and the Highway Fuel Economy Test (HFET). Testing was conducted after the accumulation of 150 hours of engine operation calculated to be the equivalent of approximately 8,200 miles. For these evaluations, three out of six of the FTP test cycles were within the 50,000-mile Tier 2 bin 5 emission standards [0.05 g/mi NO x and 0.01 g/mi particulate matter (PM)]. Emissions over the SC03 (air- conditioning test) portion of the SFTP were within limits of the 4,000-mile SFTP standards. Emissions of NO x +NMHC (non-methane hydrocarbons) exceeded the 4,000-mile SFTP standards over the US06 portion of the SFTP. Testing was also conducted after the accumulation of 1,000 hours of engine operation calculated to be the equivalent of approximately 50,000 miles. The results were reported in [7] 2005-01-1755. Recalibrated drivability maps resulted in more repeatable NO x emissions from cycle to cycle. The NO x level was below the Tier 2 emission limits for 50,000 and 120,000 miles. NMHC emissions were found at a level outside the limit for 120,000 miles. INTRODUCTION The NAC/DPF concept has shown promising results on a light-duty platform with a new, but degreened emission control system. The platform development process and the control strategies were already discussed as part of an SAE paper published 2004 and 2005 [1; 7]. Following this development phase, an aging process with a target of 2,200 hours was initiated. The 2,200 hours represent the useful lifetime of the emission control system (equivalent to 120,000 miles). Details regarding the aging procedure and the emission control systems are provided in following sections.
Transcript of Tier 2 Useful Life (120,000 miles) Exhaust Emission ...Presented at the SAE 2006 World Congress,...

NREL/CP-540-39010. Posted with permission. Presented at the SAE 2006 World Congress, April 3-6, 2006, Detroit, Michigan 2006-01-0424
Tier 2 Useful Life (120,000 miles) Exhaust Emission Results for a NOx Adsorber and Diesel Particle Filter Equipped Light-Duty
Diesel Vehicle
Marek Tatur, Dean Tomazic FEV Engine Technology
Matthew Thornton National Renewable Energy Laboratory
John Orban, Elizabeth Slone Battelle Memorial Institute
Copyright © 2006 SAE International
ABSTRACT
Due to its high efficiency and superior durability, the diesel engine is again becoming a prime candidate for future light-duty vehicle applications within the United States. While in Europe the overall diesel share exceeds 40%, the current diesel share in the United States is 1%. Despite the current situation and the very stringent Tier 2 emission standards, efforts are being made to introduce the diesel engine back into the U.S. market. In order to succeed, these vehicles have to comply with emissions standards over a 120,000 miles distance while maintaining their excellent fuel economy. The availability of technologies—such as high-pressure, common-rail fuel systems; low-sulfur diesel fuel; oxides of nitrogen (NOx) adsorber catalysts or NACs; and diesel particle filters (DPFs)—allow the development of powertrain systems that have the potential to comply with the light-duty Tier 2 emission requirements. In support of this, the U.S. Department of Energy (DOE) teamed with industry to engage in several testing projects under the Advanced Petroleum Based Fuels – Diesel Emission Controls (APBF-DEC) activity [1; 2; 5; 6; 7; 8]. Three of the APBF-DEC projects evaluated the sulfur tolerance and durability of NAC/DPF systems on various platforms, and one evaluated the performance and durability of a selective catalytic reduction (SCR) system in heavy-duty engines. A fifth project investigated the effects of oil properties on the performance and durability of a NAC.
This project investigated the performance of the emission control system and system desulfurization effects on regulated and unregulated emissions in a light-duty diesel engine. Emissions measurements were conducted over the Federal Test Procedure (FTP), the US06 [an aggressive chassis dynamometer emissions
test procedure, part of the Supplemental Federal Test Procedure (SFTP)], and the Highway Fuel Economy Test (HFET). Testing was conducted after the accumulation of 150 hours of engine operation calculated to be the equivalent of approximately 8,200 miles. For these evaluations, three out of six of the FTP test cycles were within the 50,000-mile Tier 2 bin 5 emission standards [0.05 g/mi NOx and 0.01 g/mi particulate matter (PM)]. Emissions over the SC03 (air-conditioning test) portion of the SFTP were within limits of the 4,000-mile SFTP standards. Emissions of NOx+NMHC (non-methane hydrocarbons) exceeded the 4,000-mile SFTP standards over the US06 portion of the SFTP. Testing was also conducted after the accumulation of 1,000 hours of engine operation calculated to be the equivalent of approximately 50,000 miles. The results were reported in [7] 2005-01-1755. Recalibrated drivability maps resulted in more repeatable NOx emissions from cycle to cycle. The NOx level was below the Tier 2 emission limits for 50,000 and 120,000 miles. NMHC emissions were found at a level outside the limit for 120,000 miles.
INTRODUCTION
The NAC/DPF concept has shown promising results on a light-duty platform with a new, but degreened emission control system. The platform development process and the control strategies were already discussed as part of an SAE paper published 2004 and 2005 [1; 7]. Following this development phase, an aging process with a target of 2,200 hours was initiated. The 2,200 hours represent the useful lifetime of the emission control system (equivalent to 120,000 miles). Details regarding the aging procedure and the emission control systems are provided in following sections.

The aging process was interrupted by evaluation cycles to monitor system performance. Cold and hot UDDS (Urban Dynamometer Driving Schedule - the first two bags of the FTP-75) simulations as well as US06 and HFET cycle simulations, were tested repeatedly throughout the aging process to gain statistical confidence in the emission results. In addition to the engine dynamometer test cell transient cycles, the emission control system was tested on the vehicle at the U.S. Environmental Protection Agency National Vehicle and Fuel Emissions Laboratory (EPA-NVFEL) in Ann Arbor, Michigan, over the FTP, US06, HFET, and SC03.
PROGRAM OBJECTIVES
The main objective of the APBF-DEC activity is to investigate the sulfur tolerance and durability of different aftertreatment systems such as the NAC/DPF combination. An additional project has been initiated under this activity to evaluate SCR technologies.
An integral part of the program is to demonstrate the capability of a state-of-the-art engine and emission control system (ECS) combination to achieve the Tier 2 Bin 5 emission levels.
Figure 1 illustrates several different emission regulation limits, as well as the certification level for the base vehicle, along with the optimized engine-out emissions level for the project vehicle with the FEV prototype engine installed. With the improved engine-out calibration, the ECS requirements to achieve Tier 2 Bin 5 levels correspond to 82% NOx conversion efficiency and 83% PM reduction. The ECS was aged up to 2,200 hours with a fuel sulfur level of 15 ppm to allow an assessment of its impact on the durability of the systems. The detailed fuel specifications for this project are presented in Appendix A.
PM [g
/mile
]
0.00
0.02
0.04
0.06
0.08
0.10
NOx [g/mile]0.0 0.2 0.4 0.6 0.8 1.0 1.2 1.4
TIER 2BIN 5 TIER 2
BIN 8
EU 4
EU 3
TIER 1
Audi A4 1.9 l TDIStation Wagon
European Certification
Optimized engine-out emission calibration
Figure 1: Emissions Legislation and Initial Vehicle Results
HARDWARE DEFINITION
As the hardware definition was discussed in great detail in the preceding publications [1; 2; 7], the following chapters include the main specifications in tabular form.
ENGINE HARDWARE
The engine used in this project was designed to accommodate the increased demands of emission reduction development. The crankcase, crankshaft, and connecting rods are mass-production parts. The cylinder head and the pistons are proprietary components developed by FEV Engine Technology specifically for emission reduction applications. Table 1 shows relevant details of this engine configuration [1; 2; 7].
Table 1: Diesel Future II Engine Specifications
Arrangement In-Line 4-Cylinder Displacement 1.9 L Rated Power 100 kW @ 4000 rpm Max. Torque 330 Nm @ 2000 rpm Bore/Stroke 79.5 mm / 95.5 mm
Turbocharger Garrett GT 17 V Injection System Bosch Common Rail, 2nd Gen.
Valves 2 x Intake / 2 x Exhaust Compression Ratio 18.2 : 1
VEHICLE HARDWARE
A model year 2001 Audi A4 Avant (station wagon) was selected as the project vehicle. This body style was readily available in the United States equipped with various gasoline engines. The OEM (original equipment manufacturer) engine was then removed and replaced with the Diesel Future II engine as described previously. Figure 2 shows a photograph of the project vehicle.
Figure 2: Project Vehicle Audi A4 Avant
More detailed vehicle data are listed in Table 2.
Table 2: Project Vehicle Specifications
Vehicle Mass 1540 kg Transmission 5-Speed Manual Total Length 4544 mm Total Height 1429 mm Total Width 1766 mm Air Drag Coefficient cD = 0.3

EMISSION CONTROL SYSTEM SPECIFICATON
The catalysts were designed and developed together with a MECA (Manufacturers of Emissions Controls Association) program participant. The catalyst system utilized an exhaust piping with dual wall insulation, which considerably decreased the thermal losses especially during cold-start and low-load operation. The dual wall insulating piping was also provided by a MECA program participant.
Figure 3 illustrates the fully instrumented emission control system, which comprised a close-coupled pre-catalyst, underbody catalyst, and the DPF (arrangement described from left to right).
Figure 3: Instrumented Emission Control System
Table 3: Emission Control System Catalyst Specifications
Pre-NAC
t
UB- NAC
DPF
Volume [l] 1.34 2.5 4.1
Diameter [in] 4.16 5.66 5.66 Length [in] 6.0 6.0 10.0
Substrate Material
[-] Cord Cord SiC
Wall Thickness
[mil] 4.5 4.5 14
Cell Density [cpsi] 400 400 200
TESTING AND AGING CYCLES
ENGINE DYNAMOMETER TEST CELL AGING CYCLE
This aging protocol was based on the simulated adaptation of the LA92 driving cycle, a higher speed and high-acceleration cycle, which is also referred to as the Unified Cycle. This cycle includes a high percentile of in-use driving conditions and is more aggressive than the FTP-75 with higher speed, higher acceleration, fewer stops, and less idle time. The second main goal was a 10-minute cycle duration so that no single-speed load point was held for any extended period of time. The cycle was repeated until the accumulated time for the evaluation tests was reached. FEV proposed additional evaluation points during the aging procedure itself in
order to allow continuous assessment of the catalyst performance.
This driving cycle was transformed into 14 steady-state points that were operated consecutively for 43 seconds, each resulting in the desired 10-minute cycle. During the evaluation tests of this cycle, it became apparent that the temperature profile that the ECS was exposed to was much higher than during the driving cycle itself. Therefore, the points with temperatures above 450°C were moved towards higher engine speed and lower load to decrease the catalyst inlet temperature while maintaining the same fuel flow. Table 4 shows the resulting operating points that are used in the aging cycle.
Table 4: Steady-State Aging Operating Points
Point Engine Speed [rpm]
BMEP[bar]
Effective Power [kW]
1 1000 1.0 1.6 2 1230 1.8 3.5 3 1510 0.8 1.9 4 1570 2.8 7.0 5 1650 4.3 11.2 6 2850 4.6 20.8 7 2400 6.6 25.1 8 3100 6.5 31.9 9 3050 6.9 33.3
10 3050 4.9 23.7 11 2100 4.5 15.0 12 2000 2.0 6.3 13 1500 6.0 14.3 14 1200 4.3 8.2
Based on the effective power output of the engine and the vehicle specific data the respective calculated vehicle speed during each operating condition could be calculated from the following equation:
gmfvAc
Pv
Dair
Engine
⋅⋅+⋅⋅⋅⋅=
2
21 ρ
(1)
As the residence time during each of the operating points was known as well as the time spent during the evaluation cycles, an accurate assessment of the overall distance could be calculated. With the aging time of 2,200 hours the distance was approximately 120,000 miles.
VEHICLE CHASSIS DYNAMOMETER TEST CELL CYCLES
During the evaluations on the vehicle chassis dynamometer, four cycles were tested:
1. UDDS/LA4 (Bag 1 and Bag 2 of the FTP-75 Cycle) 2. US06 3. HFET 4. SC03.

Table 5 lists the details regarding length, average speed, and maximum speed for each cycle.
Table 5: Test Cycle Details
Cycle Length Average Speed
Maximum Speed
Remarks
UDDS 12.07 km 7.5 mi
31.6 km/h 19.6 mi/h
91.8 km/h 56.7 mi/h
Urban driving
US06 12.9 km 8.01 mi
77.9 km/h 48.4 mi/h
129.3 km/h 80.3 mi/h
Aggressive high-speed driving
HFET 16.52 km 10.26 mi
77.8 km/h 48.3 mi/h
96.4 km/h 59.9 mi/h
Highway driving, fuel economy
SC03 5.8 km 3.6 mi
34.8 km/h 21.6 mi/h
88.2 km/h 54.8 mi/h
Additional load due to AC and high ambient temperature
TEST ENVIRONMENT
AGING AND EVALUATION TEST CELL
The aging and evaluation test cell was equipped with the following equipment:
Horiba 7100 XGR for gaseous emissions [NOx, hydrocarbon (HC), carbon monoxide
(CO), carbon dioxide (CO2) and oxygen (O2)] ADAPT 4.5 test cell controls FEV CVS with tunnel 2 Horiba CFV with 330 cfm (provides ability to
run 330 and 660 cfm tests) Pierburg PS2000 particulate sampling system UUT (Unit Under Test) transient cycle controller.
VEHICLE CHASSIS DYNAMOMETER TEST CELL
Vehicle testing was conducted at the EPA-NVFEL in Ann Arbor, Michigan. The vehicle was tested using a 48"-diameter single-roll, electric chassis dynamometer. Table 6 contains a summary of the analytical systems used for the vehicle tests.
Table 6: Summary of Laboratory Analytical Equipment
Category Analytical Equipment CO/ CO2 Horiba AIA-210/220 NDIR HC Horiba FIA-220 FID CH4 Horiba GFA-220 GC/FID THC Horiba FIA-220 HFID NOx Horiba CLA-220 HCLD PM EPA sampling system CVS Horiba VETS 9000 subsonic venturi
TEST RESULTS
ENGINE DYNAMOMETER TEST CELL
During the course of aging, the catalyst system was evaluated frequently in order to assess its degradation in
performance due to sulfur poisoning and thermal aging. The initial tests were performed at 0 hours with fresh catalysts. The subsequent test series were performed before and after the desulfurization events at 150 and 300 hours of aging. After the 300-hour mark the desulfurization/evaluation cycle frequency was increased to every 100 hours up to 1600 hours of aging. Starting at 1,600 hours, desulfurizations and evaluations were performed every 50 hours.
The average NOx emission results are displayed in Figure 5. Tier 2 Bin 5 useful life standards are included for reference and appear as a horizontal lines (intermediate and useful life standards).
Cold- and hot-start UDDS (or LA4) cycles were performed at the aging marks depicted in Figure 5. Due to the steep increase in pre-desulfurization NOx, the desulfurization frequency was increased after the 1,600-hour mark to every 50 hours.
The composite FTP emissions, which comprised 43% cold-start emissions and 57% hot-start emissions, are illustrated in Figure 6. Note that some of the evaluations consisted only of replicate hot UDDS cycles.
With the increased desulfurization frequency the composite FTP tailpipe NOx emissions post desulfurization after 2,200 hours could be maintained below the emission standard for 120,000 miles of 0.07 g/mile. A detailed statistical analysis of NOx emissions results from the test cell is discussed in the ‘STATISTICAL ANALYSIS’ chapter.
The bars represent the average NOx numbers while the circles above and in the bars show the maximum and minimum numbers for the associated procedure. Figure 4 shows an example of the setup of each emissions graph.
Em
issi
on [g
/mile
]
0.0000.0250.0500.0750.1000.1250.1500.1750.2000.2250.2500.2750.300
0
100
200
300
400
500
600
700
800
900
1000
Emission species
Maximum number in test sequence Average number of
corresponding procedure
Minimum number in test sequence
Pre-desulfurizationevaluation
Post-desulfurizationevaluationAging time
Figure 4: Emissions graph setup
Three average bars during one evaluation period indicate one additional evaluation procedure capturing unregulated emissions, not subject of discussion in this paper.

During the evaluation procedure at 1,300 hours the NOx adsorber regeneration failed to operate, therefore the tailpipe emissions should not be considered in the efficiency processing.
NO
x [g
/mi]
0.00
0.05
0.10
0.15
0.20
0.25
0.30
0.35
1100
1200
1300
1400
1500
1600
1700
1800
1900
2000
2100
2200
NOx
Aging Hours
NO
x [g
/mi]
0.00
0.05
0.10
0.15
0.20
0.25
0.30
0.35
0
100
200
300
400
500
600
700
800
900
1000
NOx
Cold UDDS
NO
x [g
/mi]
0.00
0.05
0.10
0.15
0.20
0.25
0.30
0.35
1100
1200
1300
1400
1500
1600
1700
1800
1900
2000
2100
2200
NOx
Aging Hours
No Regenerations
NO
x [g
/mi]
0.00
0.05
0.10
0.15
0.20
0.25
0.30
0.35
0
100
200
300
400
500
600
700
800
900
1000
NOx
Hot UDDS
Figure 5: Cold and Hot UDDS NOx Emissions
FTP Composite NOx Emissions
0.00
0.05
0.10
0.15
0.20
0.25
0 250 500 750 1000 1250 1500 1750 2000 2250
Age (hours)
NOx
(g/m
i)
Figure 6: Composite FTP Emissions
As illustrated by the data in Figure 7, the PM emissions were low through out most of the 2200 hours of aging of the ECS. There were two instances where the composite PM emissions were above the emission standard of 0.01 g/mi. These higher emission numbers were a result of a high-soluble organic fraction on the cold UDDS filters. After a DPF failure during the 1,000-hour vehicle tests, the DPF was replaced, and the aging was continued. The performance of the new DPF remained at the high level as observed with the first DPF.
The remaining UDDS-regulated emissions and fuel economy results, as well as the results for the US06 and HFET simulation cycles, are presented in Appendix B.
FTP Composite PM Emissions
0.000
0.003
0.006
0.009
0.012
0.015
0 250 500 750 1000 1250 1500 1750 2000 2250
Age (hours)
PM (g
/mi)
Figure 7: Composite PM Emissions
VEHICLE CHASSIS DYNAMOMETER
After 150, 1,000, and 2,200 hours (equivalent to roughly 8,200, 50,000, and 120,000 odometer miles, respectively) of aging the ECS was installed on the project vehicle and tested at the EPA-NVFEL in Ann Arbor, Michigan. The matrix of tests performed on the chassis dynamometer is shown in Table 7.
Table 7: Vehicle Emissions Test Matrix
Day Test and Test Order 1 CUDDS HUDDS HFET HFET US06 HUDDS
2 CUDDS HUDDS HFET HFET US06 HUDDS
3 CUDDS HUDDS HFET HFET US06 HUDDS 4 CUDDS HUDDS HFET HFET US06 HUDDS
5 CUDDS HUDDS SC03 SC03 SC03 HUDDS
6 CUDDS HUDDS SC03 SC03 SC03 HUDDS
Overall, engine dynamometer test cells were consistent with the vehicle chassis dynamometer results.

For the 120,000-mile emission test, day 5 and 6 were omitted as the SFTP results for 120,000 miles were of lower priority for the project, furthermore useful life requirements over the SFTP do not exist.
Figures 8 through 12 show the composite FTP results. The average result is represented by the bar height, and the minimum and maximum results are represented by the error bars.
At the 150-hour test, the vehicle performance over the cold UDDS cycle resulted in highly variable NOx emissions. Consequently some effort was subsequently undertaken to improve the drivability of the vehicle on the chassis dynamometer; this resulted in more stable NOx emissions during the 1,000-hour evaluation. As a result of a DPF failure after the first day of testing, the PM numbers increased steadily throughout the test series. In order to assess the emission control performance for the remaining emissions the DPF was not replaced after the failure became apparent. NMHC as well as CO show an increase between 150 and 1,000 hours of aging. The emission level for the 2,200-hour testing was found on a slightly higher level as during the 1,000-hour testing.
The composite test results show the NOx reduction potential for the developed concept. Throughout the aging it was possible to keep the NOx emissions on a level below the Tier 2 Bin 5 emission standard. The average of the FTP composite NOx emissions was found at 0.07 g/mi after 120,000 miles of aging. The THC emissions are the only species that exceed the emission standard of Tier 2 Bin 5 but remains below the Bin 8 standard.
FTP Composite Vehicle and Engine DynoNOx Observed Means and Ranges
0.00
0.07
0.14
0.21
0.28
0.35
EngineDyno
VehicleDyno
EngineDyno
VehicleDyno
EngineDyno
VehicleDyno
EngineDyno
VehicleDyno
EO 150 1000 2200
Engi
ne O
ut N
Ox
(g/m
i)
0.00
0.07
0.14
0.21
0.28
0.35
Tailp
ipe
NO
x (g
/mi)
Figure 8: Composite FTP NOx Emission Results
FTP Composite Vehicle and Engine DynoTHC Observed Means and Ranges
0.0
1.0
2.0
3.0
4.0
5.0
EngineDyno
VehicleDyno
EngineDyno
VehicleDyno
EngineDyno
VehicleDyno
EngineDyno
VehicleDyno
EO 150 1000 2200
Enig
ine
Out
TH
C (g
/mi)
0.0
0.1
0.2
0.3
0.4
0.5
Tailp
ipe
THC
(g/m
i)
Figure 9: Composite FTP THC Emission Results
FTP Composite Vehicle and Engine DynoCO Observed Means and Ranges
0.0
2.0
4.0
6.0
8.0
10.0
12.0
EngineDyno
VehicleDyno
EngineDyno
VehicleDyno
EngineDyno
VehicleDyno
EngineDyno
VehicleDyno
EO 150 1000 2200
Engi
ne O
ut C
O (g
/mi)
0.0
0.2
0.4
0.6
0.8
1.0
1.2
Tailp
ipe
CO
(g/m
i)
Figure 10: Composite FTP CO Emission Results
FTP Composite Vehicle and Engine DynoParticulate Matter Observed Means and Ranges
0.00
0.10
0.20
0.30
0.40
0.50
0.60
0.70
0.80
0.90
EngineDyno
VehicleDyno
EngineDyno
VehicleDyno
EngineDyno
VehicleDyno
EngineDyno
VehicleDyno
EO 150 1000 2200
Engi
ne O
ut P
M (g
/mi)
0
0.01
0.02
0.03
0.04
0.05
0.06
0.07
0.08
0.09
Tailp
ipe
PM
(g/m
i)
Figure 11: Composite FTP Particulate Matter Emission Results

FTP Composite Vehicle and Engine DynoFuel Economy Observed Means and Ranges
25
27
29
31
33
35
37
39
EngineDyno
VehicleDyno
EngineDyno
VehicleDyno
EngineDyno
VehicleDyno
EngineDyno
VehicleDyno
EO 150 1000 2200
Engi
ne O
ut F
E (m
i/gal
)
25
27
29
31
33
35
37
39
Tailp
ipe
FE (m
i/gal
)
Figure 12: Composite FTP Fuel Economy Results
STATISTICAL ANALYSIS
Statistical analyses were performed to characterize trends in emissions levels over the 2,200 hours of testing. Two sets of data were used in this analysis: (1) Data collected between 300 and 1,600 hours when desulfurizations were performed every 100 hours, and (2) data collected after 1,600 hours when desulfurizations were performed every 50 hours. The limited data collected prior to 300 hours, based on 150-hour cycles, were not included in the trend analysis. To account for the evaluations consisting of only the hot UDDS cycles, an imputation method was developed to estimate the cold UDDS and resulting FTP composite NOx emissions results. The statistical analysis is based on a combination of imputed and actual FTP composite results. Figure 13 illustrates the degradation in catalyst performance between desulfurizations and the effectiveness of the desulfurization process at restoring performance. A log-linear model was fit to estimate average trends and evaluate statistical significance. The upper graph demonstrates that the average loss in NOx reduction efficiency (FTP composite) between desulfurizations varies 15% to 35% prior to 1,600 hours. After the desulfurization strategy changed at 1,600 hours, the loss in NOx reduction efficiency was generally 10%. There was a slight drop between 1,800 and 2,000 hours that could not be explained. The lower graph demonstrates that prior to 1600 hours there is an increase in average NOx reduction efficiency of 10% to 35% at each desulfurization event. After 1,600 hours, there is on average a 10% improvement in NOx reduction efficiency at each desulfurization event, with a higher trend between 1,800 and 2,000 hours. Combined these graphs indicate that the performance of the desulfurization process was relatively unstable with the 100-hour desulfurization strategy, but was quite consistent with the 50-hour desulfurization strategy.
Change in NOX Reduction Efficiency (% of Engine Out NOX) Between Desulfations
-80%
-70%
-60%
-50%
-40%
-30%
-20%
-10%
0%
10%
300 600 900 1200 1500 1800 2100
Age (hours)
NO
X R
educ
tion
Effic
ienc
y
Difference Difference Trend
Increase in NOX Reduction Efficiency (% of Engine Out NOX) at Each Desulfation
0%
10%
20%
30%
40%
50%
60%
70%
300 600 900 1200 1500 1800 2100
Age (hours)
NO
X R
educ
tion
Effic
ienc
y
Difference (Post-Pre) Difference Trend
Figure 13: NOx Reduction Efficiency Behavior over Time
Figure 14 shows the trends in FTP composite NOx reduction efficiency relative to engine-out emissions using two sets of data: Data collected between 300 and 1,600 hours under the 100-hour aging cycle and data collected between 1,600 and 2,200 hours under the 50-hour aging cycle. To account for the effects of the desulfurization process, separate log-linear models were fit to three subsets of NOx emissions data: (1) measurements made before a desulfurization event, (2) measurements made after a desulfurization event, and (3) the average of measurements made at the beginning (post-desulfurization) and end (pre-desulfurization) of each aging period. The latter results plotted at the midpoint of the aging period represent the best estimate of the average emissions over time; however, we could not verify that the increase in NOx emissions within an aging period is linear.

0.00
0.06
0.12
0.18
0.24
0.30
300 600 900 1200 1500 1800 2100
Age (hours)
NO
x (g
/mi)
Pre-Desulf at ion Average Post -Desulf at ion
Pre-Desulf at ion Trend - Pre 1650 Average Trend - Pre 1650 Post -Desulf at ion Trend - Pre 1650
Pre-Desulf at ion Trend - Post 1650 Average Trend - Post 1650 Post -Desulf at ion Trend - Post 1650
0%
20%
40%
60%
80%
100%
300 600 900 1200 1500 1800 2100
Age (hours)
NO
x R
educ
tion
Effic
ienc
y
Pre Desulf at ion Average Post Desulf at ion
Pre-Desulf at ion Trend - Pre 1650 Average Trend - Pre 1650 Post -Desulf at ion Trend - Pre 1650
Pre-Desulf at ion Trend - Post 1650 Average Trend - Post 1650 Post -Desulf at ion Trend - Post 1650
Figure 14: NOx Emission and Reduction Efficiency Trends over Time
The trend in post-desulfurization emissions was not found to be statistically significant. However, the log-linear regression analyses demonstrated that there were statistically significant trends in both the average and pre-desulferization NOx emissions when the desulfurization strategy is based on 100-hour aging cycles. Because of the curvature in the trends, we performed additional analyses to determine if there were any persistent trends in the emissions results over time. This was accomplished by iteratively truncating the left-most data from each of the three data sets, then refitting the regression model, and evaluating the significance of the regression slope parameter. Through this process, we determined that when the analysis is applied to data collected between 700 and 1600 hours, we cannot demonstrate that the average and pre-desulfurization trends were statistically significant. None of the regression lines shown in Figure 14, based on the 50-hour desulfurization data, were found to have statistically significant trends.
A similar analysis strategy was applied to the observed fuel efficiency and CO, PM, HC emissions results; however; because there were no statistically significant differences between pre- and post-desulfurization results for these parameters, there was no advantage to using the imputation method to characterize trends. Fuel efficiency trends were found to be statistically significant; however when the analysis is restricted to data collected
after 400 hours, the trend is no longer significant. There were no observed trends in the pre- and post- desulfurization results for any of the observed emissions.
CONCLUSION
The developed integrated concept, which incorporates software and hardware solutions, shows considerable potential meeting future emission standards. Important aspects during the development were the modifications of the test engine and the engine-out emissions optimization. With the adjusted engine-out emissions level, the exhaust aftertreatment interventions were defined, developed, and refined. Due to the large portion of cold-start emissions, the rapid warm-up strategy, allowing fast catalyst light-off, was optimized. DPF and desulfurization regeneration strategies were developed focusing on catalyst lifetime durability and fuel consumption.
The development of the concept was concluded by a useful lifetime aging process. As expected the tailpipe NOx emissions continuously increased. The desulfurization procedure reversed the sulfur poisoning to an extent that allowed meeting the emission standards throughout the aging duration. It was found that the desulfurization frequency needed to be increased throughout the useful life, while the first 250 hours did not indicate significant sulfur poisoning, considerable emissions performance degradation was observed towards the end of the useful life aging process. The frequency of the desulfurization was increased and the tailpipe NOx emissions remained below the emissions standard after this procedure.
There are remaining challenges that need to be addressed, such as the increase in HC emissions over catalyst life.
ACKNOWLEDGMENTS
The authors would like to thank the members of the APBF-DEC Steering Committee, the ABPF-DEC NOx adsorber Workgroup, the National Renewable Energy Laboratory, Oak Ridge National Laboratory, EPA, and DOE for their support and guidance. This project and all of the ABPF-DEC activities are being conducted with the cooperation of engine and vehicle manufacturers, emission control device manufacturers, energy and additive companies, California State agencies, and the EPA. Representatives from all of these organizations and their member companies are represented on the steering committee and the workgroups. In particular, the authors thank Kevin Stork and Steve Goguen in the DOE FreedomCAR and Vehicle Technologies Program for their financial support of this activity. This project would not be possible without their help and technical support.

REFERENCES
1. Tomazic D., Tatur M., Thornton M. “Development of a Diesel Passenger Car Meeting Tier 2 Emissions Levels,” SAE Paper 2004-01-0581, March 2004, Detroit, Michigan.
2. Tomazic D., Tatur M., Thornton M. “APBF-DEC NOx Adsorber/DPF Project: Light-Duty Passenger Car Platform,” DEER Paper, August 2003, Newport, Rhode Island.
3. Geckler S., Tomazic D., et al. “Development of a Desulfurization Strategy for a NOx Adsorber Catalyst System,” SAE Paper 2001-01-0510, March 2001, Detroit, Michigan.
4. McDonald, J. “Progress in the Development of Tier 2 Light-Duty Diesel Vehicles,” SAE Paper 2004-01-1791, March 2004, Detroit, Michigan.
5. Webb, C., et al. “Achieving Tier 2 Bin 5 Emission Levels With a Medium-Duty Diesel Pick-Up and a NoDx Adsorber, Diesel Particulate Filter Emissions System-Exhaust Gas Temperature Management” SAE Paper 2004-01-0584.
6. Whitacre, S., et al. “Systems Approach to Meeting EPA 2010 Heavy-Duty Emission Standards Using a NoDx Adsorber Catalyst and Diesel Particle Filter on a 15l Engine” SAE Paper 2004-01-0587.
7. Tatur M., Tyrer H., Tomazic D., Thornton M., McDonald, J. “Tier 2 Intermediate Useful Life (50,000 miles) and 4000 Mile Supplemental Federal Test Procedure (SFTP) Exhaust Emission Results for a NOx Adsorber and Diesel Particle Filter Equipped Light-Duty Diesel Vehicle,” SAE Paper 2005-01-1755.
8. Thornton M., Tatur M., Tyrer H., Tomazic D. “Full Useful Life (120,000 miles) Exhaust Emission Performance of a NOx Adsorber and Diesel Particle Filter Equipped Passenger Car and Medium-Duty Engine in Conjunction with Ultra Low Sulfur Fuel,” DEER 2005.
CONTACT
Marek Tatur, FEV Engine Technology, Senior Engineer Diesel Combustion Systems. E-Mail: [email protected]
Matthew Thornton, National Renewable Energy Laboratory. E-Mail: [email protected]
DEFINITIONS, ACRONYMS, ABBREVIATIONS
APBF-DEC Advanced Petroleum-Based Fuels – Diesel Emissions Control
BTDC: Before Top Dead Center CA: Crank Angle CO: Carbon Monoxide CO2: Carbon Dioxide DOE U.S. Department of Energy DPF: Diesel Particle Filter ECM: Electronic Control Module ECS: Emission Control System ECU: Engine Control Unit EGR: Exhaust Gas Recirculation EPA: Environmental Protection Agency ETK: Emulator Task Kopf FSN: Filter Smoke Number FTP Federal Test Procedure FTP-75: Light-Duty Federal Test Procedure HC Hydrocarbon HFET: Highway Fuel Economy Test HSDI: High-Speed Direct Injection LA-4: Bag 1 and Bag 2 of the FTP-75 Cycle MECA Manufacturers of Emissions Controls
Association lpm: liters per minute NAC: NOx Adsorber Catalyst NMHC Non-Methane Hydrocarbon NO: Nitric Oxide NO2: Nitrogen Dioxide NOx: Oxides of Nitrogen O2 Oxygen OEM: Original Equipment Manufacturer PM: Particulate Matter RPM: Revolutions per Minute (engine speed) SC03: Air Conditioning Test SCR: Selective Catalytic Reduction THC: Total Hydrocarbon UDDS: Urban Dynamometer Driving Schedule US06: An aggressive chassis dynamometer
emissions test procedure, part of the Supplemental FTP
UUT Unit Under Test
APPENDIX
APPENDIX A: FUEL PROPERTIES
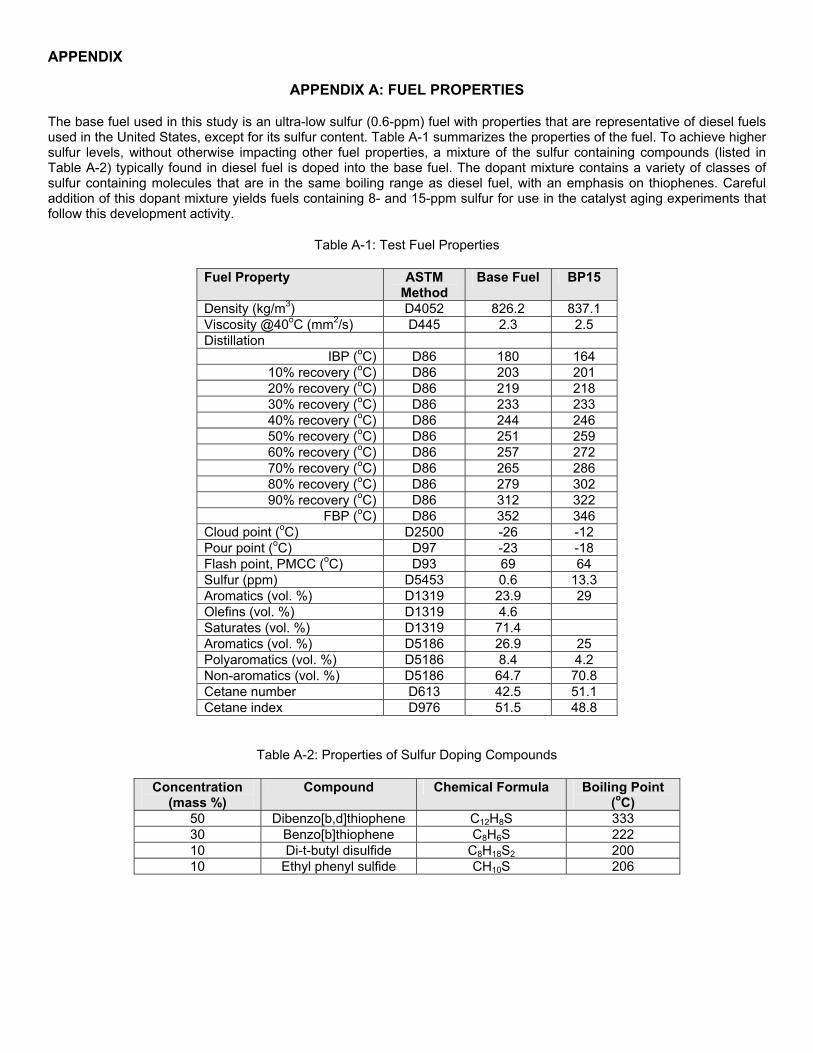
The base fuel used in this study is an ultra-low sulfur (0.6-ppm) fuel with properties that are representative of diesel fuels used in the United States, except for its sulfur content. Table A-1 summarizes the properties of the fuel. To achieve higher sulfur levels, without otherwise impacting other fuel properties, a mixture of the sulfur containing compounds (listed in Table A-2) typically found in diesel fuel is doped into the base fuel. The dopant mixture contains a variety of classes of sulfur containing molecules that are in the same boiling range as diesel fuel, with an emphasis on thiophenes. Careful addition of this dopant mixture yields fuels containing 8- and 15-ppm sulfur for use in the catalyst aging experiments that follow this development activity.
Table A-1: Test Fuel Properties
Fuel Property ASTM Method
Base Fuel BP15
Density (kg/m3) D4052 826.2 837.1 Viscosity @40oC (mm2/s) D445 2.3 2.5 Distillation
IBP (oC) D86 180 164 10% recovery (oC) D86 203 201 20% recovery (oC) D86 219 218 30% recovery (oC) D86 233 233 40% recovery (oC) D86 244 246 50% recovery (oC) D86 251 259 60% recovery (oC) D86 257 272 70% recovery (oC) D86 265 286 80% recovery (oC) D86 279 302 90% recovery (oC) D86 312 322
FBP (oC) D86 352 346 Cloud point (oC) D2500 -26 -12 Pour point (oC) D97 -23 -18 Flash point, PMCC (oC) D93 69 64 Sulfur (ppm) D5453 0.6 13.3 Aromatics (vol. %) D1319 23.9 29 Olefins (vol. %) D1319 4.6 Saturates (vol. %) D1319 71.4 Aromatics (vol. %) D5186 26.9 25 Polyaromatics (vol. %) D5186 8.4 4.2 Non-aromatics (vol. %) D5186 64.7 70.8 Cetane number D613 42.5 51.1 Cetane index D976 51.5 48.8
Table A-2: Properties of Sulfur Doping Compounds
Concentration (mass %)
Compound Chemical Formula Boiling Point (oC)
50 Dibenzo[b,d]thiophene C12H8S 333 30 Benzo[b]thiophene C8H6S 222 10 Di-t-butyl disulfide C8H18S2 200 10 Ethyl phenyl sulfide CH10S 206

APPENDIX B: TEST CELL EMISSION RESULTS
NOx Emissions
0.00
0.15
0.30
0.45
0.60
0.75
0 250 500 750 1000 1250 1500 1750 2000 2250
Age (hours)
NO
x (g
/mi)
Cold UDDS Hot UDDS US 06 HFET
PM Emissions
0.000
0.005
0.010
0.015
0.020
0.025
0 250 500 750 1000 1250 1500 1750 2000 2250
Age (hours)
PM (g
/mi)
Cold UDDS US 06 HFET Hot UDDS

HC Emissions
0.00
0.13
0.26
0.39
0.52
0.65
0 250 500 750 1000 1250 1500 1750 2000 2250
Age (hours)
HC
(g/m
i)
Cold UDDS Hot UDDS US 06 HFET
FTP Composite HC Emissions
0.0
0.1
0.2
0.3
0.4
0.5
0 250 500 750 1000 1250 1500 1750 2000 2250
Age (hours)
HC
(g/m
i)

CO Emissions
0.0
1.2
2.4
3.6
4.8
6.0
0 250 500 750 1000 1250 1500 1750 2000 2250
Age (hours)
CO
(g/m
i)
Cold UDDS Hot UDDS US 06 HFET
FTP Composite CO Emissions
0.0
0.5
1.0
1.5
2.0
2.5
0 250 500 750 1000 1250 1500 1750 2000 2250
Age (hours)
CO
(g/m
i)

Fuel Economy
20
30
40
50
60
70
0 250 500 750 1000 1250 1500 1750 2000 2250
Age (hours)
FE (m
i/gal
)
Cold LA4 (D15) Hot LA4 (D15) US 06 (D15) HWFET (D15)
FTP Composite Fuel Economy
28
30
32
34
36
38
0 250 500 750 1000 1250 1500 1750 2000 2250
Age (hours)
FE (m
i/gal
)