Tidal fronts and their role in air-sea gas exchange
33
Journal of Marine Research, 64, 483–515, 2006 Tidal fronts and their role in air-sea gas exchange by B. Baschek 1,2 , D. M. Farmer 1 and C. Garrett 3 ABSTRACT Tidal fronts are a common feature of many coastal environments. They are characterized by a surface convergence zone that enhances wave breaking and the generation of gas bubbles due to wave-current interaction. The associated downwelling currents carry bubbles to depths of up to 160 m and increase the amount of air that dissolves from them. An energetic tidal front is formed at the entrance to the Strait of Georgia, BC, Canada, by a hydraulically controlled sill flow with vertical velocities of up to 0.75 m s −1 . Extensive ship-board measurements during two cruises are interpreted with models of wave-current interaction and gas bubble behavior. The observations suggest that tidal fronts may contribute significantly to the aeration of the subsurface waters in the Fraser Estuary. This process may be also of importance for other coastal environments with plunging sill flows of dense water that deliver aerated surface water to intermediate depths. 1. Introduction Air-sea gas exchange plays a vital role in climate and has been the focus of continuing research, including observational and modeling studies. These studies have focused on the open ocean, although measurements are often conducted in more restricted environments such as lakes and in the laboratory where greater control can be exercised. There is, however, much interest in gas exchange in coastal waters – especially in densely populated areas where limiting dissolved oxygen conditions occur in subsurface waters. The focus of this paper is on the mechanisms by which air can be entrained, dissolved, and subducted to substantial depths through tidally forced flow-topography interaction in passages connecting semi-enclosed basins with the open ocean. This interaction represents an interplay between the internal fluid dynamical behavior and the surface wave field, leading to wave breaking and bubble subduction. Although the active areas participating in this way are quite small, the influence on the aeration of the exchanging water mass can be significant. 1. Institute of Ocean Sciences, Sidney, British Columbia, Canada, V8L 4B2. 2. Present address: Marine Chemistry and Geochemistry, Woods Hole Oceanographic Institution, Woods Hole, Massachusetts, 02543, U.S.A. email: [email protected] 3. School of Earth and Ocean Sciences, University of Victoria, Victoria, British Columbia, Canada V8W 2YZ. 483
Transcript of Tidal fronts and their role in air-sea gas exchange

Journal of Marine Research 64 483ndash515 2006
Tidal fronts and their role in air-sea gas exchange
by B Baschek12 D M Farmer1 and C Garrett3
ABSTRACTTidal fronts are a common feature of many coastal environments They are characterized by a
surface convergence zone that enhances wave breaking and the generation of gas bubbles due towave-current interaction The associated downwelling currents carry bubbles to depths of up to 160 mand increase the amount of air that dissolves from them
An energetic tidal front is formed at the entrance to the Strait of Georgia BC Canada by ahydraulically controlled sill flow with vertical velocities of up to 075 m sminus1 Extensive ship-boardmeasurements during two cruises are interpreted with models of wave-current interaction and gasbubble behavior The observations suggest that tidal fronts may contribute significantly to the aerationof the subsurface waters in the Fraser Estuary This process may be also of importance for other coastalenvironments with plunging sill flows of dense water that deliver aerated surface water to intermediatedepths
1 Introduction
Air-sea gas exchange plays a vital role in climate and has been the focus of continuingresearch including observational and modeling studies These studies have focused on theopen ocean although measurements are often conducted in more restricted environmentssuch as lakes and in the laboratory where greater control can be exercised There is howevermuch interest in gas exchange in coastal waters ndash especially in densely populated areas wherelimiting dissolved oxygen conditions occur in subsurface waters
The focus of this paper is on the mechanisms by which air can be entrained dissolvedand subducted to substantial depths through tidally forced flow-topography interaction inpassages connecting semi-enclosed basins with the open ocean This interaction representsan interplay between the internal fluid dynamical behavior and the surface wave fieldleading to wave breaking and bubble subduction Although the active areas participating inthis way are quite small the influence on the aeration of the exchanging water mass can besignificant
1 Institute of Ocean Sciences Sidney British Columbia Canada V8L 4B22 Present address Marine Chemistry and Geochemistry Woods Hole Oceanographic Institution Woods Hole
Massachusetts 02543 USA email bbaschekwhoiedu3 School of Earth and Ocean Sciences University of Victoria Victoria British Columbia Canada V8W 2YZ
483
484 Journal of Marine Research [64 4
Figure 1 The Fraser Estuary in British Columbia Canada
The Fraser River estuary in British Columbia Canada (Fig 1) is a highly productiveecosystem renowned for its salmon populations Oxygen concentrations however can dropin the Strait of Georgia to levels below 2ndash4 mL Lminus1 (Crean and Ages 1971 D MassonIOS Canada pers communication Fig 2) at which fish are affected negatively (Muumlllerand Stadelmann 2004) The ventilation of the Strait of Georgia is controlled by a sill atits entrance (Boundary Pass) that forms a pronounced barrier to flow through the Straitand causes intense mixing It is suggested that the mechanisms that supply oxygen to thesubsurface waters are as follows interaction of strong tidal currents with topography mixesdense water from the Pacific Ocean with relatively fresh oxygenated surface water Thiswater is further aerated by the generation and subduction of gas bubbles in the tidal frontsof Haro Strait At Boundary Pass it flows over a sill to intermediate depths from where theoxygen is likely to be transported by diffusion to the deeper parts of the Strait During therare deep water renewal events oxygen can be also delivered directly to the deep water inthe Strait of Georgia (LeBlond et al 1991 Masson 2002)
2006] Baschek et al Tidal fronts and their role in air-sea gas exchange 485
Figure 2 Oxygen section along the Fraser Estuary in July 2000 (D Masson IOS Sidney Canada)The Pacific Ocean is to the left the Strait of Georgia to the right and the sill at Boundary Pass atx = 180 km
Keeling (1993) suggests that bubbles make an important contribution to air-sea gasexchange in the open ocean at wind speeds above 10 m sminus1 and bubble plumes are com-monly observed down to 10ndash15 m (Vagle 1989 Crawford and Farmer 1987 Wallace andWirick 1992) In tidal fronts however gas bubbles are also injected into the ocean oncalm days as a consequence of the amplification of small waves in adverse currents Bubbleclouds can reach depths up to 160 m in the present situation
The objectives of this paper are to understand the physical processes relevant for thegeneration and entrainment of gas bubbles in tidal fronts and to estimate their contributionto air-sea gas exchange First we present measurements of the hydraulically controlledsill flow at Boundary Pass that forms an energetic tidal front over the sill crest Wavebreaking and the injection and dissolution of gas bubbles are calculated for this front withmodels of wave-current interaction and gas bubble behavior This leads to an estimate ofthe contribution of this and other tidal fronts to the aeration of the Fraser Estuary Thiscontribution is then compared to other oxygen sinks and sources It is finally shown that thephysical processes described here may also be relevant to the coastal ocean in other partsof the world
2 Instrumentation
Two research cruises were carried out with the research vessel CCGS Vector in HaroStrait and Boundary Pass in October 1999 and September 2000 Measurements were takenwith an ADCP an echo sounder a CTD and an Acoustical Resonator for measuring bubblesize distributions
The 150 kHz workhorse ADCP from RDI was mounted on a strut on the side of the vesselat a depth of 1 m The instrument has a bandwidth of 39 kHz and a beam angle of 20 Bottomtracking was used to convert the data from ship-coordinates to earth-coordinates allowingfor a direct correction of the alignment angle The shiprsquos position and heading were provided
486 Journal of Marine Research [64 4
by a differential GPS-receiver and a flux gate compass Measurements were taken every 1 sand averaged to create 10 s ensembles With a bin size of 4 m the ADCP measured theupper 200ndash300 m of the water column In spite of the strong horizontal current gradientsthe standard 4-beam solution can be used to calculate the current speed (Baschek 2003)
The acoustic backscatter intensity of the water column was measured with a 100 kHzecho sounder The transducer was mounted in the hull of CCGS Vector at a depth of 2 mThe receiver band width was set to 5 kHz the transmission interval to 05 s and the pulsewidth to 03 ms An Acoustical Resonator was used for measuring bubble size distributionsin the tidal fronts (Farmer et al 1998) With a frequency range of 6ndash196 kHz gas bubbleswith radii of 15ndash550 microm can be detected The Seabird SBE-19 CTD was calibrated priorto the cruises Salinity samples were taken from different depths for recalibration after thecruises
Measurements in the tidal fronts were carried out at ebb and flood tide In order tominimize the shiprsquos speed through the water to reduce the wire angle repeated profiles wereacquired with the CTD or Acoustical Resonator while the ship traveled in the directionof the currents Additional CTD stations were carried out for hydrographic backgroundmeasurements Repeated profiles using the Acoustical Resonator in the upper 60 m werecarried out while the ship remained stationary in the tidal front These measurements wererepeated several times over a tidal period to map the temporal evolution of the front Inorder to minimize spring-neap tidal variations the two cruises were carried out at a timewhen the tidal currents were of similar amplitude
3 Tidal fronts
Tidal fronts can be defined as sharp transition zones between two water masses of differentdensity and (tidal) current speed They are characterized by converging flow at the seasurface which causes enhanced wave breaking and the formation and subduction of gasbubbles Their surface expressions are clearly visible at the sea surface Tidal fronts can beformed by three different mechanisms inflow of dense water from an adjacent channel flowseparation past a headland (Farmer et al 2002) or flow over a shallow sill The observationsfrom the Fraser River estuary described here are of the latter type
The Fraser River delivers a mean discharge of 4400 m3 sminus1 to the estuary (Thomson1994) This water flows at the surface through Haro Strait and Juan de Fuca Strait into thePacific Ocean while beneath it saltier and denser water enters the estuary from the PacificOcean Superimposed on this mean circulation is a strong tidal regime with pronouncedspring-neap tidal variability (Pawlowicz 2002) which causes intense flow-topographyinteraction and mixing (Pawlowicz and Farmer 1998 Farmer et al 1995)
At Boundary Pass a steep sill is located between Saturna and Patos Island (Fig 3) andforms a pronounced barrier for the water exchange between Haro Strait and the Straitof Georgia With a mean slope of about 30 it rises from 200 m to 60 m depth and alsoblocks about 80 of the width of the passage At flood tide a hydraulically controlled flow
2006] Baschek et al Tidal fronts and their role in air-sea gas exchange 487
Figure 3 Chart of Haro Strait and Boundary Pass The solid lines and arrows indicate the approximatelocations of tidal fronts and flow direction during ebb tide the dashed lines during flood tide Thesmall map shows the measurement transects at the sill at Boundary Pass
488 Journal of Marine Research [64 4
develops over the sill and delivers oxygen rich water to intermediate depths of 150ndash250 mIts forcing changes significantly during the flood tide The moderate to intermediate andstrong forcing (Farmer and Armi 1986) and an additional stage of flow separation duringextreme forcing have been observed During strong and extreme forcing extensive gasbubble clouds are entrained into the ocean enhancing air-sea gas exchange Both of thesestages are discussed below
a Strong forcing
At 05ndash15 h after the ebb slack tide the sill flow at Boundary Pass is strongly forcedDense water flows from Boundary Pass over the sill into the Strait of Georgia Just down-stream of the sill crest this water meets an arrested surface layer with relatively fresh waterand subducts beneath it due to the density difference between the two water masses (Fig 4a)At the surface a distinct 50 m wide tidal front line forms It stretches from the south-easterntip of Saturna Island to the end of the sill close to Patos Island The flow is in the uncontrolledstate and the location of the plunge point depends only on the bathymetry the strength of thebarotropic forcing and the relative density difference to which it constantly adjusts (Armiand Farmer 2002)
An example of strongly forced flow is shown in Figure 5 It provides a quasi-synopticpicture of the flow field as it took only 6 min to complete this part of the transect while thetime scale over which the tidal currents change is sim2 h The dark red line of high backscatterintensity indicates the sea floor (A) The redorange area just above it (B) corresponds tothe sonar side lobe interaction with the sea floor and limits the depth of useful Dopplermeasurements The high backscatter intensities extending from the sea surface to about105 m depth (C) indicate mostly gas bubbles as verified by independent measurementswith an Acoustical Resonator The bubbles are injected close to the lower layer plungepoint and are carried down along the interface between upper and lower layer by strongvertical velocities of up to 075 m sminus1
The horizontal component within the dense overflow reaches 22 m sminus1 at the sill crestand 17 m sminus1 towards the bottom of the sill and prior to the transition to an internal hydraulicjump The strong lower layer currents are mainly orthogonal to the isobaths while the upperlayer currents are weak with variable flow directions A comparison of the measurementsat the sill crest and bottom of the sill show that the flow exchange across the shear layer isabout 60 of the lower layer flow (Baschek 2003) ie 60 of the flow has been entrainedinto the upper layer and 40 carries on At the plunge point the density difference betweenthe two water masses is 27 kg mminus3
The hydraulic sill flow and tidal front have significant influence on the aeration of inter-mediate water in the Strait of Georgia At flood tide dense water mixes with aerated surfacewater and delivers oxygen to subsurface waters It usually subducts to 150ndash200 m but canalso ventilate the deep water during the rare deep water renewal events (Masson 2002) Thewater is further aerated by gas bubble injection in the tidal front The vertical component of
2006] Baschek et al Tidal fronts and their role in air-sea gas exchange 489
Figure 4 Sketch of the processes that are important for air-sea gas exchange in the tidal front atBoundary Pass during (a) strong forcing and (b) extreme forcing
the velocity in the front is 015ndash03 m sminus1 which exceeds the rise speed of all bubbles withradius lt 900 microm Bubbles trapped in the downwelling currents are drawn into the deeperwater where they dissolve If we assume that they go into dissolution in the same volumethe dissolved oxygen concentration (in mL Lminus1) would increase by 2 middot 102 times the voidfraction of the injected bubbles giving a sense of their contribution to aeration
490 Journal of Marine Research [64 4
Figure 5 Flow over the sill at Boundary Pass during strong forcing on September 29 2000 Thecolors show the acoustic backscatter intensity measured with an echo sounder and the black arrowsindicate the current speed perpendicular to the sill crest The aspect ratio is 11
b Extreme forcing
When the tidal forcing increases further (25ndash45 h after low tide) the flow shoots over thesill as a supercritical inertial jet with flow separation at the sill crest (Fig 4b 6) The lowerlayer plunge point is shifted far downstream by the currents and is no longer delineatedby a clear front The flow field downstream of the sill crest is characterized by irregular3-dimensional convergencedivergence patterns associated with strong eddy activity andwave breaking Gas bubble clouds ndash indicating downwelling currents ndash are spread over adistance of about 2 km starting several hundreds of meters downstream of the sill
The contribution to the aeration of water locally is still significant even though the verticalcurrents (025ndash03 m sminus1) are much weaker However due to dilution through intense mixingit is likely that the aerated water at this stage is insufficiently dense to reach intermediatedepths and bubble injection does not contribute to the aeration of subsurface waters
4 Wave-current interaction in a convergence zone
In the convergence zone of a tidal front either both water masses flow towards the frontor one of them is stagnant Surface gravity waves that travel into this zone steepen due tothe effect of the opposing currents break and create gas bubbles that enhance air-sea gasexchange as may be readily seen in Figure 7 In order to estimate the amount of gas entrainedthe injection location of the gas bubbles relative to the plunge point of the subducting flowhas to be determined It is given by the interaction of waves and currents A model thatdescribes the behavior and energy dissipation of waves traveling on a current is found indetail in Baschek (2005) and will be reviewed here briefly
2006] Baschek et al Tidal fronts and their role in air-sea gas exchange 491
Figure 6 Transect over the sill at Boundary Pass during extreme forcing measured with an ADCP anecho sounder and a towed Acoustical Resonator on September 29 2000 (a) Along-strait current(b) vertical current (c) acoustic backscatter intensity The path of the resonator is shown by thewhite line and the location of the bubble measurements in Figure 17 by the black dot
Bretherton and Garrett (1969) derived a conservation equation for wave action that isvalid for waves on a slowly varying current ie the current changes only little over a wavelength For a steady wave train traveling in the x-direction it can be written as
d
dx
(u + cg)
E
ωprime
= 0 (1)
where u and cg are the current speed and group velocity E is the wave energy ωprime the wavefrequency relative to the water For deep water waves using ωprime = gc and cg = c2
E
(u + 1
2c
)c = const equiv 1
2E0c
20 (2)
where the subscript ldquo0rdquo marks variables in a medium at rest This yields together with thewave energy E = ρga22 an expression for the wave amplitude (Phillips 1977)
a
ao
= c0radic(2u + c)c
(3)
492 Journal of Marine Research [64 4
Figure 7 Wave breaking due to wave-current interaction in the Stuart Island tidal front
where the phase speed is given by
c
c0= 1
2+ 1
2
radic1 + 4u
c0 (4)
The wave energy EE0 = (aa0)2 is shown in Figure 8 (solid curve) as a function of the
normalized current speed uc0 The waves travel from left to right At u = 0 EE0 = 1by definition and EE0 goes towards infinity as u goes towards the negative group speedof the wave (uc0 = minus14)
In reality waves do not reach infinite amplitudes but break when they reach a certaincritical steepness ka given by the product of wave number k and amplitude a Thisvalue is given by Longuet-Higgins (1969) as ka = 12 Duncan (2001) uses ka = 031and Wu and Yao (2004) found values between ka = 015 and ka = 036 if currents arepresent We are interested in the amount of gas injected by breaking waves and will usea value of ka = 12 which is conservative in the sense that the waves do not break aseasily
The location at which the wave reaches its critical steepness depends on current speedinitial wave number and wave height For waves with high initial steepness k0a0 this willhappen at low current speeds and for waves with lower initial steepness at higher currentspeeds (Fig 8) The amplitude at which the wave exceeds the breaking criterion decreases asthe wave travels farther against the current because the wave number increases with currentspeed To derive the equation for the energy of a breaking wave ka = 12 is multiplied
2006] Baschek et al Tidal fronts and their role in air-sea gas exchange 493
Figure 8 The wave energy without wave breaking (solid curve) and with wave breaking is plotted asfunction of current speed for a wave of initial steepness k0a0 (dashed curves) Current speed andenergy are scaled with the values for a medium at rest
by 1(ka0) Together with the expression (cc0)2 = k0k we get
a
a0=
(c
c0
)2 1
2k0a0 (5)
where cc0 is given by Eq (4) The group velocity equals the current speed whenuc0 = minus14 ie the wave cannot proceed any further against the currents and will have tobreak somewhere in the convergence zone EE0 is plotted in Figure 8 for different initialsteepnesses k0a0 (dashed curves)
a Wave breaking
Galvin (1968) has classified different types of breaking waves approaching a slopingbottom Two of these types spilling and plunging breakers can also be found in the openocean or a convergence zones Observations show that spilling breakers are predominant intidal fronts or convergence zones (Fig 7) and the following considerations will be limitedto these waves
494 Journal of Marine Research [64 4
Figure 9 Behavior of a quasi-monochromatic wave on an opposing current The normalized energyEE0 is given for the case without breaking (black curves Γi ) and with breaking (gray curves Υj )∆E is the energy lost by wave breaking
In order to determine the amount and location of injected gas bubbles the shape of thewave packet has to be considered as the wave energy is transported with the group speedand not with the phase speed Consider a wave that is at time t = 0 at location x = 0 (oncurve Γ1) The curves Γi (ΓiΓ1 = const Fig 9) describe the wave energy without breakingand Υi the wave energy with breaking Γ1 and Υ1 mark the shape of the entire wave packetat t = 0 One period τ later the wave has moved λ and the wave packet λ2 to the right Ifthere was no wave breaking during this time the shape of the wave packet would be givenby curves Γ1 and Υ2 But because of breaking the ldquoexcessrdquo energy ∆E = Υ2(λ) minus Υ1(λ)
is lost between x = 0 and x = λ From Figure 9 it also follows that Υ2(λ) = Γ2(λ) Puttingthis together with
Γ2(λ)
Γ1(λ)= Γ2(λ2)
Γ1(λ2)= const and Γ2(λ2) = Υ1(λ2) (6)
2006] Baschek et al Tidal fronts and their role in air-sea gas exchange 495
yields an equation for the energy loss by wave breaking
∆E = Υ1(λ2)Γ1(λ)
Γ1(λ2)minus Υ1(λ) (7)
It should be noted though that due to the effect of the currents the difference in the waveenergy between two points of the curve is not equivalent to the dissipated wave energy
In these idealized conditions the wave crest is continuously pushed into the region ofcritical steepness so that the wave breaks continuously (and not intermittently) in order tosatisfy the stability criteria However this is not necessarily true if the magnitude of thecurrents does not increase linearly or if we are looking at the more realistic case of a groupof waves rather than a monochromatic wave train Figure 10 shows a sketch of the breakingbehavior of a group of waves on a current At t = 0 (a) the first wave has a steepness ofka gt 12 and breaks In contrast to open ocean waves (Donelan et al 1972) the wavepacket amplitude is not maintained by a continuous source of wind energy but changes dueto breaking and the effects of the currents (b) At t = τ (c) the first wave has moved λ2
Figure 10 Sketch of the break behavior of a group of waves on a current For explanations see text
496 Journal of Marine Research [64 4
to the right (relative to the wave packet) so that its amplitude is reduced It has a steepnessthat is less than the critical value and stops breaking At t = 2τ (d) the next wave hasreached its critical steepness and breaks ndash with an amplitude that is smaller than the firstwave This intermittent breaking changes at a later stage (e) because the shape of the wavepacket is altered by wave breaking and the interaction with the currents the waves are nowcontinuously pushed into the region of critical steepness and hence break continuouslyDepending on the initial shape of the wave packet and the current gradient there may notbe a phase of intermittent breaking It is also possible that the wave amplitude is reducedmore than necessary and the waves break again when they become steep The energy loss isthen step-like instead of continuous Observations of breaking waves in tidal fronts (Fig 7)show however that almost all waves within the convergence zone are actively breakingwhitecaps indicating that continuous breaking is predominant
5 Gas bubble behavior
Gas bubbles are injected into the ocean by breaking waves and then rise back to the seasurface due to their buoyancy ndash or may be subducted by downwelling currents The bubblevolume and buoyancy change with hydrostatic pressure and due to the gas exchange with thewater This bubble behavior is described with a one-dimensional model from Thorpe (1982)It provides the temporal change of bubble radius r and molar content nj of a gas j insidethe bubble These are calculated along the path of a bubble so that the model is applicableeven in the highly complicated flow field of a tidal front Bubble-bubble interactions areneglected and it is assumed that the bubbles do not break up any further after they havebeen injected so that their size responds only to dissolution and pressure changes
The gas exchange between bubble and water is driven by the difference of the partial gaspressure in the bubble Pj and in the water far from the bubble Pwj
(Thorpe 1982 1984)
dnj
dt= minus4 π r Dj Sj Nuj (Pj minus Pwj
) (8)
where Pj = χj (patm minus gρz + 2γrminus1) and Pwj= (1 + 001σj )χjatm patm Dj Sj Nuj and
σj are the coefficient of diffusion the solubility Nusselt number and gas oversaturationin water The time atmospheric pressure density of sea water gravitational accelerationdepth coefficient of surface tension and mole fraction are denoted as t patm ρ g z γand χj The gas transfer from the bubble into the water is enhanced by the flow relative tothe bubble (rise speed or turbulence) The Nusselt number Nu is a dimensionless measureof turbulent gas transfer and is given by the ratio of the total gas exchange and the gasexchange caused by diffusion alone (Woolf and Thorpe 1991)
The change of bubble radius with time is given by
dr
dt=
⎛⎝ 3RT
4πr2
sumj
dnj
dtminus r
dp
dt
⎞⎠ (
3p + 3patm + 4γ
r
)minus1
(9)
2006] Baschek et al Tidal fronts and their role in air-sea gas exchange 497
where the change of the hydrostatic pressure dpdt is given by the sum of vertical currentspeed w bubble rise speed wb and turbulent current speed wturb as
dp
dt= g ρ(minusw minus wb + wturb) (10)
Gas bubbles rise in a fluid due to their buoyancy Formulae for their rise speed are givenby various authors (eg Thorpe 1982 Woolf and Thorpe 1991 Keeling 1993 Fan et al1999) Fan and Tsuchiya (1990) merged the results from different studies covering a widerange of radii We will use their description for bubbles with a layer of surface-activematerial (ldquodirty bubblesrdquo)
The coupled ordinary differential equations (8) (9) and (10) were solved with an explicitRunge-Kutta formula in MATLAB For this one-step solver only the solution at the imme-diately preceding time point is needed so that the vertical current speed can be describedby an arbitrary function of time and also turbulence can be implemented
The typical scale of the turbulent vertical current speed in a tidal front of wlowast = 005 m sminus1
has been estimated from observations by Gargett and Moum (1995) in a similar environmentin Haro Strait The vertical displacement of a parcel of water due to the turbulent velocitywturb (Eq 10) is calculated by multiplying wlowast with a random value chosen from a normaldistribution with mean zero and standard deviation one The increased gas flux due to smallscale pressure fluctuations is incorporated in the description of the Nusselt Number
For the model calculations the gas mixture in the bubbles contains the four gases O2 N2CO2 and Ar It can be assumed that the injection time of the bubbles is short in comparisonto the time scale of diffusion so that the initial mole fraction in the bubble χj at time t = 0is equivalent to the atmospheric one Mole fraction and gas content however change afterinjection due to diffusion Typical parameter values (Woolf and Thorpe 1991) used in themodel runs are listed in Table 1
Table 1 Typical values for the parameters used in the model calculations (Woolf and Thorpe 1991)
Values forVariable O2 N2 CO2 Ar Units
Dj 17 18 13 17 10minus9 m2 sminus1
χj 2095 7809 00035 92 10minus3
Sj 13 629 445 142 10minus6 mol mminus1 Paminus1
σj 0 0 0 0
T 283 Kρ 1020 kg mminus3
patm 1 middot 105 Paγ 0036 N mminus1
ν 1 middot 10minus6 m2 sminus1
wlowast 005 m sminus1
498 Journal of Marine Research [64 4
a Gas entrainment by bubbles
In the following we will look at the size distribution of gas bubbles that are injected inthe tidal front and will calculate how much of the enclosed air dissolves and contributesto air-sea gas exchange The air enclosed during wave breaking quickly breaks up into gasbubbles due to pressure fluctuations exerted by turbulence (Deane and Stokes 1999) Thesebubbles form a size distribution N(r) that describes the number density in a unit volumeof water for each radius increment r minus dr2 to r + dr2 Numerous measurements (egJohnson and Cooke 1979 Baldy and Bourguel 1987 Dean and Stokes 1999) show that itcan be adequately described by power laws of the form N(r) = βrα where β is a scalingfactor that depends on the total number of bubbles α is the slope of the size distribution(in double-logarithmic space) and has negative values as small bubbles are more numerousthan big bubbles
The values for α given in the literature range between minus18 and minus55 Unfortunately itis difficult to compare these measurements with each other as they were taken in differentenvironments (tank surf zone open ocean) different wind and wave conditions (spilling orplunging breakers) measurement depths or may be influenced by surfactants In particularthe different times relative to initial bubble generation (plume age) are a concern as thebubble size distribution changes due to dissolution which flattens the spectrum for smallbubbles and due to buoyancy which steepens the spectrum for larger bubbles (Garrett et al2000 Baldy and Bourguel 1985 1987 Baldy 1988 Hwang et al 1990)
For the modeling of bubble behavior and gas exchange we are interested in the initialsize distribution that is established immediately after bubble formation Garrett et al (2000)argue on dimensional grounds that the bubble breakup by turbulence results in an initial sizedistribution that is proportional to rminus103 This was observed by Deane and Stokes (2002)for bubbles with radii gt1000 microm generated in the surf zone For r lt 1000 microm howeverthe observed slope was α = minus32 which is supported by dimensional considerations forbubble entrainment by a jet of water and implies that most of the small bubbles are formedwhen the wave curls over and plunges into the sea surface Although this scenario seemsto be more likely for plunging than for spilling breakers and the separation point betweenthe two slopes changes under different conditions we will use this description with twopower laws for the initial bubble size distribution due to the lack of measurements in morerelevant conditions
While it is assumed that the two initial spectral slopes α are constant with depth thebubble density decreases with depth Observations indicate that this decay is exponential(eg Medwin 1970 Baldy and Bourguel 1987 Crawford and Farmer 1987) so that thesize distribution is given by
N(r z) = β0rαezδ (11)
where δ is the bubble entrainment depth β0 the scaling factor at the sea surface and z
the depth (with positive values upwards) The bubble penetration depth increases with thewave amplitude a Chanson and Jaw-Fang (1997) observed δ = 12minus2a for a jet or plunging
2006] Baschek et al Tidal fronts and their role in air-sea gas exchange 499
breaker generated in a tank and Hwang et al (1990) found in tank experiments a quasi-linearrelationship between significant wave height Hs and bubble penetration depth (δ asymp Hs)Loewen et al (1996) measured δ = 011minus034a in a tank and Thorpe (1986) observedbubbles in the ocean to depths of 25minus3Hs for moderate winds and 4minus5Hs for strong windsAlso observations of open ocean whitecaps by Thorpe (1982) Vagle (1989) and Crawfordand Farmer (1987) show that the overall number of bubbles and their penetration depthincreases with wind speed and hence with wave height Oceanic measurements howevermay overestimate the initial entrainment depth as bubbles are carried farther down by wavemotion or Langmuir circulations We will use for our calculations a value of δ = a4 as ityields the best agreement in void fraction and bubble size distribution with the values forsmall spilling breakers published by Loewen et al (1996) (see below)
The total number of injected bubbles depends on the dissipated wave energy ∆E A partof this energy Eb goes into the subduction of newly formed gas bubbles For a single bubbleof radius r it is Eb1 = minus43πr3ρgz The energy that is required to submerge all bubbles ofa size distribution N(r z) is then
Eb = minusint 0
minusinfin
int r2
r1
N(r z)4
3πr3ρgz dr dz (12)
If we insert the equation for the size distribution (11) integrate between the cut-off radiir1 and r2 and over the whole water column we obtain an equation for the scaling factor β0
that describes the total number of gas bubbles at the sea surface
β0(x) = 3(α + 4)E∆E
4πgρδ2
(rα+4
2 minus rα+41
)minus1for α = minus4
= 3 E ∆E
4πρg ln (r2r1)for α = minus4 (13)
where E equiv Eb∆E is defined as the ratio of energy required for the subduction of bubblesto the total dissipated wave energy Due to the current speed gradients ∆E δ and β arefunctions of horizontal distance x The water density is ρ = 10235 kg mminus3
If a part of the bubble spectrum is not detected β0 is underestimated For α gt minus 4 the voidfraction is mainly determined by large bubbles and for slopes of α lt minus 4 it is determined bysmall bubbles For our bubble spectrum this means that the cut-off radius for small bubblesr1 is not critical as the spectral slope is α = minus32 gt minus 4 The cut-off radius for large bubblesr2 however is important for calculating gas entrained by bubbles as α = minus 103 gt minus 4Hence the void fraction is dominated by the larger bubbles For our model calculations wewill use r1 = 20 microm and r2 = 10 000 microm covering the whole measurement range
Measurements of breaking waves show that between 10 and 60 of the wave energyis dissipated during breaking (eg Chanson and Jaw-Fang 1997 Melville and Rapp 1985Nepf et al 1998) The portion of this energy that goes into the subduction of gas bubblesis E = 15minus42 middot 10minus3 for small spilling breakers (Loewen et al 1996) or as high as E =
500 Journal of Marine Research [64 4
Figure 11 Percentage of gas d(r z) that dissolves from a bubble while it rises back to the surface Itis shown for O2 N2 CO2 and Ar as a function of initial bubble radius and depth The gray shadedarea marks the bubbles that dissolve completely
03minus05 for small plunging breakers (Lamarre and Melville 1991) The appropriate valuefor a breaking wave on a current is therefore quite uncertain and varies over two orders ofmagnitude It is likely that it depends on the current speed gradient a wave experiences asudden current change may result in a plunging breaker while a gradual change may resultin a spilling breaker We chose a conservative value of 3middot10minus3 as for a small spilling breakerwith an amplitude of only a few centimeters
While Eq (13) yields the total number of gas bubbles entrained we are especially inter-ested in the amount of gas that actually dissolves from the bubbles The amount of gasd(r z) a single bubble loses to the surrounding water before it rises back to the sea surfacedepends on the initial bubble radius the injection depth and the vertical current It hasbeen calculated with the bubble model and is plotted in Figure 11 for a range of radii andinjection depths for N2 O2 CO2 and Ar and no vertical currents The gas saturation is100 for all gases The smaller bubbles dissolve completely (marked by the gray shadedarea) while the larger ones rise to the surface where the remaining gas is released
Downwelling currents keep the injected bubbles underwater for longer increasing thetime during which gas dissolves This is obvious in Figure 12 where d(r z) is plotted for auniform vertical current speed of w = minus02 m sminus1 (right at the surface w = 0) A bubble
2006] Baschek et al Tidal fronts and their role in air-sea gas exchange 501
Figure 12 Percentage of gas d(r z) that dissolves from a bubble while it rises back to the surface Itis shown for O2 N2 CO2 and Ar as a function of initial bubble radius and depth and for a currentspeed of w = minus02 m sminus1
dissolves completely if the vertical currents are stronger than its (initial) rise speed Thelarger bubbles lose more gas than without currents but still reach the sea surface
The total percentage of gas dissolved Gj is given by the integral over all bubbles of agiven size and depth distribution
Gj =int r2r1
int 0minusinfin dj (r z) N(r z) V0(r z) dz drint r2r1
int 0minusinfin N(r z) V0(r z) dz dr
(14)
where the initial volume of a bubble which it would have at the sea surface under onlyatmospheric pressure patm is given by
V0 = 4
3πr3
(minusgρz
patm
+ 1
) (15)
Gj has been plotted in Figure 13 as a function of the vertical current for bubble radiibetween 1 microm and 10 000 microm and δ = 01 m It increases slowly for currents up tominus02 m sminus1 and much more rapidly between minus02 m sminus1 and minus03 m sminus1 This suddenincrease can be explained by the function describing the rise speed of gas bubbles (Fan and
502 Journal of Marine Research [64 4
Figure 13 Percentage of the total amount of gas dissolved Gj as function of current speed w for anentrainment depth of δ = 01 m
Tsuchiya 1990) For radii between 700 microm and 7000 microm the bubble rise speed increasesonly gradually from 02 m sminus1 to 03 m sminus1 Therefore only a slight increase in currentspeed greatly enhances the number of bubbles that are drawn down and dissolve Gj alsodepends on the assumed entrainment depth δ because bubbles that are injected deeper havea longer path through the water column For example for δ = 1 m Gj increases for allgases by a factor of 2ndash4 for w lt 022 m sminus1
The differences in the curves for the four gases are caused by the different diffusionspeeds which are proportional to S D23 where S is the solubility and D the coefficientof diffusion CO2 dissolves more quickly than the other gases and for currents strongerthan minus025 m sminus1 all CO2 is lost N2 has a low diffusion rate so that ldquooldrdquo bubbles containmostly N2
b Application to the sill flow at Boundary Pass
The amount of gas dissolved in a tidal front depends on the injection location relative tothe plunge point of the subducting water mass the closer to the plunge point the bubblesare injected the less time the bubbles have to rise back to the surface before they aresubducted and the more gas dissolves The considerations in the previous section can bedirectly applied to this situation in a reference frame moving with the currents the bubblesexperience a temporally varying vertical velocity
2006] Baschek et al Tidal fronts and their role in air-sea gas exchange 503
Table 2 For an estimate of the air-sea gas exchange at Boundary Pass three representative waveswith different amplitudes and wave lengths were chosen approaching the front from East and West
larrminus Waves from the East
Wave a0 [m] λ0 [m] a0k0 Break RegionI 005 15 032 74 m to 42 mII 02 8 013 7 m to minus17 mIII 1 15 042 85 m to minus47 m
minusrarr Waves from the West
Wave a0 [m] λ0 [m] a0k0 Break RegionI 005 15 032 minus13 m to 1 mII 02 8 013 33 m to 84 mIII 1 15 042 gt minus16 m
Waves that approach the tidal front at Boundary Pass encounter two slightly differentsituations waves approaching from the west ride on the strong flood tidal currents untilthey reach the front marking the transition to the stagnant surface layer in the east Forwaves approaching from the east the transition is from stagnant water to fast opposingcurrents The model of wave-current interaction is used to calculate the location of bubbleinjection and the dissipated wave energy This yields the amount of injected and dissolvedair as a function of horizontal distance A sensitivity study is used to estimate the error ofthe model calculations due to the uncertainties in the parameters (Appendix)
In the following three different waves are chosen as examples They may representwindwave conditions on a calm average and windy day The wind speeds in the Straitof Georgia are usually less than 15 m sminus1 with prevailing winds of less than 7 m sminus1 Theconditions are usually fetch-limited and the expected wave height is up to 15 m but usuallyless than 06 m (Bretschneider 1958) In particular the following values for the initialamplitude a0 and wave length λ0 are chosen a0 = 005 m λ0 = 15 m (wave I calm dayTable 2) a0 = 02 m λ0 = 8 m (wave II average day) and a0 = 1 m λ0 = 15 m (wave IIIwindy day) The initial steepness of all waves is below the critical value for breaking Thehorizontal surface currents are taken from ship-board observations in the tidal front (Fig 5)
The results are plotted in Figures 14 and 15 The initial wave length λ0 determines thephase speed of the wave and hence how far the wave proceeds against the current beforeit reaches the critical value of uc0 = minus14 where it is arrested Long waves advancefarther against the current (Fig 14b and 15a) and waves with a high initial steepness breakearlier than waves that are not so steep (Fig 8) Hence the initial steepness determines thebeginning and the wave length the end of the break region
The horizontal currents carry the bubbles into regions of different w so that for eachinjection location the vertical currents are described as a function of time (in a referenceframe moving horizontally with the currentsbubbles) It is assumed that w = 0 to the eastof the front and that the bubbles that are injected at a location to the west of the front arecarried downward by the vertically averaged lower layer currents as soon as they are advected
504 Journal of Marine Research [64 4
Figure 14 (a) Horizontal (gray) and vertical (black) current in the tidal front at Boundary PassSurface currents are shown by dashed lines vertically averaged lower layer currents by solid lines(b)ndash(c) Amplitude and dissipated energy for waves I II and III approaching the front from theEast (d) amount of air injected (e) percentage of oxygen dissolved for detrainment depths 005 m(dashed) 05 m (solid black) and 1 m (dash-dotted)
2006] Baschek et al Tidal fronts and their role in air-sea gas exchange 505
Figure 15 (a)ndash(b) Amplitude and dissipated energy for waves I II and III approaching the front fromthe West (c) amount of air injected
horizontally past the plunge point The initial size distribution of the injected bubbles iscalculated as a function of horizontal distance and depth (13) The resulting verticallyintegrated void fraction is shown for O2 in Figures 14d and 15c for the entrainment depths005 m 05 m and 1 m
Bubbles injected within 3ndash5 m to the west of the tidal front dissolve almost completelydue to the very strong vertical currents exceeding the rise speed of even the largest bubblesIn this zone the total amount of gas dissolved does therefore not depend on δ Farther tothe west Gj decreases as some of the bubbles have time to rise back to the sea surfaceBetween x = minus3 m and x = minus17 m Gj drops from 95 to less than 3 for all threeentrainment depths To the east of the front the surface layer is stagnant and Gj is lt 3
For an estimate of the frontal contribution to the aeration of the subsurface water in theStrait of Georgia we are only interested in the dissolved gas that is subducted by the currents(Fig 14 and 15) The gas that is injected to the east of the front stays in the surface layer andcan be neglected although the gas exchange in that region is also increased by enhancedwave breaking in the vicinity of the front The waves that contribute most to the aeration ofthe intermediate water are those that break within the zone of high dissolution close to thefront For waves approaching from the West this is the case for short initial wave lengths
506 Journal of Marine Research [64 4
Figure 16 Sketch of the oxygen sources and sinks in the Fraser Estuary The numbers show the dis-solved oxygen saturations in the surface water [] and the oxygen concentrations in the subsurfacewater [mL Lminus1]
(wave I) Waves approaching from the East can only contribute if they have a wave lengthof more than 5 m (waves II III) so that they are fast enough to travel past the front
6 Oxygen Budget of the Fraser Estuary
In order to determine the contribution of tidal fronts to air-sea gas exchange a comparisonmust be made with other oxygen sinks and sources diffusion through the sea surface bubbleinjection by breaking wind waves advection by currents as well as biological productionand consumption (Fig 16) For the entire Fraser Estuary including the surface waters thecontribution of tidal fronts is lt1 (Baschek 2003) Here we focus on the oxygen budgetof the subsurface waters in the Strait of Georgia The surface waters of Juan de Fuca Straitand the Strait of Georgia do not contribute directly to this The tongue of oxygenated waterthat subducts to intermediate depths in the Strait of Georgia (Fig 2) has its origin in HaroStrait where tidal fronts contribute to the aeration and oxygen rich surface water is mixedwith dense water from the Pacific Ocean
a Contribution of tidal fronts
The tidal front at Boundary Pass is the most pronounced front in Haro Strait The oxygenflux in this front will be estimated from the model results as well as from measurementsof bubble size distribution and current speed Extrapolation to other fronts in the Straitleads to an estimate of the total gas flux A minimal value will be given as well as a ldquobest
2006] Baschek et al Tidal fronts and their role in air-sea gas exchange 507
guessrdquo Notwithstanding the uncertainties our use of conservative estimates throughoutshould provide a lower bound to the flux
i Estimate from model results The oxygen flux in the tidal front at Boundary Pass hasbeen estimated for strong flood tidal forcing by applying models of wave-current interactionand bubble behavior in the front This yields the amount of gas injected by each breakingwave which is then multiplied by the mole fraction of oxygen (021) and the width of thefront (2200 m) and is divided by the wave period It is assumed that these processes takeplace twice a day for a 2 h period during flood tide and the results are averaged over 1 d
Only the bubbles injected by waves breaking within a few meters of the front contributeto the aeration of intermediate water in the Strait of Georgia The oxygen flux for wavesreaching this zone is sim002 m3 sminus1 We emphasize that this is a minimal value given theselection of the values for gas saturation entrainment depth δ and the portion of energyE that goes into bubble subduction The estimate does not change much if a different gassaturation level or a different spectral shape are chosen It is however quite sensitive toE and δ (Appendix) The values in the reference model runs are given for small spillingbreakers with amplitudes of only a few centimeters For only slightly higher waves δ mayincrease by a factor of 4 E by a factor of up to 100 (for small plunging breakers) We useintermediate values of δ = a2 and E = 003 as a best yet conservative estimate of actualconditions with a resulting gas flux of 01 m3 sminus1
ii Estimate from observations Direct measurements of gas bubbles provide an alternativeway of estimating the gas flux in a tidal front The void fraction V is multiplied by the molefraction of oxygen χ the bubble entrainment depth δ the current speed u with which thebubbles are carried past the plunge point the width W and length L of the front as well asthe duration of gas entrainment T (in h) during a 12 h tidal period This yields the gas fluxin the entire front averaged over a tidal period
Gas flux = V χ(O2) δ u W L T 12 (16)
An Acoustical Resonator for measuring bubble size distributions was towed through thetidal front at Boundary Pass The void fraction in the bubble plume at a depth of 20 mis V = 99 middot 10minus7 (Fig 17) The initial bubble size distribution is derived from this fordifferent current speeds by using the bubble model to track the bubbles back to the surfaceThe resulting void fraction at the surface varies within a factor of 2 with a mean value of11 middot 10minus5
Echo sounder measurements taken at the same time suggest however that bubbles outsidethe measurement range may have been present (Fig 6) The gas bubbles at 100 m must havehad a radius of at least 09 mm at the surface which is larger than the largest bubble detectedby the Resonator Smaller gas bubbles may also have been present but were not measuredand may have dissolved completely before reaching the measurement depth To estimatethe amount of gas contained in bubbles outside the measurement range the bubble sizedistribution is extended to smaller bubbles with a spectral slope of minus32 as used in the
508 Journal of Marine Research [64 4
Figure 17 (a) Void fraction during the transect shown in Figure 6 (b) Volume scaled bubble sizedistribution 43πr3N(r) (dash-dotted curve) of the bubble plume in the front in 20 m depth (markedby arrow in upper panel and by the black dot in Figure 11) The bubble size distribution at the surfaceis calculated with the bubble model for w = 01 m sminus1 and w = 05 m sminus1
previous model calculations For larger bubbles we use α = minus48 matching the slope ofthe observed surface spectra (Fig 17b) The resulting void fraction of the total spectrum is23 middot 10minus5 which is equivalent to an increase in dissolved oxygen by 46 middot 10minus3 mL Lminus1
Even this value for the void fraction is however two orders of magnitude smaller thanthe observations under small spilling breakers by Loewen et al (1996) and 4 orders ofmagnitude smaller than the observations under bigger waves (Deane 1997 Lamarre andMelville 1991 Loewen et al 1996 Monahan 1993) This is not that surprising given thegreat natural variability in a turbulent front We therefore chose a value derived from ourobservations as a minimal value and the measured void fraction for small spilling breakersof 0002 (Loewen et al 1996) as a best guess assuming that they are injected in the upper015 m of the water column (005 m as minimal value)
The speed with which the bubbles are advected past the lower layer plunge point is15 m sminus1 in the horizontal and somewhere between minus02 m sminus1 and minus07 m sminus1 in thevertical We take a minimal vertical current speed of minus02 m sminus1 and an average value of
2006] Baschek et al Tidal fronts and their role in air-sea gas exchange 509
minus05 m sminus1 as a best guess so that the resulting current speeds are 15 m sminus1 and 16 m sminus1respectively The width of the front W is given by the zone in which the injected gas bubblesare subducted by the currents before they rise back to the sea surface This value is between5 m and 17 m with a best guess of 10 m The length of the front L = 2200 m is givenby the geometry of the sill The resulting minimal average gas flux is 66 middot 10minus4 m3 sminus1
and for the best guess 037 m3 sminus1 Notwithstanding the uncertainties in the measurementsand in the seasonal and neap tidal variability these calculations provide a framework forestimating the role of tidal fronts in air-sea gas exchange
iii Contribution of all tidal fronts in Haro Strait The results from the tidal front at Bound-ary Pass can now be used to estimate the contribution of the other tidal fronts in Haro StraitA parcel of water moving from Juan de Fuca Strait into the Strait of Georgia will pass severalof these fronts ndash due to the changing flow direction of the tidal currents possibly even morethan once About 9 ebb and 7 flood tidal fronts are located in the estuary (Fig 3) Aerialphotos and GPS measurements were used to map the extent of these fronts Ignoring theweaker fronts and including only the ebb tidal fronts at Stuart Island (05) Battleship Island(03) Gooch Island (02) and Discovery Island (02) as well as the flood tidal fronts atBoundary Pass (1) and Stuart Island (02) where values in parentheses provide an approxi-mate estimate of their relative contribution to aeration The oxygen flux in all fronts in HaroStrait is therefore about 25 times that of Boundary Pass yielding an oxygen flux for theintermediate water in the Strait of Georgia of 092 m3 sminus1 (best guess) and 66 middot10minus4 m3 sminus1
(minimal value)
b Comparison with other oxygen sources
In the following the gas exchange in tidal fronts is compared with the diffusive gas fluxand biological production Due to the strong tidal currents and mixing in Haro Strait andthe sparsity of data it is not possible to estimate reliably the contribution of advection orbiological decomposition For further discussion see Baschek (2003)
The diffusive gas flux was estimated from oxygen data (Crean and Ages 1971) and hourlywind speed measurements from 1998 at Sandhead Strait of Georgia The data may not berepresentative for the whole estuary and wind and saturation data are taken from different(possibly untypical) years and at only a few stations Nevertheless these numbers providean estimate of the order of magnitude of the diffusive gas flux The parameterizations byWanninkhof (1992) and Liss and Merlivat (1986) yield an annual mean oxygen flux for HaroStrait of 76 m3 sminus1 and 45 m3 sminus1 The oxygen production by algae has been estimatedfrom a daily primary production rate of 520 mgC mminus2 dminus1 (Koblents-Mishke 1965) whichresults in a mean oxygen production rate of 5 m3 sminus1 for Haro Strait (Kirke 1994)
The oxygen budget can now be calculated for the intermediate water in the Strait ofGeorgia Diffusion and photosynthesis contribute about the same amount to the additionalproduction of oxygen in the subducting layer (Table 3) The tidal fronts contribute about8 to the aeration of intermediate water (best guess) or 142 of the diffusive gas fluxThe tidal front at Boundary Pass by itself contributes 3
510 Journal of Marine Research [64 4
Table 3 Oxygen sinks and sources [m3 sminus1] of the Strait of Georgia and the Fraser Estuary Thevalues for the tidal front are the ones for the ldquobest guessrdquo lowast) Taken from Thomson (1994) lowastlowast)
Estimated
Oxygen-SourceSink Intermediate water Fraser EstuaryStrait of Georgia
Area 450 km2 lowastlowast) 10950 km2 lowast)
Diffusive gas flux 65 11568Photosynthesis 5 152Advection minus100Biol decomposition minus150 ()Tidal front
Boundary Pass 037 (model 01) 072 (model gt 01)all fronts 092 (model 025) 18 (model gt 025)
Oxygen background values in the subsurface waters of the Strait of Georgia and HaroStrait are about 45 mL Lminus1 (Fig 2) The dense water in Haro Strait mixes at the sill withaerated surface water which has dissolved oxygen levels of about 55 mL Lminus1 This watermass is then advected to intermediate depths with oxygen values of 50 mL Lminus1 suggestinga 11 mixing ratio between both water masses Additional oxygen is supplied by bubbleentrainment in the tidal front Due to the contribution of the tidal fronts the oxygen con-centration of the newly subducted intermediate water is increased by 008 mL Lminus1 (bestguess)
7 Discussion
These results show that entrainment of gas bubbles in tidal fronts may contribute sim8to the aeration of intermediate water in the Strait of Georgia This ldquobest guessrdquo represents aconservative estimate The hydraulic sill flow at Boundary Pass delivers additional oxygenfrom the aerated surface waters in Haro Strait In the following the different processesrelevant to entrainment of gas bubbles in tidal fronts will be reviewed together with thecorresponding uncertainties
The flow field of the tidal front is important because the surface convergence zone deter-mines the point at which surface waves break and hence the location of bubble injectionThe injected bubbles are carried away by the subducting water The currents determine theextent of gas dissolution from the bubbles and the depth to which the aerated water is carriedIn this respect the processes right at the sea surface are especially important The currentsare measured below 1 m depth and provide a good estimate of the current speed with whichthe gas bubbles are advected past the lower layer plunge point The flow field may howeverbe subject to seasonal or spring-neap tidal variations as the density difference across thefront may change due to the Fraser River discharge or due to mixing This is suggested bybrief observations in January 2002 when the tidal front at Boundary Pass was much lesspronounced because of weaker stratification with gas bubble clouds reaching only 40 m
2006] Baschek et al Tidal fronts and their role in air-sea gas exchange 511
The gas pressure difference between water and bubble determines how much gas dissolvesbefore the bubbles return to the sea surface This is not critical however as the downwellingcurrents are stronger than the rise speed of the largest bubbles We can therefore assumethat all bubbles injected close to the plunge point dissolve We may therefore limit ourconsiderations to the void fraction rather than the actual bubble size distribution
The void fraction is hard to estimate Values in the literature range over two orders ofmagnitude depending on the type of breaking wave We have taken a value intermediatebetween plunging and spilling breakers which means that the estimated contribution of tidalfronts to the aeration of an estuary could well be a factor of 10 larger or smaller The sizeof the waves and the entrainment depth corresponding to the given void fraction (Loewenet al 1996 Lamarre and Melville 1991) is representative for calm conditions Even thenwaves break due to the effect of wave-current interaction On windy days however thebubble entrainment depth and void fraction would increase and hence the amount of gasdissolved Our estimate of 8 for the contribution to the aeration of intermediate water cantherefore be considered to be conservative
Bubble induced air-sea gas exchange in tidal fronts is also found in other coastal environ-ments where strong tidal currents interact with a rugged topography Data from the Strait ofMessina Italy (pers comm P Brandt IfM Kiel) Bay of Fundy (pers comm D JohnstonDuke Marine Lab) and Gulf of St Lawrence Canada show bubble entrainment to depthsof 40 to 80 m This process is likely to occur also around places like Ireland Norway ChileJapan and in the North Sea The importance of tidal fronts for the aeration of an estuaryvaries with the geographical setting Air-sea gas exchange in tidal fronts is more importantin estuaries with a small surface area and numerous and extended tidal fronts than in largeestuaries with only a few fronts
Surface convergence zones also form in Langmuir circulation (Thorpe and Stubbs 1979Thorpe 1982) or during deep convection events in the North Atlantic and MediterraneanSea in some winters (Schott et al 1999) Downwelling currents are 5 minus 15 cm sminus1 and theassociated divergenceconvergence patterns may increase wave breaking and the formationand subduction of gas bubbles In the latter case gases like O2 are carried down to depths ofmore than 1500 m forming a direct connection between surface waters and the deep ocean
Because of the limitations of the observations it would be desirable to carry out additionalmeasurements In this respect special focus should be given to near surface processesthat are important for the gas exchange by bubbles In particular observations of voidfraction or bubble size distribution in combination with measurements of surface currentsand turbulence may help to understand the gas entrainment mechanisms in tidal fronts
Acknowledgments We gratefully acknowledge the support and cooperation of the officers andcrew of CCGS Vector which were essential in collecting data in a navigationally very challengingenvironment We also thank Drs Patrick Cummins Rolf Lueck and Eddy Carmack for their helpfulsuggestions and discussions which improved this study Many thanks also to the Ocean AcousticsGroup at the Institute of Ocean Sciences Sidney Canada for the support during the project This
512 Journal of Marine Research [64 4
work is a part of research projects carried out with the support of the US Office of Naval Researchand the Natural Sciences and Engineering Research Council of Canada
APPENDIX
Sensitivity of model results
A sensitivity study is used to investigate the importance of single model parameters incor-porated in the oxygen flux calculations We take wave II approaching the front from the eastand wave I approaching from the west as references (see Section 5) representing the wavescontributing most to the aeration of subsurface waters Additional model runs are carriedout with one parameter changed at a time so that the sensitivity can be studied (Table 4)
The diffusion of gas from a bubble to the surrounding water depends on the gas saturationin water In this particular front however the gas saturation levels have little effect on gasflux Due to the small entrainment depths the bubbles either rise quickly back to the surfaceso that an increased concentration difference has little effect or they dissolve completelyFor example if the saturation of O2 in the water drops from 100 to 80 the total gasflux in the front increases by less than 3 In the Fraser Estuary undersaturated conditionsare predominant with the exception of the surface layer in the Strait of Georgia in summerA saturation of 100 is therefore a slightly conservative value
Table 4 Parameter values for the model calculations of gas entrainment in the tidal front at BoundaryPass The lower part of the tables shows the results from the sensitivity study values different tothose of the reference runs (upper part of tables) are shown in bold letters
larrminus Waves from the East
Wave α δ [m] σ [] E [] O2-flux [m3s]I minus15 minus 33 a4 100 03 0II minus15 minus 33 a4 100 03 0012III minus15 minus 33 a4 100 03 0009II minus2 a4 100 03 0011II minus45 a4 100 03 0086II minus15 minus 33 a 100 03 0003II minus15 minus 33 a4 80 03 0012II minus15 minus 33 a4 100 30 117
minusrarr Waves from the West
Wave α δ [m] σ [] E [] O2-flux [m3s]I minus15 minus 33 a4 100 03 002II minus15 minus 33 a4 100 03 0III minus15 minus 33 a4 100 03 0007I minus2 a4 100 03 0018I minus45 a4 100 03 0045I minus15 minus 33 a 100 03 0005I minus15 minus 33 a4 80 03 0021I minus15 minus 33 a4 100 30 203
2006] Baschek et al Tidal fronts and their role in air-sea gas exchange 513
The spectral slope of the bubble size distribution α determines the relative importance ofsmall versus large bubbles If we choose α = minus2 for the whole spectrum there are morelarge bubbles in the water than in the reference run the gas flux decreases by about 9 asthe bubbles rise more quickly to the surface The results are not sensitive to the choice ofcut-off radius for large bubbles r2 If there are more small bubbles (α = minus45) the gas fluxincreases by a factor of 2 to 7 The values for α used in the reference runs are therefore alsoa conservative choice
For the reference runs δ = a4 has been chosen for the entrainment depth as it yieldsvery similar results for void fraction and bubble size distribution to those of Loewen et al(1996) for small spilling breakers An entrainment depth of δ = a for example would yieldresults that are 16 times smaller than those observations assuming the same value for E Itshould be kept in mind though that the laboratory breaking mechanism involved a slopingboundary rather than a wave breaking on a current
The number of injected bubbles is determined by the portion of energy E that goes intothe subduction of gas bubbles For our model runs we have so far assumed a very low valueof E = 0003 (Loewen et al 1996) which may be suitable for wave amplitudes of a fewcentimeters For bigger waves or if the breaking waves are plunging rather than spillingbreakers a higher value of E = 03 minus 05 may be more appropriate (Lamarre and Melville1991) For E = 03 the resulting oxygen flux increases by a factor of 100 If we increasethe entrainment depth without increasing the amplitude fewer bubbles are injected and thegas flux decreases An increase of δ by a factor of 4 reduces the gas flux by 75
REFERENCESArmi L and D M Farmer 2002 Stratified flow over topography Bifurcation fronts and transition
to the uncontrolled state Proc Roy Soc 458 A 513ndash538Baldy S 1988 Bubbles in the close vicinity of breaking waves statistical characteristics of the
generation and dispersion mechanism J Geophys Res 93 C7 8239ndash8248Baldy S and M Bourguel 1985 Measurements of bubbles in a stationary flow field of breaking
waves by a laser-based single-particle scattering technique J Geophys Res 90 C11037ndash1047mdashmdash 1987 Bubbles between the wave trough and wave crest levels J Geophys Res 92 C3 2919ndash
2929Baschek B 2003 Air-sea gas exchange in tidal fronts PhD thesis University of Victoria 156 ppmdashmdash 2005 Wave-current interaction in tidal fronts in Proceedings 14thrsquoAha Hulikorsquoa Winter Work-
shop 2005 Rogue Waves P Muumlller and C Garrett eds 131ndash138Bretherton F P and C J R Garrett 1969 Wavetrains in inhomogeneous moving media Proc Roy
Soc 302 A 529ndash554Bretschneider C L 1958 Revisions in wave forecasting deep and shallow water Proceedings
6th Conference on Coastal Engineering Council of Wave Research University of CaliforniaBerkeley 1ndash18
Chanson H and L Jaw-Fang 1997 Plunging jet characteristics of plunging breakers Coastal Eng31 125ndash141
Crawford G B and D M Farmer 1987 On the spatial distribution of ocean bubbles J GeophysRes 92 C8 8231ndash8243
514 Journal of Marine Research [64 4
Crean P B and A B Ages 1971 Oceanographic records from twelve cruises in the Strait of Georgiaand Juan de Fuca Strait Dept of Energy Mines and Resources Marine Research Branch 1ndash4389 pp
Deane G B 1997 Sound generation and air entrainment by breaking waves in the surf zone J AcoustSoc Am 102 2671ndash2689
Deane G B and M D Stokes 1999 Air entrainment processes and bubble size distributions in thesurf zone J Phys Oceanogr 29 1393ndash1403
mdashmdash 2002 Scale dependence of bubble creation mechanisms in breaking waves Nature 418 839ndash844
Donelan M M S Longuet-Higgins and J S Turner 1972 Periodicity in whitecaps Nature 239449ndash451
Duncan J H 2001 Spilling breakers Annu Rev Fluid Mech 33 519ndash547Fan L-S and K Tsuchiya 1990 Bubble Wake Dynamics in Liquids and Liquid-Solid Suspensions
Butterworth-Heinmann Stoneham MA 363 ppFan L-S G Q Yang D J Lee K Tsuchiya and X Luo 1999 Some aspects of high-pressure
phenomena of bubbles in liquids and liquid-solid suspensions Chem Eng Science 54 4681ndash4709Farmer D M and L Armi 1986 Maximal two-layer exchange over a sill and through the
combination of a sill and contraction with barotropic flow J Fluid Mech 164 53ndash76mdashmdash 1998 Stratified flow over topography The role of small scale entrainment and mixing in flow
establishment Proc Roy Soc 455 A 3221ndash3258Farmer D M E A DrsquoAsaro M V Trevorrow and GT Daikiri 1995 Three-dimensional structure
in a tidal convergence front Cont Shelf Res 15 1649ndash1673Farmer D M R Pawlowicz and R Jiang 2002 Tilting separation flows a mechanism for intense
vertical mixing in the coastal ocean Dyn Atmos Ocean 36 43ndash58Farmer D M S Vagle and A D Booth 1998 A free-flooding acoustical resonator for measurement
of bubble size distributions J Atm Oceanic Tech 15 1121ndash1146Galvin C J 1968 Breaker type classification on three laboratory beaches J Geophys Res 73
3651ndash3659Gargett A and J Moum 1995 Mixing efficiencies in turbulent tidal fronts results from direct and
indirect measurements of density flux J Phys Oceanogr 25 2583ndash2608Garrett C M Li and D M Farmer 2000 The connection between bubble size spectra and energy
dissipation rates in the upper ocean J Phys Oceanogr 30 2163ndash2171Hwang P A Y-H L Hsu and J Wu 1990 Air bubbles produced by breaking wind waves a
laboratory study J Phys Oceanogr 20 19ndash28Johnson B D and R C Cooke 1979 Bubble populations and spectra in coastal waters a
photographic approach J Geophys Res 84 C7 3761ndash3766Keeling R F 1993 On the role of large bubbles in air-sea gas exchange and supersaturation in the
ocean J Mar Res 51 237ndash271Kirke J T O 1994 Light and Photosynthesis in Aquatic Ecosystems 2nd ed Cambridge University
Press Cambridge 525 ppKoblents-Mishke O I 1965 Primary production in the Pacific Ocean Oceanology 2 104ndash116Lamarre E and W K Melville 1991 Air entrainment and dissipation in breaking waves Nature
351 469ndash472LeBlond P H H Ma F Doherty and S Pond 1991 Deep and intermediate water replacement in
the Strait of Georgia Atmos Oceans 29 288ndash312Liss P S and L Merlivat 1986 Relationship between wind speed and gas exchange over the
ocean in The Role of Air-Sea Exchange in Geochemical Cycling P Buat-Menard ed D ReidelHingham MA 113ndash129
2006] Baschek et al Tidal fronts and their role in air-sea gas exchange 515
Loewen M R M A OrsquoDor and M G Skafel 1996 Bubbles entrained by mechanically generatedbreaking waves J Geophys Res 101 C9 20759ndash20769
Longuet-Higgins M S 1969 On wave breaking and the equilibrium spectrum of wind-generatedwaves Proc Roy Soc 310 A 151ndash159
Masson D 2002 Deep water renewal in the Strait of Georgia Estuar Coast Shelf Sci 54 115ndash126Medwin H 1970 In situ acoustic measurements of bubble populations in coastal ocean waters
J Geophys Res 75 599ndash611Melville W K and R J Rapp 1985 Momentum flux in breaking waves Nature 317 514ndash516Monahan E C 1993 Occurrence and evolution of acoustically relevant sub-surface bubble plumes
and their associated remotely monitorable surface whitecaps in Natural Physical Sources ofUnderwater Sound B R Kerman ed 503ndash517
Muumlller R and P Stadelmann 2004 Fish habitat requirements as the basis for rehabilitation ofeuthropic lakes by oxygenation Fish Manag Ecology 11 251ndash260
Nepf H M C H Wu and E S Chan 1998 A comparison of two- and three-dimensional wavebreaking J Phys Oceanogr 28 1496ndash1510
Pawlowicz R 2002 Observations and linear analysis of sill-generated internal tides and estuarineflow in Haro Strait J Geophys Res 107 C63056 doi1010292000JC000504
Pawlowicz R and D M Farmer 1998 Diagnosing vertical mixing in a two-layer exchange flowJ Geophys Res 103 C13 30695ndash30711
Phillips O M 1977 The Dynamics of the Upper Ocean Cambridge University Press 2nd edCambridge 344 pp
Schott F M Visbeck U Send J Fischer L Stramma and Y Desaubies 1999 Observations ofdeep convection in the Gulf of Lions Northern Mediterranean during the winter 199192 J PhysOceanogr 26 505ndash524
Thomson R E 1994 Physical oceanography of the Strait of Georgia - Puget Sound - Juan de FucaStrait system in Review of the Marine Environment and Biota of Strait of Georgia Puget Soundand Juan de Fuca Strait Proc BCWashington Symp on Mar Env R Wilson R BeamishF Outkens and J Bell eds 36ndash100
Thorpe S A 1982 On the clouds of bubbles formed by breaking wind-waves in deep water andtheir role in air-sea gas transfer Phil Trans R Soc Lond A304 155ndash210
mdashmdash 1984 A model of the turbulent diffusion of bubbles below the sea surface J Phys Oceanogr14 841ndash854
mdashmdash 1986 Measurements with an automatically recording inverted echo sounder ARIES and thebubble clouds J Phys Oceanogr 16 1462ndash1478
Thorpe S A and A R Stubbs 1979 Bubbles in a freshwater lake Nature 279 403ndash405Vagle S 1989 An acoustical study of the upper ocean boundary layer PhD thesis University of
VictoriaWallace D W R and C D Wirick 1992 Large air-sea gas fluxes associated with breaking waves
Nature 356 694ndash696Wanninkhof R 1992 Relationship between wind speed and gas exchange over the ocean J Geophys
Res 97 C5 7373ndash7382Woolf D K and S A Thorpe 1991 Bubbles and the air-sea exchange of gases in near-saturation
conditions J Mar Res 49 435ndash466Wu C H and A Yao 2004 Laboratory measurements of limiting freak waves on currents
J Geophys Res 109 C12002 doi1010292004JC002612
Received 15 August 2005 revised 27 April 2006
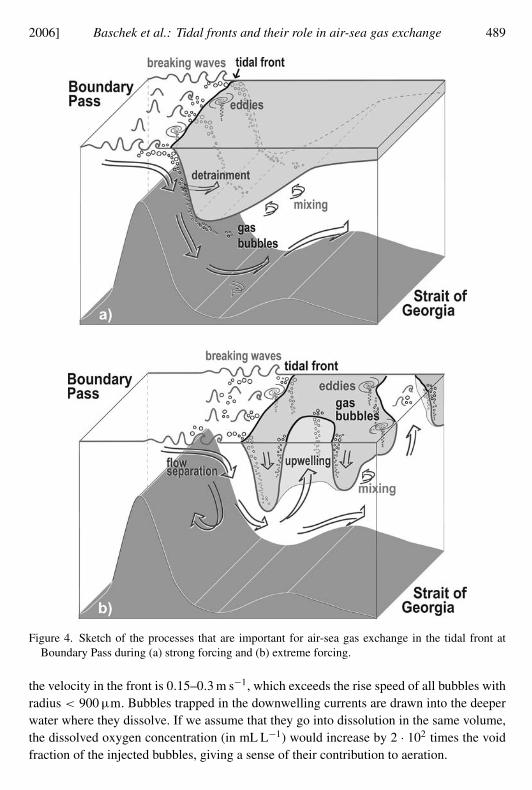
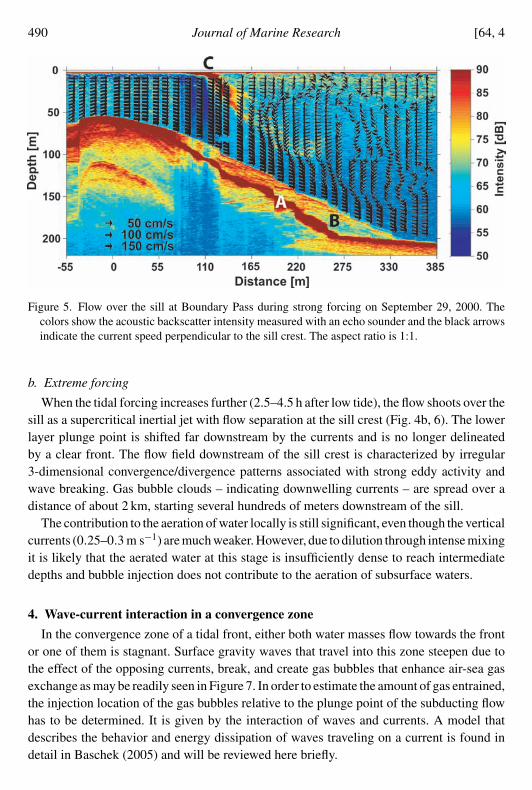
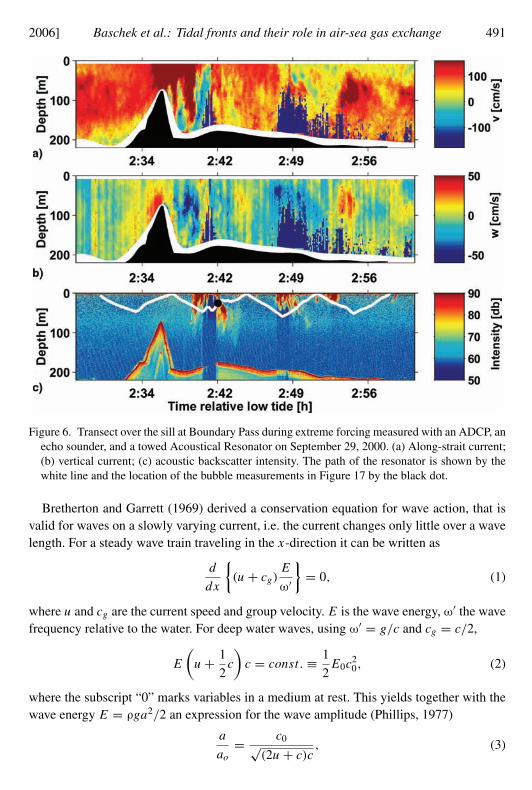
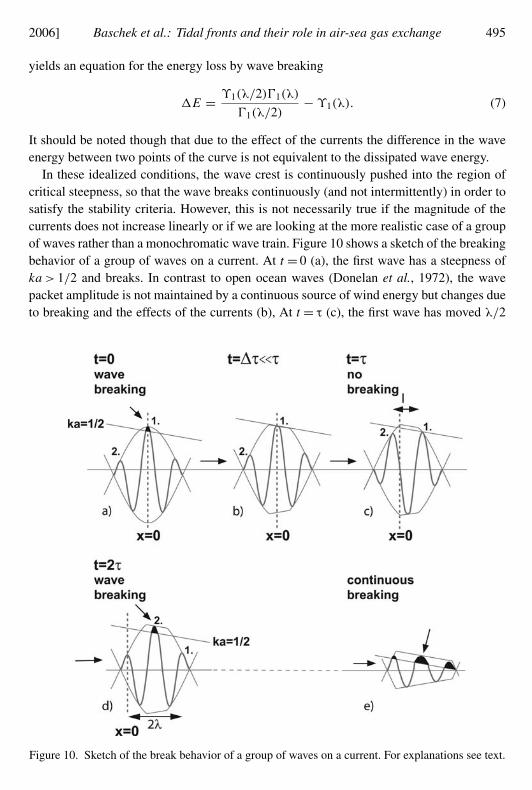
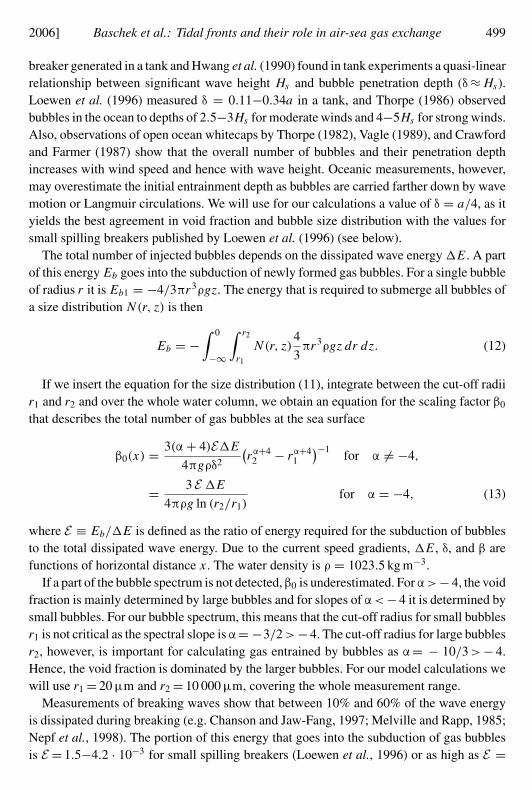
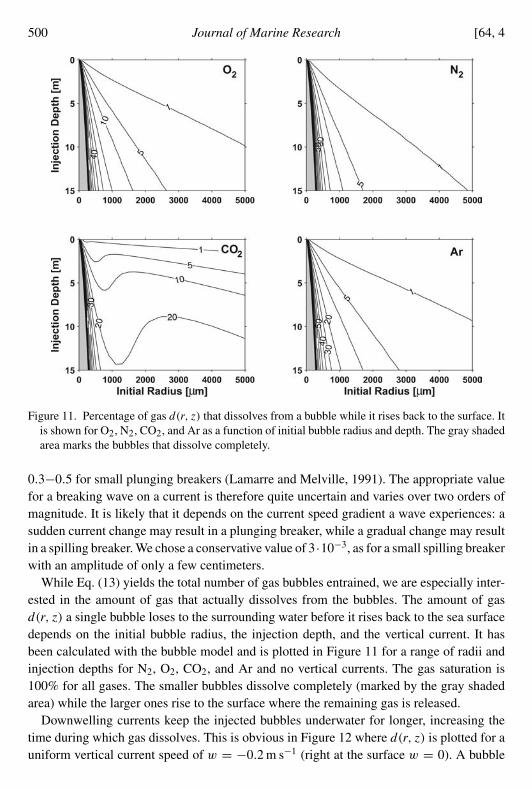
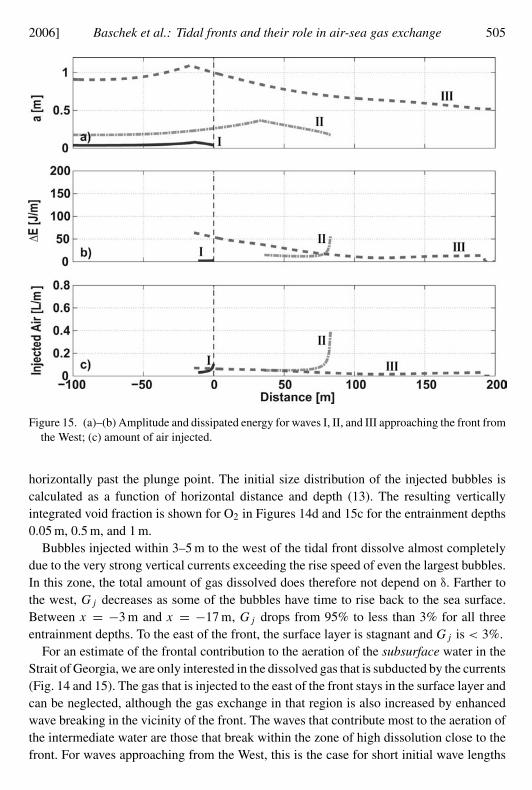
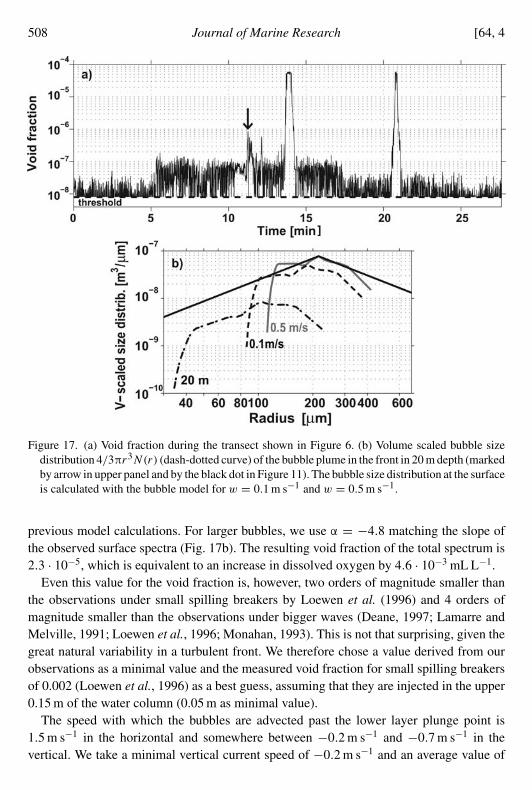
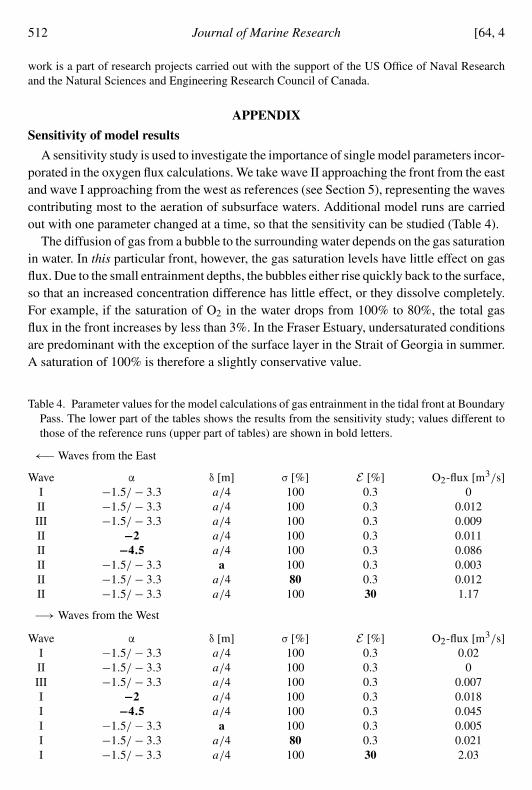