
Tidal Datum Computation January 8, 2009 Center for Operational Oceanographic Products and Services.
NOAA Technical Memorandum OAR PMEL-122
Tidal Datum Distributions in Puget Sound,
Washington, Based on a Tidal Model
H.O. Mofjeld1, A.J. Venturato2, V.V. Titov2, F.I. Gonzalez1, J.C. Newman2
1Pacific Marine Environmental Laboratory7600 Sand Point Way NESeattle, WA 98115
2Joint Institute for the Study of the Atmosphere and Ocean (JISAO)University of WashingtonBox 351640Seattle, WA 98195
November 2002
Contribution 2533 from NOAA/Pacific Marine Environmental Laboratory

NOTICE
Mention of a commercial company or product does not constitute an endorsement byNOAA/OAR. Use of information from this publication concerning proprietary productsor the tests of such products for publicity or advertising purposes is not authorized.
Contribution No. 2533 from NOAA/Pacific Marine Environmental Laboratory
For sale by the National Technical Information Service, 5285 Port Royal RoadSpringfield, VA 22161
ii

Contents iii
Contents
1. Introduction . . . . . . . . . . . . . . . . . . . . . . . . . . . . 12. Harmonic Constant Datum Method . . . . . . . . . . . . . . 53. Puget Sound Channel Tide Model . . . . . . . . . . . . . . . 6
3.1 Description of the channel tide model . . . . . . . . . . . . . 63.2 Adjustments for computing the tidal datums . . . . . . . . . 7
4. Computational Procedures . . . . . . . . . . . . . . . . . . . 145. Results and Products . . . . . . . . . . . . . . . . . . . . . . . 15
5.1 Spatial distributions of the model datums . . . . . . . . . . . 155.2 Comparison of model and observed datums . . . . . . . . . . 155.3 Geodetic datums . . . . . . . . . . . . . . . . . . . . . . . . . 165.4 Available products . . . . . . . . . . . . . . . . . . . . . . . . 16
6. Discussion . . . . . . . . . . . . . . . . . . . . . . . . . . . . . 297. Summary . . . . . . . . . . . . . . . . . . . . . . . . . . . . . . 298. Acknowledgments . . . . . . . . . . . . . . . . . . . . . . . . . 309. Appendix: Tidal harmonic constants in Puget Sound . . . 3010. References . . . . . . . . . . . . . . . . . . . . . . . . . . . . . 35
List of Figures
1.1 Bathymetric map of Puget Sound showing major basins and channels,cities, and NOAA tide stations. . . . . . . . . . . . . . . . . . . . . . 3
1.2 Official tidal datums and sample observations of water at the 9447130Seattle tide gage (47◦ 36.3′N 122◦ 20.3′W), relative to MLLW. . . . 4
3.1a Map of Admiralty Inlet showing segments from the Puget Soundchannel tide model (Lavelle et al., 1988). . . . . . . . . . . . . . . . . 8
3.1b Map of Whidbey Basin showing segments from the Puget Soundchannel tide model (Lavelle et al., 1988). . . . . . . . . . . . . . . . . 9
3.1c Map of Hood Canal showing segments from the Puget Sound channeltide model (Lavelle et al., 1988). . . . . . . . . . . . . . . . . . . . . 10
3.1d Map of the Main Basin showing segments from the Puget Soundchannel tide model (Lavelle et al., 1988). . . . . . . . . . . . . . . . . 11
3.1e Map of the South Sound showing segments from the Puget Soundchannel tide model (Lavelle et al., 1988). . . . . . . . . . . . . . . . . 12
5.1 Map of Puget Sound showing sections along which profiles of har-monic constants and tidal datums will be shown. . . . . . . . . . . . 17
5.2 Profiles of tidal datums, relative to MSL, down the main axis of PugetSound. . . . . . . . . . . . . . . . . . . . . . . . . . . . . . . . . . . . 18
5.3 Profiles of MHW relative to MLLW the main axis of Puget Sound,Whidbey Basin and Hood Canal. . . . . . . . . . . . . . . . . . . . . 19
5.4a Map of mean high water (MHW) relative to MLLW in Admiralty Inlet. 205.4b Map of mean high water (MHW) relative to MLLW in Whidbey Basin. 215.4c Map of mean high water (MHW) relative to MLLW in Hood Canal. 225.4d Map of mean high water (MHW) relative to MLLW in the Main Basin. 235.4e Map of mean high water (MHW) relative to MLLW in the South
Sound. . . . . . . . . . . . . . . . . . . . . . . . . . . . . . . . . . . . 24A.1 Profiles of O1, K1, M2 and M4 tidal amplitudes down the main axis
of Puget Sound. . . . . . . . . . . . . . . . . . . . . . . . . . . . . . . 32
iv Contents
A.2 Profiles of O1, K1, M2 and M4 tidal phase lags down the main axisof Puget Sound. . . . . . . . . . . . . . . . . . . . . . . . . . . . . . . 32
List of Tables
3.1 Indices of channel segments and junctions of the Puget Sound channeltide model. . . . . . . . . . . . . . . . . . . . . . . . . . . . . . . . . 13
5.1 Model datum levels at the ends of major sections of Puget Sound. . 255.2 Net changes and spatial gradients of model MHW. . . . . . . . . . . 265.3 Ratio (%) of model MSL relative to MLLW. . . . . . . . . . . . . . . 265.4 Differences (cm) between model and observed datums. . . . . . . . . 275.5 Observed heights of tidal datums and the geodetic datums NAVD29
and NAVD88. . . . . . . . . . . . . . . . . . . . . . . . . . . . . . . . 28A.1 Observed tidal harmonic constants in Puget Sound. . . . . . . . . . . 33A.2 Percentage changes in the observed amplitudes H relative to the cor-
responding values at Port Townsend. . . . . . . . . . . . . . . . . . . 33A.3 Differences in the observed phase lags G relative to the corresponding
values at Port Townsend. . . . . . . . . . . . . . . . . . . . . . . . . 34A.4 Ratios of observed amplitudes H. . . . . . . . . . . . . . . . . . . . . 34A.5 Differences in the observed phase lags G relative to the corresponding
values at Port Townsend. . . . . . . . . . . . . . . . . . . . . . . . . 34
Tidal Datum Distributions in Puget Sound, Washington, Basedon a Tide Model
H.O. Mofjeld1, A.J. Venturato2, V.V. Titov2, F.I. Gonzalez1, J.C. Newman2
Abstract. To improve the spatial estimates of tidal datums in Puget Sound, Washington, theharmonic constant datum method has been applied to the harmonic constants from a channeltide model of the Sound. This was done using the FORM180 Version 1.8 program. The modeldatums, harmonic constants, and associated geospatial information are available on the websitewww.pmel.noaa.gov/tsunami/TIME/. Focusing on mean high water (MHW) relative to mean lowerlow water, it increases in height from 2.16 m at Port Townsend to 4.10 m at Olympia and 4.17 mat the head of Oakland Bay. Larger increases per km occur in Admiralty Inlet (1.66 cm/km) andthe Tacoma Narrows (2.92 cm/km); smaller gradients occur in the Main Basin (0.44 cm/km) andSouth Sound (0.70 cm/km). The model MHW in Hood Canal closely follows MHW along the mainaxis with distance away from the main entrance to the Sound, to a maximum of 3.23 m at the headof Lynch Cove. This is also true for MHW in Whidbey Basin, except for a maximum of 3.17 m insouthern Skagit Bay before decreasing northward toward Deception Pass. The model datums rela-tive to MLLW tend to be slightly less than values derived from tide gage observations. For MHW,an average deviation of −3.6 cm occurs in the Main Basin, with smaller deviations in AdmiraltyInlet (−1.1 cm) and the South Sound (−1.8 cm) and larger ones in Whidbey Basin (−7.8 cm) andHood Canal (−8.5 cm). Further improvements to the datums should include adjusting the modeldatums to tide gage observations and applying high-resolution models to high-current areas andlarge tideflats.
1. Introduction
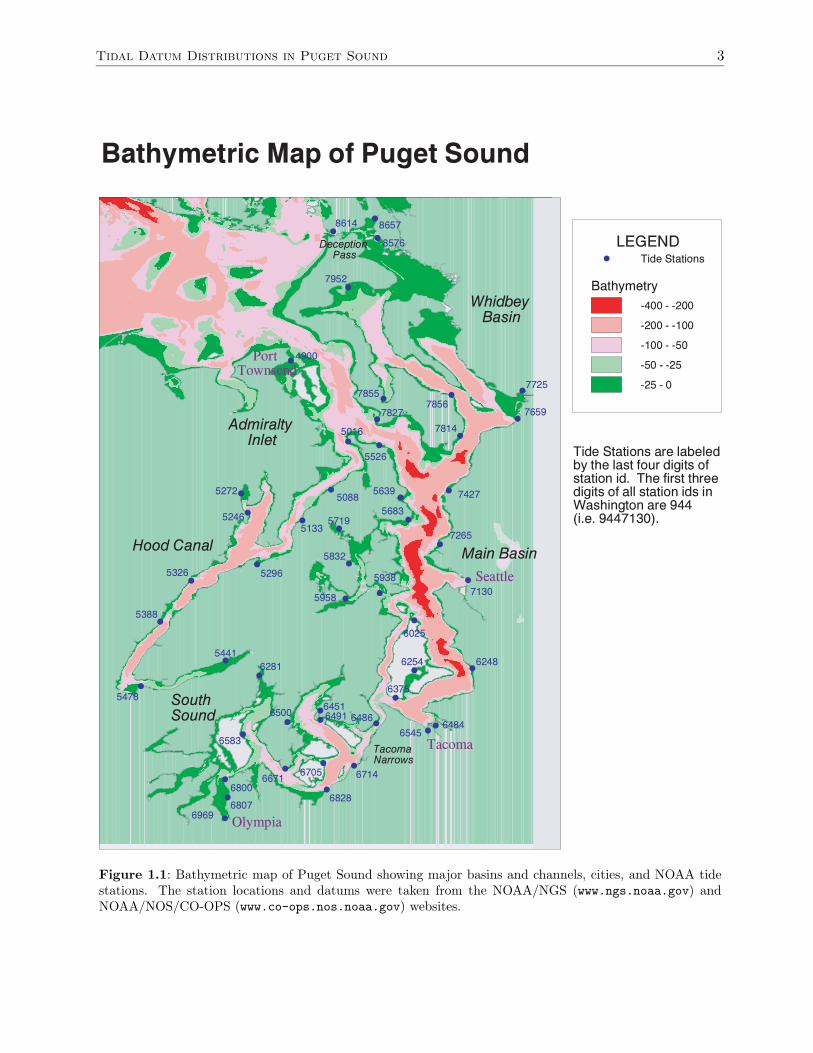
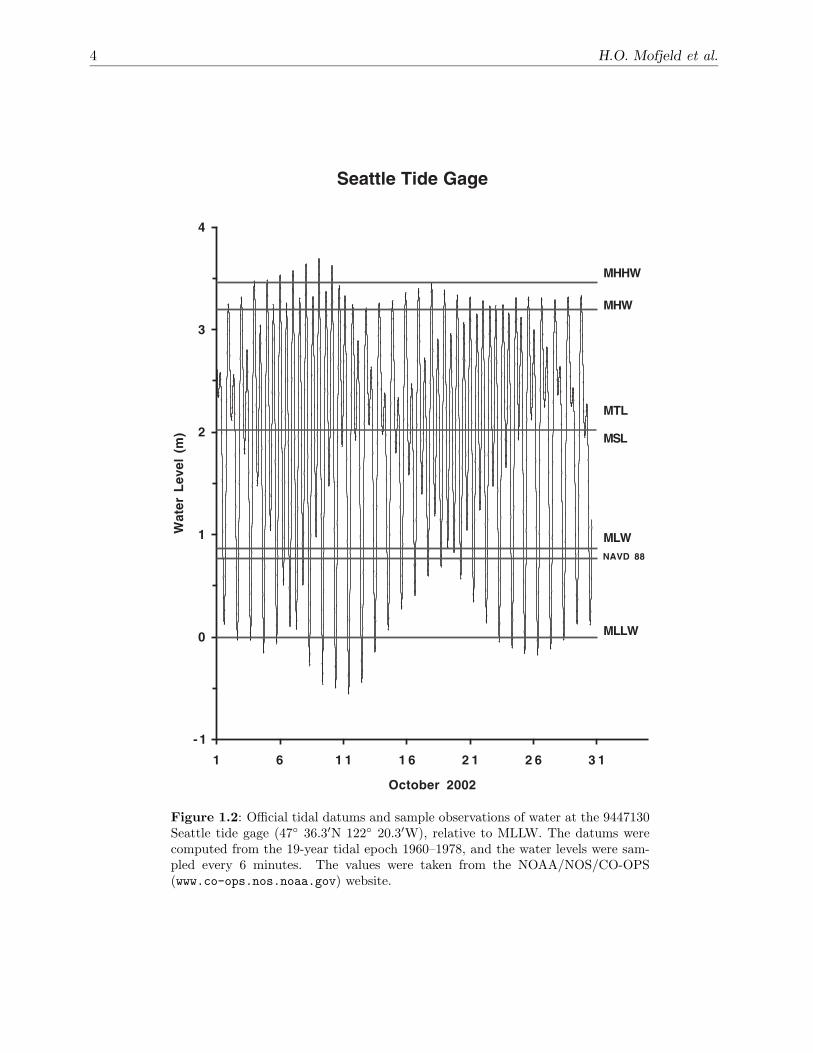
This technical memorandum focuses on improving the estimates of tidal da-tums in Puget Sound, Washington. It is part of a project undertaken by theNOAA/Center for Tsunami Inundation Modeling Efforts (TIME) in sup-port of Washington State’s ongoing tsunami mitigation program. The goalof the project is to map potential tsunami inundation in and near commu-nities bordering the Sound. The tsunami inundation maps are created fromthe results of numerical models that simulate the behavior of real tsunamis.Essential to the accuracy of these simulations are high-resolution digital ele-vation models (DEMs) that approximate the water depths and coastal landelevations over which the tsunami waves propagate. The DEMs are formedby merging high-resolution grids of depth and elevation. Since the availableland elevations are referenced to mean high water (MHW) and the waterdepths to mean lower low water (MLLW), an accurate estimate of the differ-ence in height between these datums is required at each grid point, in orderto develop the DEM for the region of interest. Puget Sound (Fig. 1.1) isa region in which the tides, and hence the tidal datums, vary considerablywith location. Descriptions of the tides in Puget Sound have been publishedby Mofjeld and Larsen (1984) and Lavelle et al. (1988). Figure 1.2 showsan example of tides and tidal datums for the Seattle tide station, which is
1NOAA/Pacific Marine Environmental Laboratory, 7600 Sand Point Way NE, Seattle,WA 98115
2Joint Institute for the Study of the Atmosphere and Ocean (JISAO), University ofWashington, Box 351640, Seattle, WA 98195
2 H.O. Mofjeld et al.
the primary reference station for Puget Sound. A general discussion of tidaldatums is given by Marmer (1951) and NOAA/NOS (2000).
To estimate the distribution of tidal datums in the Sound, we appliedthe harmonic constant datum (HCD) method. As input to the method, weused the distribution of harmonic constants from the channel tide modelof Lavelle et al. (1988). This model divides Puget Sound into 545 segmentsthat extend across individual channels or form junctions between them. Thetidal datums, harmonic constants, and associated geospatial information areavailable on the website www.pmel.noaa.gov/tsunami/TIME/, with the un-derstanding that they are for research purposes only. A description of theNOAA/TIME Center’s activities (www.pmel.noaa.gov/tsunami/) and theU.S. National Tsunami Hazard Mitigation Program (www.pmel.noaa.gov/tsunami-hazard/) that funds this work can be found on the World WideWeb.
This memorandum is organized into the following sections: 1. Introduc-tion, 2. Harmonic Constant Datum Method, 3. Channel Tide Model, 4. Com-putational Procedures, 5. Results and Products, 6. Discussion, 7. Summary,8. Acknowledgments, 9. Appendix, and 10. References.
Tidal Datum Distributions in Puget Sound 3
Figure 1.1: Bathymetric map of Puget Sound showing major basins and channels, cities, and NOAA tidestations. The station locations and datums were taken from the NOAA/NGS (www.ngs.noaa.gov) andNOAA/NOS/CO-OPS (www.co-ops.nos.noaa.gov) websites.
4 H.O. Mofjeld et al.
Seattle Tide Gage
- 1
0
1
2
3
4
1 6 1 1 1 6 2 1 2 6 3 1
October 2002
Wat
er L
evel
(m
)
MHHW
MHW
MTL
MSL
MLWNAVD 88
MLLW
Figure 1.2: Official tidal datums and sample observations of water at the 9447130Seattle tide gage (47◦ 36.3′N 122◦ 20.3′W), relative to MLLW. The datums werecomputed from the 19-year tidal epoch 1960–1978, and the water levels were sam-pled every 6 minutes. The values were taken from the NOAA/NOS/CO-OPS(www.co-ops.nos.noaa.gov) website.
Tidal Datum Distributions in Puget Sound 5
2. Harmonic Constant Datum Method
The harmonic constant datum (HCD) method estimates the heights of tidaldatums relative to mean sea level from tidal harmonic constants (Harris,1894; C&GS, 1952; Mofjeld et al., in review). The method is based on thefact that these heights are most often controlled by the M2, K1, and O1tides, with smaller contributions from the other constituents. These threeconstituents form a fixed pattern in time, called the average tidal curve.This is because the sum of the K1 and O1 frequencies exactly equals thatof the M2 tide. Averaged over a 19-year tidal epoch, the high and lowwaters associated with the average tidal curve dominate the values of thetidal datums. The HCD method uses explicit corrections for P1, N2, S2,µ2, M4, and M6, while the effects of the other constituents are included viaempirical coefficients. The theory underlying the method is given in detailby Harris (1894) and C&GS (1952). One merit of this method is that it isvery efficient, since it does not require the generation of long time series inorder to compute tidal datums.
Developed well before the advent of computers, the HCD method wasrendered into the C&GS Form 180 to guide the calculations. Associatedwith the form are look-up tables that use various amplitude ratios and phasedifferences as input; C&GS (1952) provides listings of these tables. The formand tables have been converted into a set of Fortran subroutines. Except forits Table 17, each of the tables is replaced by an iterative process derivedfrom the original implicit formulas in C&GS (1952). The computer code hasbeen verified by comparison with the examples provided by C&GS (1952).

6 H.O. Mofjeld et al.
3. Puget Sound Channel Tide Model
3.1 Description of the channel tide model
The Puget Sound channel tide model (Lavelle et al., 1988) divides the Soundinto 545 segments (Fig. 3.1). The linearized equations of motion with fric-tion are used in finite difference form. The instantaneous water level isapproximated by its average value within a given segment, and the tidalcurrent between adjacent segments by its cross-sectional average. Assumingsinusoidal forms for time dependence, the model separately estimates thespatial distributions of the tidal and current harmonic constants for each ofthe major tidal constituents O1, P1, K1, N2, M2, and S2, as well as the M4tide.
Solving the one-dimensional equations in each of the 79 channels repre-senting Puget Sound produces two sets of conditions at the 43 junctions thatlie between three or more channels. The first set is that the instantaneouswater level is the same in a given junction as it is in the channel segmentsimmediately adjacent to it. The second is that the sum of the instantaneoustidal transport into the junction must equal the time rate of change of thewater level within the junction times its surface area. A boundary conditionof no horizontal transport is used at the heads of embayments.
All these conditions are solved simultaneously to give the spatial dis-tribution for the complex amplitudes throughout the Sound, relative to agiven constituent’s amplitude at the northern end of Admiralty Inlet andDeception Pass (Fig. 1.1). Admiralty Inlet is the main entrance by whichthe tides enter Puget Sound from the Strait of Juan de Fuca. Deception Passis a much smaller entrance at the northern end of Whidbey Basin which af-fects the local tides in the northern part of Skagit Bay. The model neglectsthe tidal exchange through Swinomish Channel, a very narrow (minimumwidth of 100 m) and shallow (navigation channel control depth of 3 m belowMLLW) that is also at the northern end of Whidbey Basin.
The tuning of the friction coefficients was done on the M2 tide. Aftersetting the friction coefficient to a uniform value, the entrance M2 harmonicconstants and the friction coefficients in the high-current channel were ad-justed to match the observed M2 harmonic constants. This was done at47 tide stations (Fig. 1.1) throughout the Sound. M2 is the largest tidalconstituent in the region and dominates the tidal currents; it therefore con-trols the frictional effects on the other constituents. Using this same distri-bution of friction coefficients, the entrance harmonic constant of the otherconstituents were then adjusted to get a best fit to their observed values atthe tide stations. The modulus of the complex amplitude is the amplitudeof the harmonic constants while its phase gives the phase lag. The detailsof the model equations, the fitting procedures, and the comparison with ob-servations are given by Lavelle et al. (1988). A brief summary of the tidaldistributions is provided in the Appendix.
Tidal Datum Distributions in Puget Sound 7
3.2 Adjustments for computing the tidal datums
Because the segment indices used by Lavelle et al. (1988) are often non-sequential within individual channels, it was necessary to develop the newindex scheme shown in Fig. 3.1 and Table 3.1. The two-digital integer indicesfor the junctions were not changed. Internally within the database, 10000 isadded to the indices (e.g., the internal index of junction 43 is 10043 and thatof the channel segment 5601 is 15601) so that the index of each junction andchannel segment has five significant figures. For efficiency of presentationand clarity of figures and tables, this prefix is left off the indices shown infigures and tables.
Since there is a close relationship between P1 and K1 (separated in fre-quency by two cycles per year), we use the following formulas to computethe P1 amplitude and phase lag based on the observed tides at Seattle
P1 = 0.303 K1 (1)
P1◦ = K1◦ − 0.128(K1◦ − O1◦) (2)
The HCD method also requires estimates of the small µ2 harmonic con-stant. For µ2, we also estimate its amplitude and phase lag on the followingrelationships at Seattle:
µ2 = 0.030 M2 (3)
µ2◦ = S2◦ − 6.309(S2◦ − M2◦) (4)
where 360◦ is added to S2◦ when S2◦<M2◦ .While the channel tide model estimates the distribution of the M4 har-
monic constants, there are significant deviations between the model andobserved M4 harmonic constants, particularly in the South Sound. For thisreason the computation of datums presented here used average observed M4values for the basins, while smooth transitions were used in the channelsconnecting these basins. The small M6 tide is assumed to have a negligibleeffect on the datums in Puget Sound, and its amplitude was set to zero inthe input to the HCD method.
8H
.O.M
ofjeld
etal.
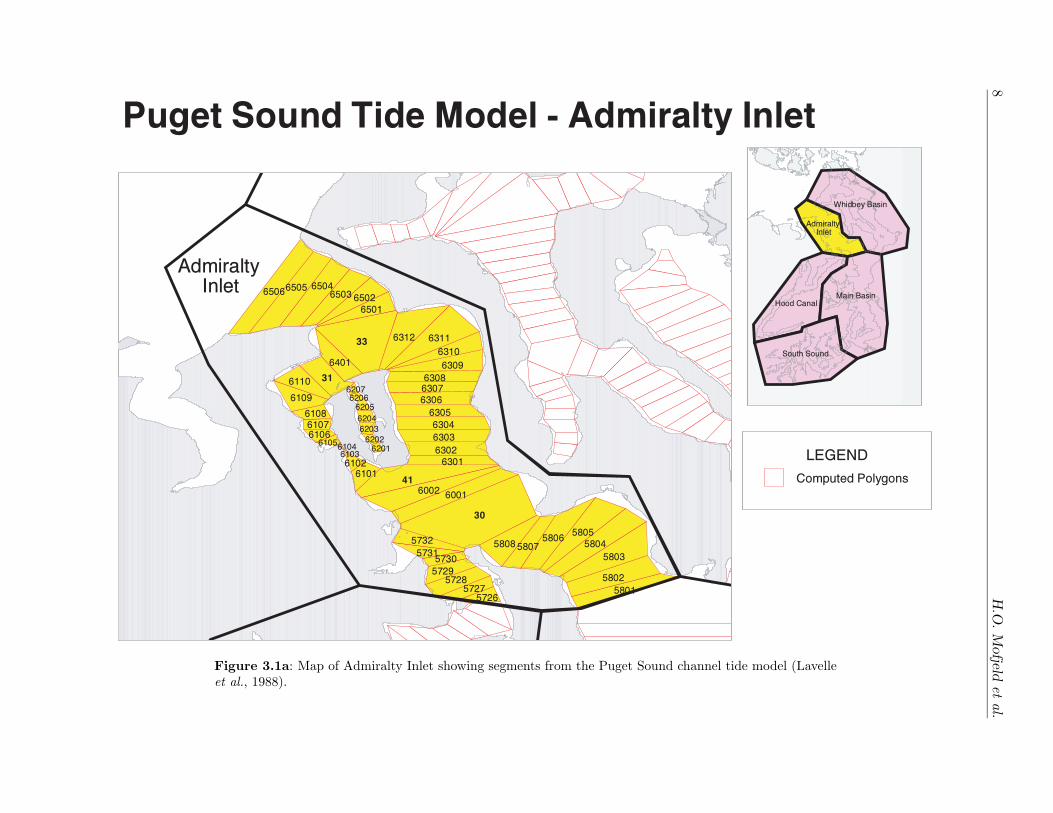
Figure 3.1a: Map of Admiralty Inlet showing segments from the Puget Sound channel tide model (Lavelleet al., 1988).

Tidal
Datum
Distributions
in
Puget
Sound
9
Figure 3.1b: Map of Whidbey Basin showing segments from the Puget Sound channel tide model (Lavelleet al., 1988).
10H
.O.M
ofjeld
etal.
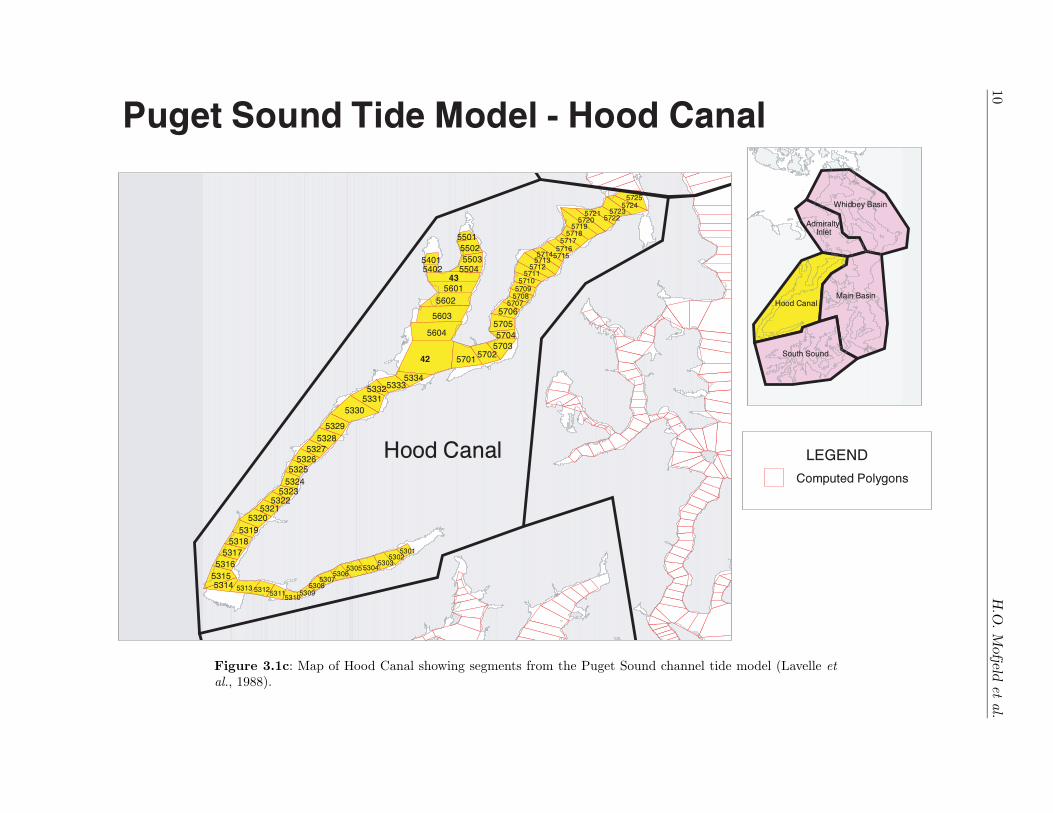
Figure 3.1c: Map of Hood Canal showing segments from the Puget Sound channel tide model (Lavelle etal., 1988).

Tidal Datum Distributions in Puget Sound 11
Figure 3.1d: Map of the Main Basin showing segments from the Puget Sound channel tide model (Lavelleet al., 1988).
12H
.O.M
ofjeld
etal.
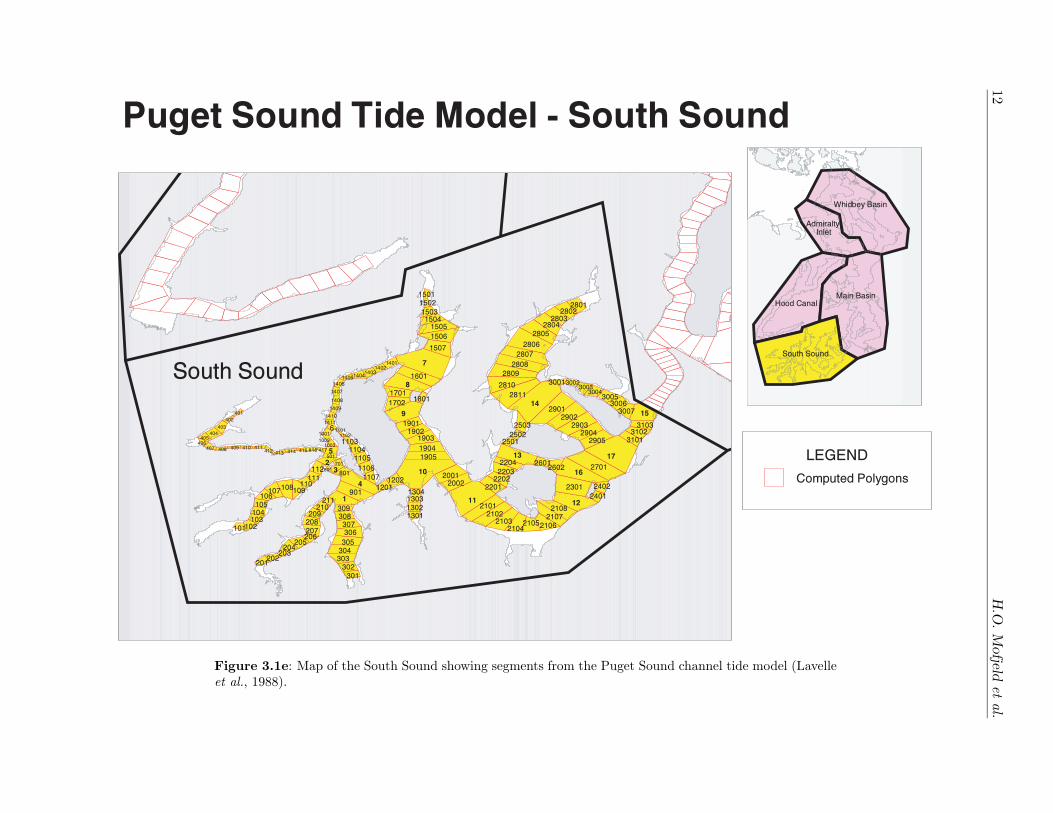
Figure 3.1e: Map of the South Sound showing segments from the Puget Sound channel tide model (Lavelleet al., 1988).

Tidal Datum Distributions in Puget Sound 13
Table 3.1: Indices of channel segments and junctions of the Puget Sound channel tide model. The indiceshave been modified from those used by Lavelle et al. (1988).
Name Channel Segments Junctions
ADMIRALTY INLETAdmiralty Inlet 6501–6506,6301–6312,6001–6002,5801–5808 33,30,41,29Port Townsend 6401,6104–6110 33,31Kilisut Harbor 6201–6207 31Oak Bay 6101–6103 41
WHIDBEY BASINDeception Pass 6801–6802 34Skagit Bay 6803–6805,6901,7001,7101–7115 34,35,32Crescent Harbor 6705–6707 32Penn Cove 6701–6704Saratoga Passage 7201–7210,7401–7411 32,24,26Holmes Harbor 7301–7308 24Possession Sound 7601,7701–7704,7801–7803,8001–8006, 5901–5905 26,27,28,25,29Port Susan 7501–7515 27Snohomish Delta 7901–7902 28
HOOD CANALHood Canal 5701–5732, 5301–5334 30,42Quilcene Bay 5401–5402 43Dabob Bay 5501–5504,5601–5604 43,42
MAIN BASINPuget Sound Main Reach 5201–5211,5101–5106,4601–4602,4501–4502, 29,39,40,38,20,36
3801–3804,3901,4001Port Madison 5005–5007 39Agate Passage 5003–5004 23Liberty Bay 4901–4906 23Port Orchard 5001–5002,4801–4808,4301–4302 23,22,21Rich Passage 4401–4405 20,22Sinclair Inlet 4101–4104 21Dyes Inlet 4201–4205Port Washington Narrows 4206–4209 21Elliott Bay 4701–4703 40Colvos Passage 3501–3518 38,19East Passage 3701–3719 37,18Quartermaster Harbor 3601–3609 18Commencement Bay 3401–3403 18Dalco Passage 3301–3302 18,19
SOUTH SOUNDThe Tacoma Narrows 3201–3216 19,15Hale Passage 3001–3007 15,14Carr Inlet 2801–2811,2901–2905 14,17Off Steilacoom 3101–3103,2301,2701 15,17,16,12Pitt Passage 2501–2503 14,13Balch Passage 2601–2602 16,13Drayton Passage 2201–2204 11,13Cormorant Passage 2401–2402 16,12Nasqually Reach 2101–2108 12,11Dana Passage 1201–1202,901 10,4,1Case Inlet 1501–1507,1601,1701–1702,1801,1901–1905,2001–2002 7,8,9,10,11Pickering Passage 1401–1411 7,6Peale Passage 1101–1107 6,4Squaxin Passage 1001–1003,501,601,701,801 5,2,3,4Oakland Bay 401–406Hammersley Inlet 407–417 5Henderson Inlet 1301–1304 10Budd Inlet 301–309 1Eld Inlet 201–211 1Totten Inlet 101–112 2
14 H.O. Mofjeld et al.
4. Computational Procedures
The FORM180 Version 1.8 program was used to compute the tidal datumsfrom the channel model harmonic constants. Since the type of tide in PugetSound is mixed semidiurnal or mixed diurnal, issues do not arise concerningthe effects of datums of spatial transitions between mixed and diurnal tides(Mofjeld et al., in review). For definiteness the logical variable ‘diurnal’ inthe program was set to .false., in principle requiring that the mixed tidalalgorithms be used exclusively.
To provide the geospatial information for the GIS database, each channelsegment and junction was considered to be a polygon object defined by itsvertices. This is consistent with the straight shorelines and cross-channelsections defining the segments and junctions. The centroids of the segmentswere also computed for plotting variations along major and side channels ofPuget Sound. All locations are in digital degrees. The tidal datums, theinput channel model harmonic constants, and the geospatial informationwere then imported into ArcView for graphical display and further analyses.
Tidal Datum Distributions in Puget Sound 15
5. Results and Products
5.1 Spatial distributions of the model datums
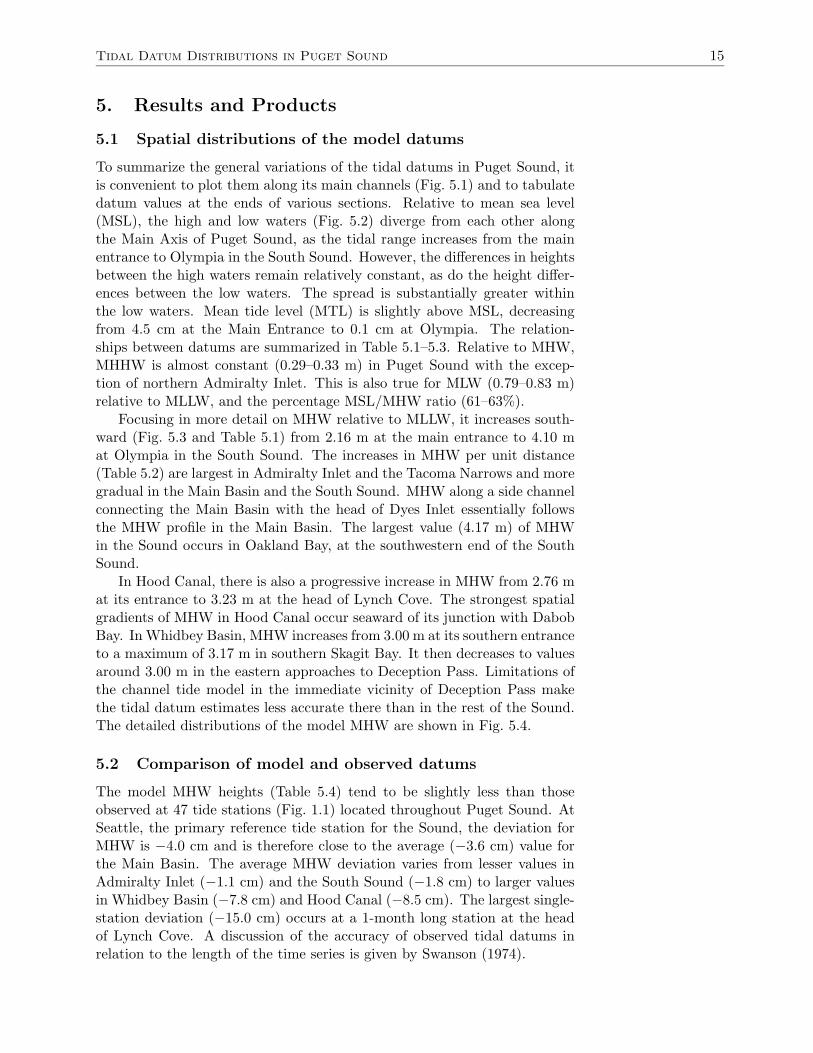
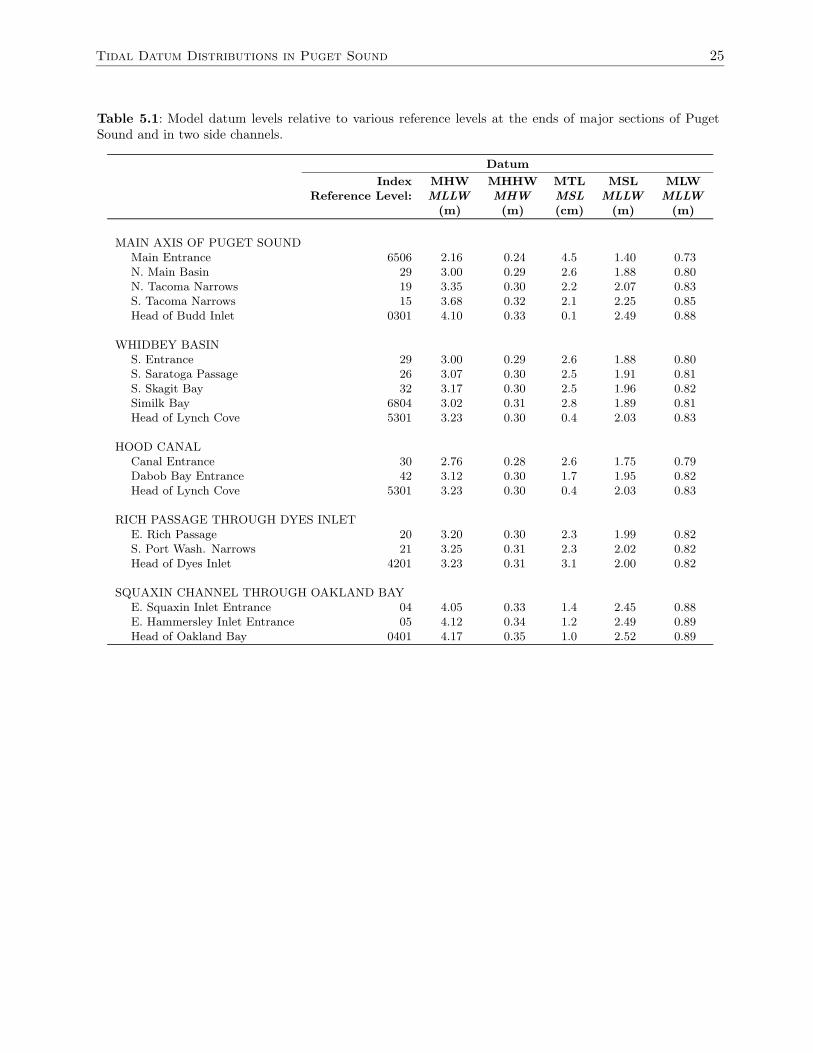
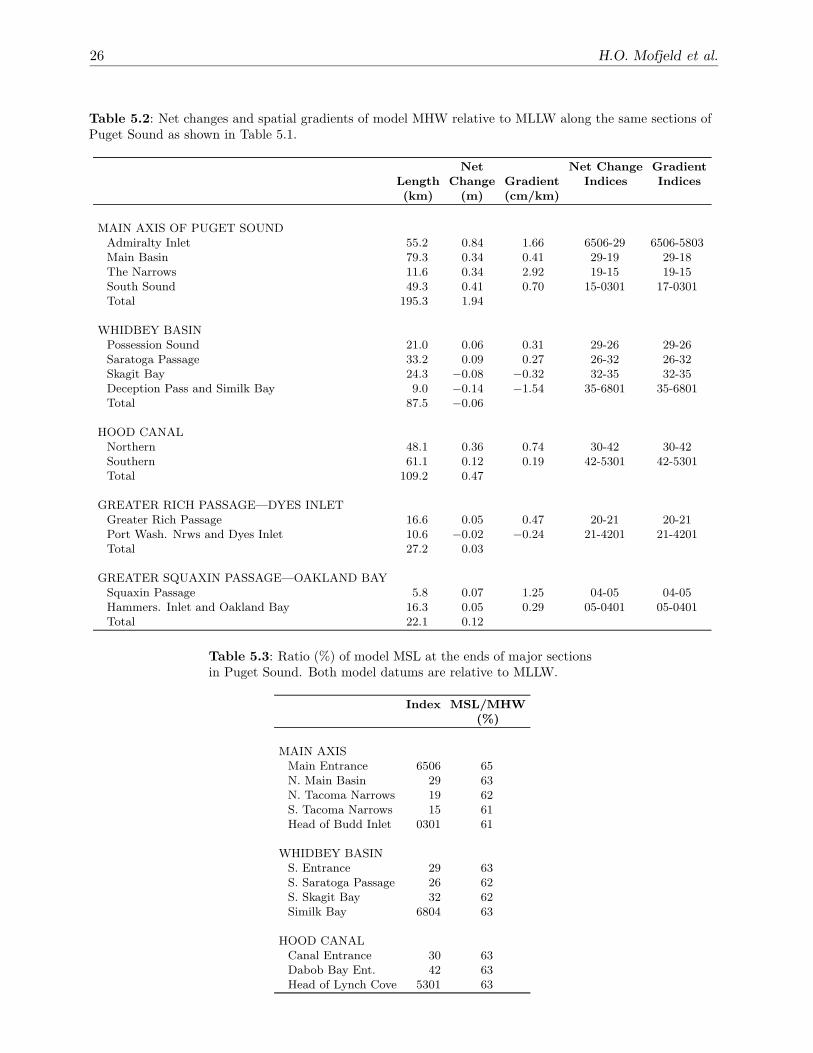
To summarize the general variations of the tidal datums in Puget Sound, itis convenient to plot them along its main channels (Fig. 5.1) and to tabulatedatum values at the ends of various sections. Relative to mean sea level(MSL), the high and low waters (Fig. 5.2) diverge from each other alongthe Main Axis of Puget Sound, as the tidal range increases from the mainentrance to Olympia in the South Sound. However, the differences in heightsbetween the high waters remain relatively constant, as do the height differ-ences between the low waters. The spread is substantially greater withinthe low waters. Mean tide level (MTL) is slightly above MSL, decreasingfrom 4.5 cm at the Main Entrance to 0.1 cm at Olympia. The relation-ships between datums are summarized in Table 5.1–5.3. Relative to MHW,MHHW is almost constant (0.29–0.33 m) in Puget Sound with the excep-tion of northern Admiralty Inlet. This is also true for MLW (0.79–0.83 m)relative to MLLW, and the percentage MSL/MHW ratio (61–63%).
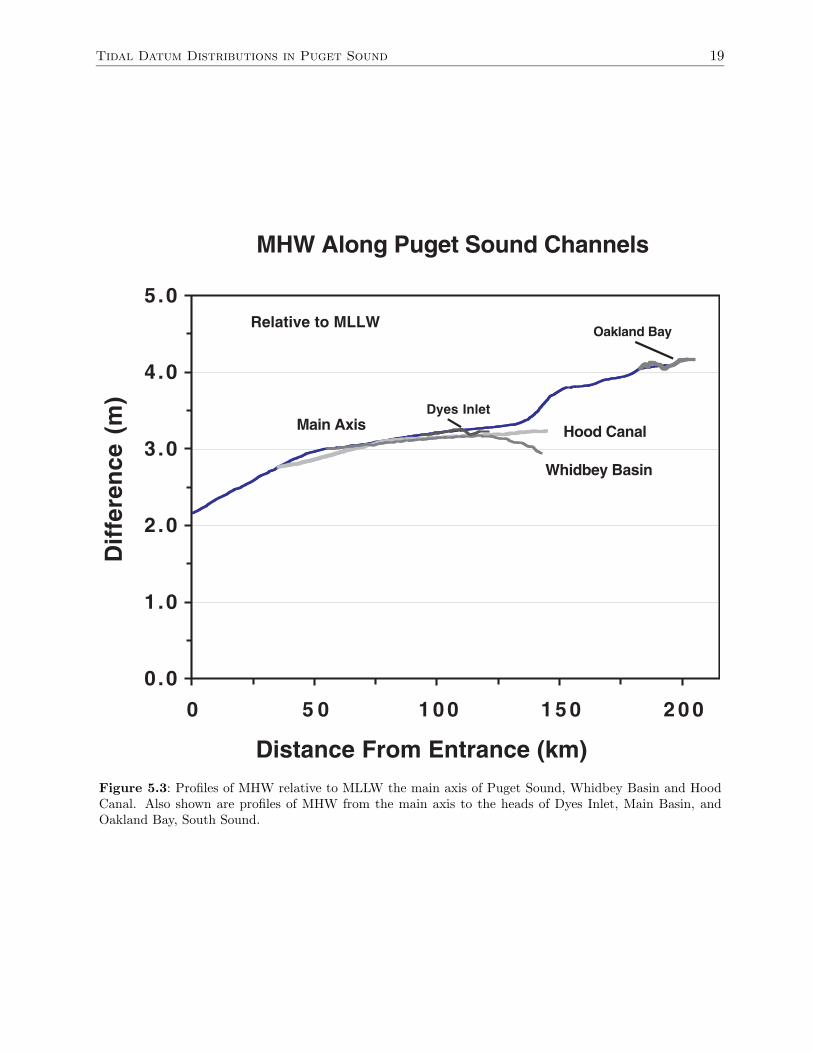
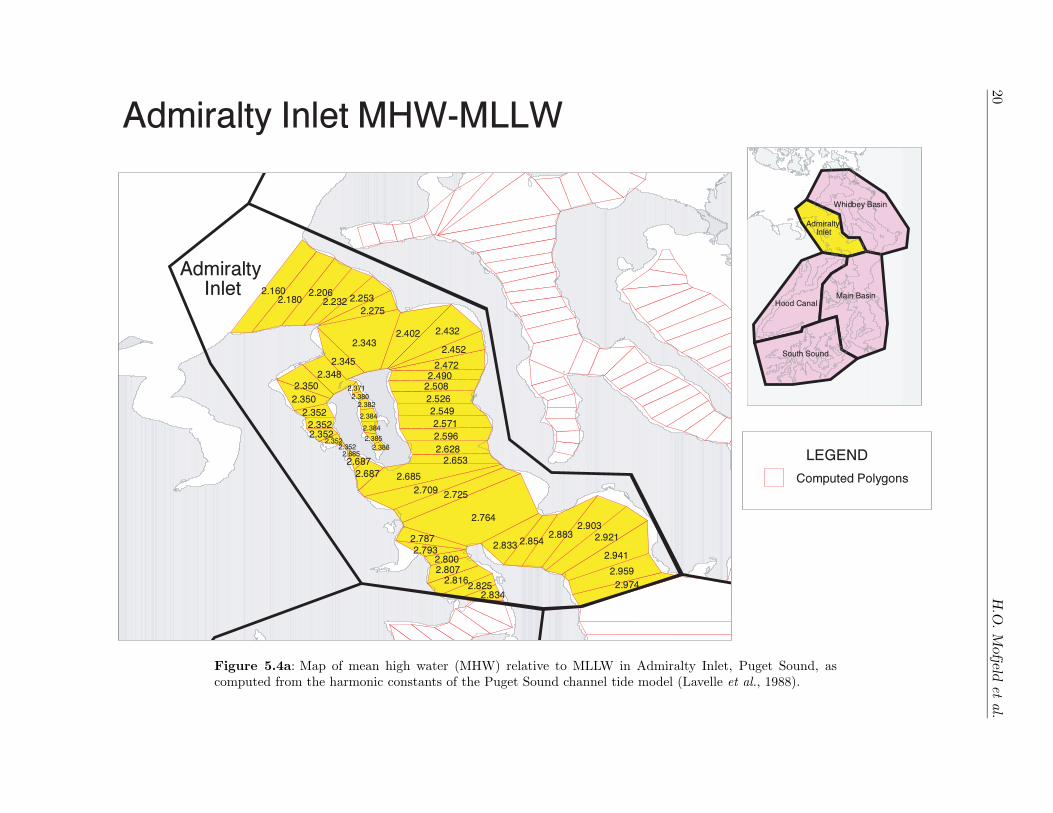
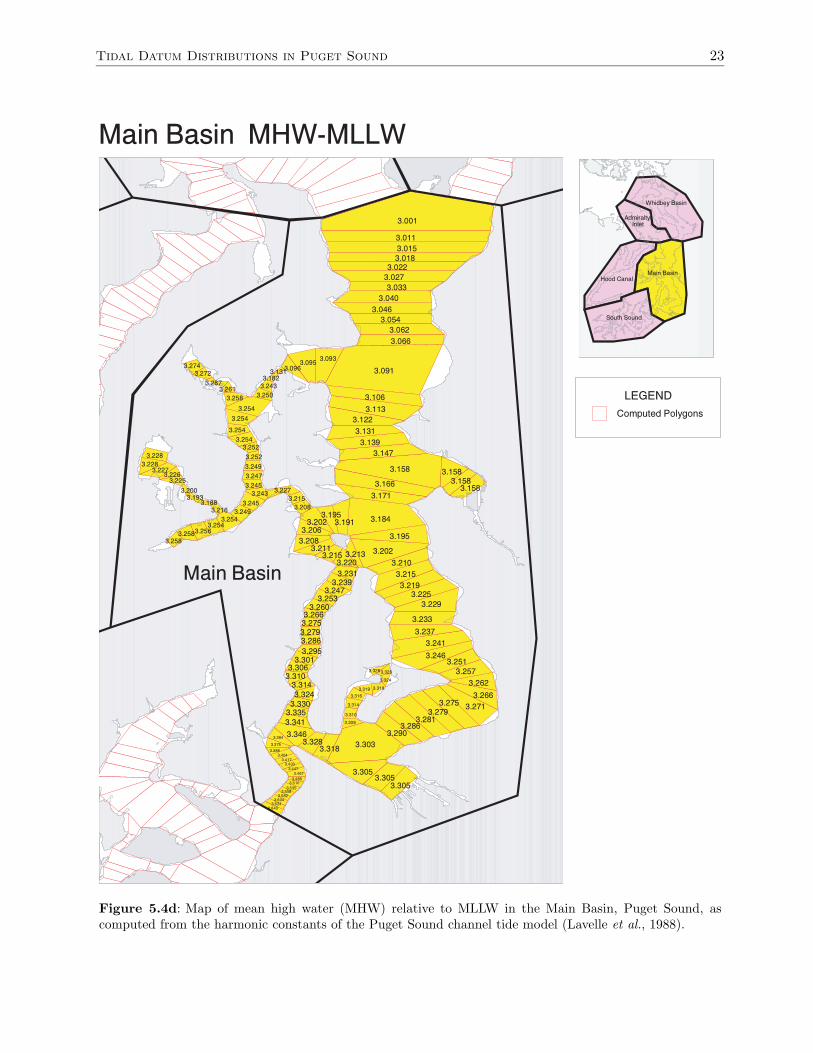
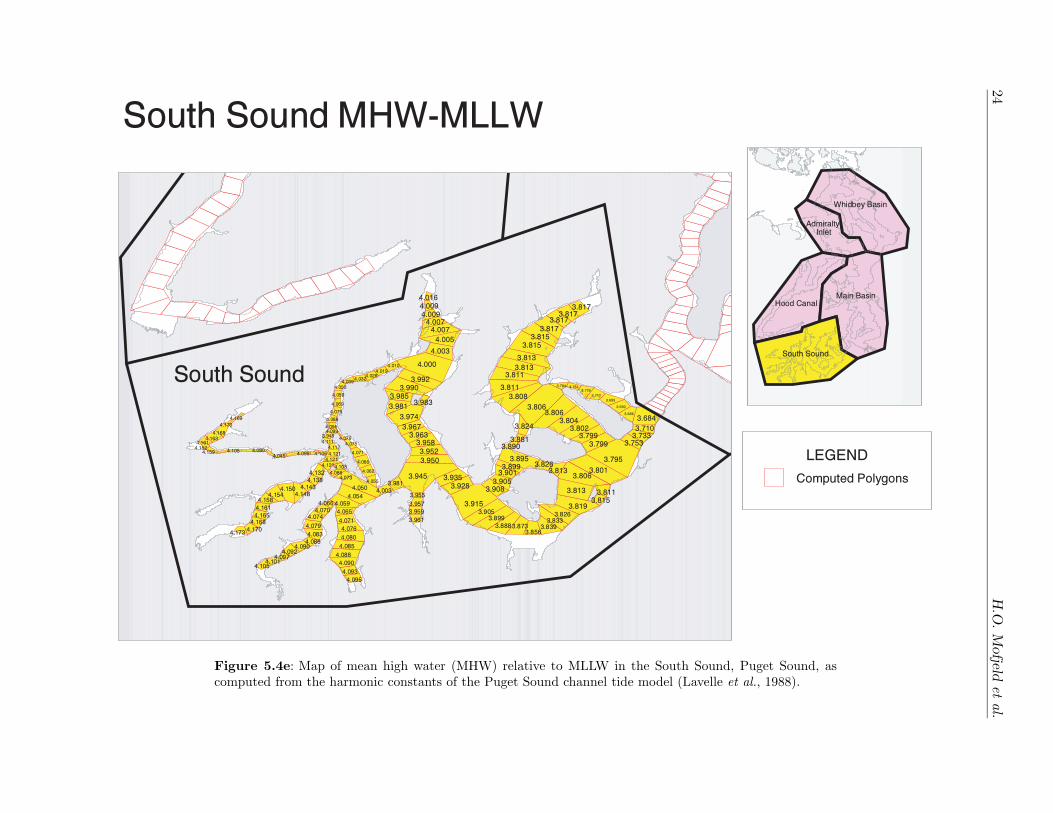
Focusing in more detail on MHW relative to MLLW, it increases south-ward (Fig. 5.3 and Table 5.1) from 2.16 m at the main entrance to 4.10 mat Olympia in the South Sound. The increases in MHW per unit distance(Table 5.2) are largest in Admiralty Inlet and the Tacoma Narrows and moregradual in the Main Basin and the South Sound. MHW along a side channelconnecting the Main Basin with the head of Dyes Inlet essentially followsthe MHW profile in the Main Basin. The largest value (4.17 m) of MHWin the Sound occurs in Oakland Bay, at the southwestern end of the SouthSound.
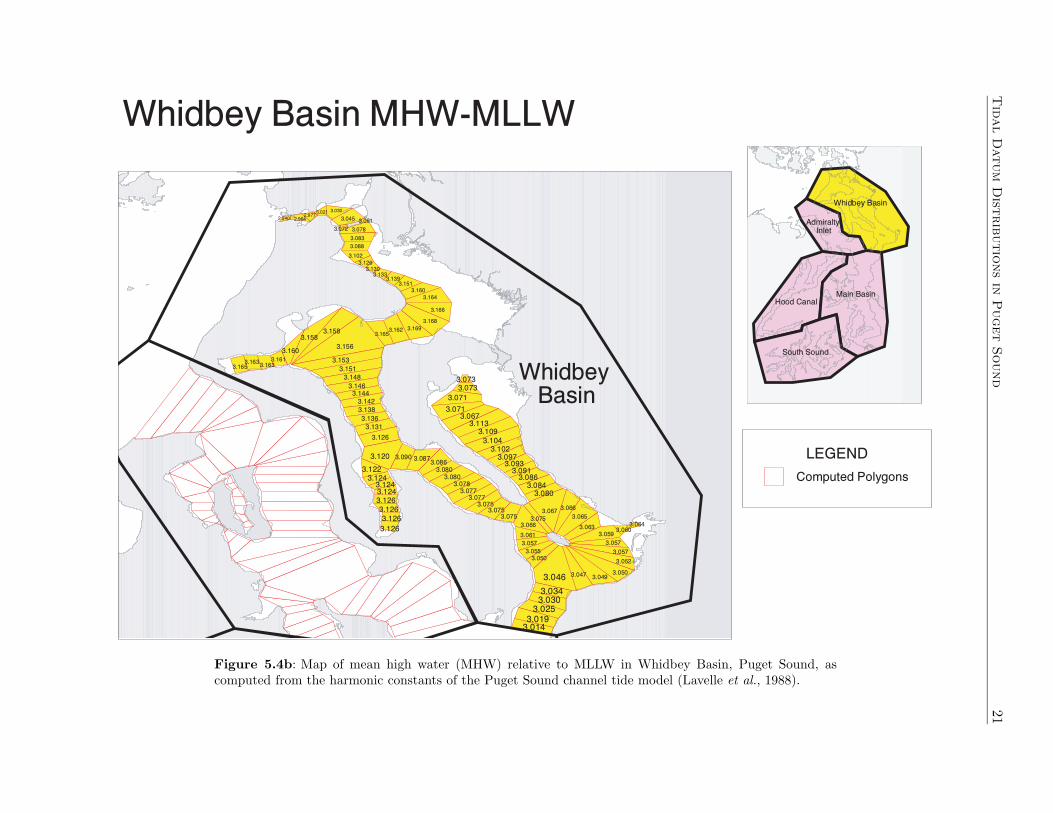
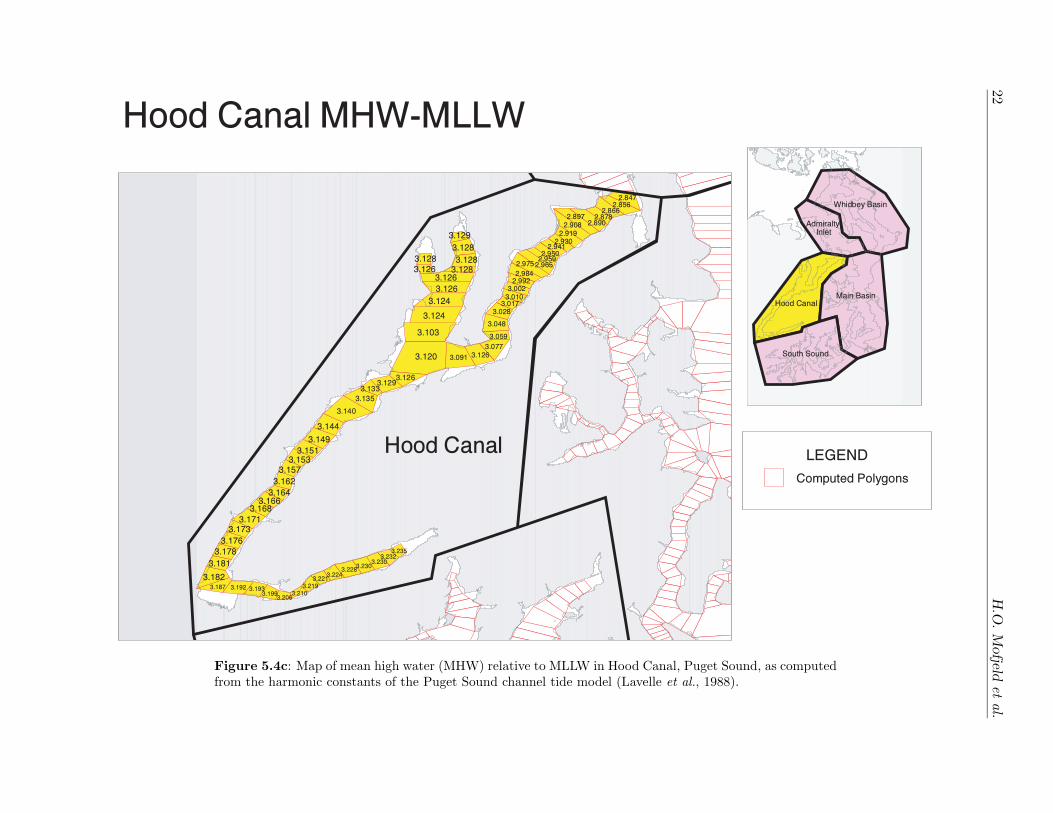
In Hood Canal, there is also a progressive increase in MHW from 2.76 mat its entrance to 3.23 m at the head of Lynch Cove. The strongest spatialgradients of MHW in Hood Canal occur seaward of its junction with DabobBay. In Whidbey Basin, MHW increases from 3.00 m at its southern entranceto a maximum of 3.17 m in southern Skagit Bay. It then decreases to valuesaround 3.00 m in the eastern approaches to Deception Pass. Limitations ofthe channel tide model in the immediate vicinity of Deception Pass makethe tidal datum estimates less accurate there than in the rest of the Sound.The detailed distributions of the model MHW are shown in Fig. 5.4.
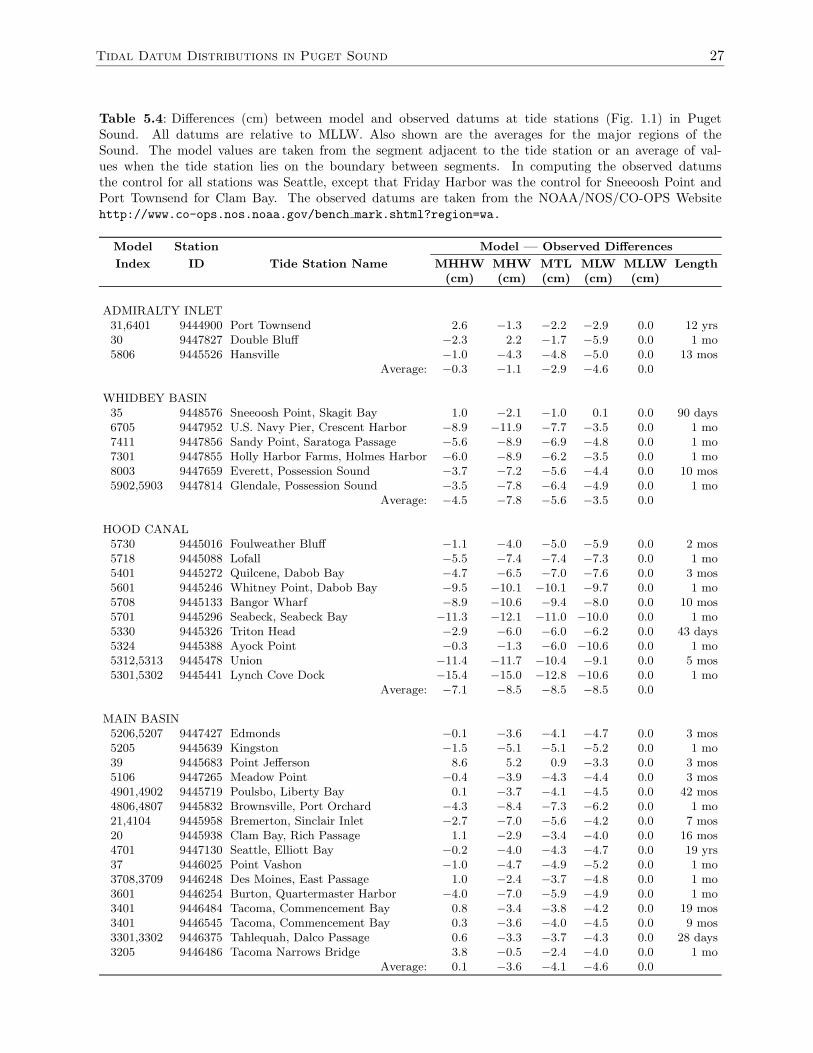
5.2 Comparison of model and observed datums
The model MHW heights (Table 5.4) tend to be slightly less than thoseobserved at 47 tide stations (Fig. 1.1) located throughout Puget Sound. AtSeattle, the primary reference tide station for the Sound, the deviation forMHW is −4.0 cm and is therefore close to the average (−3.6 cm) value forthe Main Basin. The average MHW deviation varies from lesser values inAdmiralty Inlet (−1.1 cm) and the South Sound (−1.8 cm) to larger valuesin Whidbey Basin (−7.8 cm) and Hood Canal (−8.5 cm). The largest single-station deviation (−15.0 cm) occurs at a 1-month long station at the headof Lynch Cove. A discussion of the accuracy of observed tidal datums inrelation to the length of the time series is given by Swanson (1974).
16 H.O. Mofjeld et al.
In terms of percentage deviations, the model MHW is only 0.8% smallerthan the observed value (3.20 m) at Seattle. The small size of this differenceis due to the careful tuning of the channel model and to the accuracy of theHCD method. For many purposes, the datums presented here are sufficientlyaccurate; one example is the construction of a digital elevation model for usein tsunami inundation studies. However, it should be noted that the modeldatums are unofficial products and that official datums are available fromNOAA/NGS and NOAA/NOS.
5.3 Geodetic datums
The observed NGVD29 datum (Table 5.5) varies from 10–13 cm below MTLin Hood Canal to 17–22 cm below in the other major regions. Again, north-ern Admiralty Inlet is an exception (7 cm at Port Townsend). NAVD88 is1.04–1.14 m below NGVD29 with the largest values in Whidbey Basin andnorthern Admiralty Inlet. Along the main axis of Puget Sound, NAVD88 in-creases from 0.37 m above MLLW at Port Townsend, through the Main Basin(0.70–0.90 m) and the South Sound (1.12–1.27 m) to 1.27 m at Olympia. Ithas comparable values to the Main Basin in Whidbey Basin (0.67–0.73 m)and Hood Canal (0.79–0.92 m). MSL is not reported at many of the tidegages in Table 5.5. However, the model MTL-MSL values (e.g., Table 5.1)can be used to estimate MSL relative to the NGVD29 and NAVD88.
To account for mean sea level rise and changes in the tidal regime causedby harbor development or other factors, the tidal datums are defined forparticular 19-year tidal epochs that corresponds to individual nodal cyclesof the moon’s orbit. The tidal datums reported here are for the 1960–1978epoch. For Puget Sound, the long-term trend in sea level is monitored bythe permanent tide gage at Seattle. At that gage, the rate of sea level rise(Zervas, 2001) is 2.11 ± 0.1 mm/yr for 1898–1999 and 2.26 ± 0.30 mm/yrover the recent 50-year period 1950–1999. In the near future, NOS will adopta new 1980–1998 epoch. When this occurs, the values of the geodetic datumsrelative to MLLW will change to accommodate the rise in relative MSL.
5.4 Available products
Full distributions of the tidal datums, as well as the harmonic constants, areavailable at the website www.pmel.noaa.gov/tsunami/TIME/. Also avail-able are the geospatial data for the channels and junctions. These consist ofpolygon vertices for each model segment and locations of the polygon cen-troids. All locations are in digital degrees. For convenience and portability,comma-delimited ASCII formats are used with the segment index as the firstcolumn. A metadata file accompanies each data file, describing its contents.
Tidal Datum Distributions in Puget Sound 17
Figure 5.1: Map of Puget Sound showing sections along which profiles of harmonic constants and tidaldatums will be shown.

18 H.O. Mofjeld et al.
Tidal Datums Along Main Axis of Puget Sound
-3.0
-2.0
-1.0
0.0
1.0
2.0
3.0
0 5 0 1 0 0 1 5 0 2 0 0
Distance From Entrance (km)
Hei
gh
t (m
)
MHHWMHW
MLHW
MTL
MHLW
MLW
MLLW
Relative to MSL
Figure 5.2: Profiles of tidal datums, relative to MSL, down the main axis of Puget Sound as computed fromthe harmonic constants of the Puget Sound channel tide model using the harmonic constant datum method.
Tidal Datum Distributions in Puget Sound 19
MHW Along Puget Sound Channels
0.0
1.0
2.0
3.0
4.0
5.0
0 5 0 1 0 0 1 5 0 2 0 0
Distance From Entrance (km)
Dif
fere
nce
(m
)
Main Axis Hood Canal
Whidbey Basin
Oakland Bay
Dyes Inlet
Relative to MLLW
Figure 5.3: Profiles of MHW relative to MLLW the main axis of Puget Sound, Whidbey Basin and HoodCanal. Also shown are profiles of MHW from the main axis to the heads of Dyes Inlet, Main Basin, andOakland Bay, South Sound.
20H
.O.M
ofjeld
etal.
Figure 5.4a: Map of mean high water (MHW) relative to MLLW in Admiralty Inlet, Puget Sound, ascomputed from the harmonic constants of the Puget Sound channel tide model (Lavelle et al., 1988).
Tidal
Datum
Distributions
in
Puget
Sound
21
Figure 5.4b: Map of mean high water (MHW) relative to MLLW in Whidbey Basin, Puget Sound, ascomputed from the harmonic constants of the Puget Sound channel tide model (Lavelle et al., 1988).
22H
.O.M
ofjeld
etal.
Figure 5.4c: Map of mean high water (MHW) relative to MLLW in Hood Canal, Puget Sound, as computedfrom the harmonic constants of the Puget Sound channel tide model (Lavelle et al., 1988).
Tidal Datum Distributions in Puget Sound 23
Figure 5.4d: Map of mean high water (MHW) relative to MLLW in the Main Basin, Puget Sound, ascomputed from the harmonic constants of the Puget Sound channel tide model (Lavelle et al., 1988).
24H
.O.M
ofjeld
etal.
Figure 5.4e: Map of mean high water (MHW) relative to MLLW in the South Sound, Puget Sound, ascomputed from the harmonic constants of the Puget Sound channel tide model (Lavelle et al., 1988).
Tidal Datum Distributions in Puget Sound 25
Table 5.1: Model datum levels relative to various reference levels at the ends of major sections of PugetSound and in two side channels.
Datum
Index MHW MHHW MTL MSL MLWReference Level: MLLW MHW MSL MLLW MLLW
(m) (m) (cm) (m) (m)
MAIN AXIS OF PUGET SOUNDMain Entrance 6506 2.16 0.24 4.5 1.40 0.73N. Main Basin 29 3.00 0.29 2.6 1.88 0.80N. Tacoma Narrows 19 3.35 0.30 2.2 2.07 0.83S. Tacoma Narrows 15 3.68 0.32 2.1 2.25 0.85Head of Budd Inlet 0301 4.10 0.33 0.1 2.49 0.88
WHIDBEY BASINS. Entrance 29 3.00 0.29 2.6 1.88 0.80S. Saratoga Passage 26 3.07 0.30 2.5 1.91 0.81S. Skagit Bay 32 3.17 0.30 2.5 1.96 0.82Similk Bay 6804 3.02 0.31 2.8 1.89 0.81Head of Lynch Cove 5301 3.23 0.30 0.4 2.03 0.83
HOOD CANALCanal Entrance 30 2.76 0.28 2.6 1.75 0.79Dabob Bay Entrance 42 3.12 0.30 1.7 1.95 0.82Head of Lynch Cove 5301 3.23 0.30 0.4 2.03 0.83
RICH PASSAGE THROUGH DYES INLETE. Rich Passage 20 3.20 0.30 2.3 1.99 0.82S. Port Wash. Narrows 21 3.25 0.31 2.3 2.02 0.82Head of Dyes Inlet 4201 3.23 0.31 3.1 2.00 0.82
SQUAXIN CHANNEL THROUGH OAKLAND BAYE. Squaxin Inlet Entrance 04 4.05 0.33 1.4 2.45 0.88E. Hammersley Inlet Entrance 05 4.12 0.34 1.2 2.49 0.89Head of Oakland Bay 0401 4.17 0.35 1.0 2.52 0.89
26 H.O. Mofjeld et al.
Table 5.2: Net changes and spatial gradients of model MHW relative to MLLW along the same sections ofPuget Sound as shown in Table 5.1.
Net Net Change GradientLength Change Gradient Indices Indices(km) (m) (cm/km)
MAIN AXIS OF PUGET SOUNDAdmiralty Inlet 55.2 0.84 1.66 6506-29 6506-5803Main Basin 79.3 0.34 0.41 29-19 29-18The Narrows 11.6 0.34 2.92 19-15 19-15South Sound 49.3 0.41 0.70 15-0301 17-0301Total 195.3 1.94
WHIDBEY BASINPossession Sound 21.0 0.06 0.31 29-26 29-26Saratoga Passage 33.2 0.09 0.27 26-32 26-32Skagit Bay 24.3 −0.08 −0.32 32-35 32-35Deception Pass and Similk Bay 9.0 −0.14 −1.54 35-6801 35-6801Total 87.5 −0.06
HOOD CANALNorthern 48.1 0.36 0.74 30-42 30-42Southern 61.1 0.12 0.19 42-5301 42-5301Total 109.2 0.47
GREATER RICH PASSAGE—DYES INLETGreater Rich Passage 16.6 0.05 0.47 20-21 20-21Port Wash. Nrws and Dyes Inlet 10.6 −0.02 −0.24 21-4201 21-4201Total 27.2 0.03
GREATER SQUAXIN PASSAGE—OAKLAND BAYSquaxin Passage 5.8 0.07 1.25 04-05 04-05Hammers. Inlet and Oakland Bay 16.3 0.05 0.29 05-0401 05-0401Total 22.1 0.12
Table 5.3: Ratio (%) of model MSL at the ends of major sectionsin Puget Sound. Both model datums are relative to MLLW.
Index MSL/MHW(%)
MAIN AXISMain Entrance 6506 65N. Main Basin 29 63N. Tacoma Narrows 19 62S. Tacoma Narrows 15 61Head of Budd Inlet 0301 61
WHIDBEY BASINS. Entrance 29 63S. Saratoga Passage 26 62S. Skagit Bay 32 62Similk Bay 6804 63
HOOD CANALCanal Entrance 30 63Dabob Bay Ent. 42 63Head of Lynch Cove 5301 63
Tidal Datum Distributions in Puget Sound 27
Table 5.4: Differences (cm) between model and observed datums at tide stations (Fig. 1.1) in PugetSound. All datums are relative to MLLW. Also shown are the averages for the major regions of theSound. The model values are taken from the segment adjacent to the tide station or an average of val-ues when the tide station lies on the boundary between segments. In computing the observed datumsthe control for all stations was Seattle, except that Friday Harbor was the control for Sneeoosh Point andPort Townsend for Clam Bay. The observed datums are taken from the NOAA/NOS/CO-OPS Websitehttp://www.co-ops.nos.noaa.gov/bench mark.shtml?region=wa.
Model Station Model — Observed Differences
Index ID Tide Station Name MHHW MHW MTL MLW MLLW Length(cm) (cm) (cm) (cm) (cm)
ADMIRALTY INLET31,6401 9444900 Port Townsend 2.6 −1.3 −2.2 −2.9 0.0 12 yrs30 9447827 Double Bluff −2.3 2.2 −1.7 −5.9 0.0 1 mo5806 9445526 Hansville −1.0 −4.3 −4.8 −5.0 0.0 13 mos
Average: −0.3 −1.1 −2.9 −4.6 0.0
WHIDBEY BASIN35 9448576 Sneeoosh Point, Skagit Bay 1.0 −2.1 −1.0 0.1 0.0 90 days6705 9447952 U.S. Navy Pier, Crescent Harbor −8.9 −11.9 −7.7 −3.5 0.0 1 mo7411 9447856 Sandy Point, Saratoga Passage −5.6 −8.9 −6.9 −4.8 0.0 1 mo7301 9447855 Holly Harbor Farms, Holmes Harbor −6.0 −8.9 −6.2 −3.5 0.0 1 mo8003 9447659 Everett, Possession Sound −3.7 −7.2 −5.6 −4.4 0.0 10 mos5902,5903 9447814 Glendale, Possession Sound −3.5 −7.8 −6.4 −4.9 0.0 1 mo
Average: −4.5 −7.8 −5.6 −3.5 0.0
HOOD CANAL5730 9445016 Foulweather Bluff −1.1 −4.0 −5.0 −5.9 0.0 2 mos5718 9445088 Lofall −5.5 −7.4 −7.4 −7.3 0.0 1 mo5401 9445272 Quilcene, Dabob Bay −4.7 −6.5 −7.0 −7.6 0.0 3 mos5601 9445246 Whitney Point, Dabob Bay −9.5 −10.1 −10.1 −9.7 0.0 1 mo5708 9445133 Bangor Wharf −8.9 −10.6 −9.4 −8.0 0.0 10 mos5701 9445296 Seabeck, Seabeck Bay −11.3 −12.1 −11.0 −10.0 0.0 1 mo5330 9445326 Triton Head −2.9 −6.0 −6.0 −6.2 0.0 43 days5324 9445388 Ayock Point −0.3 −1.3 −6.0 −10.6 0.0 1 mo5312,5313 9445478 Union −11.4 −11.7 −10.4 −9.1 0.0 5 mos5301,5302 9445441 Lynch Cove Dock −15.4 −15.0 −12.8 −10.6 0.0 1 mo
Average: −7.1 −8.5 −8.5 −8.5 0.0
MAIN BASIN5206,5207 9447427 Edmonds −0.1 −3.6 −4.1 −4.7 0.0 3 mos5205 9445639 Kingston −1.5 −5.1 −5.1 −5.2 0.0 1 mo39 9445683 Point Jefferson 8.6 5.2 0.9 −3.3 0.0 3 mos5106 9447265 Meadow Point −0.4 −3.9 −4.3 −4.4 0.0 3 mos4901,4902 9445719 Poulsbo, Liberty Bay 0.1 −3.7 −4.1 −4.5 0.0 42 mos4806,4807 9445832 Brownsville, Port Orchard −4.3 −8.4 −7.3 −6.2 0.0 1 mo21,4104 9445958 Bremerton, Sinclair Inlet −2.7 −7.0 −5.6 −4.2 0.0 7 mos20 9445938 Clam Bay, Rich Passage 1.1 −2.9 −3.4 −4.0 0.0 16 mos4701 9447130 Seattle, Elliott Bay −0.2 −4.0 −4.3 −4.7 0.0 19 yrs37 9446025 Point Vashon −1.0 −4.7 −4.9 −5.2 0.0 1 mo3708,3709 9446248 Des Moines, East Passage 1.0 −2.4 −3.7 −4.8 0.0 1 mo3601 9446254 Burton, Quartermaster Harbor −4.0 −7.0 −5.9 −4.9 0.0 1 mo3401 9446484 Tacoma, Commencement Bay 0.8 −3.4 −3.8 −4.2 0.0 19 mos3401 9446545 Tacoma, Commencement Bay 0.3 −3.6 −4.0 −4.5 0.0 9 mos3301,3302 9446375 Tahlequah, Dalco Passage 0.6 −3.3 −3.7 −4.3 0.0 28 days3205 9446486 Tacoma Narrows Bridge 3.8 −0.5 −2.4 −4.0 0.0 1 mo
Average: 0.1 −3.6 −4.1 −4.6 0.0
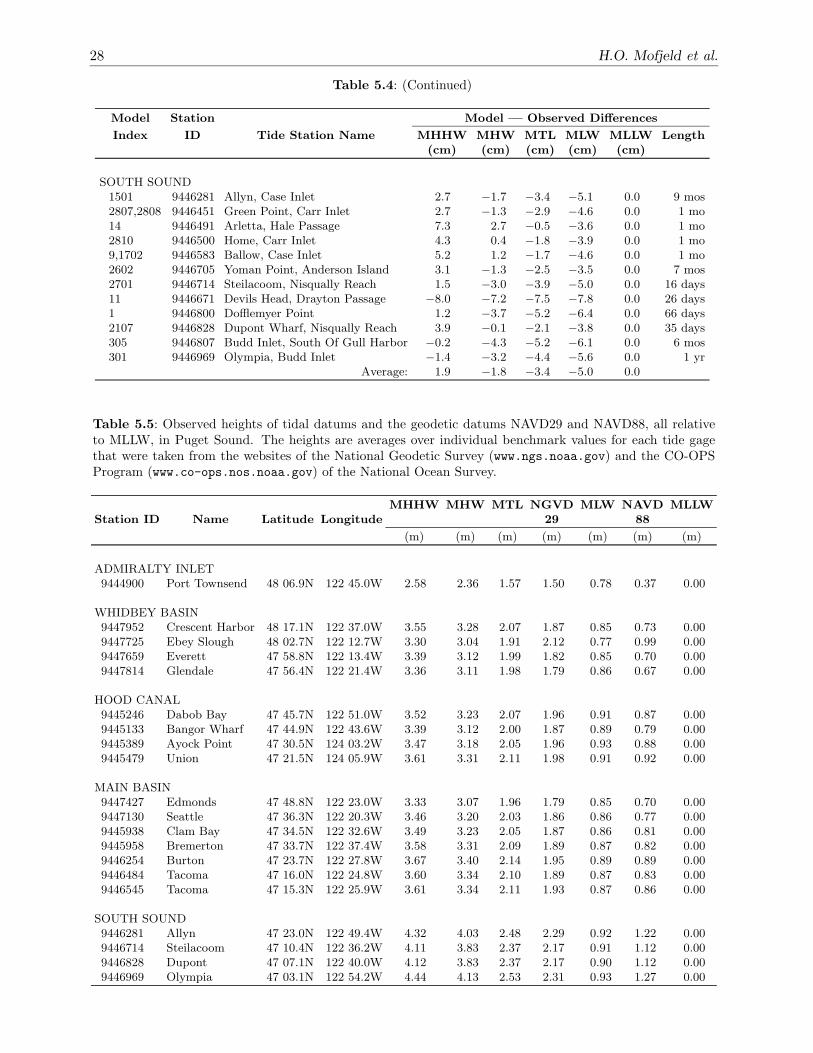
28 H.O. Mofjeld et al.
Table 5.4: (Continued)
Model Station Model — Observed Differences
Index ID Tide Station Name MHHW MHW MTL MLW MLLW Length(cm) (cm) (cm) (cm) (cm)
SOUTH SOUND1501 9446281 Allyn, Case Inlet 2.7 −1.7 −3.4 −5.1 0.0 9 mos2807,2808 9446451 Green Point, Carr Inlet 2.7 −1.3 −2.9 −4.6 0.0 1 mo14 9446491 Arletta, Hale Passage 7.3 2.7 −0.5 −3.6 0.0 1 mo2810 9446500 Home, Carr Inlet 4.3 0.4 −1.8 −3.9 0.0 1 mo9,1702 9446583 Ballow, Case Inlet 5.2 1.2 −1.7 −4.6 0.0 1 mo2602 9446705 Yoman Point, Anderson Island 3.1 −1.3 −2.5 −3.5 0.0 7 mos2701 9446714 Steilacoom, Nisqually Reach 1.5 −3.0 −3.9 −5.0 0.0 16 days11 9446671 Devils Head, Drayton Passage −8.0 −7.2 −7.5 −7.8 0.0 26 days1 9446800 Dofflemyer Point 1.2 −3.7 −5.2 −6.4 0.0 66 days2107 9446828 Dupont Wharf, Nisqually Reach 3.9 −0.1 −2.1 −3.8 0.0 35 days305 9446807 Budd Inlet, South Of Gull Harbor −0.2 −4.3 −5.2 −6.1 0.0 6 mos301 9446969 Olympia, Budd Inlet −1.4 −3.2 −4.4 −5.6 0.0 1 yr
Average: 1.9 −1.8 −3.4 −5.0 0.0
Table 5.5: Observed heights of tidal datums and the geodetic datums NAVD29 and NAVD88, all relativeto MLLW, in Puget Sound. The heights are averages over individual benchmark values for each tide gagethat were taken from the websites of the National Geodetic Survey (www.ngs.noaa.gov) and the CO-OPSProgram (www.co-ops.nos.noaa.gov) of the National Ocean Survey.
MHHW MHW MTL NGVD MLW NAVD MLLWStation ID Name Latitude Longitude 29 88
(m) (m) (m) (m) (m) (m) (m)
ADMIRALTY INLET9444900 Port Townsend 48 06.9N 122 45.0W 2.58 2.36 1.57 1.50 0.78 0.37 0.00
WHIDBEY BASIN9447952 Crescent Harbor 48 17.1N 122 37.0W 3.55 3.28 2.07 1.87 0.85 0.73 0.009447725 Ebey Slough 48 02.7N 122 12.7W 3.30 3.04 1.91 2.12 0.77 0.99 0.009447659 Everett 47 58.8N 122 13.4W 3.39 3.12 1.99 1.82 0.85 0.70 0.009447814 Glendale 47 56.4N 122 21.4W 3.36 3.11 1.98 1.79 0.86 0.67 0.00
HOOD CANAL9445246 Dabob Bay 47 45.7N 122 51.0W 3.52 3.23 2.07 1.96 0.91 0.87 0.009445133 Bangor Wharf 47 44.9N 122 43.6W 3.39 3.12 2.00 1.87 0.89 0.79 0.009445389 Ayock Point 47 30.5N 124 03.2W 3.47 3.18 2.05 1.96 0.93 0.88 0.009445479 Union 47 21.5N 124 05.9W 3.61 3.31 2.11 1.98 0.91 0.92 0.00
MAIN BASIN9447427 Edmonds 47 48.8N 122 23.0W 3.33 3.07 1.96 1.79 0.85 0.70 0.009447130 Seattle 47 36.3N 122 20.3W 3.46 3.20 2.03 1.86 0.86 0.77 0.009445938 Clam Bay 47 34.5N 122 32.6W 3.49 3.23 2.05 1.87 0.86 0.81 0.009445958 Bremerton 47 33.7N 122 37.4W 3.58 3.31 2.09 1.89 0.87 0.82 0.009446254 Burton 47 23.7N 122 27.8W 3.67 3.40 2.14 1.95 0.89 0.89 0.009446484 Tacoma 47 16.0N 122 24.8W 3.60 3.34 2.10 1.89 0.87 0.83 0.009446545 Tacoma 47 15.3N 122 25.9W 3.61 3.34 2.11 1.93 0.87 0.86 0.00
SOUTH SOUND9446281 Allyn 47 23.0N 122 49.4W 4.32 4.03 2.48 2.29 0.92 1.22 0.009446714 Steilacoom 47 10.4N 122 36.2W 4.11 3.83 2.37 2.17 0.91 1.12 0.009446828 Dupont 47 07.1N 122 40.0W 4.12 3.83 2.37 2.17 0.90 1.12 0.009446969 Olympia 47 03.1N 122 54.2W 4.44 4.13 2.53 2.31 0.93 1.27 0.00
Tidal Datum Distributions in Puget Sound 29
6. Discussion
The model tidal datums reported here come directly from the applicationof the HCD method to the harmonic constants from the channel tide modelof Lavelle et al. (1988). As such, no improvements have been made to themodel datums, e.g., by adjusting them to match the observed values. There-fore, inherent in the model datums are any limitations that exist in the HCDmethod and the channel tide model. A comparison of these with the observa-tions then provides a quantitative assessment of their effects on the datums.The comparison shows that the model datums relative to MLLW tend toslightly underestimate the observed datums, with the largest deviations inHood Canal.
The accuracy of the model datums can be improved by adjusting themto the observations using a GIS system. The result would be a set of datumdistributions that are consistent with both observations and linear tidal dy-namics. Additional modeling is also needed to resolve local tidal variationsin points of land, where high tidal currents affect the local datums, and overtidal flats that are not included in the channel tide channel.
Since the tidal datums represent 19-year averages, they do not reflectshorter-term variations in water levels. These include oceanic and meteo-rological fluctuations over synoptic to seasonal time scales. Especially highwater events occur during strong El Ninos. Mofjeld (1992) provides a de-scription of the subtidal water level fluctuations that occur in Puget Soundand the Strait of Juan de Fuca, and Wood (1976) describes extreme highand low water events that occur in response to perigean spring tides. Morecommonly, there are substantial fortnightly, monthly, and seasonal varia-tions in Puget Sound tides that are described by Mofjeld and Larsen (1984).For specific periods of time, tidal observations and predictions are availableon-line at the NOAA/NOS website www.co-ops.nos.noaa.gov.
7. Summary
The distributions of tidal datums in Puget Sound have been estimated by ap-plying the harmonic constant datum (HCD) method to harmonic constantsfrom the channel tide model of Lavelle et al. (1988). These distributionsconsist of gridded alongchannel datums at high spatial resolution, relativeto mean lower low water (MLLW). Of particular interest is mean high water(MHW), because it provides the elevation differences between the referencelevels for land elevation and water depth that are needed to construct digitalelevation models.
Focusing on the model distribution of MHW, it increases along the mainaxis of Puget Sound from 2.16 m at the north end of Admiralty Inlet to amaximum of 4.17 m at the head of Oakland Bay, a side channel in the SouthSound region. It does so in stages, with larger increases per km in AdmiraltyInlet and the Tacoma Narrows and more gradual increases through the MainBasin and the South Sound. The MHW increases with alongchannel distancein Hood Canal and Whidbey Basin closely follow the increase along the main
30 H.O. Mofjeld et al.
axis, except for a 3.17 m maximum in Whidbey Basin and a decrease towardDeception Pass.
The model datums relative to MLLW are slightly less than those esti-mated from observations at tide gages. At Seattle, the primary referencegage for the region, the model MHW is 4.0 cm less than the observed values.This is close to the average (3.6 cm) for the Main Basin. Elsewhere in theSound, the average underestimates are 1.1 cm for Admiralty Inlet, 7.8 cmfor Whidbey Basin, 8.5 cm for Hood Canal, and 1.8 cm for the South Sound.The detailed comparison for the individual tide stations and for the othertidal datums is provided in Section 5. The model datums can be improvedby adjusting their distributions to match the observed values and by doingmore detailed studies near points of land and tidal flat areas. This is left tofuture work.
8. Acknowledgments
This work was funded in part by the National Tsunami Hazard Mitigation Programto develop tsunami inundation maps for U.S. coastal communities. This publicationwas also supported by the Joint Institute for the Study of the Atmosphere andOcean (JISAO) under the NOAA Cooperative Agreement #NA67RJO155. JISAOContribution No. 959; PMEL Contribution No. 2533.
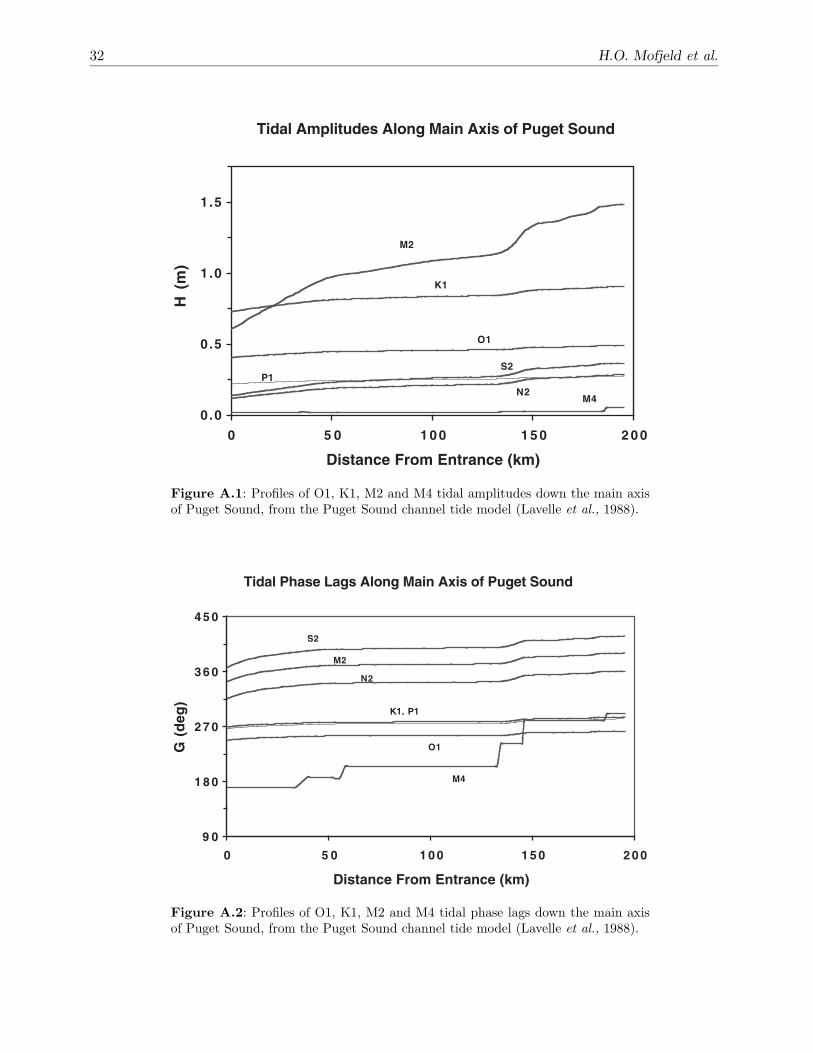
9. Appendix: Tidal harmonic constants in PugetSound
Tables A.1–A.5 give representative values of observed harmonic constantsin Puget Sound, as well as various amplitude ratios and phase differences.The channel tide model provides high-resolution profiles of the harmonicconstants (Figs. A.1–A.2) along the main axis of Puget Sound that givea general overview of how the harmonic constants vary within the Sound.There are substantial increases in the semidiurnal (M2, N2, and S2) am-plitudes and phase lags from the northward end of Admiralty Inlet to thesouthern reaches of Puget Sound. The increases are greatest in the high-current channels (Admiralty Inlet and the Tacoma Narrows) separating themajor basins of Puget Sound and less within the basins themselves.
The physical reasons for the distributions of the tides in Puget Soundare discussed by Mofjeld and Larsen (1984), Lavelle et al. (1988), and inprevious publications listed in these publications. Briefly, the semidiurnaltides form a set of partially reflecting waves in the Sound with greatestreflection between a given basin and the channel leading to the next landwardbasin. The interaction of the flow and hydraulic head through the channeland the landward basin’s storage capacity, as measured by its surface area,lead to the increases in the tidal amplitude. The phase lag is increased aswell, due to friction acting on the tidal flow. Whidbey Basin and Hood Canalact to increase the effective length of Puget Sound as seen by the tides.
In contrast, the diurnal tides (O1, P1, and K1) experience much moremodest increases (Figs. A.1–A.2 and Tables A.1–A.5) in amplitude and phase

Tidal Datum Distributions in Puget Sound 31
lag through the Sound. This is because the diurnal tides have twice theperiod of oscillation, as compared with the semidiurnal tides, and thereforehave twice the time for the exchange between basins to occur as the tiderises and falls at the entrance to Puget Sound.
32 H.O. Mofjeld et al.
Tidal Amplitudes Along Main Axis of Puget Sound
0.0
0.5
1.0
1.5
0 5 0 1 0 0 1 5 0 2 0 0
Distance From Entrance (km)
H (
m)
M2
K1
O1
P1S2
N2M4
Figure A.1: Profiles of O1, K1, M2 and M4 tidal amplitudes down the main axisof Puget Sound, from the Puget Sound channel tide model (Lavelle et al., 1988).
Tidal Phase Lags Along Main Axis of Puget Sound
9 0
1 8 0
2 7 0
3 6 0
4 5 0
0 5 0 1 0 0 1 5 0 2 0 0
Distance From Entrance (km)
G (
deg
)
S2
M2
N2
K1, P1
O1
M4
Figure A.2: Profiles of O1, K1, M2 and M4 tidal phase lags down the main axisof Puget Sound, from the Puget Sound channel tide model (Lavelle et al., 1988).
Tidal Datum Distributions in Puget Sound 33
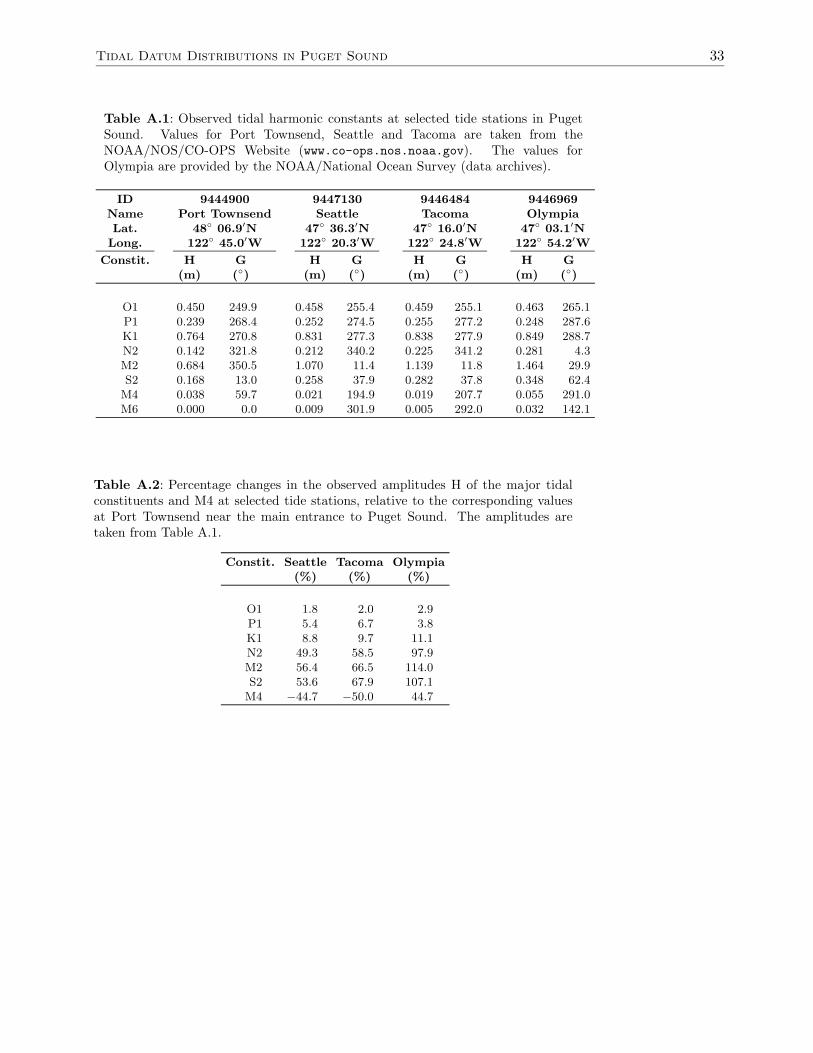
Table A.1: Observed tidal harmonic constants at selected tide stations in PugetSound. Values for Port Townsend, Seattle and Tacoma are taken from theNOAA/NOS/CO-OPS Website (www.co-ops.nos.noaa.gov). The values forOlympia are provided by the NOAA/National Ocean Survey (data archives).
ID 9444900 9447130 9446484 9446969Name Port Townsend Seattle Tacoma OlympiaLat. 48◦ 06.9′N 47◦ 36.3′N 47◦ 16.0′N 47◦ 03.1′N
Long. 122◦ 45.0′W 122◦ 20.3′W 122◦ 24.8′W 122◦ 54.2′WConstit. H G H G H G H G
(m) (◦) (m) (◦) (m) (◦) (m) (◦)
O1 0.450 249.9 0.458 255.4 0.459 255.1 0.463 265.1P1 0.239 268.4 0.252 274.5 0.255 277.2 0.248 287.6K1 0.764 270.8 0.831 277.3 0.838 277.9 0.849 288.7N2 0.142 321.8 0.212 340.2 0.225 341.2 0.281 4.3M2 0.684 350.5 1.070 11.4 1.139 11.8 1.464 29.9S2 0.168 13.0 0.258 37.9 0.282 37.8 0.348 62.4
M4 0.038 59.7 0.021 194.9 0.019 207.7 0.055 291.0M6 0.000 0.0 0.009 301.9 0.005 292.0 0.032 142.1
Table A.2: Percentage changes in the observed amplitudes H of the major tidalconstituents and M4 at selected tide stations, relative to the corresponding valuesat Port Townsend near the main entrance to Puget Sound. The amplitudes aretaken from Table A.1.
Constit. Seattle Tacoma Olympia(%) (%) (%)
O1 1.8 2.0 2.9P1 5.4 6.7 3.8K1 8.8 9.7 11.1N2 49.3 58.5 97.9M2 56.4 66.5 114.0S2 53.6 67.9 107.1
M4 −44.7 −50.0 44.7

34 H.O. Mofjeld et al.
Table A.3: Differences in the observed phase lags G of the major tidal constituentsand M4 at selected tide stations, relative to the corresponding values at PortTownsend near the main entrance to Puget Sound. The phase lags are taken fromTable A.1.
Constit. Seattle Tacoma Olympia(◦) (◦) (◦)
O1 5.5 5.2 15.2P1 6.1 8.8 19.2K1 6.5 7.1 17.9N2 18.4 19.4 42.5M2 20.9 21.3 39.4S2 24.9 24.8 49.4
M4 135.2 148.0 231.3
Table A.4: Ratios of observed amplitudes H for the major tidal constituents atselected tide stations in Puget Sound. The amplitudes are taken from Table A.1.
Port Townsend Seattle Tacoma Olympia
O1/K1 0.589 0.551 0.548 0.545P1/K1 0.313 0.303 0.304 0.292N2/M2 0.208 0.198 0.198 0.192S2/M2 0.246 0.241 0.248 0.238
Table A.5: Differences in the observed phase lags G of the major tidal constituentsat selected tide stations, relative to the corresponding values at Port Townsend nearthe main entrance to Puget Sound. The phase lags are taken from Table A.1.
Port Townsend Seattle Tacoma Olympia(◦) (◦) (◦) (◦)
K1-O1 20.9 21.9 22.8 23.6K1-P1 2.4 2.8 0.7 1.1M2-N2 28.7 31.2 30.6 25.6S2-M2 22.5 26.5 26.0 32.5
Tidal Datum Distributions in Puget Sound 35
10. References
Coast and Geodetic Survey (1952): Manual of Harmonic Constant Reductions. C.& G.S. Spec. Publ. No. 260, U.S. Gov. Printing Office, Washington, D.C.
Harris, R.A. (1894): Some connections between harmonic and nonharmonic quan-tities, including applications to the reduction and prediction of tides. Manualof Tides, Part III, Appendix No. 7.
Lavelle, J.W., H.O. Mofjeld, E. Lempriere-Doggett, G.A. Cannon, D.J. Pashin-ski, E.D. Cokelet, L. Lytle, and S. Gill (1988): A multiply-connected channelmodel of tides and tidal currents in Puget Sound, Washington and a comparisonwith updated observations. NOAA Tech. Memo. ERL PMEL-84 (PB89-162515),Seattle, 103 pp.
Marmer, H.A. (1951): Tidal Datum Planes. C. & G.S. Spec. Publ. No. 135, U.S.Gov. Printing Office, Washington, D.C.
Mofjeld, H.O. (1992): Subtidal sea level fluctuations in a large fjord system. J.Geophys. Res., 97(C12), 20,191–20,199.
Mofjeld, H.O., and L.H. Larsen (1984): Tides and tidal currents in the inland watersof Western Washington. NOAA Tech. Memo. ERL PMEL-56 (PB84-237379),Seattle, 52 pp.
Mofjeld, H.O., A.J. Venturato, F.I. Gonzalez, V.V. Titov, and J.C. Newman (inreview): The harmonic constant datum method: options for overcoming datumdiscontinuities at mixed/diurnal tidal transitions. J. Atmos. Ocean. Technol.
NOAA/NOS (2000): Tidal datums and their applications. NOAA Spe-cial Publication NOS CO-OPS 1, 134 pp. (available as a PDF file atwww.co-ops.nos.noaa.gov/pub.html).
Swanson, R.L. (1974): Variability of tidal datums and accuracy in determiningdatums from short series of observations. NOAA Tech. Rept. NOS 64.
Wood, F. (1976): Tidal Dynamics, D. Reidel, Dordrecht.Zervas, C. (2001): Sea level variations of the United States 1854–1999. NOAA Tech.
Rept. NOS CO-OPS 36.