Tick Biology and Ecology - Southern IPM Center · Personal experience with tick populations in the...
64
Tick Biology and Ecology
Transcript of Tick Biology and Ecology - Southern IPM Center · Personal experience with tick populations in the...

Tick Biology and Ecology

Outline of presentation
Overview (J Piesman)
Tularemia (L Eisen)
GIS (RJ Eisen)
Group Members: J Piesman, CDC; RJ Eisen, CDC; L Eisen, CSU; C Apperson, NC State; U Kitron, Emory; L Durden, GA Southern; D Gaines, VA Dept Hlth; G Hickling, Univ TN

From Hayes & Piesman, NEJM 2003

Amblyomma americanumExtremely dense populations in forested areas of eastern US
All 3 stages focused on deer; may feed on birds occasionally, not rodents
All three stages bite humans aggressively in the southern US
Human pathogen transmission: Ehrlichia chaffeensis(HME)
Other associated organisms of interest: Rickettsiaamblyommii, Borrelia lonestari

Dermacentor variabilis
Associated with “old field” habitat
Adult stages focused on domestic dogs (other medium sized mammals too), immatures on rodents (e.g. voles)
Only adults (males and females) feed on people
Human pathogen transmission: Rickettsia rickettsii
Other associated organisms of interest: Numerous spotted-fever rickettsia

Ixodes scapularisForested habitat throughout eastern US
Populations denser in northern US than southern US
Adults focused on deer, immatures on rodents, birds, lizards
In northern US all 3 stages bite people; in southern US mainly adults found on people
Human pathogens of interest: Borrelia burgdorferi, Anaplasmaphagocytophilum, Babesia microti (northern US only?)
Other associated organisms of interest: Borrelia miyamotoi s.l., Rickettsial symbiont, deer tick virus, Babesia odocoilei

Ambylomma americanum publications by year

Dermacentor variabilis publications by year

Ixodes scapularis publications by year

Ixodes dammini* publications by year

Personal experience with tick populations in the south (J Piesman)
4 years on faculty School of Public Health, University Alabama Birmingham (1985-1989; field work throughout state of Alabama & Land Between the Lakes, KY)
1 week collecting on barrier islands (Sapelo & St. Catherine’s) off the coast of Georgia
1 week collecting w Jerome Goddard near Jackson, MS
1 week collecting along VA-MD border w D Sonenshine
Several weeks collecting A. americanum on military facilities in Missouri (e.g. Ft. Leonardwood)

Observations on southern ticks (J Piesman)
A. americanum are all over the place
Majority of deer are infested w I. scapularis in the winter, but populations not as dense as up north
Immature I. scapularis (especially nymphs) difficult to flag from vegetation and rarely infest people
Lizards are abundant in some locations* and heavily infested w immature I. scapularis
Rodent populations are not dense, they are difficult to trap, and rarely infested with I. scapularis
Seasonal cycle of I. scapularis in south different from northern populations


Cumulative probability of infected I. scapularistransmitting B. burgdorferi for each hour attached
des Vignes et al. 2001 J Infect Dis 183: 773-778

Worst job in science: Tick collecting
Popular Science November 2004

Tick Dragger: Worst Science JobsGo to remote, densely overgrown forest. Take
out giant white corduroy sheet. Drag it behind you as you sing loudly to ward off
bears. After 20 meters, stop. Do not tarry to smack mosquitoes, for you must immediately
tweezer several hundred tiny potentially Lyme disease carrying ticks that have
covered both you and your white cloth, and drop them into a jar. Repeat 50 times a day. No this is not the instruction set for hell week
at Phi Delta Sade. It’s the protocol for a study assessing Lyme disease risk across the
eastern U.S., headed by Yale University epidemiologist Durland Fish.
From Popular Science Nov 2004

2004/2005 Sampling Sites

Density of host-seeking Ixodes scapularis nymphs (2004 – 2006)
Data by M Diuk-Wasser, Yale Univ. & Risk Map Study Group

Predicted nymphal density

Questions regarding Big 3?
A. americanum: Transmission of other agents besides HME, control for disease prevention (not as pest-TVA) practical, 4-poster?D. variabilis: RMSF increases in NC and elsewhere real? Ecology neglected? Main tularemia vector?I. scapularis: Population genetics, southern populations behavioral differences from northern populations, low infection rates w Bb due to biotic or abiotic factors?

Other ticks of interest
Amblyomma maculatum: vector of R. parkeriRhipicephalus sanguineus: Transmits R. rickettsii in AZ. Southeastern US too?Ixodes minor & Ixodes affinis: enzootic vectors of Bbsl-human risk?

Tularemia in the south-central US

Reported cases of tularemia
CDC Morbidity and Mortality Weekly Report, 8 March 2002, vol. 51 (9), p. 183.

Why care about tick-borne F. tularensis?
Francisella tularensis is a NIAID Category A Priority Pathogen
Tularemia is a potentially severe disease with 100+ cases per year in the U.S.
Novel technology (genetic techniques, GIS) can be used to pursueold poorly answered questions
There are strong indications that ticks account for most human exposure to F. tularensis in the primary U.S. tularemia focus (AR-MO)
We do not know which tick species and life stages serve as the primary vector(s) of F. tularensis to humans in the primary U.S. tularemia focus (AR-MO)

8 States with >1,000 casesTularemia cases, 1924 - 1948
Source: Jellison 1974 Monograph
8 States with > 500 cases

Annual tularemia cases in the U.S., 1944 - 2000
Source: Feldman 2003, JAVMA 222: 725-730

Change in the percentage of national tularemia cases reported by Arkansas-Missouri over time
05
101520253035404550
1924-1948
1960-1968
1970-1979
1990-2003
AR
–M
O %
of
U.S
. ca
ses
05
101520253035404550
1924-1948
1960-1968
1970-1979
1990-2003
AR
–M
O %
of
U.S
. ca
ses
Sources: Jellison 1974; Brooks and Buchanan 1970; Cox and Everett 1981; CDC 2002, 2005

Change in annual tularemia case load from 1924-48 to 2000-03 in Arkansas-Missouri vs. the rest of the U.S.
0
100
200
300
400
500
600
700
800
900
AR- MO Rest of U.S.
1924 - 19482000 - 2003
Cas
es p
er y
ear
0
100
200
300
400
500
600
700
800
900
AR- MO Rest of U.S.
1924 - 19482000 - 2003
Cas
es p
er y
ear
Sources: Jellison 1974; CDC 2002, 2003, 2004, 2005

Why has tularemia not faded away in Arkansas-Missouri?
Rabbit exposure is still common in AR-MO
AR-MO tularemia was historically associated primarily with tick-bites

Rabbit exposure still common in AR-MO?
0
1020304050607080
AR, 1978-82
Tick-biteLagomorphOther animalUnknown
% o
f cas
es
Probable source of exposure in Arkansas, 1978-82
NO
McChesney et al. 1983, J Ark Med Soc 80, 257-262

AR-MO tularemia was historically associated primarily with tick-bites?
YES
Washburn & Touhy 1949, S Med J Jan, 60-62; McChesney et al. 1983, J Ark Med Soc 80, 257-262
0102030405060708090
100
AR, 38-48
MO,47-51
CA, 27-51
IL, 1938
IN, 24-48
LA, 28-44
WI, 24-48
Tick-bite
Lagomorph
% o
f cas
es
Probable source of exposure in various States, 1924-51

Amblyommaamericanum
Ixodesscapularis
Dermacentorvariabilis

Tick infestation, Arkansas
Tick bites over 6 mo
period
Goddard 1992, Military Medicine 155, 277-280

Peak tick activity periods in relation to monthly tularemia cases, AR 1994-1998
0102030405060708090
100Ja
nFe
b M
arA
prM
ayJu
neJu
ly
Aug Se
pO
ctN
ov Dec
No.
of c
ases
Aa nymphsAa adults
Dv adults
Is adults
Various sources

Which tick species and life stages most commonly bite humans in the primary U.S. tularemia focus (AR-MO)?
Merten and Durden 2000, J Vector Ecol 25, 102-113
AR: 12 Aa (5 Ad, 5 N, 2L) 3 Dv (Ad) 5 Is (Ad)MO: 4 Aa (N) 1 Is (Ad)

Tick infection rates with Francisellatularensis from existing studies in AR-MO are curiously low
Percentage infected or minimum percentage infected (no. examined) Mixed
State Nymphs Adults stages Reference
Amblyomma americanum; 0.04% (10 / 25,000)AR 0.02 (1/5630) 0.06 (2/3300) 0.09 (7/7956) Calhoun 1955AR-MO-OK 0 (≈9000) Hopla 1953
Dermacentor variabilis; 0% (0 / 3,500)
AR 0 (2627) Calhoun 1955AR-MO-OK 0 (<1,000) Hopla 1953

Reported infection rates with Francisella tularensisof Dermacentor variabilis in AR-MO are curiously low
Percentage infected (no. examined) Mixed
State Adults stages Reference
MA 0.7 (30 / 4246) Goethert et al. 2004 (PCR)
SD >2.4 (8 / < 336 ) Markowski et al. 1985 (DFA)MT >3.6 (8 / < 225) Schmid et al. 1983 (DFA)
KT-TN 0.8 (7 / 931) Burgdorfer et al. 1974 (Stain)
SD 1.4 (8 / 575 ) Saliba 1966 (Stain)
AR 0 (2627) Calhoun 1955 (Inoculation)
NC-PA -VA 0 (536) Parker 1952 (Inoculation)
AR-MO-OK 0 (<1000) Hopla 1953 (Inoculation)
MN 0.05 (1 / 2000) Green 1931 (Inoculation)

Experimental studies of vector competency for Francisella tularensis
F. tula- Demonstration ofrensis Path. Transst. Trans-
Strain biovar acquis. passage mission Reference
Amblyomma americanumSchu (Sm) Type A + + + Hopla 1953
Dermacentor variabilis
Unknown ND + + + Philip 1934
Vavenby Type A + + + Bell 1945
Nevada 14, Schu, Vavenby Type A + + + Bell 1979
Ixodes scapularis
Schu (Sm) Type A + + + Hopla 1962
Transmission studies on Type B are entirely lacking

Key points
We do not know which tick species is the most important vector of the NIAID Priority A Pathogen Francisella tularensis in the primary U.S. tularemia focus
The roles of deer flies as vectors and various mammals as reservoirs of Francisella tularensis also remains unclear

Eisen et al. 2008. Ecoepidemiology of Tularemia in the Southcentral United States. Am J Trop Med Hyg 78(4): 586–594.

Spatial risk models as public health tools

What are spatial risk models?GIS-based statistical models predicting presence/absence, or a quantitative measure of the number of vectors or cases of disease for a particular geographical location displayed in map format.
Tick vector abundance,Mendocino Co., CA
Probability of human plague,Four Corners Region
West Nile incidence,Front Range, CO
Eisen et al. 2007 J Med Entomol 44: 530-537
Winters et al. 2008 AJTMH 78 654-665
Eisen et al. 2006AJTMH 74: 632-640

Risk models as public health tools
Targeting limited surveillance, prevention and control resources (Vector/Disease Control Programs)– Spatial targeting of:
• vaccination, drug administration, or education campaigns• use of sentinel sites to monitor vector abundance• identifying areas for most effective use of pesticides
Assessment of personal risk and need for personal protective measures (Physicians/Public)– Raising awareness of risk may lead to earlier accurate
diagnosis and treatment

Requirements for spatial models used as public health tools
High accuracy in predicting areas of elevated risk.Avoid over-estimating risk coverage.
Human plague cases by countySource: CDC website
Human plague risk modelSource: Eisen et al. 2007 J Med Entomol 44: 530-537

Risk is typically presented at the county spatial scale in the U.S.
Map from www.cdc.gov

County-scale reporting can misrepresent actual risk at the sub-county scale
Eisen and Eisen (2007) EID 13: 1816-1820
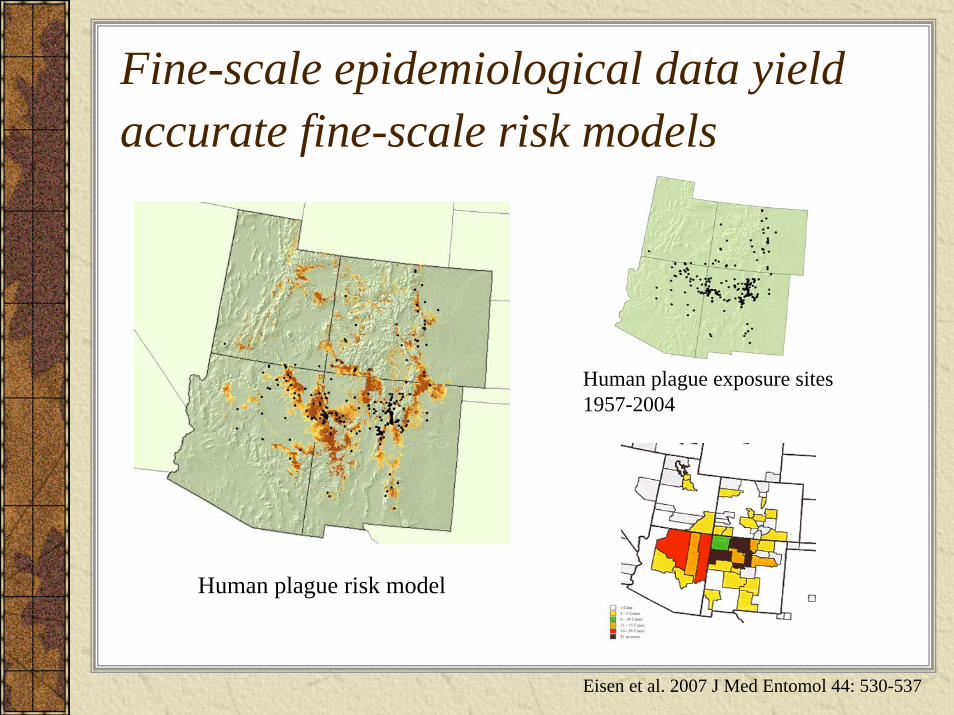
Fine-scale epidemiological data yield accurate fine-scale risk models
Human plague exposure sites1957-2004
Human plague risk model
Eisen et al. 2007 J Med Entomol 44: 530-537

Benefits of epidemiological data
A human case of a vector-borne disease unequivocally demonstrates human contact with the disease agent.
Potential to identify socio-economic risk factors, in addition to environmental predictors.

Drawbacks of epidemiological data
Some vector-borne diseases are not notifiable (e.g., babesiosis, Colorado tick fever, tick-borne relapsing fever)Case definitions and reporting practices can vary between states and over timeThere may be socio-economic differences in likelihood of seeking health care resulting in spatial disparities in disease detectionLocation of residence, rather than location of probable pathogen exposure, is often the only information available (e.g., Lyme disease, tularemia, West Nile virus disease)Cannot be used to assess risk on public lands where people do not reside, but where exposure could occur
Disease severity may be related to mode of exposure (e.g., tularemia). If transmission differs across locations leading to spatial differences in disease severity (and reporting), use of epidemiological data could be problematic.
Asymptomatic or mild infections may not be detected (e.g., West Nile virus disease)

Tularemia, and problems with epidemiological data
Exposure site data not available
Unless case files are re-examined, they likely include out-of-county exposures
Removed from the list of notifiablediseases from 1994-1999
Exposure can occur via arthropod bite, handling infected animals, ingestion of contaminated food or water
Different F. tularensis sub-types differ in pathogenicity to humans and may differ in primary transmission routes Figure 4. Counties with predicted risk of
human exposure to tularemia in Arkansas-Missouri (gray). Counties reporting cases during 1990-2003 are displayed with hatched lines.
Eisen et al. 2008 AJTMH 78: 586-594

Spatial risk models based on arthropod vector data
Distribution maps have been used commonly in medical entomology,but typically maps depict presence/absence at a large spatial scale
There is a need for fine-scale vector abundance maps because disease risk is often associated with the abundance of infected vectors
Dennis et al. 1998 J Med Entomol 35, 629-38Eisen and Lane, 2002, In Lyme borreliosis: Biology, Epidemiology and Control, CAB International, New York

Benefits of vector data
Many arthropod vectors transmit multiple human pathogens; therefore, modeling the distribution and abundance of a single vector can be used to assess potential for risk of exposure to multiple disease agents
Rocky Mountain Wood Tick
Rocky Mountain Spotted FeverColorado Tick FeverTularemia
Distribution in Larimer Co., CO
Eisen et al. 2007 J Med Entomol 44: 694-704

Benefits of vector dataFine-scale assessments of vector abundance are readily attainable by field samplingVector abundance data are unequivocally linked to a specific spatial location
Vector modeling is independent of a human population base and thus can be used to assess risk on public lands Areas with high risk of exposure
to Ixodes pacificus nymphs, CA
Eisen and Eisen 2008 J Med Entomol 45: 181-192

Prevention for recreational vs. residential riskrecreational
Avoid high-risk areas during peak vector activity periods
Education campaigns to raise awareness of vector-borne diseases
Daily tick checks
Use of repellents
Use of pesticides
Landscape modification
Removal of zoonotic hosts
Education campaigns to raise awareness of vector-borne diseases
Daily tick checks
Use of repellents
residential

Drawbacks of Vector dataCollection of field data is expensive and time-consuming
Abundance models are more informative than distribution models, both require knowledge of the distribution of the pathogen
Human behavior affects the likelihood of a person becoming infected
Some vector-borne diseases (e.g., plague, tularemia) can be transmitted by nonvector-borne routes

Modeling Lyme disease risk in California, combining epidemiological and vector data
Ixodes pacificus, the primary vector of B. burgdorferi to humans, is established in all but 3 CA counties
Most Lyme disease cases occur in the northern part of the state
Modeling of woodland habitats with growing degree-day values that fall within the range associated with high nymphal density within a single ecologically and climatically diverse CA county was useful for identifying LD risk areas at a fine spatial scale throughout the state
Dennis et al. 1998 J Med Entomol 35, 629-38 Eisen et al. 2006 AJTMH 75: 669-676

Need for spatial risk models combining epidemiological and vector data: WNV disease in CO
Projected risk of exposure toCx. tarsalis based on correlates
with environmental factors
West Nile virus disease incidence per 100,000 person-years by
census tract, 2002-2006
Risk index based oncombined vector and
human case data
CONCLUSION: The vector exposure risk model adds value to the epidemiologic risk map and vice versa.
Winters et al. 2008. Am J Trop Med Hyg 78: 654-65

Assess shared risk for diseases with similar prevention or control strategies
37% shared risk
Eisen et al. 2007 AJTMH 77: 999-1004

SummaryStrive for high accuracy but avoid over-predicting risk areasPros and cons for both epidemiological and vector dataGo beyond vector distribution to modeling abundanceNeed for improved methodologies for collection and presentation of spatial epidemiological dataCombine vector and epidemiological data provides a more completeassessment of risk than either alone
Assess shared risk of diseases with similar prevention/control strategiesModels are not end points, there should be a positive feedback between field data collection and model developmentUnderstand who the end-users will be and how they will use the models

Spatial modeling: From academic exercise to useful public health tool
Improve accuracy and precision– Temporally-dynamic modeling– Integration of transmission efficiency and infection prevalence
data for vector models
Collection and reporting of vector and epidemiological data at appropriate spatial scales Positive feedback between field-collection/surveillance and modelingAssess end-user needs and modify model and data presentation accordingly
Integration of Ecology, Epidemiology and Diagnostics

Modeling tick-borne disease risk in Missouri
Which tick species and life stages serve as primary bridging vectors to humans?
Where are humans at greatest risk of exposure to tularemia vectors?
This information is critical for effectively targeting prevention and control activities.

Vector efficiency studies
Developed a mouse model for infecting ticks with types F. tularensis types A1, A2, and B
Evaluating relative transmission efficiency of D. variabilis nymphs for A1, A2 and B

Contributors to ModelsBrad BiggerstaffRusty EnscorePaul MeadJohn MontenieriJeannine PetersenJoe PiesmanMarty SchrieferAnna Winters
Kristy Bradley, OKTed Brown, NMRudy Bueno, NMJim Cheek, IHSDave Engelthaler, AZPaul Ettestad, NMCurtis Fritz, CACraig Levy, AZJohn Pape, COPam Reynolds, NMDale Tanda, NMJoe Targhetta, NMKaren Yates, MO
CDC Public Health Partners
Barry Beaty, CSUCarol Blair, CSUGreg Glass, Johns HopkinsBob Lane, UC BerkeleySaul Lozano-Fuentes, CSUAndrew Meyer, CSUChet Moore, CSU
University Collaborators